
Abstract
Introduction
With respect to hepatic I/R injury, mounting evidence points to the early reperfusion phase as the main culprit of I/R-induced damage (32, 40), with the mitochondrial permeability transition (MPT) acting as the common denominator for necrotic and apoptotic cell death (27) and the postischemic intracellular energy status (26) and mitochondrial redox environment (46) as its pathway routers. This places the respiratory chain at the centerfold of I/R-induced hepatocellular damage by means of its mediatory role in [1] damage induction through respiratory processes [the generation of reactive oxygen and nitrogen species (ROS/RNS) during reperfusion (54)], [2] energy metabolism [ATP-dependent apoptosis vs. ATP depletion-dependent necrosis (6)], and [3] damage remediation through the provision of energy required for a myriad of anabolic recovery processes.
Innovation
Cholestasis-induced liver damage has been putatively attributed to bile salt-inflicted oxidative stress in hepatocytes and its detrimental downstream consequences. Intuitively, the exacerbation of intrahepatic oxidative stress through, for example, ischemia-reperfusion (I/R), should lead to further augmentation of oxidative stress-related parameters, including inflammation and liver damage. Contrastingly and counterintuitively, Georgiev et al. (8) reported that “cholestasis does not increase but rather dramatically protects the liver from ischemic injury and inflammation” in mice by a factor in plasma other than bilirubin. This work has shown that I/R-subjected cholestatic rat livers are not at all protected from inflammation and liver injury and suffer from considerable hepatopathology. Interestingly, the hepatopathology does not emanate from oxidative stress-related factors, as the liver possesses effective innate and acquired antioxidant machinery. Instead, the hepatopathology stems from intrahepatic perfusion defects and possibly aberrant nucleotide metabolism before and during I/R. These findings have considerable implications for liver surgery and transplantation, namely, that interventions in cholestatic livers should focus primarily on alleviation of the microcirculatory dysfunction and intracellular energy deficits rather than hepatocellular reactive oxygen species/reactive nitrogen species generation and oxidative stress.
In addition to I/R, any pathology that contributes to oxidative stress, such as extrahepatic cholestasis, a priori debilitates the liver's capacity to effectively recuperate from oxidative stress after I/R (30, 63) and thus from surgical procedures encompassing a (temporary) cessation of intrahepatic circulation. Cholestasis has been associated with an augmented generation of ROS (49) and (per)oxidation products (56), a reduced antioxidative capacity (34), increased mitochondrial dysfunction, and reduced ATP production (33, 62), and consequently parenchymal damage (20, 47). These pre-existing functional defects translate to an exacerbated damage profile in cholestatic livers during I/R (29, 30), which we hypothesize to result from excessive ROS/RNS production, mitochondrial dysfunction, and a decreased postischemic energy status and restorative capacity. This study therefore investigated the impact of I/R on cholestatic liver damage in relation to radical generation, oxidative phosphorylation, and intrahepatic bioenergetics and metabolic co-factors in cholestatic rats so as to shed light on the molecular mechanisms responsible for the post-I/R pathogenesis during cholestasis.
Results
Hepatocellular damage and stress response in native and cholestatic livers before ischemia
Histologically, the livers of sham-operated animals (Sham group) were devoid of any damage (Supplementary Fig. S1A, B; Supplementary Data are available online at
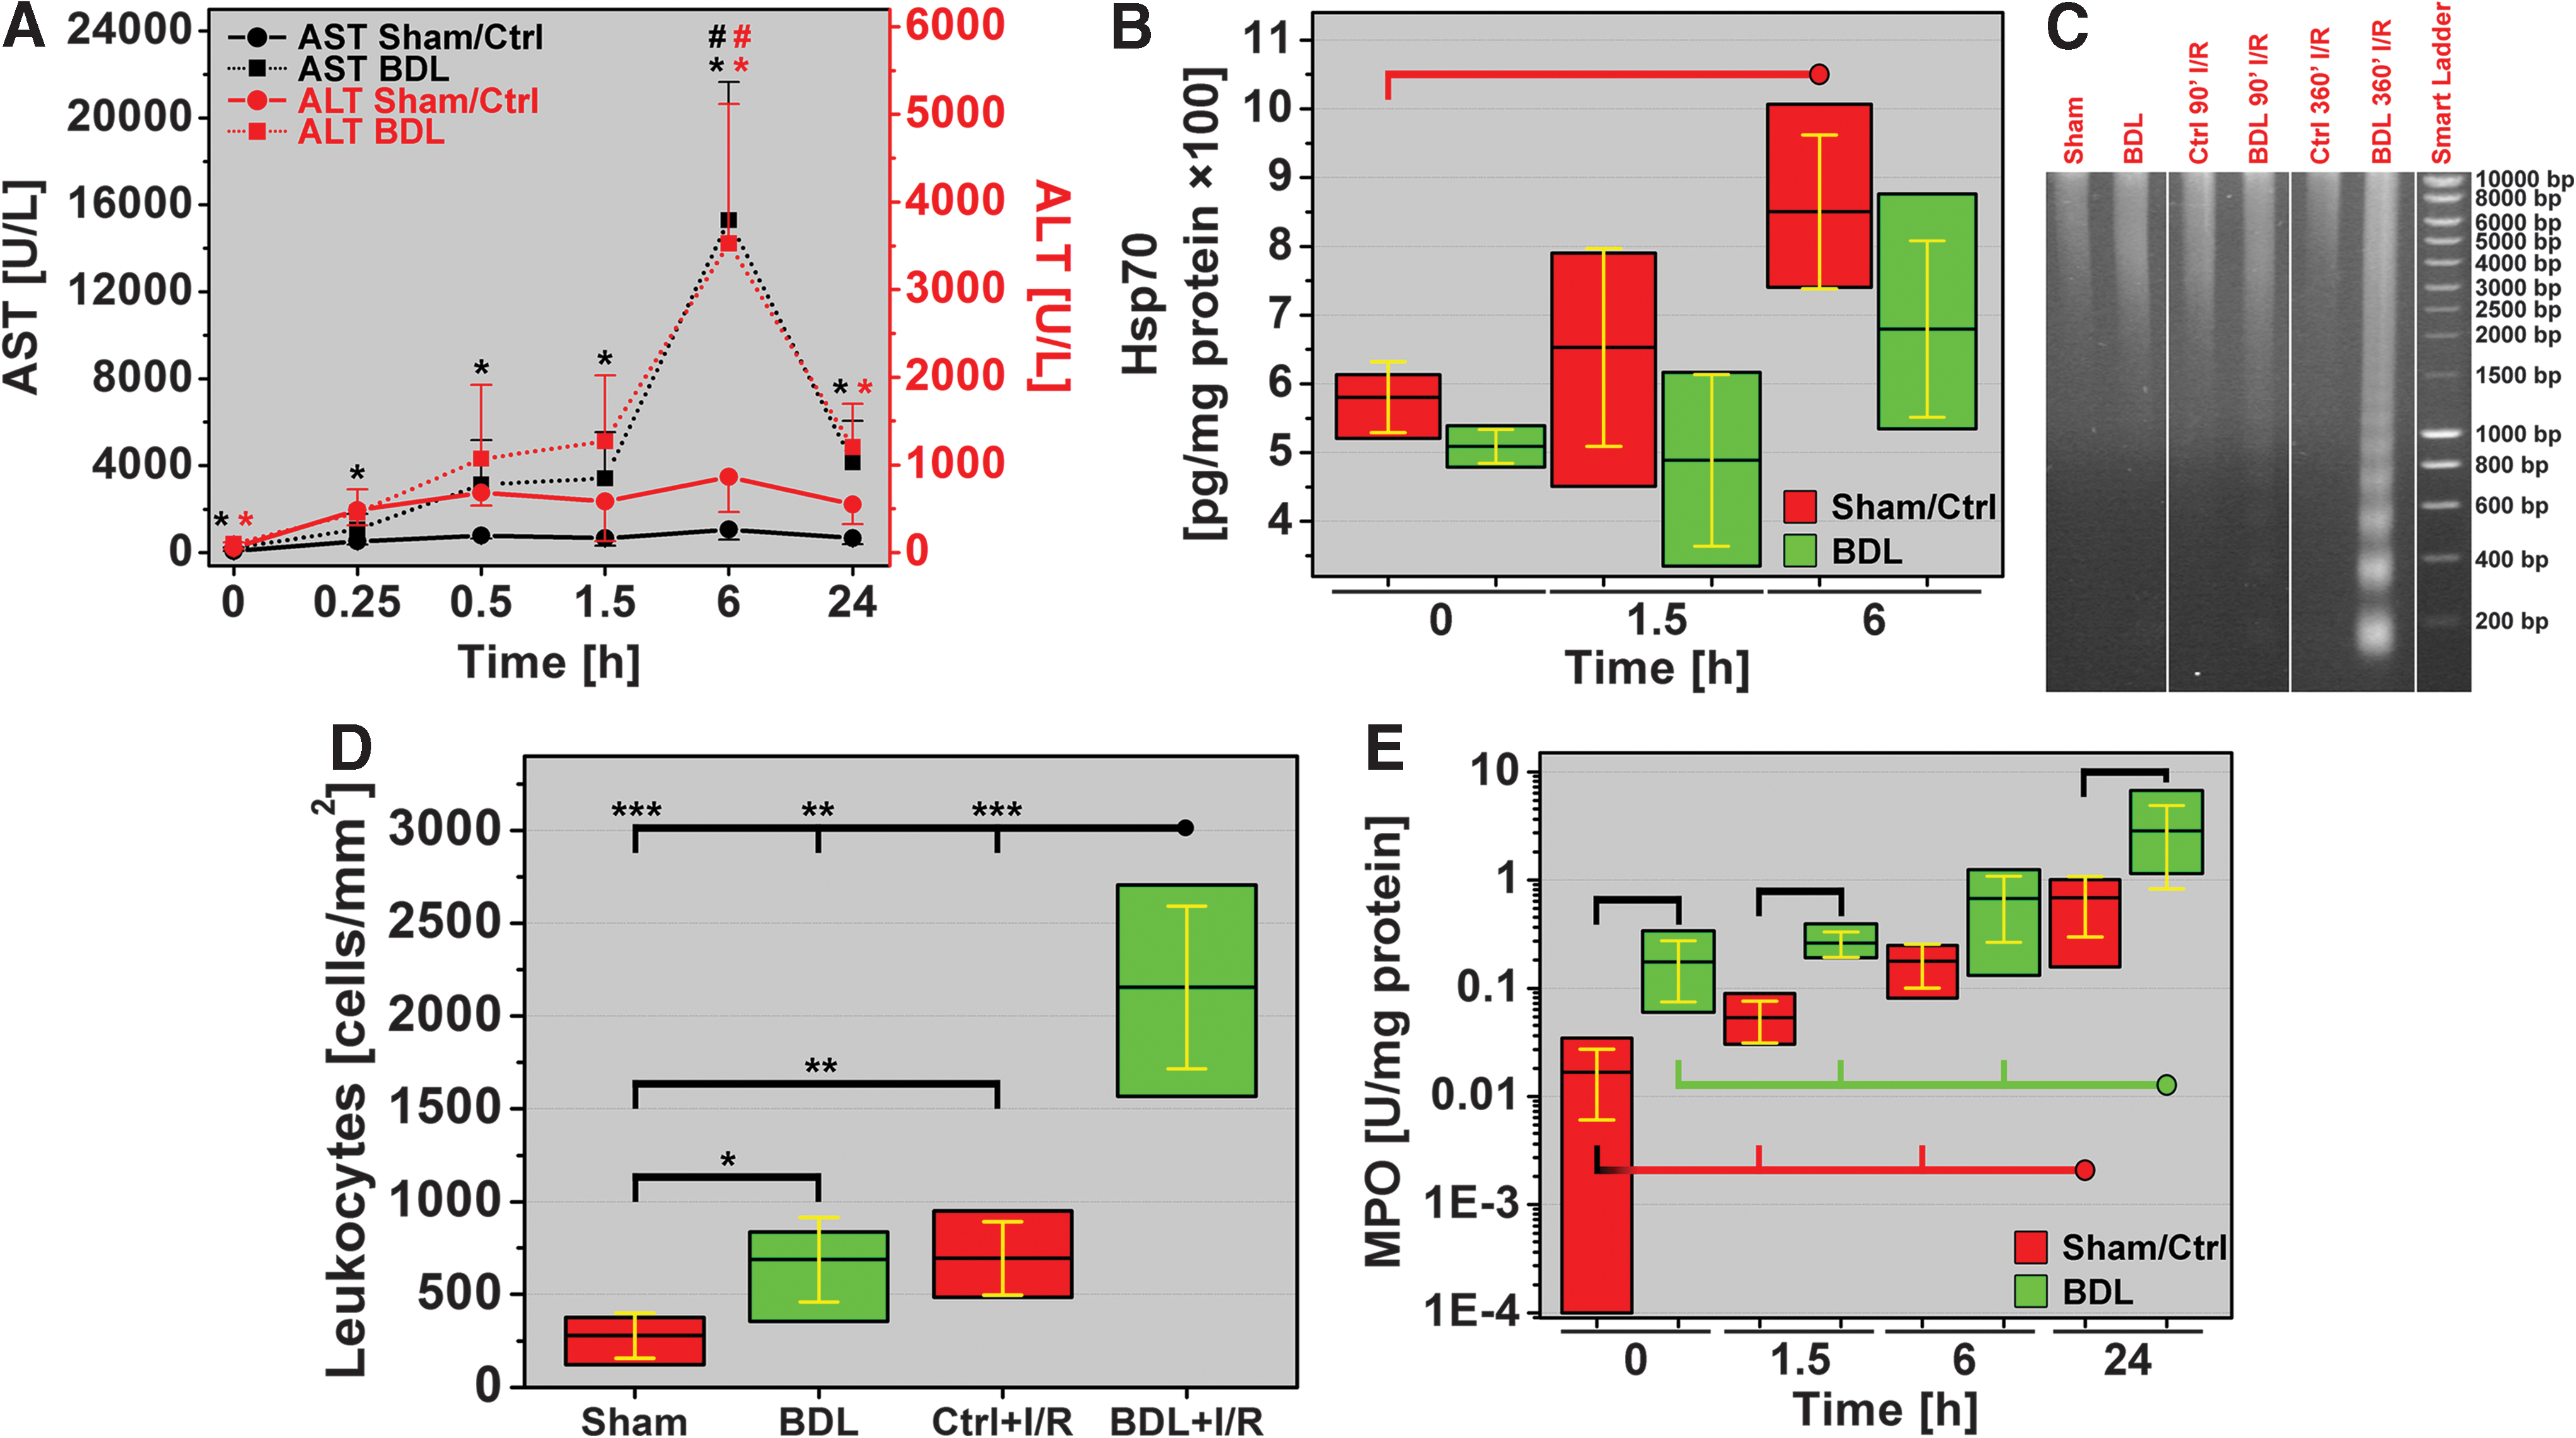
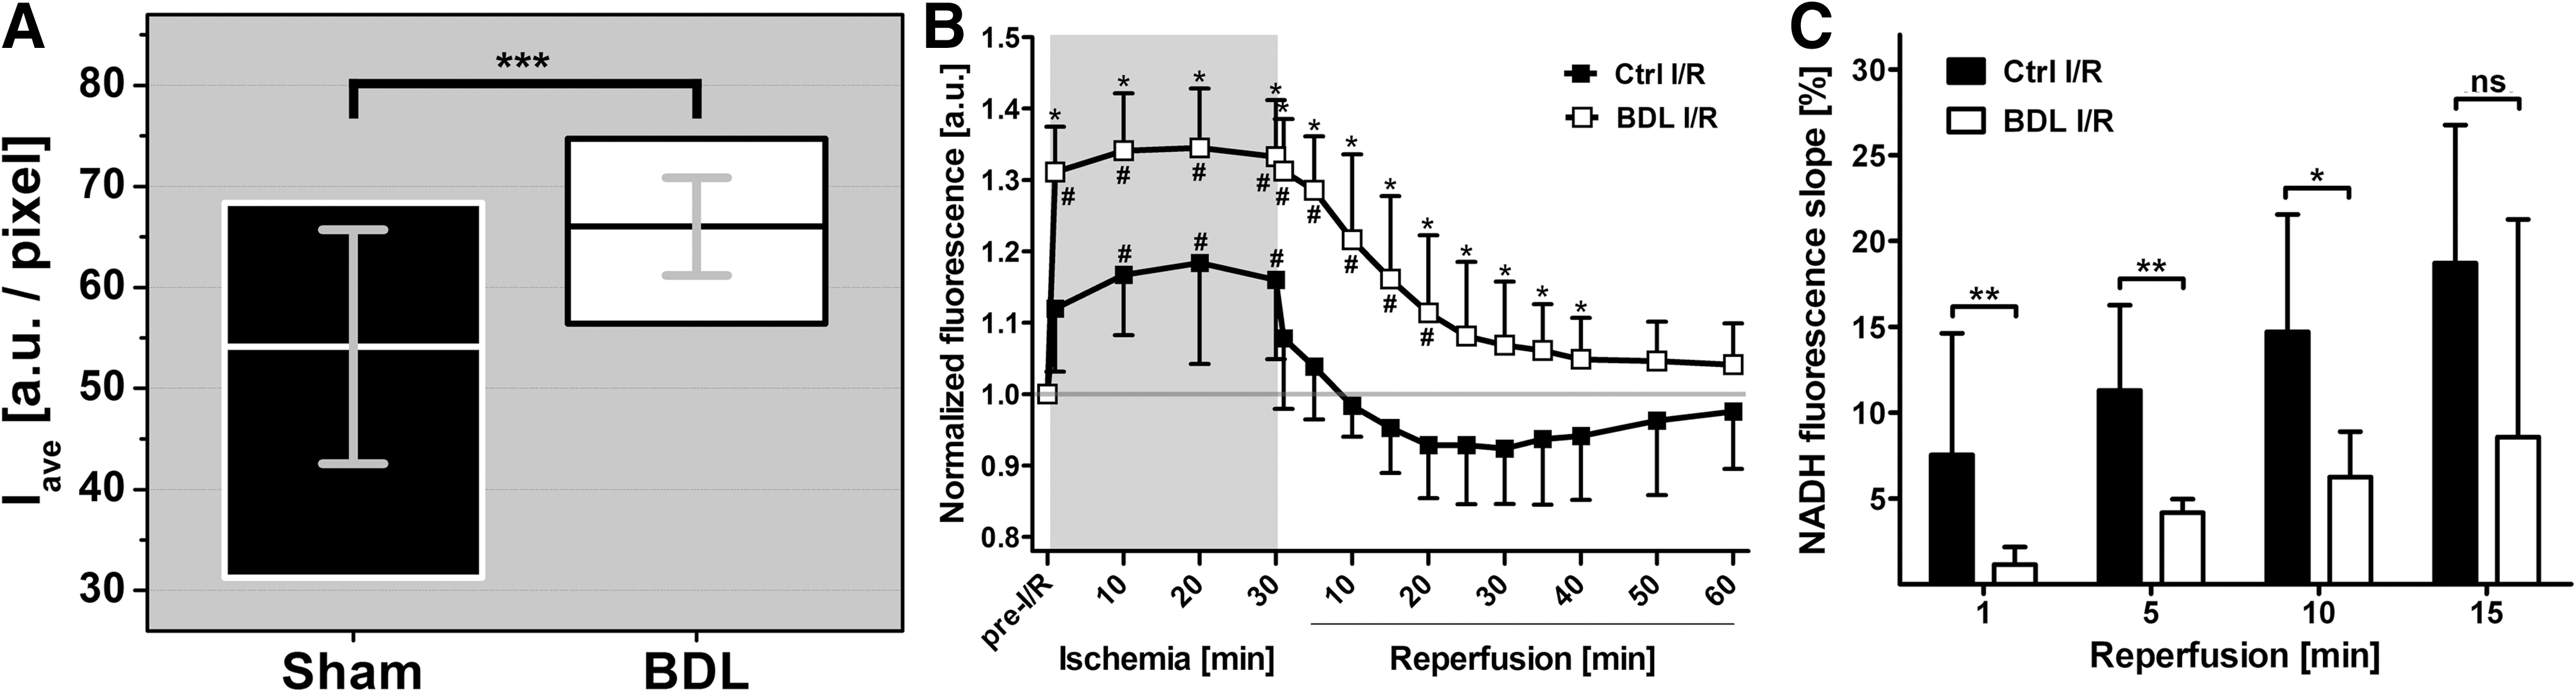
Cholestasis-induced hepatopathology was primarily reflected by elevated plasma transaminase levels, but not by a stress response or DNA damage. Animals in the BDL group exhibited 3.1- and 1.8-fold higher plasma aspartate aminotransferase (AST) and alanine aminotransferase (ALT) levels than control (Ctrl) livers, respectively (Fig. 1A). Cell stress (such as oxidative stress) and its downstream effects such as protein un/misfolding trigger a cytoprotective stress response that proceeds through the upregulation of heat shock protein (Hsp) transcription/translation (10, 37) that completes within minutes (51). A stress response in the form of increased Hsp70 synthesis was, however, not found in cholestatic livers pre-I/R (Fig. 1B). Moreover, during apoptosis/necrosis, activated endonucleases (13) cleave chromatin DNA into internucleosomal fragments of 180 base pairs or multiples thereof. Despite the apoptosis/necrosis observed histologically in cholestatic livers (Fig. 2), no DNA fragmentation was detected by gel electrophoresis (Fig. 1C).
Hepatocellular damage and stress response in native and cholestatic livers after ischemia
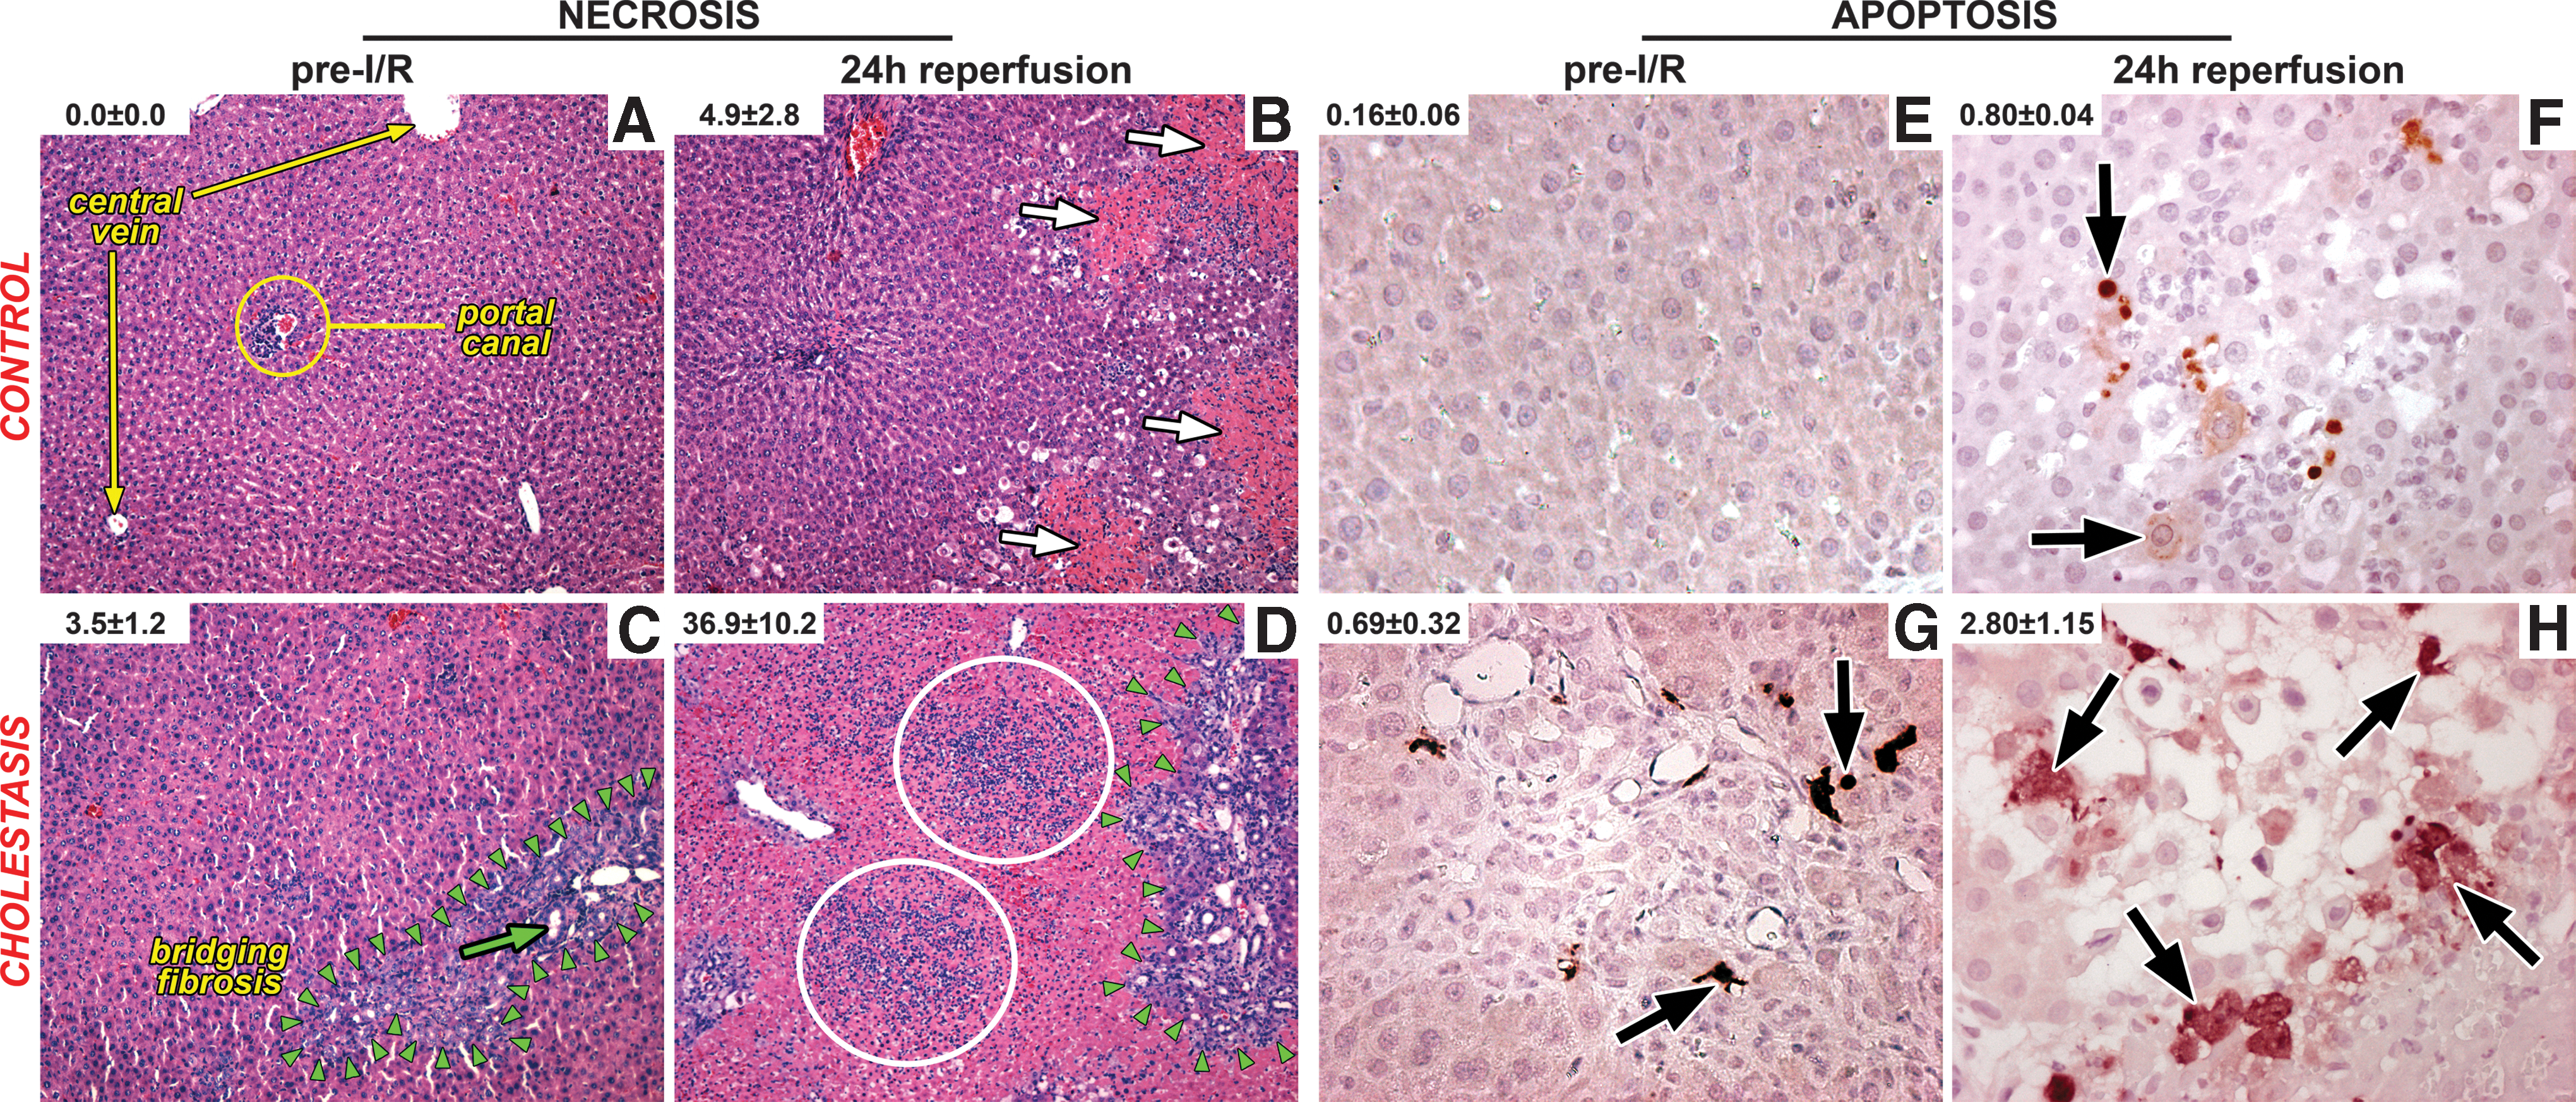
I/R was considerably more deleterious to cholestatic livers than to native livers. I/R-subjected livers revealed significantly more necrosis and apoptosis in the BDL+I/R group after 24-h reperfusion than in the I/R-subjected control (Ctrl+I/R) group (Fig. 2). Necrosis (an energy depletion-dependent process) was more pronounced than apoptosis (an ATP-dependent process) in both groups, which is in line with previous reports (16).
Significant hepatocyte damage in the BDL+I/R group was reflected by the 16.3- and 4.1-fold increases in plasma AST and ALT levels at 6-h reperfusion, respectively (Fig. 1A), compared to Ctrl+I/R. I/R in Ctrl livers was associated with an increased heat shock response at 6 h reperfusion, that is, the time point of maximum hepatocellular damage, whereas this response remained absent or appeared to be lagging in cholestatic livers (Fig 1B). In contrast to the Ctrl+I/R group, DNA fragmentation occurred in the BDL+I/R group to some degree at 1.5-h reperfusion and quite extensively at 6-h reperfusion (Fig. 1C), confirming the histological data.
Liver inflammation before and after ischemia
Pre-I/R BDL livers contained more leukocytes than the Sham group livers (Fig. 1D), of which neutrophils exhibited a 10.4-fold greater extent of activation, as evidenced by myeloperoxidase (MPO) activity (Fig. 1E). Neutrophils are cisterns of ROS/RNS-generating enzymes that are engaged and released upon cell activation (55). Despite the ∼10-fold greater extent of neutrophil activation pre-I/R, the generated ROS/RNS appears to have been quite effectively contained in cholestatic livers before I/R, as attested by the relatively mild histological and hepatocellular damage.
Hepatic ischemia stimulates Kupffer cells (KCs), leading to NADPH oxidase (NOX-2) activation on the KC outer membrane (45, 55). During reperfusion, activated NOX-2 reduces molecular oxygen to superoxide anion (O2 •–) extracellularly, whereby the O2 •– either reacts with substrates or is converted to secondary and tertiary radicals and nitrating/oxidizing agents such as ONOO−, H2O2, and •OH (55). These transient derivatives in turn cause oxidative damage that triggers a local inflammatory response encompassing the recruitment of predominantly neutrophils. Neutrophils considerably exacerbate I/R injury through amplified ROS/RNS generation (36, 55).
Accordingly, livers in the BDL+I/R group exhibited more extensive accumulation of inflammatory cells in hepatic sinusoids (Fig. 1D) and necrotic tissue (Fig. 2) as well as more profound neutrophil activation (Fig. 1E) than native livers after I/R, suggesting that the I/R-induced inflammatory response in BDL livers and corollary tissue damage may be associated with increased ROS/RNS generation.
Cholestasis- and I/R-induced intrahepatic oxidative/nitrosative stress
To confirm increased ROS/RNS generation in I/R-subjected cholestatic livers, the total antioxidative capacity, reduced and oxidized glutathione (GSH and GSSG, respectively) levels, cardiolipin (CL) oxidation, and in vivo ROS/RNS generation were assayed.
The total antioxidative capacity of cholestatic livers was 56% of Sham group levels (Fig. 3A), signifying an elevated degree of oxidative/nitrosative stress before I/R and confirming the postulations made in the previous section.
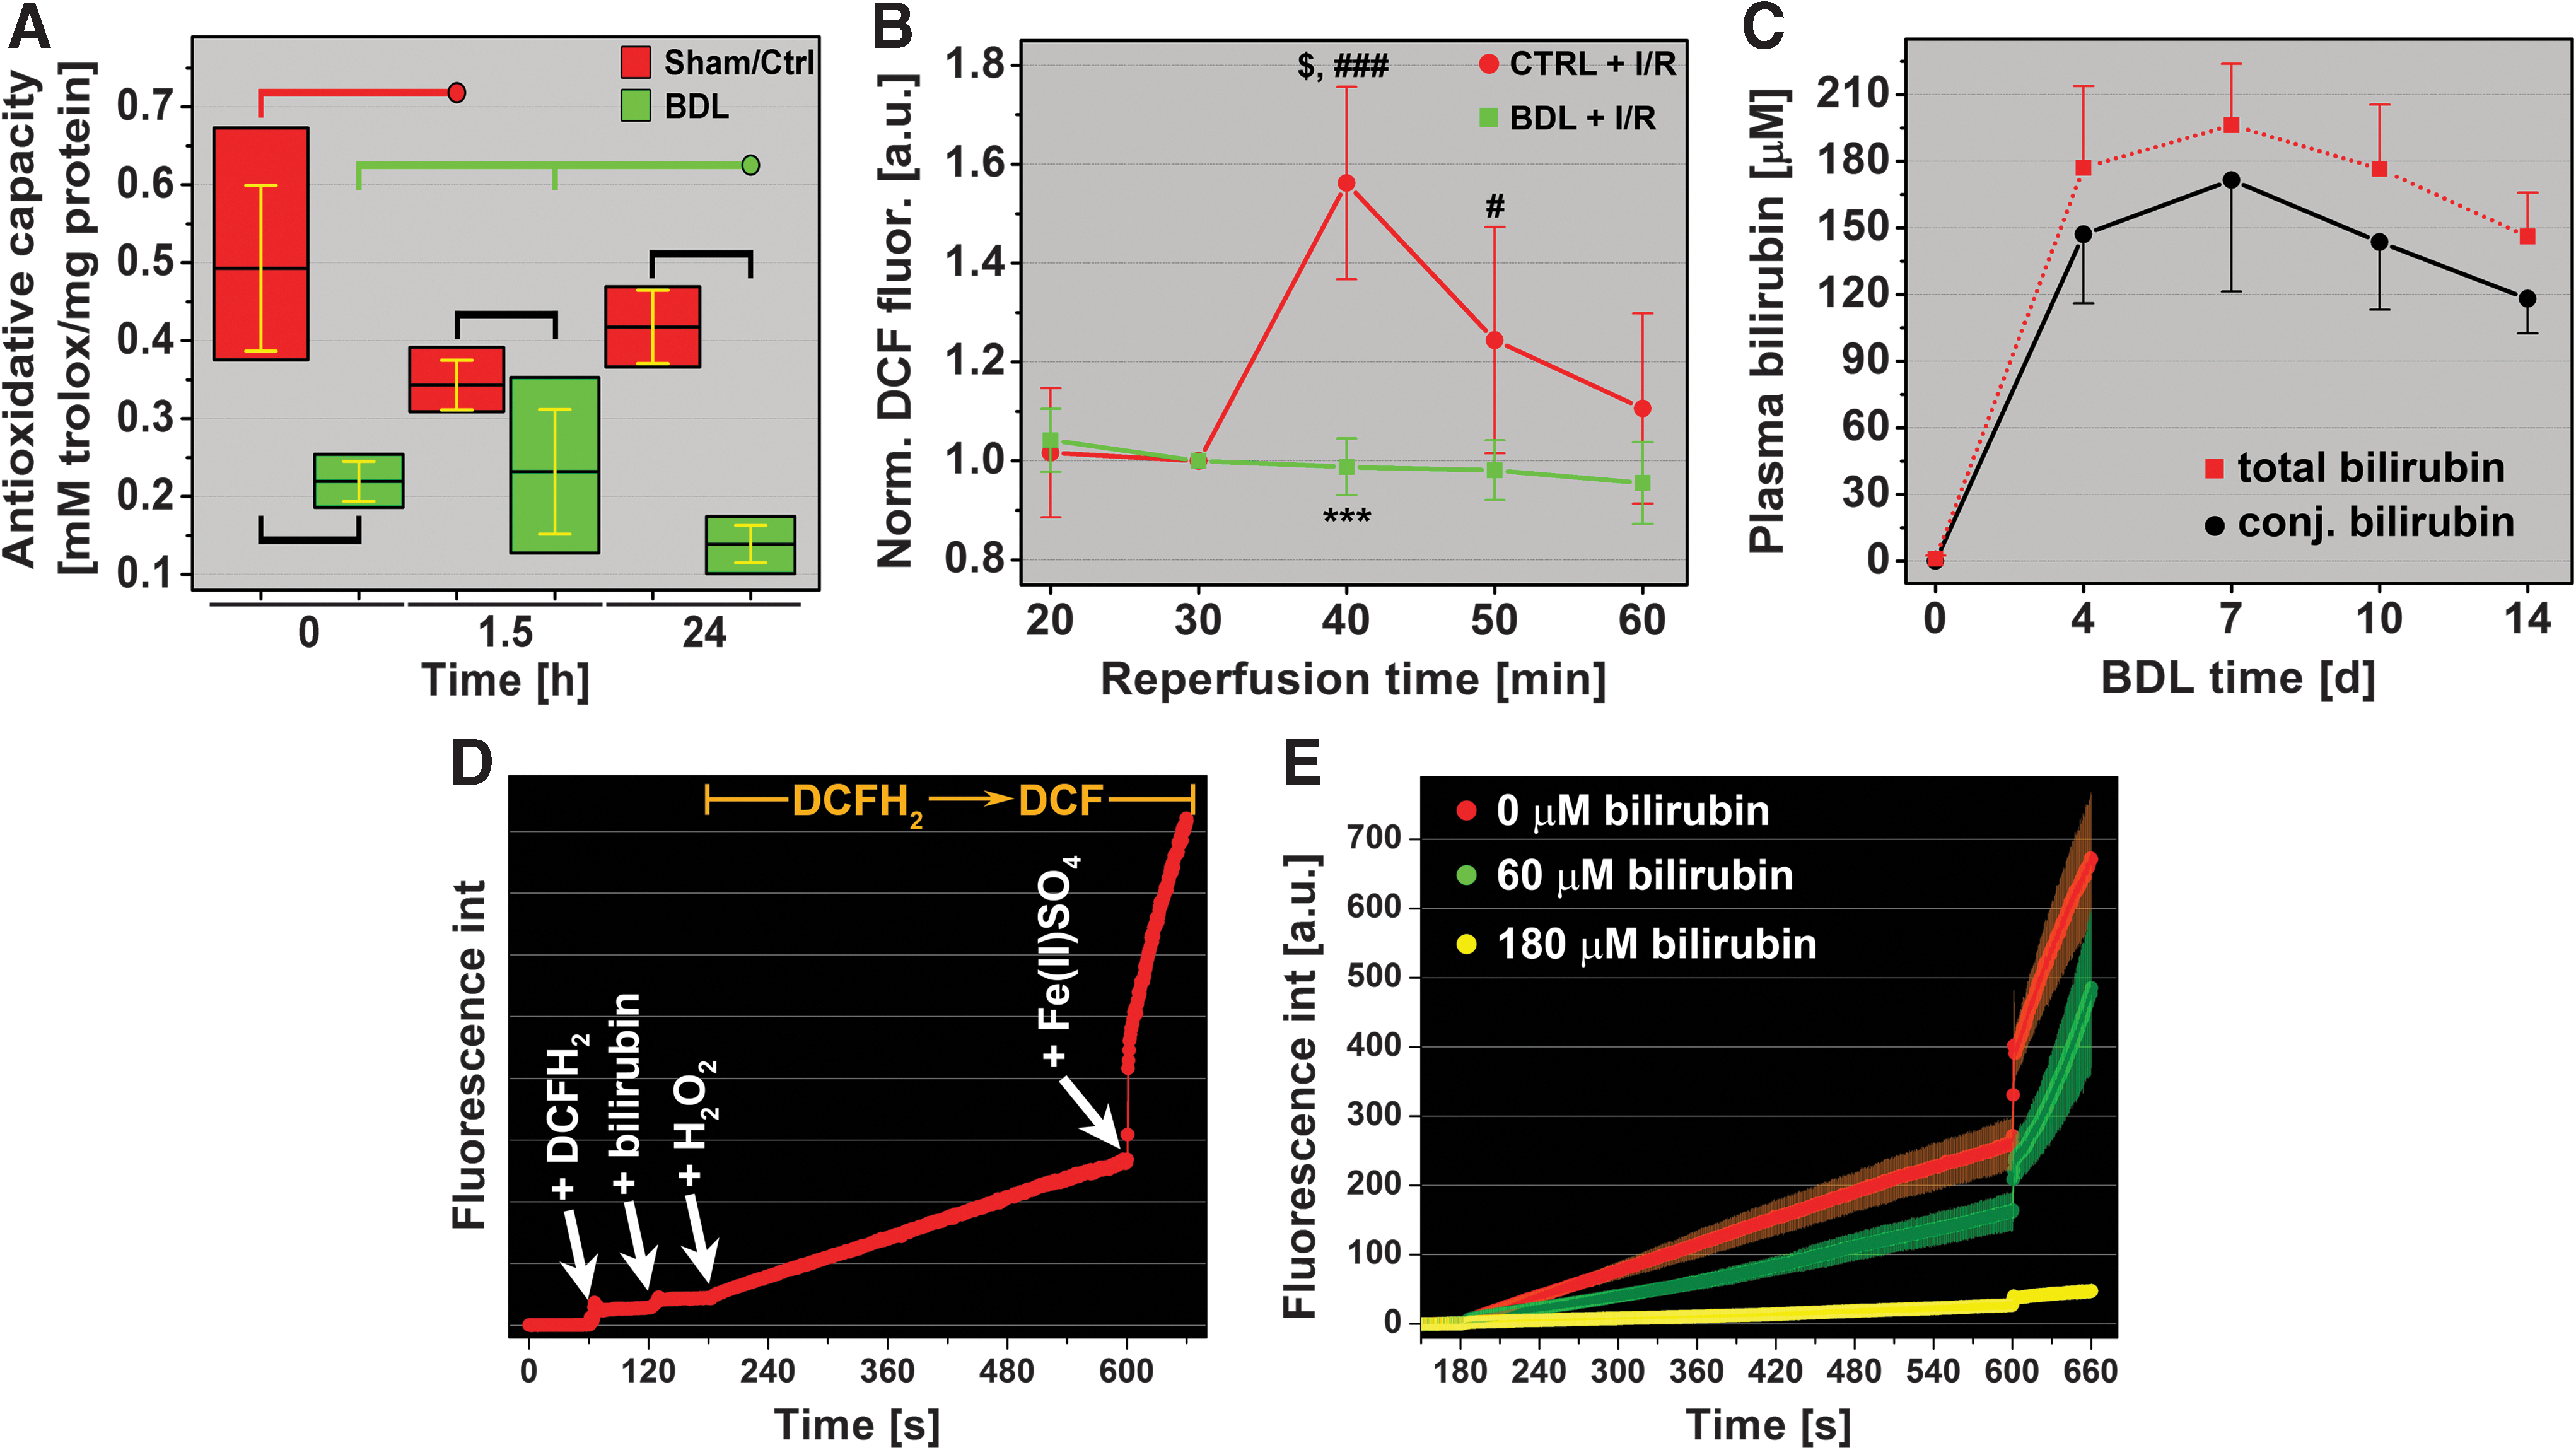
During the early reperfusion phase, the superfluous influx of oxygen triggers excessive electron leakage from the electron transport chain (ETC) in mitochondria, resulting in the production of O2 •– and its reactive derivatives (54, 55). This, in combination with intravascular ROS/RNS production by KCs and neutrophils, ultimately leads to a decreased intrahepatic antioxidative capacity. Indeed, the total antioxidative capacity in Ctrl livers declined during early reperfusion (1.5 h) but recovered to baseline after 24-h reperfusion. In contrast, the antioxidative capacity in cholestatic livers, which was lower before I/R, declined further to 63.3% of pre-I/R levels in the BDL group and to 33.3% of Ctrl+I/R levels at 24-h reperfusion (Fig. 3A).
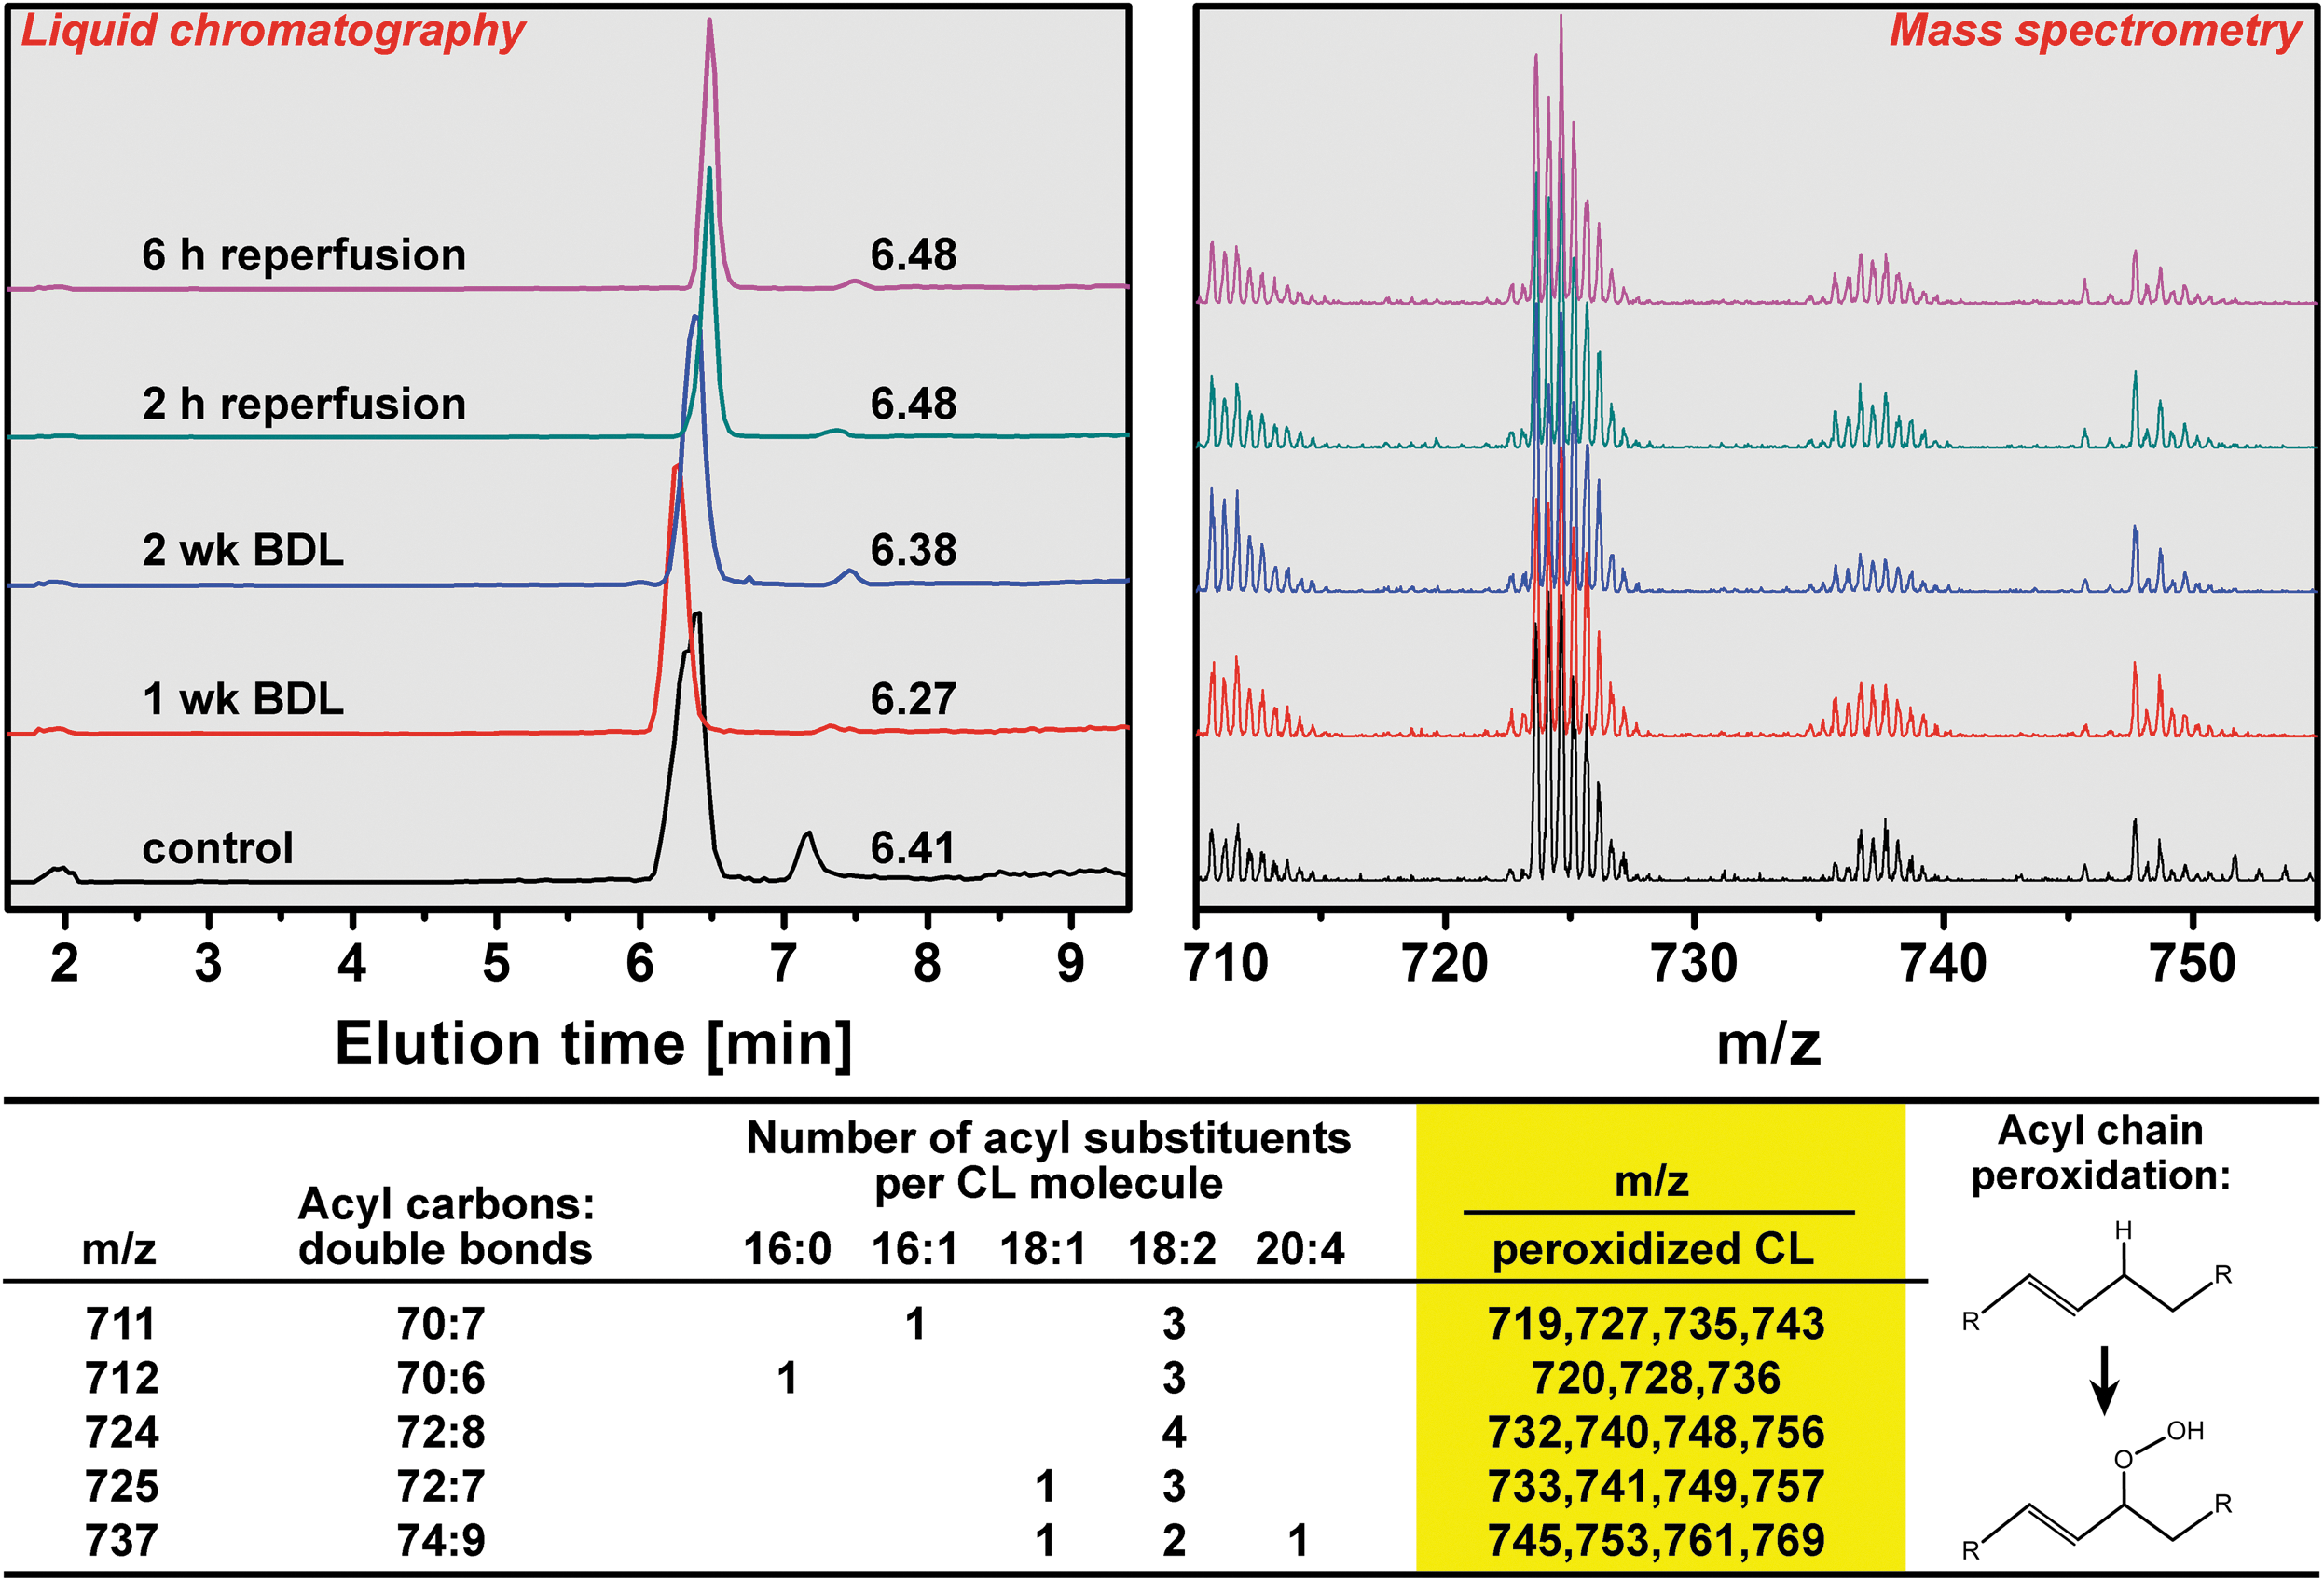
Next, glutathione oxidation states and peroxidation of CL, a mitochondrion-specific lipid, were assayed. Despite that reduced glutathione (GSH), the most abundant cytosolic antioxidant in hepatocytes (7, 39), had decreased in both groups during reperfusion (Supplementary Fig. S2A), ROS/RNS production appeared to have been effectively managed in the cytosol in all groups inasmuch as the ratio between reduced and GSSG (Fig. S2C) and the reduction potential of the GSH/GSSG redox couple (Fig. S2D) did not change upon reperfusion. Corroboratively, any downstream ramifications of the reduced antioxidative capacity during cholestasis (1 and 2 weeks) and reperfusion (1 and 6 h) were absent at the mitochondrial level, as no peroxidized CL was detected by high-performance liquid chromatography-mass spectrometry (HPLC-MS) (Fig. 4). These results and the results presented in the Supplementary Data (Supplementary Fig. S3) cooperatively suggest that oxidative/nitrosative stress is present during cholestasis and I/R, but not to an extent that is beyond the remedial capacity of endogenous coping mechanisms.
To determine the extent of in vivo ROS/RNS production during I/R, the oxidation-sensitive fluorogenic probe 2′,7′-dichlorodihydrofluorescein diacetate (DCFH2-DA) was infused at t=31 min reperfusion, that is, the acute reperfusion phase in which mitochondria undergoing MPT as well as KCs (healthy livers) and KCs and neutrophils (cholestatic livers) are responsible ROS/RNS production (55). DCFH2-DA is enzymatically de-esterified in plasma and cytoplasm (38) to the nonfluorescent and membrane-impermeable 2′,7′-dichlorodihydrofluorescein (DCFH2), as a result of which it is expected to localize in both the vascular and cellular compartment. DCFH2 in turn is oxidized to the highly fluorescent 2′,7′-dichlorofluorescein (DCF) by multiple ROS/RNS (9). As shown in Figure 3B, healthy livers subjected to I/R exhibited considerable ROS/RNS production, whereas oxidation of DCFH2 in BDL livers was negligible. These findings further negate a prominent role of oxidative/nitrosative stress in I/R-induced hepatopathology in cholestatic livers.
Bilirubin is a protective antioxidant during I/R in cholestatic livers
Since unconjugated bilirubin and conjugated bilirubin are potent antioxidants (61), the antioxidative potential of bilirubin was examined in vitro under conditions that mimicked the in vivo setting. First, plasma concentrations of conjugated and total bilirubin were determined for different BDL times (Fig. 3C). Second, a spectrofluorometric assay was developed in which DCFH2 oxidation by primarily •OH was measured in the absence and presence of bilirubin (Fig. 3D). Figure 3E shows that, at the in vivo bilirubin concentration of ∼180 μM, oxidation of DCFH2 is almost completely abrogated. Any increases in DCF fluorescence were not attributable to the production of ROS/RNS in platelets and red blood cells (Supplementary Fig. S4). These data provide compelling evidence for the role of bilirubin as a potent ameliorator of oxidative/nitrosative stress in I/R-subjected cholestatic livers.
Taken altogether, I/R-induced hepatocellular death in cholestatic livers is unlikely caused by oxidative/nitrosative stress per se but by an alternative mechanism that is mainly responsible for widespread necrosis. Since necrosis could result from hepatocellular energy depletion, which is particularly prominent during I/R (21), the liver's ability to (re)generate ATP was examined first by intravital assessment of nicotinamide dinucleotide (NADH) redox states before and during I/R.
Extrahepatic cholestasis is associated with a greater mitochondrial reducing capacity before ischemia
NADH fluorescence can be employed as a direct measure of mitochondrial reducing capacity (the concentration of reduced species with respect to the NAD+/NADH redox couple (24, 41)) and thus as an indirect measure of ATP production, mitochondrial pO2 (58), and flow (23).
The NADH Iave was 22% higher in BDL livers versus Ctrl livers (66.0±4.8 vs. 54.1±11.6, respectively, Fig. 5A), reflecting an augmented mitochondrial reducing capacity before I/R. The O2 deprivation during ischemia (next section) principally reveals the total amount of NADH present. The elevated NADH levels pre-I/R (Fig. 5A) and the more profound increase in NADH fluorescence during ischemia (Fig. 5B) suggest a higher NADH turnover in cholestatic hepatocytes, possibly attributable to an accelerated metabolic activity. These data also show that cholestatic livers possess a more effective buffer to maintain the mitochondrial redox environment (46).
The elevated mitochondrial reducing capacity is exacerbated during ischemia in cholestatic livers
The redox environment of a redox couple is defined as the product of the reducing capacity and half-cell reduction potential (Ehc), whereby Ehc (NAD + ,NADH) is represented by the Nernst equation (Ehc=E° −(61.4 mV/2)log([NADH]/[NAD+]) for a 2e− transfer process at 37°C, where the NAD+/NADH half-cell potential (E°) is −320 mV) (46). The reduction potential is considered a voltage and the reducing capacity the total charge stored (or the number of electrons available). When O2 becomes unavailable, NADH dehydrogenase (complex I) will remain reduced and the [NADH]/[NAD+] ratio will by definition increase, causing an increase in reducing capacity and reduction potential. A lowering of Ehc signifies a condition in which oxidative processes are favored (46).
The reducing capacity in both groups reached a maximum within 1 min of ischemia and remained constant up to the reperfusion phase (Fig. 5B). However, the relative increase in NADH fluorescence in the BDL group was approximately twice the magnitude of that observed in the Ctrl group. Consequentially, the reducing capacity and thus the reducing potential in mitochondria were shifted toward a more reductive state before the restoration of blood flow, implying that cholestatic livers were more predisposed to rapidly resolve energy deficits upon reflow.
An elevated reductive state prevails in cholestatic livers during reperfusion
The reinstatement of flow led to reoxygenation of the liver and resumption of oxidative phosphorylation (Fig. 5B). In Ctrl livers, the early reperfusion phase comprised a biphasic process characterized by a steep decline in NADH fluorescence in the first min and an onward linear digression (R 2=0.97) that plateaued at t=20 min (Fig. 5B). This phase further encompassed a tendency toward reactive hyperemia (2, 17) after 10 min reperfusion as evidenced by the sub-baseline NADH fluorescence (Fig. 5B) and thus a shift to a more oxidative environment.
Contrastingly, the early reperfusion phase in BDL livers was of a uniphasic linear nature (R 2=0.97) from the onset of reperfusion, during which an elevated reducing capacity persisted for 20 min (p<0.05 vs. t=pre-I/R). Inasmuch as the slopes of the linear phases were equal in both groups (Ctrl=0.008, BDL=0.009, p=0.63), the redox environment was predominantly governed by the initial reducing capacity and the extent to which oxidative phosphorylation was restored in the first min of reflow (Fig. 5C). The deficit in NADH oxidation rate was abrogated after 15 min of reperfusion (Fig. 5C) and NADH fluorescence intensities of both groups converged after 40 min reperfusion.
Cholestasis is associated with increased heterogeneity in oxidative phosphorylation and reducing capacity during reperfusion
A causal, inversely proportional relationship has been established between oxidative phosphorylation (i.e., energy production) and the extent of cellular damage and (the type of) cell death during postischemic reperfusion (26, 27, 46). Necrosis, the predominant form of hepatic cell death that results from energy depletion (6), evolves in a zonal pattern during the reperfusion phase (21). I/R-induced microcirculatory reperfusion is also manifested in a zonal arrangement as was shown in Figure 6 and by others (59), linking liver perfusion to liver damage through local differences in oxidative phosphorylation and corollary energy production. The extent of the regional differences in oxidative phosphorylation was evaluated by means of kurtosis of the total intensity (Itot) histograms and the heterogeneity index.
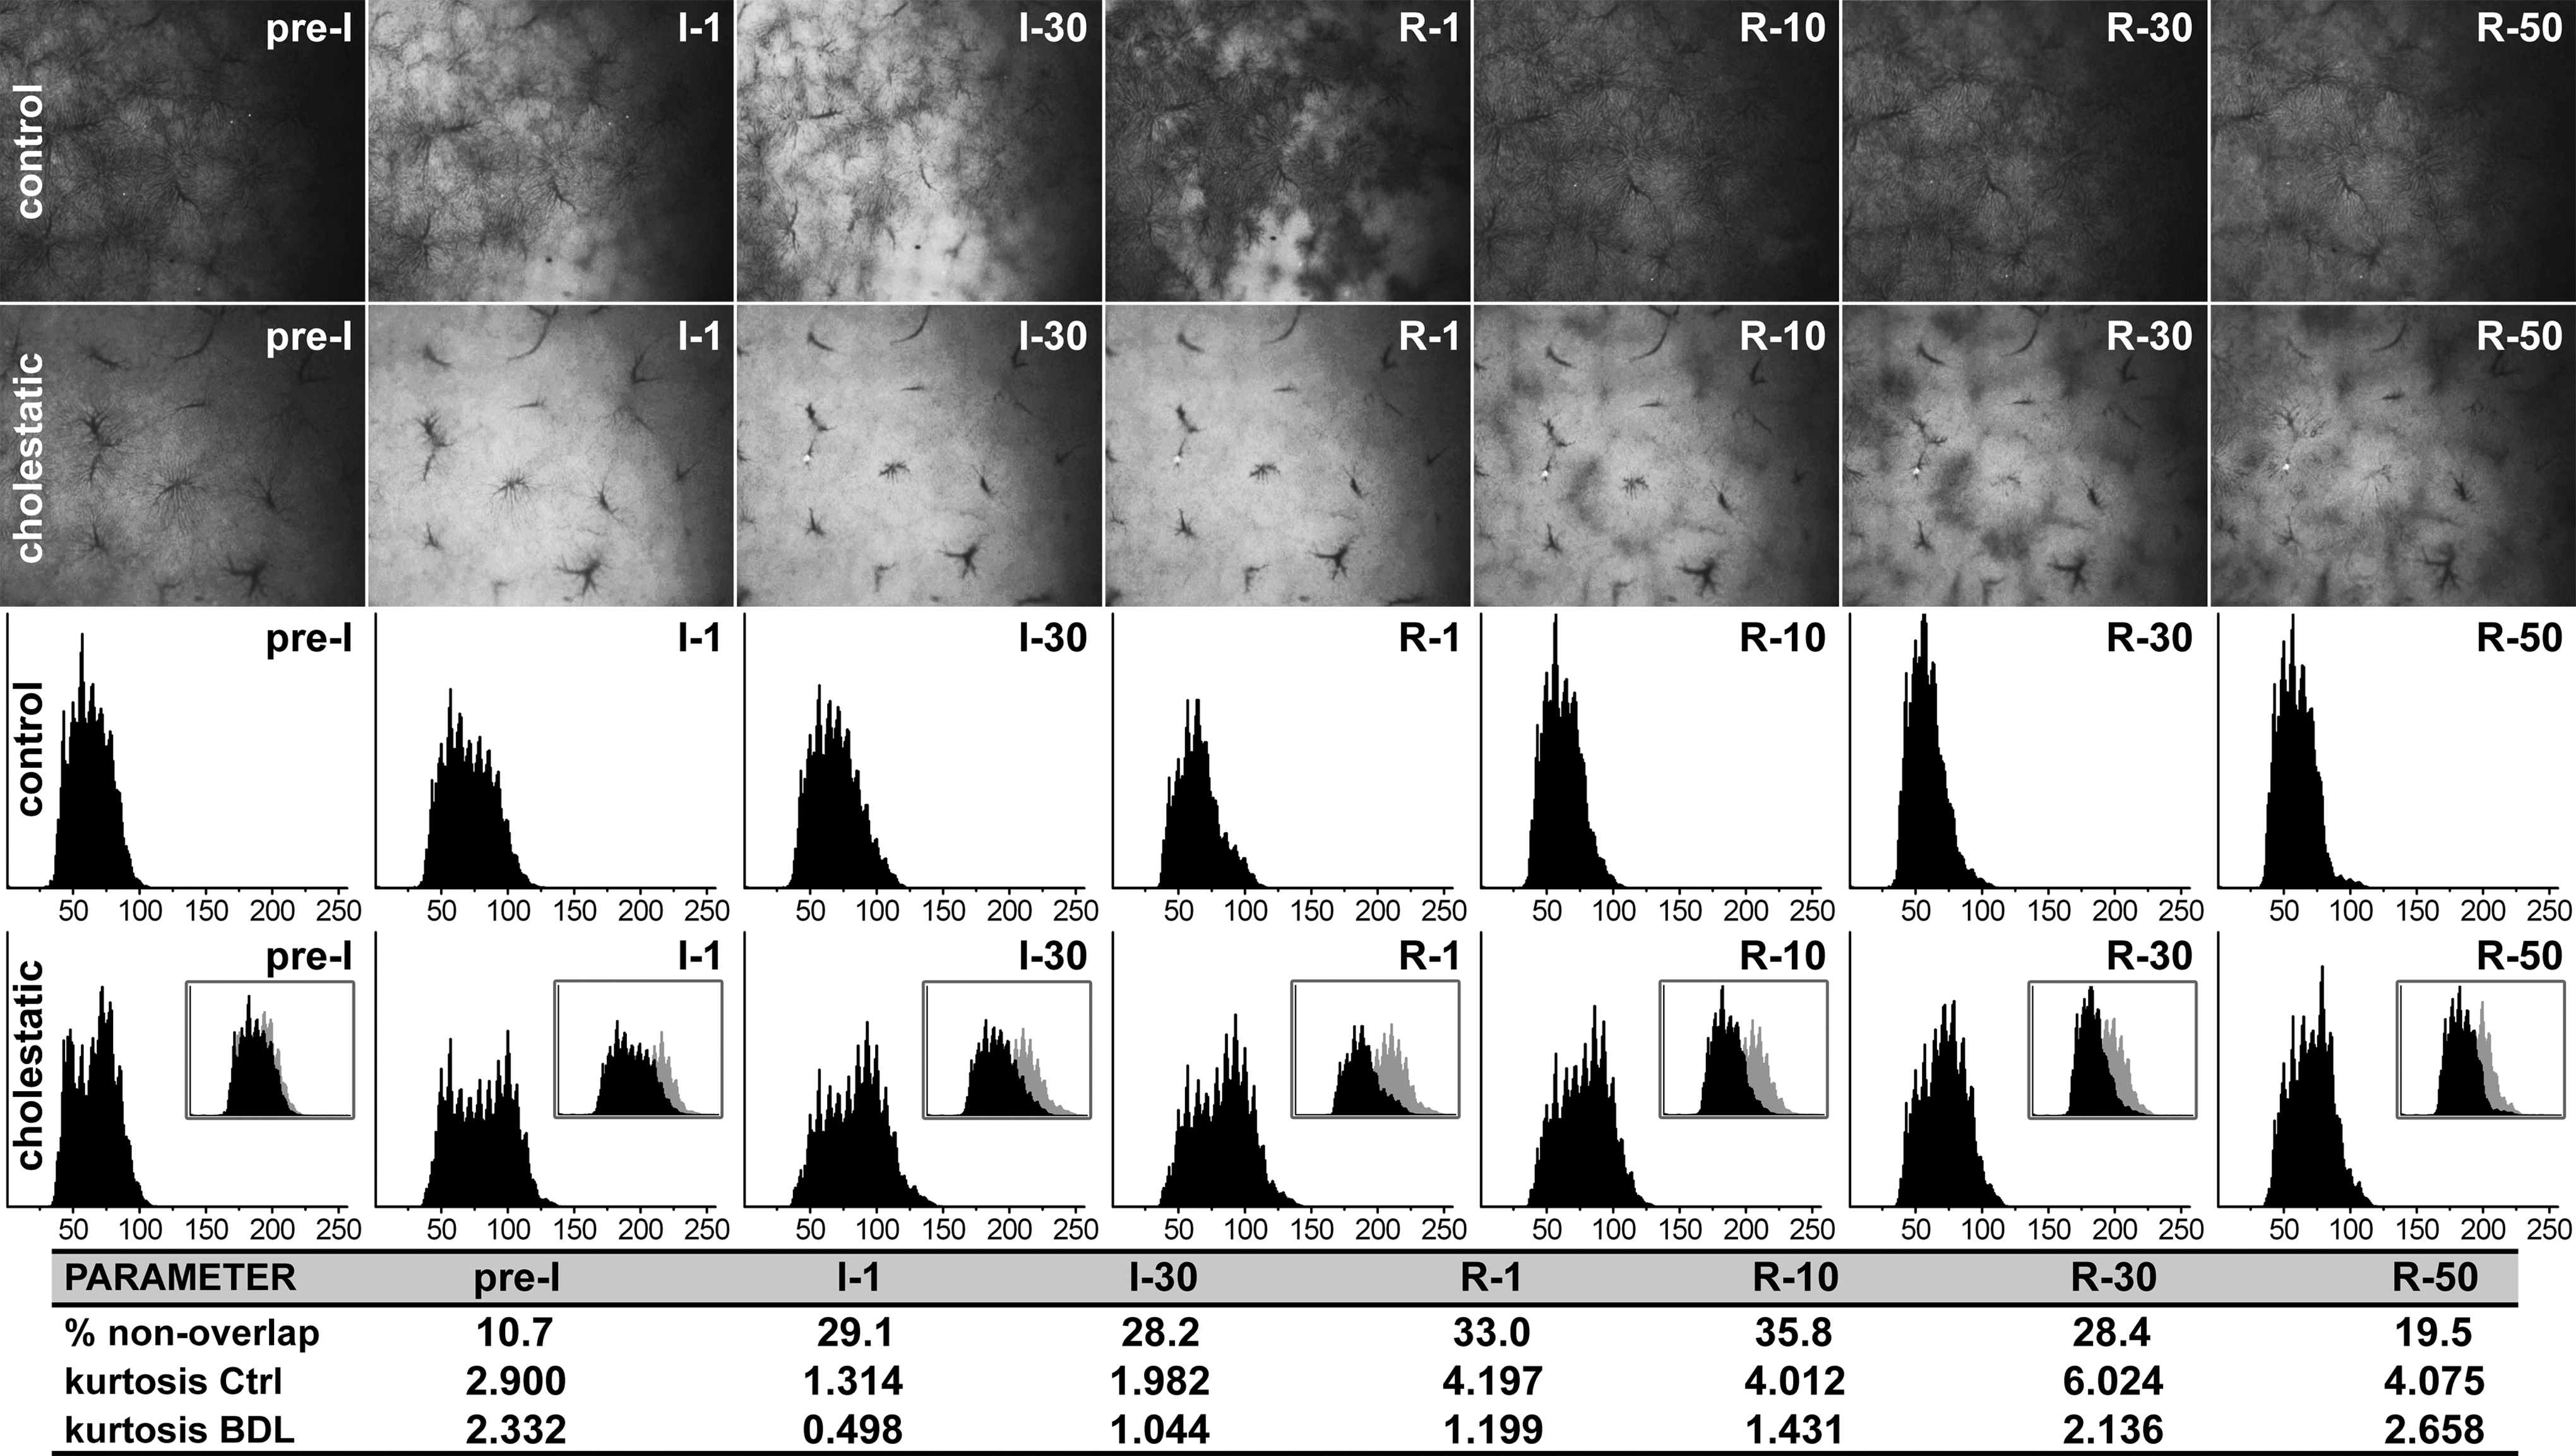
Compared to Ctrl livers, the intensity histograms of cholestatic livers were white-shifted and more platykurtic at all I/R time points (Fig. 6), indicating that oxidative phosphorylation (energy production) proceeded at a slower rate and was more heterogeneously dispersed, respectively, during reperfusion. In the first 30 min of reperfusion the difference in NADH levels in the BDL+I/R group was >28% versus the Ctrl+I/R group (Fig. 6). Accordingly, a considerably higher NADH reducing capacity was maintained in cholestatic livers during the reperfusion phase. The augmented heterogeneity in oxidative phosphorylation/energy production and reducing capacity was confirmed by the higher heterogeneity index in cholestatic livers (Supplementary Fig. S5). Moreover, the mean distributions in the Ctrl group became more leptokurtic after 1 min reperfusion relative to t=pre-I/R, signifying a uniform effort of hepatocytes to resolve the ischemia-induced oxygenation/energy deficits. This phenomenon was less pronounced in reperfused cholestatic livers as evidenced by the relative platykurticity of the histograms.
Perfusion and reperfusion defects are responsible for the lower rate of oxidative phosphorylation and higher mitochondrial reducing capacity in cholestatic livers
The vast discrepancy in oxidative phosphorylation between cholestatic and Ctrl livers was subsequently investigated at the level of the microcirculation. Microscopic imaging of sinusoids in the Ctrl+I/R group revealed that the tendency toward hyperemia (i.e., oxidative burst) during the early reperfusion phase was likely the result of a vasodilatory response of the sinusoids, which had prevailed in some livers at 70-min reperfusion (Fig. 7A, E).
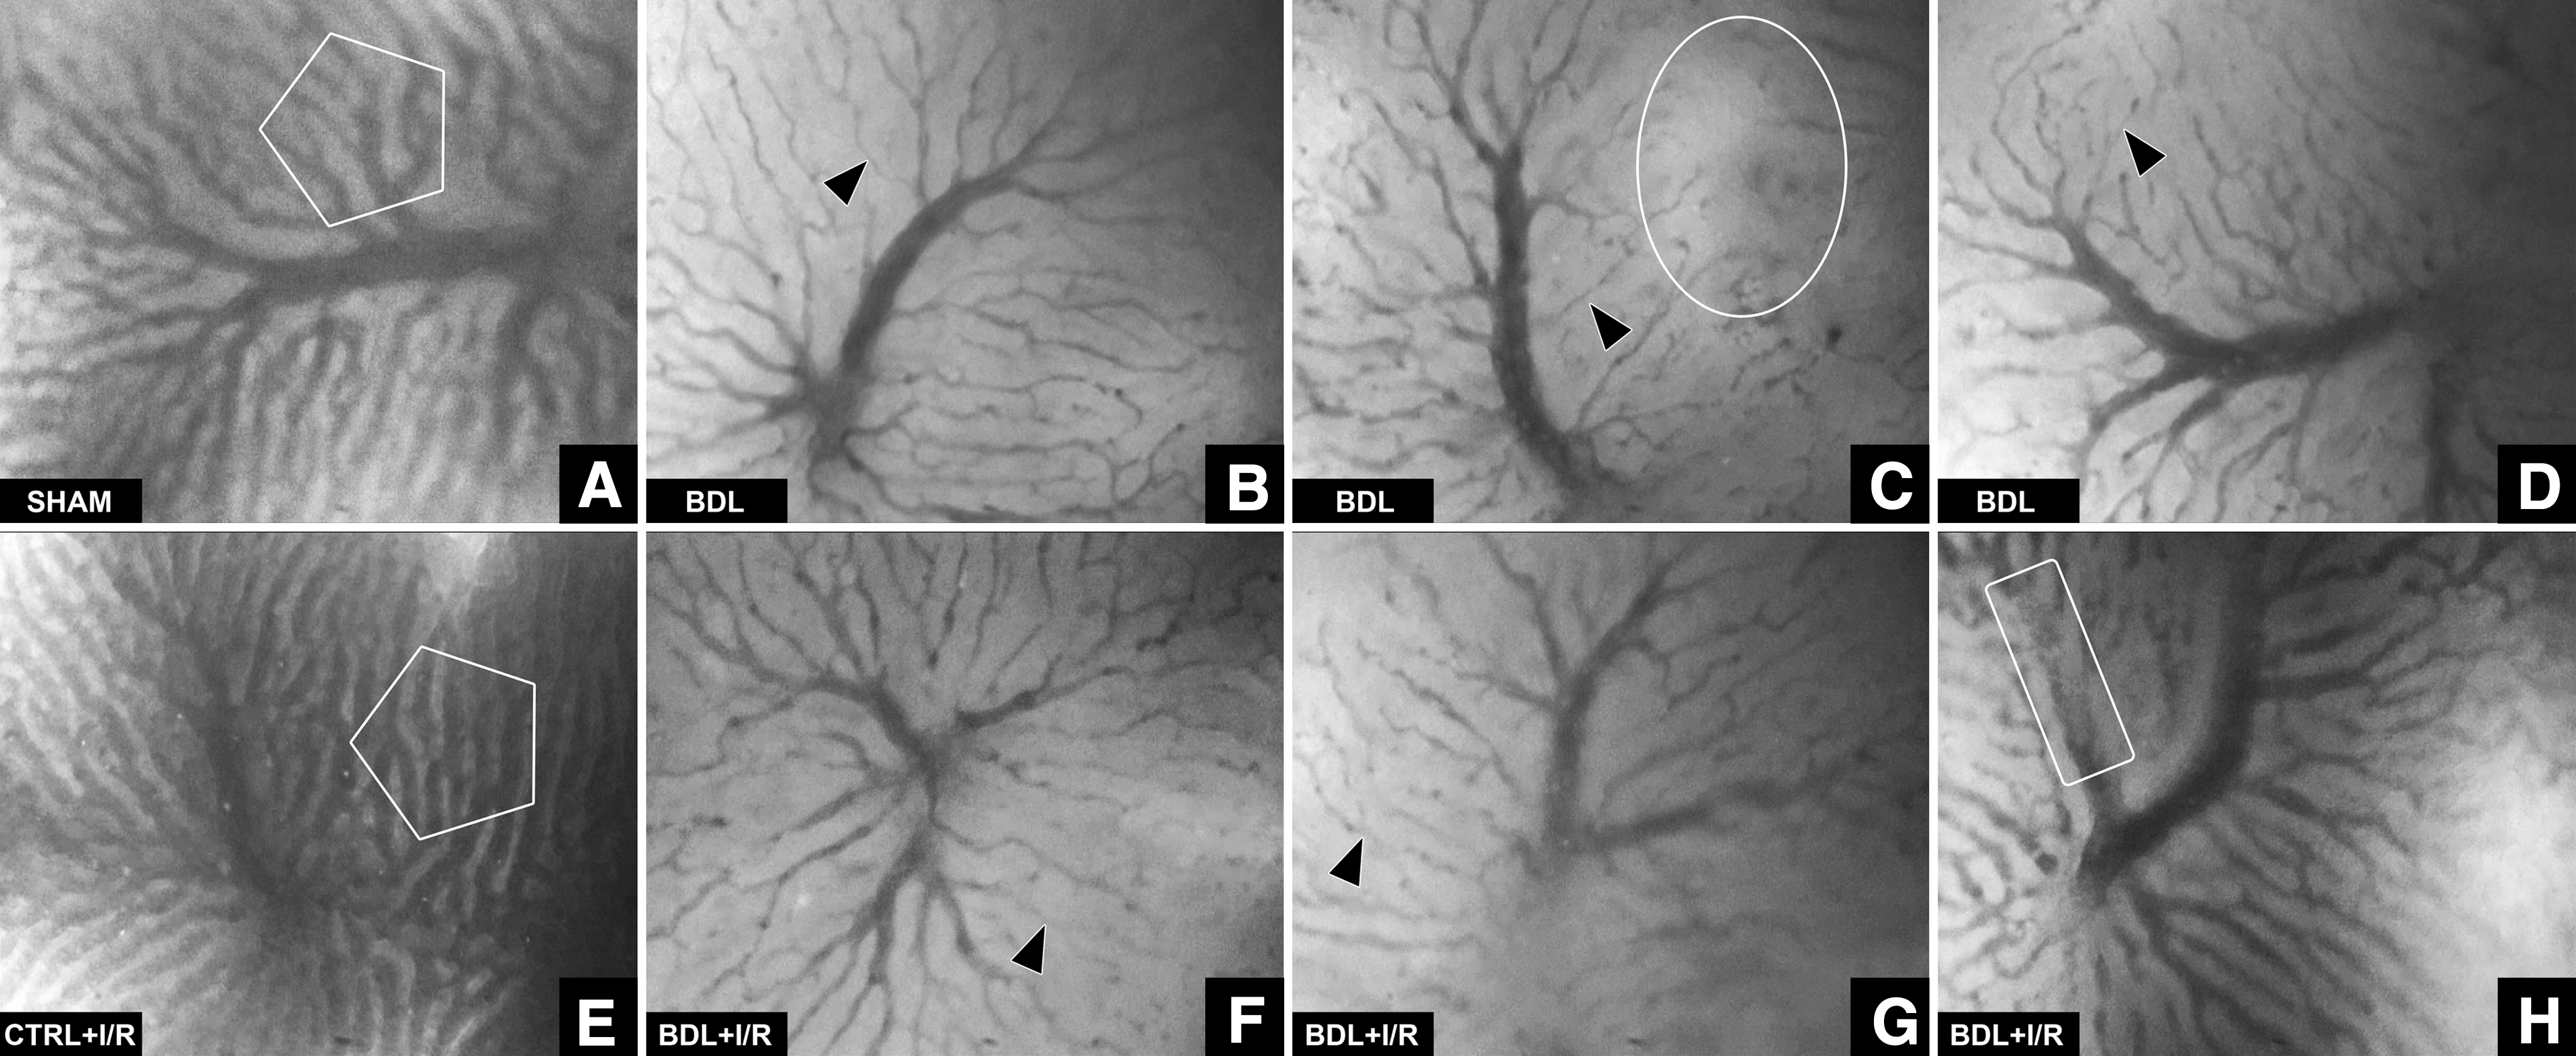
In cholestatic livers, substantial vasoconstriction of virtually all sinusoids and the sparse presence of hypo-to-nonperfused areas (BDL group, Fig. 7B–D) were observed. During reperfusion (BDL+I/R group, Fig. 7F–H), the microvascular blood flow was typically reduced and an increased number of presinusoidal venules were hemostatic (46% of animals). In some cases, I/R in the presence of cholestasis was associated with thromboembolism (36% of animals), whereby the thrombi had caused hypoperfusion or stasis (Supplementary Video S1). Thromboembolism was not observed in the other groups.
Taken altogether, the perfusion defects (heterogeneity and flow) pre- and post-I/R are responsible for the slow progression of oxidative phosphorylation in cholestatic livers. Since a decelerated rate of oxidative phosphorylation implies a lower intrahepatic energy status and altered purine and pyrimidine metabolism, hepatic nucleotide concentrations were determined as a function of I/R time.
A lower rate of oxidative phosphorylation in cholestatic livers leads to delayed normalization of nucleotide n-phosphates during reperfusion
ATP constitutes the prime source of energy while the other nucleotide triphosphates fulfill other vital metabolic functions. Although guanosine triphosphate (GTP) can donate a phosphate to ADP to yield ATP (1), it is used more specifically in protein synthesis and cell signaling. Citidine triphosphate (CTP) serves as an energy source and as a coenzyme in glycerophospholipid synthesis and protein glycosylation. Uridine triphosphate (UTP) predominantly acts as a substrate in RNA synthesis and substrate activator in sugar metabolism.
Cholestasis was associated with reduced energy levels before I/R, as reflected by 33% and 31% lower ATP and GTP levels, respectively (Fig. 8). These findings correspond to a decelerated oxidative phosphorylation rate in cholesatatic livers (Fig. 5A) due to the previously established perfusion defects (Fig. 7), where O2 availability constitutes a rate-limiting factor. Moreover, UTP levels in cholestatic livers were 52% of the UTP levels in Ctrl livers. UTP activates uridine diphosphate (UDP)-glucoronate that converts bilirubin to the more hydrophilic bilirubin diglucuronite (conjugated bilirubin), which is required for canalicular excretion of bilirubin. The low UTP concentrations in cholestatic livers correspond to the high conjugated (and low unconjugated) bilirubin concentrations in these livers (Fig. 3C, black line). Another notable observation was the substantially increased citidine diphosphate (CDP) levels as a result of cholestasis, which may signify changes in lipid/membrane biosynthesis (25).
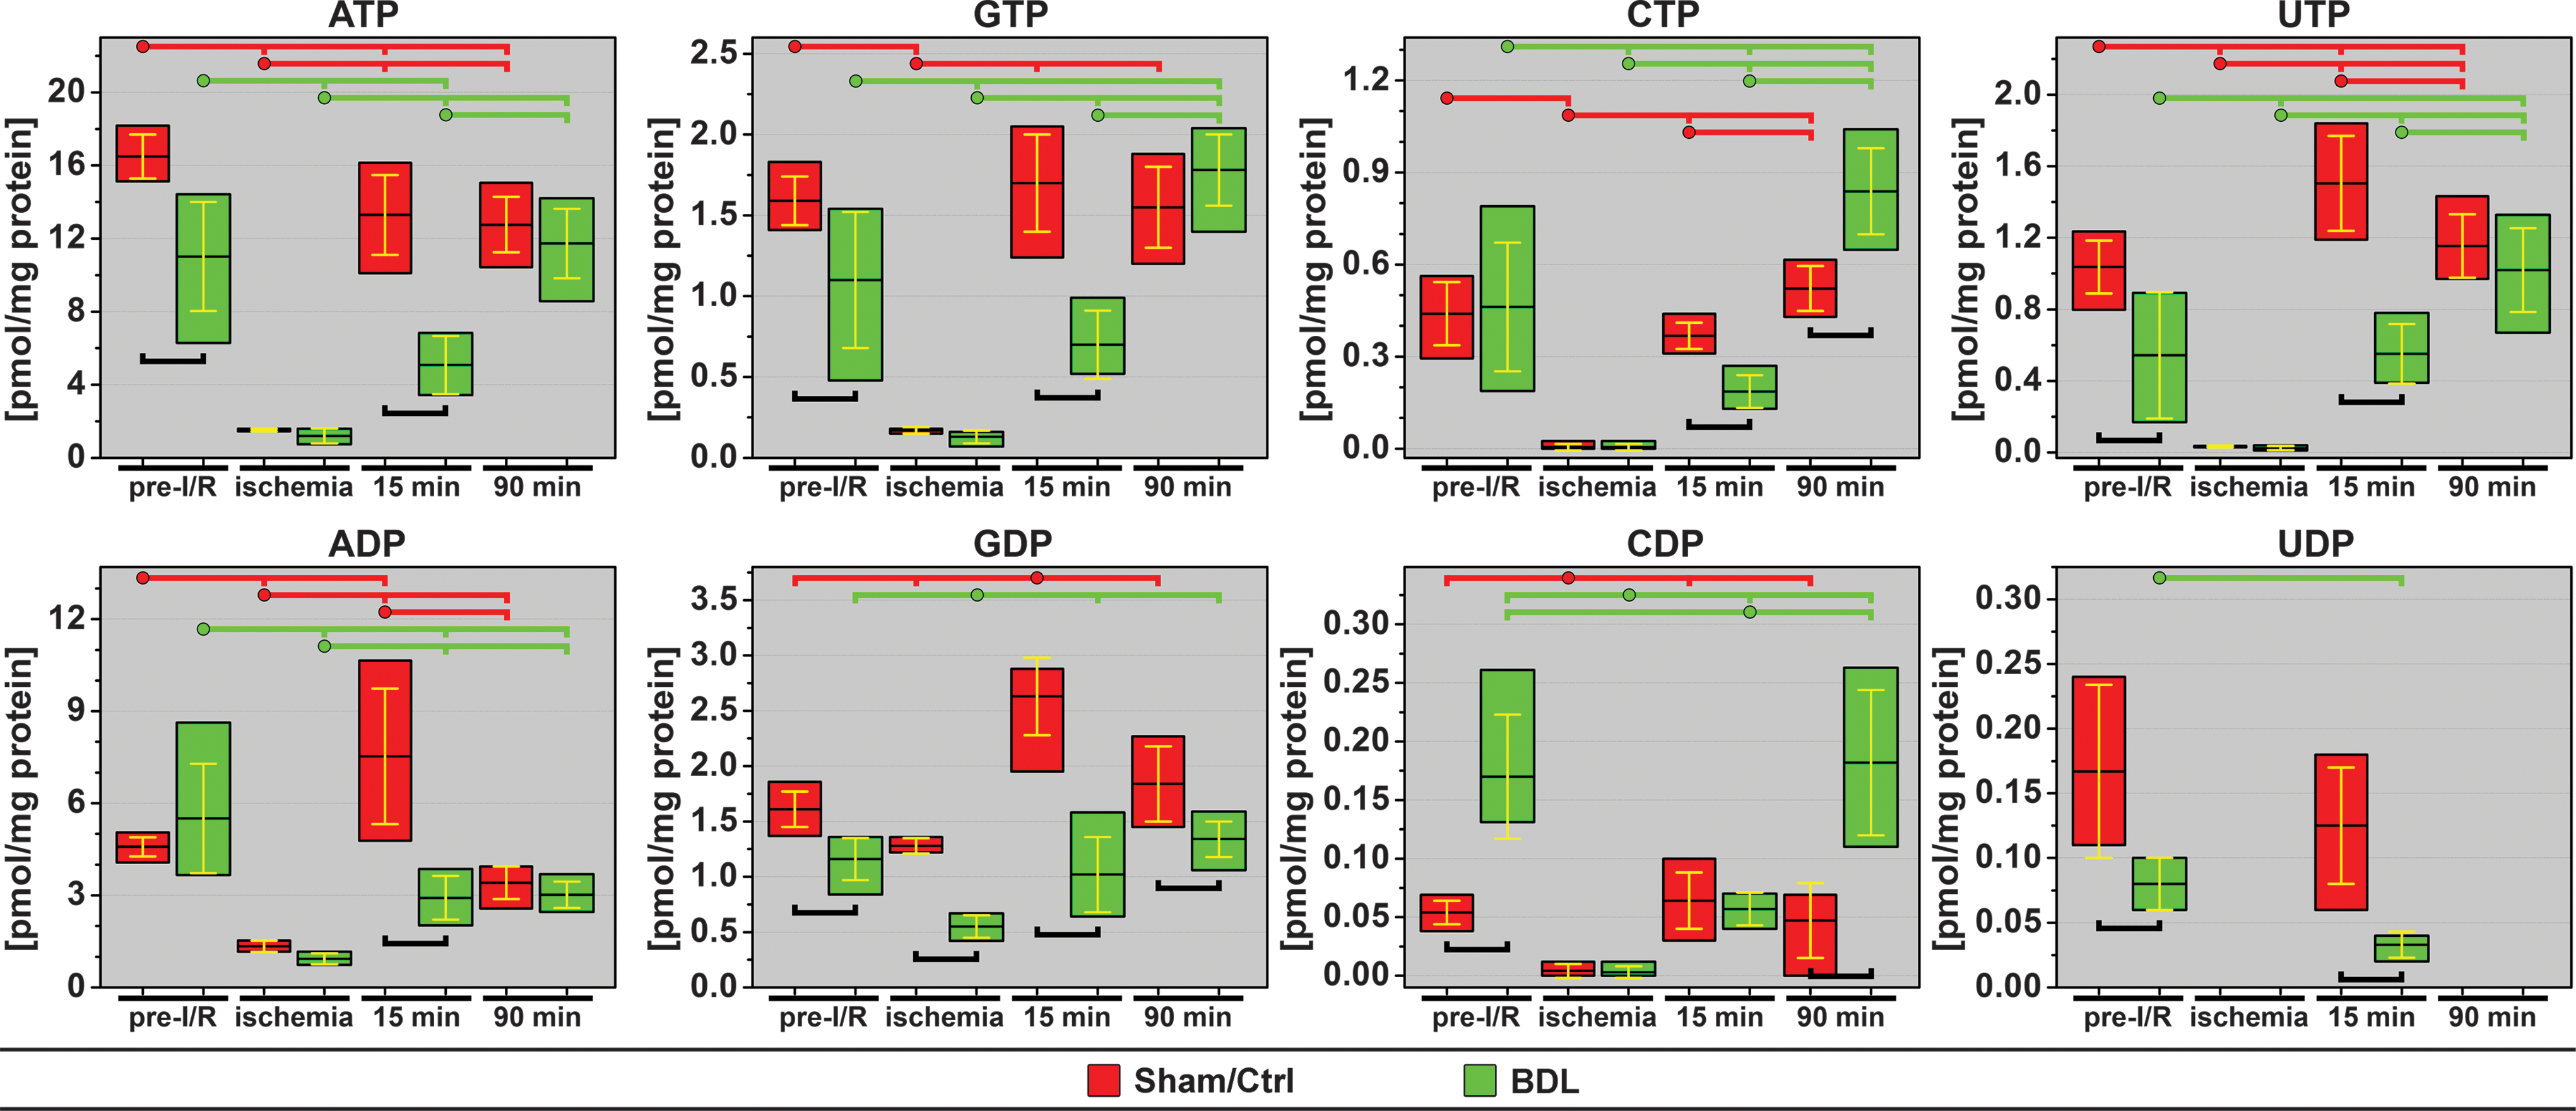
During the reperfusion phase the nucleotides exhibited a differential recovery pattern. In the Ctrl group, the energy status (ATP and GTP) had largely recovered within 15 min, which is in agreement with the postischemic oxidative phosphorylation kinetics as determined by NADH fluorescence. The recovery at 15 min was accompanied by suprabaseline (pre-I/R) adenosine and guanosine diphosphate (GDP) concentrations. The CTP and CDP levels were restored to baseline at 15-min reperfusion, whereas UTP concentrations at 15-min reperfusion were higher versus pre-I/R levels in the Ctrl group. At 90-min reperfusion, ATP levels were unaltered versus 15 min, while UTP levels were higher than before ischemia.
In the BDL+I/R group the recovery of all nucleotides at 15 min reperfusion was lagging versus Ctrl, with the exception of CDP, which is consistent with the NADH fluorescence data in the BDL+I/R group. At 90-min reperfusion the deficit in nucleotide levels between cholestatic and Ctrl livers was alleviated except for GDP (lower in the BDL+I/R group) and the cytidine nucleotides (tri- and diphosphates higher in the BDL+I/R group).
Discussion
This study evinced that cholestasis is characterized by dysfunctional hepatic microcirculation and mild hepatopathology in the form of lower energy status, hepatocellular injury and death, inflammation, and fibrosis. It was further demonstrated that I/R in cholestatic livers is associated with severe postischemic microvascular perfusion defects, a forestalled rate of oxidative phophorylation, and an impaired recovery of intrahepatic energy and metabolic status during the early reperfusion phase. Antithetically, cholestatic livers were primed to cope with the I/R-induced stress at the onset of reperfusion, despite the pre-existing microcirculatory defects and lowered energy status pre-I/R. Hepatocytes possessed sufficient antioxidative capacity, although lower than Ctrl livers, to ameliorate the damaging effects of ROS/RNS generated during reflow and an abundant reducing capacity ([NADH]) to meet energy needs through aerobic respiration. It was the impaired delivery of O2 that, on the one hand and in combination with high bilirubin levels, protected hepatocytes from deleterious ROS/RNS effects during reperfusion, yet, on the other hand, killed the hepatocytes as a result of a sustained shortage of energy and possibly metabolic substrates.
Microcirculatory perfusion defects in cholestatic livers occur as early as 2 days following biliary obstruction (5). In rats, the liver exhibits a marked increase in nonperfused sinusoids, a 35% decrease in sinusoidal diameter, a 25% decrease in sinusoidal blood flow velocity, and a 25% decrease in hepatic perfusion 3 days after BDL (31). The nonperfusion of acinar regions and the diametrical reduction of sinusoids prevail 7 days after BDL (Fig. 7A vs. B–D). The perfusion defects are attributable to a combination of factors. First, canalicular hyperdilation and the ductular response (Supplementary Fig. S1) cause a build-up of pressure and compression of hepatic vasculature due to the limited expandability of the space of Mall (22), resulting in reduced intrahepatic flow. Second, the superfluous production of ROS/RNS by infiltrated neutrophils (31) (Fig. 1D, E) shifts the balance between vasodilators (NO•, prostacyclin, CO) and vasoconstrictors (endothelin-1, thromboxane A2), which regulate hepatic blood flow (60), towards a vasoconstrictive state (52, 53). This response is bolstered by hepatic stellate cells that further contract the sinusoids (44) upon activation after BDL (28). Finally, KC enlargement (60%) (31) and proliferation (11) coincide with extrahepatic cholestasis, accounting for additional mechanical obstruction of the vascular lumen and thus exacerbation of reduced O2 delivery.
The abated delivery of O2 to cholestatic livers pre-I/R was evidenced by the elevated levels of NADH and lower intrahepatic ATP and GTP concentrations (compared to sham-operated livers). Although it is possible that the elevated mitochondrial redox states (Fig. 5A) and depleted energy stores (Fig. 8) were a result of perturbations in mitochondrial function, the data presented here strongly plead for the perfusion defects as a causal variable. If mitochondria had been functionally defective, for example, due to oxidation of ETC complexes (34) or induction of MPT (48, 49), then the vast increase in NADH fluorescence immediately after ischemia induction (Fig. 5B) would not have occurred at an ∼119% greater magnitude than in Ctrl livers and normalized to baseline within 50 min. The intactness of oxidative phosphorylation is unequivocally exemplified by the difference between preischemic and postischemic NADH fluorescence, which signifies the degree to which NADH is oxidized to the nonfluorescent NAD+ before complete relinquishment and exhaustion of the ETC's terminal substrate: O2. This is in line with earlier findings that the activity of the ETC enzymes cytochrome c reductase, succinate cytochrome c reductase, and cytochromce c oxidase are unaltered after 2-week BDL in rats (15). Furthermore, there was no evidence of notable CL peroxidation (Fig. 4), a potent trigger of MPT (43), as GSH (Supplementary Fig. S2) and bilirubin (Fig. 3C–E), which also partitions into mitochondria (42), likely provided sufficient antioxidant protection. Correspondingly, an Hsp70 stress response, triggered by intracellular oxidative stress (50), was absent.
The factors that accounted for the perfusion defects before I/R are of such nature that they are not expected to recede during I/R. In fact, the perfusion defects are expected to intensify due to increased oxidative/nitrosative stress mediated by predominantly neutrophils and KCs but also by endothelial cells and activated platelets, and the downstream ramifications thereof (55). In cholestatic rats subjected to I/R, intrahepatic perfusion is further compromised by considerable anomalies in secondary hemostasis and fibrinolysis, encompassing a decreased anticoagulation potential (↓antithrombin III) and increased embolization of thrombi (↑fibrin degradation products,↑plasminogen activator activity) (29). Fibrin degradation products (emboli) are prone to occlude microvessels, especially if these are severely constricted a priori. Accordingly, reduced microvascular blood flow, hemostasis, and an increased propensity for thromboembolism were found during I/R in cholestatic, but not Ctrl livers (Supplementary Fig. S3 and Supplementary Video S1).
The contributory magnitude of oxidative stress to the I/R-induced hepatopathology in cholestatic animals is, again, debatable in light of the data. First, at concentrations of nearly 200 μM (Fig. 3C), the antioxidative capacity of bilirubin is substantial (Fig. 3E). Second, post-I/R liver injury in noncholestatic livers is mainly mediated by neutrophils (19, 55). Although a greater extent of leukocyte adhesion was observed at 1.5-h reperfusion (Fig. 1D), it did not translate to elevated MPO activity, that is, ROS/RNS production, for up to 6 h postischemia (Fig. 1E), a reduction in total antioxidative capacity at 1.5-h reperfusion (Fig. 3A), CL oxidation (Fig. 4), or a notable stress response (Fig. 1B). Also, MPO activity levels at 6-h reperfusion were not different between the groups. However, as opposed to Ctrls, cholestatic liver damage was severe at 6-h reperfusion as evidenced by histology (Fig. S3) and plasma transaminases (Fig. 1A), strongly suggesting that mechanisms other than exuberant oxidative/nitrosative stress, that is, perfusion defects, are chiefly responsible for the liver injury. An in-depth overview of the cellular and molecular mechanisms with which the protective antioxidant properties of bilirubin and enhanced post-I/R hepatocellular damage in cholestatic livers may be explained has been included in the supplementary data (Supplementary Figs. S6, S7).
In postischemic cholestatic livers, all O2-dependent outcomes, including the slower rate of NADH oxidation (Fig. 5C), the heterogenic recovery of oxidative phosphorylation (Fig. 6 and Supplementary Fig. S5), and the lagging repletion of ATP and GTP levels (Fig. 8) are in agreement with each other and collectively point to exacerbated perfusion defects during reperfusion. O2 constitutes the rate-limiting factor for ETC activity in that the rate of ATP production is governed by mass action (54): ATP production increases when the O2 concentration rises and declines when O2 supply falls. Inasmuch as energy depletion in livers culminates in necrosis (21), that is, the major cause of cell death in cholestatic livers at 6- (Supplementary Fig. S3) and 24-h reperfusion (Fig. 2), it is both probable and plausible that, in the context of the sufficiently managed oxidative/nitrosative stress, the liver succumbed to prolonged energy deficits (Supplementary Fig. S8) and possibly nucleotide metabolite shortage (Fig. 8). It is by no means implied that other pathological processes of, for example, mitochondrial or cytosolic origin are excluded from the causal relation to liver injury during I/R. The data merely suggest that their contribution to hepatocellular death after I/R appears to be secondary to the perfusion defects under conditions of extrahepatic cholestasis. It should be further noted that we do not undervalue the inflammatory response and corollary oxidative/nitrosative stress as important contributors to post-I/R hepatopathology (55). However, in the case of cholestasis, we believe that this response becomes the dominant contributor later (>6 h reperfusion, Fig. 2) in the reperfusion phase, that is, after defects in intrahepatic bioenergetics and metabolic nucleotide cofactors have initially (<6 h reperfusion, Supplementary Fig. S3) caused extensive hepatocellular death.
Materials and Methods
Animals and experimental design
Experiments were approved by the Veterinary Department of the French Ministry of Agriculture (agreement 59-350120) and performed in accordance with NIH publication 85-23 (1985). Male Wistar rats and male Syrian gold hamsters (Harlan, Gannat, France) weighing 250–275 g and 80–100 g, respectively, were acclimatized for 1 week in a temperature-controlled room with 12-h dark/light cycles and were given free access to water and standard chow. The experimental design is provided in Supplementary Table S11.
Anesthesia
Rats were anesthetized by i.p. injection of 10 mg/kg xylazine and 75 mg/kg ketamine. Analgesic care was provided by s.c. administration of 0.03 mg/kg buprenorphine. Maintenance anesthesia (ketamine/xylazine at the above-mentioned dosages) was administered onto the intestines during intravital microscopy based on the animal's vital signs and response to pain stimuli. Hamsters were anesthetized as rats except for the maintenance anesthesia, which was given i.p.
Cholestasis induction
The liver was exteriorized after a midline laparotomy, and the common bile duct was ligated twice and dissected between the ligatures (30). In Sham and Ctrl+I/R rats, the bile duct was mobilized without ligation/dissection.
Ischemia/reperfusion
Seven days after BDL/sham operation (30), rats were anesthetized as above and mechanically ventilated (Harvard Apparatus, Holliston, MA) through a tracheotomy (2.0 ml/breath, 70 breaths/min). The core body temperature, measured with a rectal temperature probe, was maintained at 37.0°C±0.2°C with near-infrared lamps. The right carotid artery was cannulated for mean arterial pressure measurements (Kontron Instruments, Bletchley, United Kingdom), infusion of saline (10 ml/kg/h) and fluorophores, and blood drawing.
The liver was exteriorized after a relaparotomy and a nontraumatic vascular sling was placed around the afferent vessels to the median and left lateral lobes to induce±70% hepatic ischemia for 30 min. For intravital microscopy the median lobes were retracted cranially, rinsed with sterile saline, and enveloped in saran wrap to prevent desiccation. The left lateral lobe was retracted caudally onto a custom-engineered transabdominal stage, rinsed, and secured by saran wrap in a horizontal orientation for imaging. See Supplementary Figure S9 for additional details.
Biochemical assays
Sample preparation
Snap-frozen liver sections (∼100 mg) were homogenized in 1 ml of ice cold 5 mM sodium phosphate buffer, pH=6.0, with a tissue dispenser and centrifuged at 10,000×g for 10 min at 4°C. The supernatant was used to determine the parameters listed in Supplementary Table S12.
Hepatocellular damage
ALT and AST were assayed in citrate-anticoagulated plasma by clinical chemistry.
DNA laddering
DNA fragmentation was assayed in liver biopsies by gel electrophoresis (18) using DNAse-free materials (Supplementary Data).
HPLC-MS
CL was assayed from liver biopsies by HPLC-MS (14) (Supplementary Data) in the negative electrospray ionization mode. CL(14:0)4 (Avanti Polar Lipids, Alabaster, AL) with a mass/charge (m/z) of 619 was used as internal standard.
Hepatic nucleotide n-phosphate analysis
Purine and pyrimidine nucleotide triphosphates and their diphosphate derivatives were quantitated from in situ snap frozen liver biopsies by HPLC (3) (Supplementary Data).
Bilirubin
Conjugated bilirubin and total bilirubin were quantified from heparin-anticoagulated plasma samples by routine clinical chemistry.
Intravital fluorescence microscopy
Intravital fluorescence microscopy was performed with a Nikon Eclipse E800 fluorescence microscope equipped with a Peltier-cooled charge coupled device video camera (L3C65-06BPV01, E2V Technologies, Chelmsford, UK), a 4′,6-diamidino-2-phenylindole filter set (λex=360±20 nm, DM=400 nm, λem>420 nm) for NADH autofluorescence (4), a fluorescein isothiocyanate filter set (λex=480±15 nm, DM=505 nm, λem=535±20 nm) for DCF fluorescence, and a TRITC (isothiocyanate-derivatized rhodamine) filter set (λex=560±20 nm, DM=585 nm, λem=620±30 nm) for Rhodamine 6G fluorescence. Images were recorded at 25 frames/s and stored on a HDD/DVD recorder. The optical and camera settings were held constant.
In vivo ROS/RNS generation
Intrahepatic ROS/RNS generation was determined by intravital fluorescence microscopy of rat livers after systemic administration of DCFH2-DA (Invitrogen, Carlsbad, CA). A 20-mM DCFH2-DA stock solution was prepared in dimethyl sulfoxide (DMSO) and diluted with nitrogen gas-purged PBS to a 400-μM infusible solution before each experiment. I/R was applied to Ctrl and BDL animals as described above. At t=31-min reperfusion, the DCFH2-DA solution (1 ml/250g body weight; 1.6 μmol/kg) was slowly administered (0.67 ml/min) via the cannulated carotid artery to ensure first pass delivery to the liver. The nonfluorescent DCFH2-DA is enzymatically converted to the nonfluorescent DCFH2 that, upon oxidation to DCF, becomes highly fluorescent. Fluorescence images were video-recorded every 10 min during reperfusion using a 4×objective and 3-s acquisition time.
NADH autofluorescence
Parenchymal NADH autofluorescence was imaged in a field of view (FOV) of 2.3×2.7 mm (4×objective, PlanFluor). Before image acquisition the FOV was illuminated for 20 s to eliminate vitamin A autofluorescence (58). Images were acquired at predefined time points during a 3-s interval (to minimize photobleaching of NADH) for 60 min and analyzed as described below. The 60-min acquisition time was chosen because pilot experiments had revealed that, at this point, the NADH fluorescence intensities in the Ctrl+I/R and BDL+I/R groups converged to similar values.
Leukocyte adhesion
At 70-min reperfusion, 2.1 mM Rhodamine 6G (Molecular Probes, Eugene, OR) in DMSO was diluted 1000×in PBS, of which 200 μl was infused i.v. for the fluorescent labeling of leukocytes (57). Leukocyte adherence was assessed in a time span of 15 min by scanning 10 sinusoids and postsinusoidal venules per liver in an FOV of 0.54×0.45 mm (20×objective, PlanFluor). The extent of leukocyte adhesion was quantified as described below.
Image analysis
For NADH fluorescence analysis, a frame from the video sequence at each time point was isolated using Adobe Premier Pro and saved as an image file. The image files were quantified for Itot and average intensity (Iave) in SigmaScan (Systat Software, San Jose, CA). The Itot values at each time point were normalized to t=pre-I/R values and plotted as a function of time to portray relative changes in the NAD+/NADH redox environment. Spatial and temporal heterogeneities during I/R were quantified by intensity histogram analysis (SigmaScan) of the image files (Supplementary Fig. S10).
Alternatively, the image files were segmented into a 3×3 grid comprising segments of equal dimensions using a preprogrammed macro in Photoshop and each segment was analyzed for Itot and Iave. The Iave of each segment at each time point was normalized (nIave) to pre-I/R values of the respective segment, where nIave at pre-I/R=100, and the standard deviation (SD) of the 9 nIave data points per image was calculated for each time point per animal. The nIave SDs were averaged for all animals in an experimental group per time point to calculate the heterogeneity index (Supplementary Fig. S10).
Leukocyte adhesion was quantified offline by counting the number of adherent Rhodamine 6G-positive cells (stationary >20 s) in a blinded fashion. The number of adherent leukocytes was expressed per mm2 of blood vessel surface. For the vessel surface calculations, the vessel of interest was contoured in Photoshop and the contoured vessel was quantified for pixel area in SigmaScan. The actual dimensions of the vessel were derived from the known dimensions of a single pixel.
For the DCF fluorescence experiments, isolated video frames were quantified for Itot in SigmaScan and normalized to Itot at t=30 min reperfusion.
Flow cytometry
Flow cytometry was employed to determine the extent to which the intracellular conversion of DCFH2 to DCF in red blood cells and platelets contributes to DCF fluorescence after systemic administration of DCFH2-DA. For these purposes, DCFH2-DA diluted in PBS was infused into hamsters via the subclavian vein (12) (200 μl of 3 mM DCFH2-DA per 100 g body weight; 6.0 μmol/kg) and allowed to circulate for 1, 15, or 45 min (n=4/group). Blood was collected after jugular vein puncture and centrifuged to separate red blood cells and platelets. Red blood cells and platelets were washed thrice in PBS and assayed by flow cytometry for DCF fluorescence. Detailed information is provided in the Supplementary Data.
Spectrofluorometric analysis of bilirubin antioxidant capacity
A spectrofluorometric assay was developed to determine the antioxidant properties of bilirubin in vitro in analogy to the in vivo experiments. DCFH2-DA was deacetylated, and the resulting DCFH2 was purified (supplementary data) and stored in methanol at a 40-mM stock concentration. A cuvette containing a magnetic stirrer was placed in the temperature-controlled (37°C) cuvette holder of a fluorescence spectrometer (Cary, Varian, Palo Alto, CA). At t=−5 min, 1449 μl of 100 mM HEPES buffer (Sigma-Aldrich, St. Louis, MO), pH=7.4, was added and allowed to equilibrate to 37°C. At t=0 min, fluorescence emission acquisition was started using λex=500±5 nm and λem=523±5 nm, that is, the absorption and emission maxima of DCF, respectively. At t=1 min, 1 μl of DCFH2 was added, followed by the addition of 20 μl of bilirubin (Sigma-Aldrich) or solvent at t=2 min, 20 μl of 300 mM H2O2 (Merck KGaA, Darmstadt, Germany) at t=3 min, and 10 μl of 30 mM iron (II) sulfate (Sigma-Aldrich) at t=10 min. The addition of 180 μM bilirubin had no impact on the fluorescence (results not shown). Experiments were performed in triplicate. Data were normalized to the mean fluorescence intensity between t=2 and 3 min and averaged. Additional details are provided in the Supplementary Data.
Histology
Formalin-fixed, paraffin-embedded liver sections (5 μm) were stained with hematoxylin and eosin and imaged by light microscopy. The extent of necrosis was quantified in 10 random FOVs per liver (20×magnification) by a hepatopathologist and expressed as a percentage of the total FOV surface (35).
Polarization microscopy was performed using linear polarizers to image the localization of birefringent collagen in nonbirefringent liver parenchyma.
Caspase-3 immunostaining was performed using an anti-cleaved caspase 3 antibody (30) (Cell Signaling Technology, Danvers, MA). The primary antibody was labeled with a poly-horseradish peroxidase-conjugated secondary antibody (Invitrogen) and revealed by NovaRED peroxidase substrate (Vector Laboratories, Burlingame, CA). Sections were counterstained with hematoxylin to allow quantification of the percentage of apoptotic cells by light microscopy.
Statistical analysis
Statistical analysis was performed in GraphPad Prism according to Supplementary Table S13. Results are presented as mean±SD. Kurtosis (supplementary data) was determined in SPSS.
Footnotes
Acknowledgments
The authors thank Prof. Julio Turrens and Bruno Stieger for critically reviewing the article, Prof. Fibo ten Kate (Department of Pathology) for the histological analysis/quantification, Albert van Wijk and Esther Posno-Peltenburg for analytical support, Mohammed Bozia for image processing and leukocyte quantification, and our graduate students for their critical review of the article. We are grateful to the reviewers for the useful feedback on the article. M.H. personally thank Jono Grant, Tony McGuinness, and Paavo Siljamäki for helping him raise the initial level of the article to above and beyond.
Author Disclosure Statement
None of the authors have any actual or potential conflicts of interest to disclose.
Abbreviations Used
References
Supplementary Material
Please find the following supplemental material available below.
For Open Access articles published under a Creative Commons License, all supplemental material carries the same license as the article it is associated with.
For non-Open Access articles published, all supplemental material carries a non-exclusive license, and permission requests for re-use of supplemental material or any part of supplemental material shall be sent directly to the copyright owner as specified in the copyright notice associated with the article.