
Abstract
Introduction
MtDNA is a double-stranded circular molecule of 16,569 bp, and because of lack of protective histones, it is 10–20 times more vulnerable to oxidative damage than nuclear DNA (nDNA) (24, 33, 43). In the pathogenesis of diabetic retinopathy, retinal mtDNA damage is increased, mitochondria copy numbers are decreased, and the genes encoded by mtDNA become subnormal (25, 26, 38). MtDNA has a noncoding region, the displacement loop (D-loop), which contains essential transcription and replication elements. The D-loop helps in the mtDNA replication by serving as a promoter for heavy strands (4). This, mainly unwound region, is highly vulnerable to ROS, and provides control sites for mtDNA replication (28, 35, 41). Frequent mutations in the D-Loop regions are observed in various diseases including adenocarcinomas and other cancers (28, 32, 44). How diabetes affects the D-loop in the retina remains to be explored.
Innovation
In the pathogenesis of diabetic retinopathy, retinal mitochondria are dysfunctional, their copy numbers are decreased, and DNA is damaged. Here, we show that the damage to the mitochondrial DNA (mtDNA) is not uniform; the displacement loop region, the site for mtDNA replication and transcription, experiences more damage as compared with the cytochrome B, and the mtDNA replication/repair system is compromised. Targeting mtDNA replication/repair machinery has the potential to regulate mitochondria homeostasis, and to inhibit the development of diabetic retinopathy.
The maintenance/replication of the mtDNA is critical for the mitochondria to function properly, and mitochondria are equipped with excellent replication machinery (9, 12). The nuclear-encoded mtDNA replication enzymes, DNA polymerase gamma (POLG) (with two subunits-POLG1 and POLG2), and mtDNA helicase (Twinkle) form the minimal replisome required for replication (15, 39). POLG1 has two enzymatic activities: a C-terminal polymerase and an N-terminal “proofreading” exonuclease, and Twinkle serves as a DNA unwinding enzyme (42, 45). Mutations in POLG and Twinkle have been reported in patients with mitochondrial disorders; however, their role in the pathogenesis of diabetic retinopathy remains unclear.
The aim of this study is to investigate the effect of diabetes on the damage to the D-loop region, and on the replication/repair machinery in the retina. Our hypothesis is that in diabetes due to the damaged D-loop, the mtDNA replication system is impaired, and this plays a major role in retinal mtDNA damage. Due to increased susceptibility of mtDNA to ROS, we have investigated D-loop damage in the diabetic mice in which superoxide levels are genetically manipulated by overexpressing MnSOD (Tg). To examine the effect of hyperglycemia specifically on retinal vascular cells, key parameters are investigated in the isolated retinal endothelial cells, the cells that demonstrate a histopathology characteristic of diabetic retinopathy, in which POLG1 is manipulated.
Results
Diabetes damages retinal mitochondrial D-loop and impairs the replication machinery
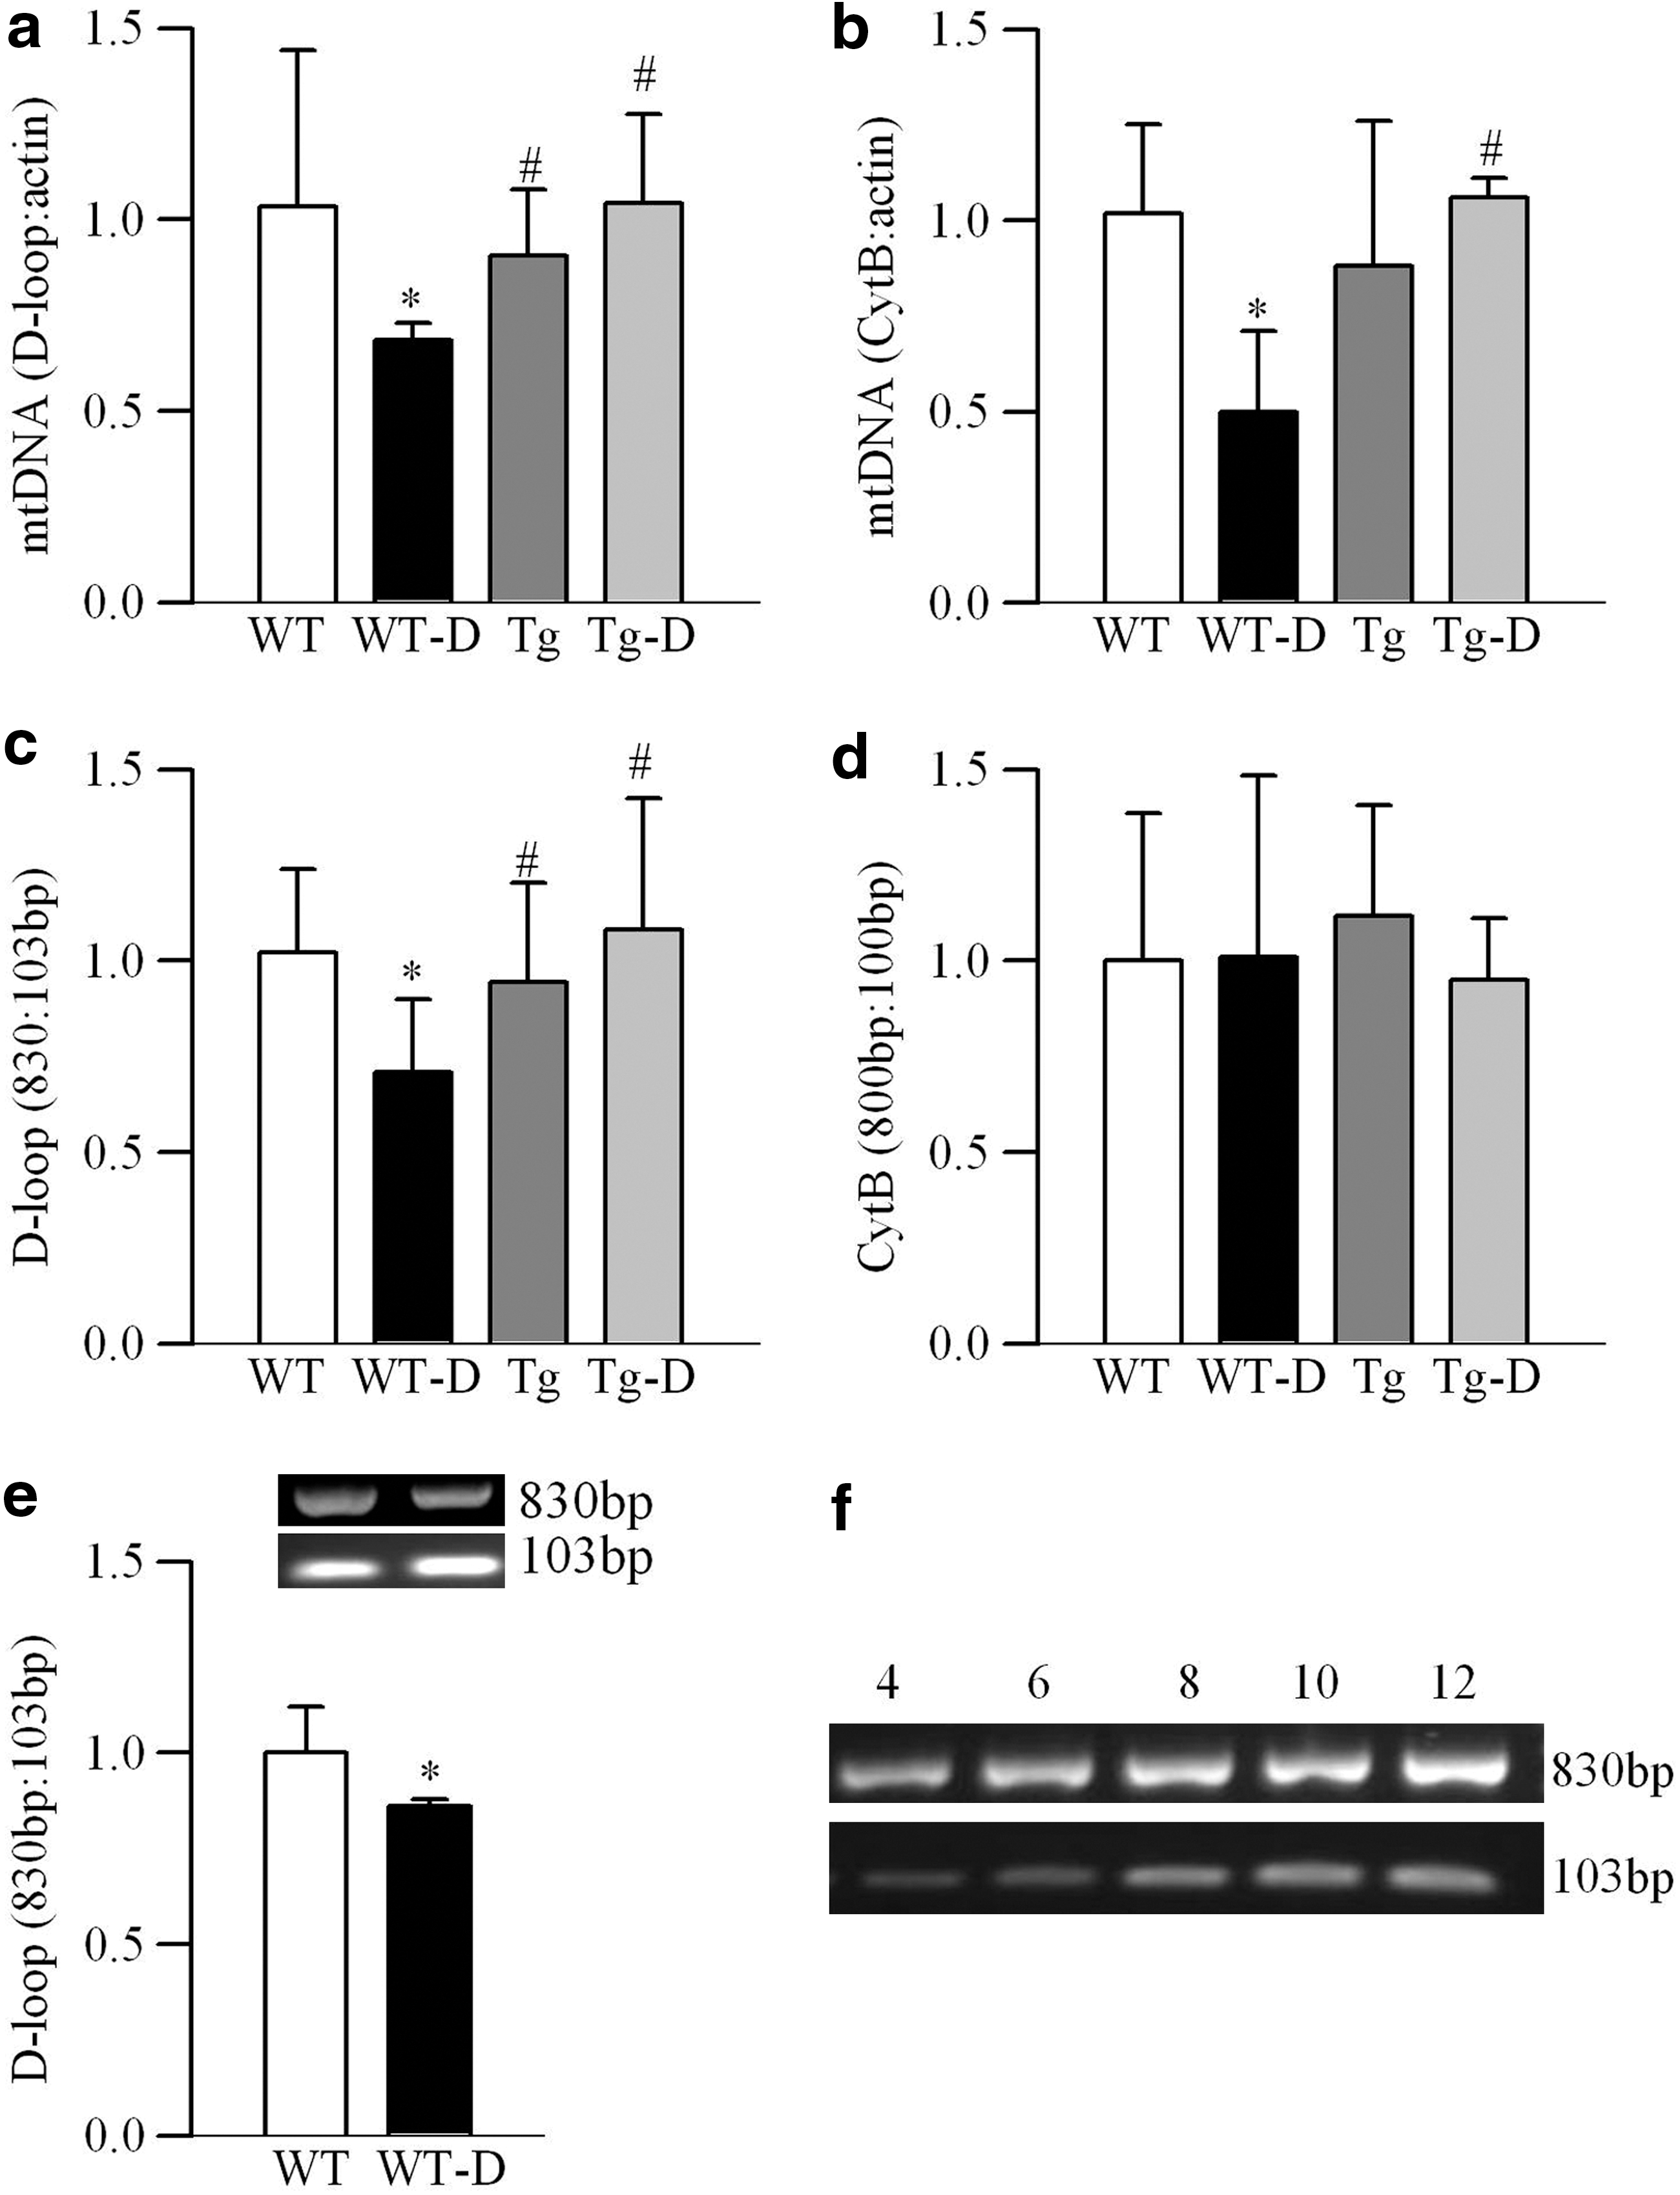
Amplifications of D-loop, normalized to that of β-actin of nDNA, was reduced by ∼35% in the retina of wild-type (WT) diabetic mice compared with WT-normal mice (Fig. 1a). Consistent with our previous report (38), the amplification of the cytochrome B (CytB), a marker of mitochondria copy number (27), normalized to that of β-actin, was also reduced by ∼50% (Fig. 1b). Similarly, the ratio of semi-long fragment (∼830 bp) to short fragment (∼103 bp) of the D-loop region was decreased by 30% (Fig. 1c), but the ratio of 800 to 100 bp of the CytB region remained unchanged (Fig. 1d), suggesting that the D-loop region experiences higher mutation/damage in diabetes compared with the CytB region. Consistent with the retinal D-loop damage, its microvasculature also showed increased D-loop damage in diabetes (Fig. 1e).
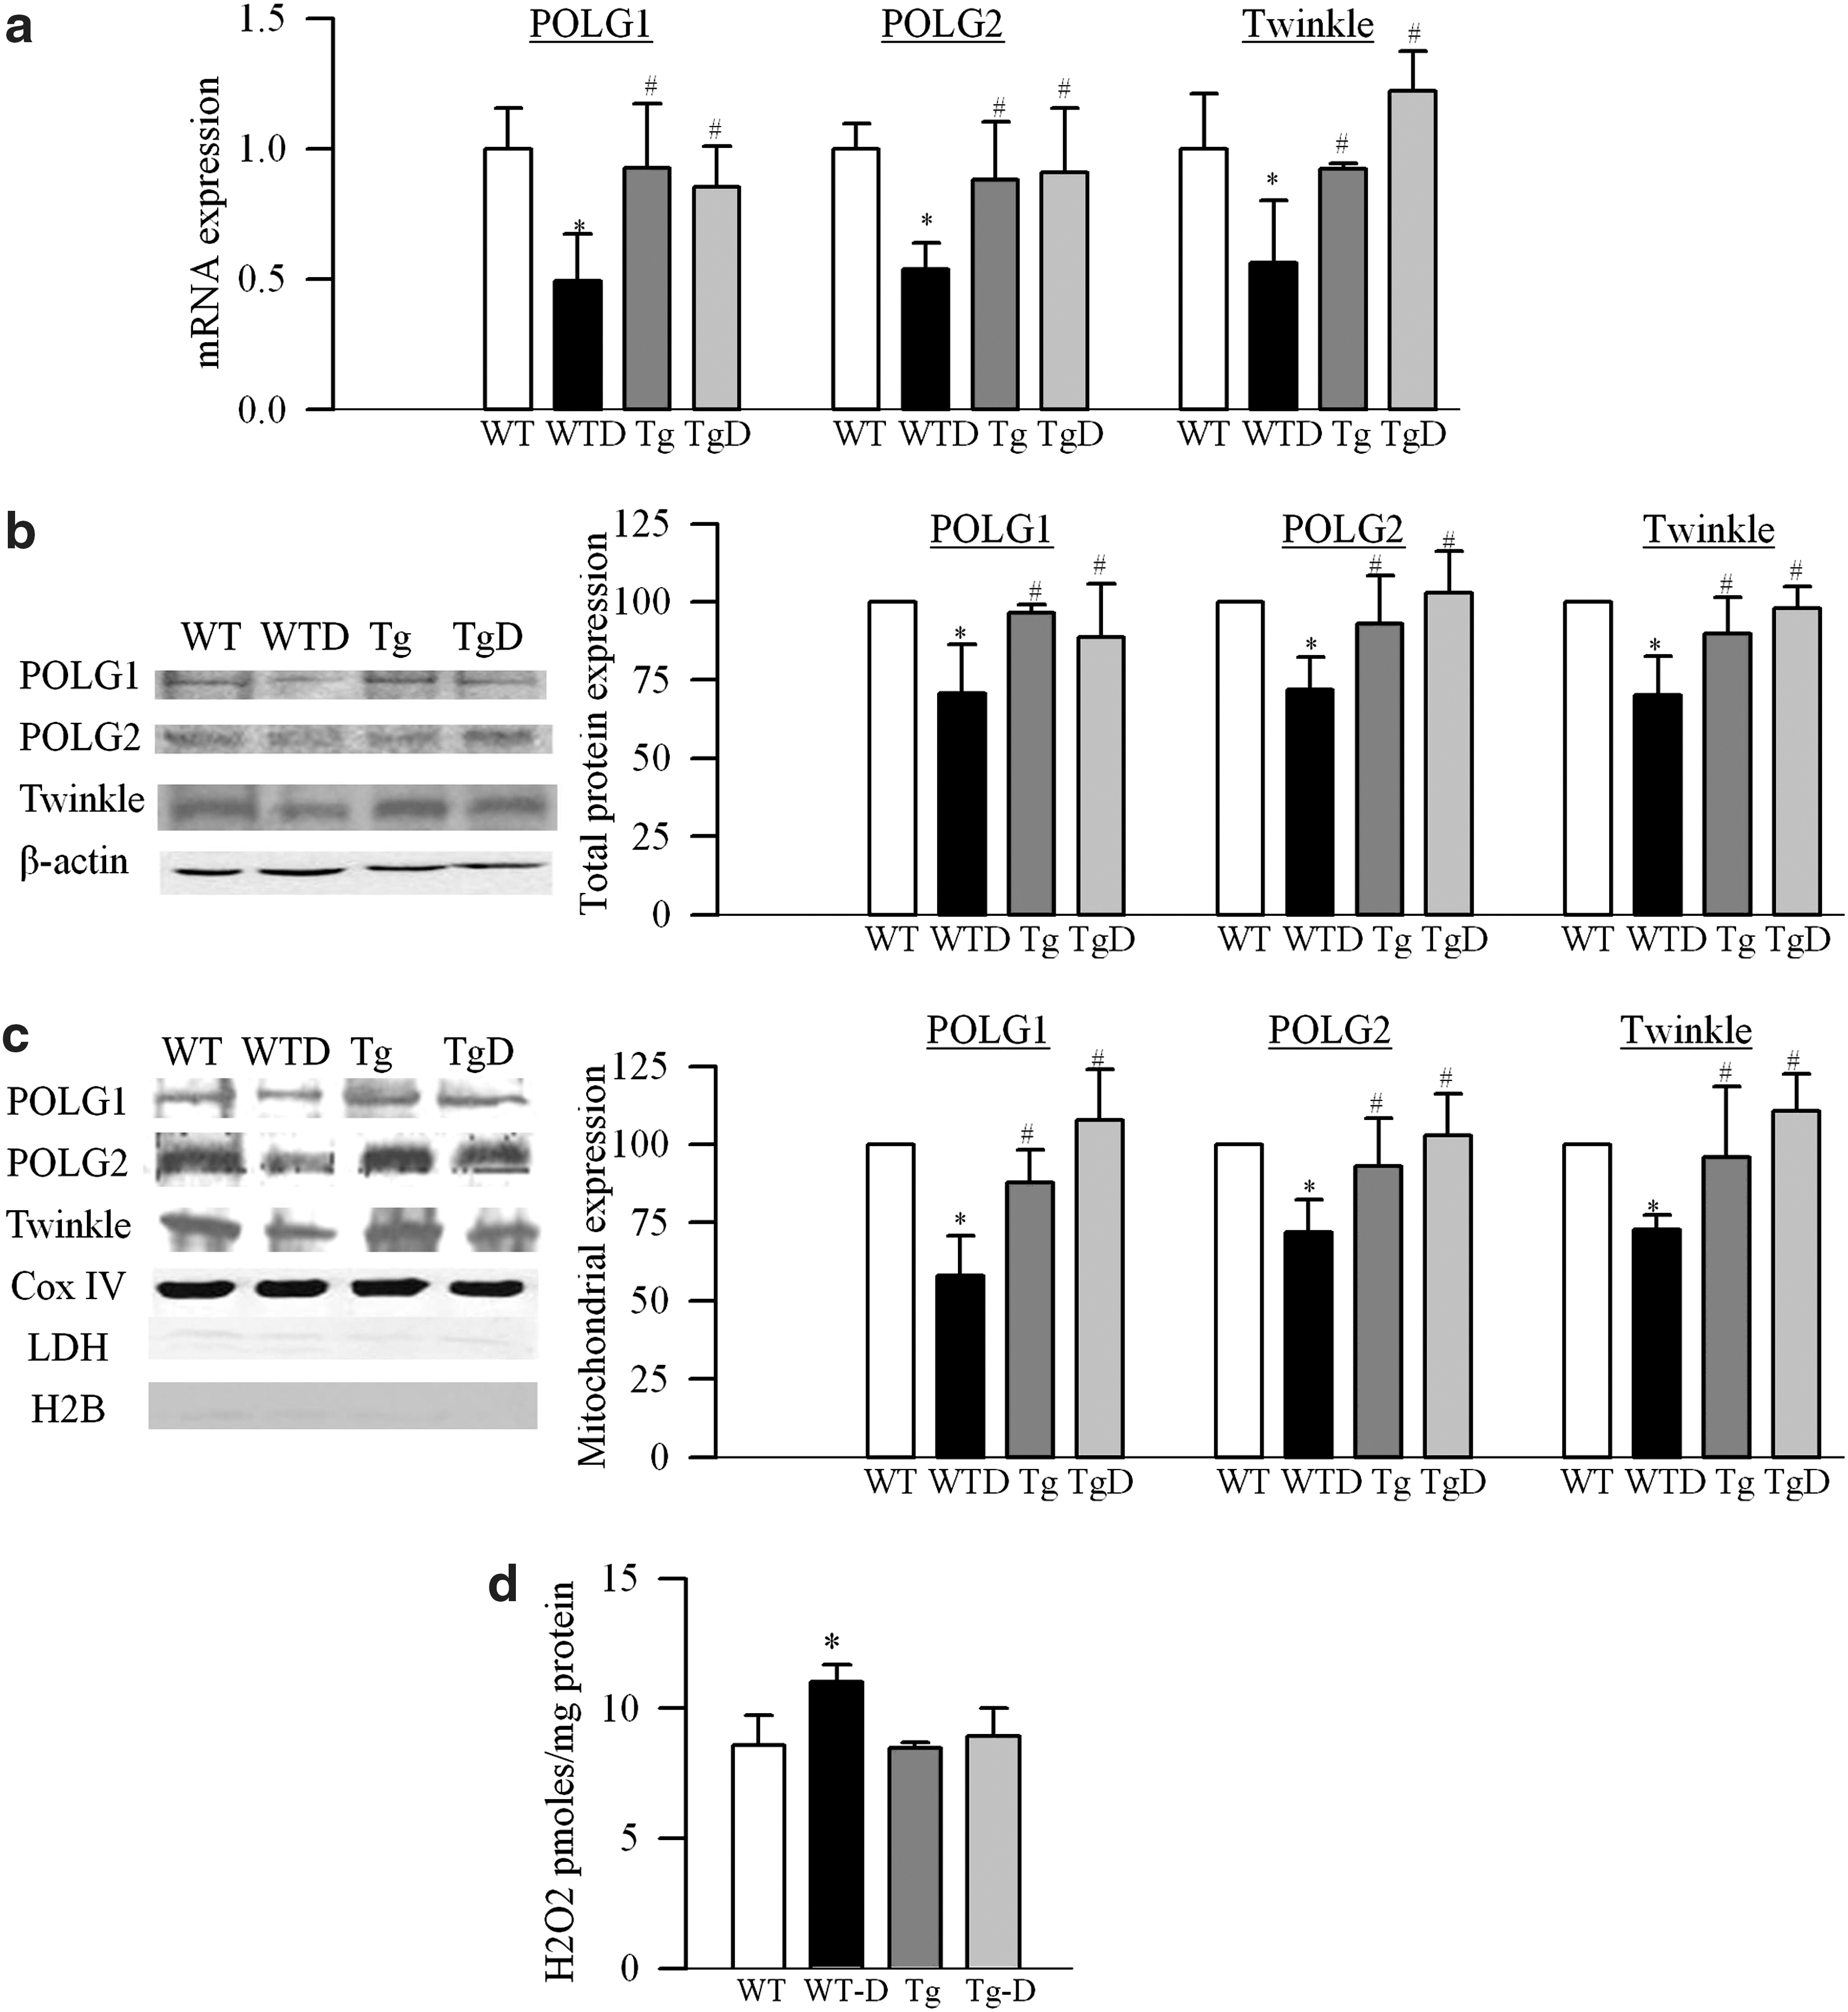
To explore the possible mechanism for increased damage at the D-loop region, gene and protein (total and mitochondrial) expressions of mtDNA replication enzymes were quantified. Diabetes decreased the gene and protein expressions of retinal POLG1, POLG2, and Twinkle by 35%–45%, and decreased their mitochondrial accumulation, the site of their action (Fig. 2a–c).
MnSOD protects the retina from diabetes-induced damage to mtDNA and replication machinery
As shown in Figure 1a, b, MnSOD overexpression ameliorated diabetes-induced decrease in the amplification of both D-loop and CytB regions, and the values from Tg-diabetic mice were significantly higher. Similarly, Tg-diabetic mice were also protected from D-loop damage (Fig. 1c, d), and the expression of POLG1 and POLG2 was significantly higher compared with the values obtained from WT-diabetic mice (Fig. 2a–c). Figure 2d shows that overexpression of MnSOD did not have any effect on retinal H2O2 levels.
Retinal endothelial cells
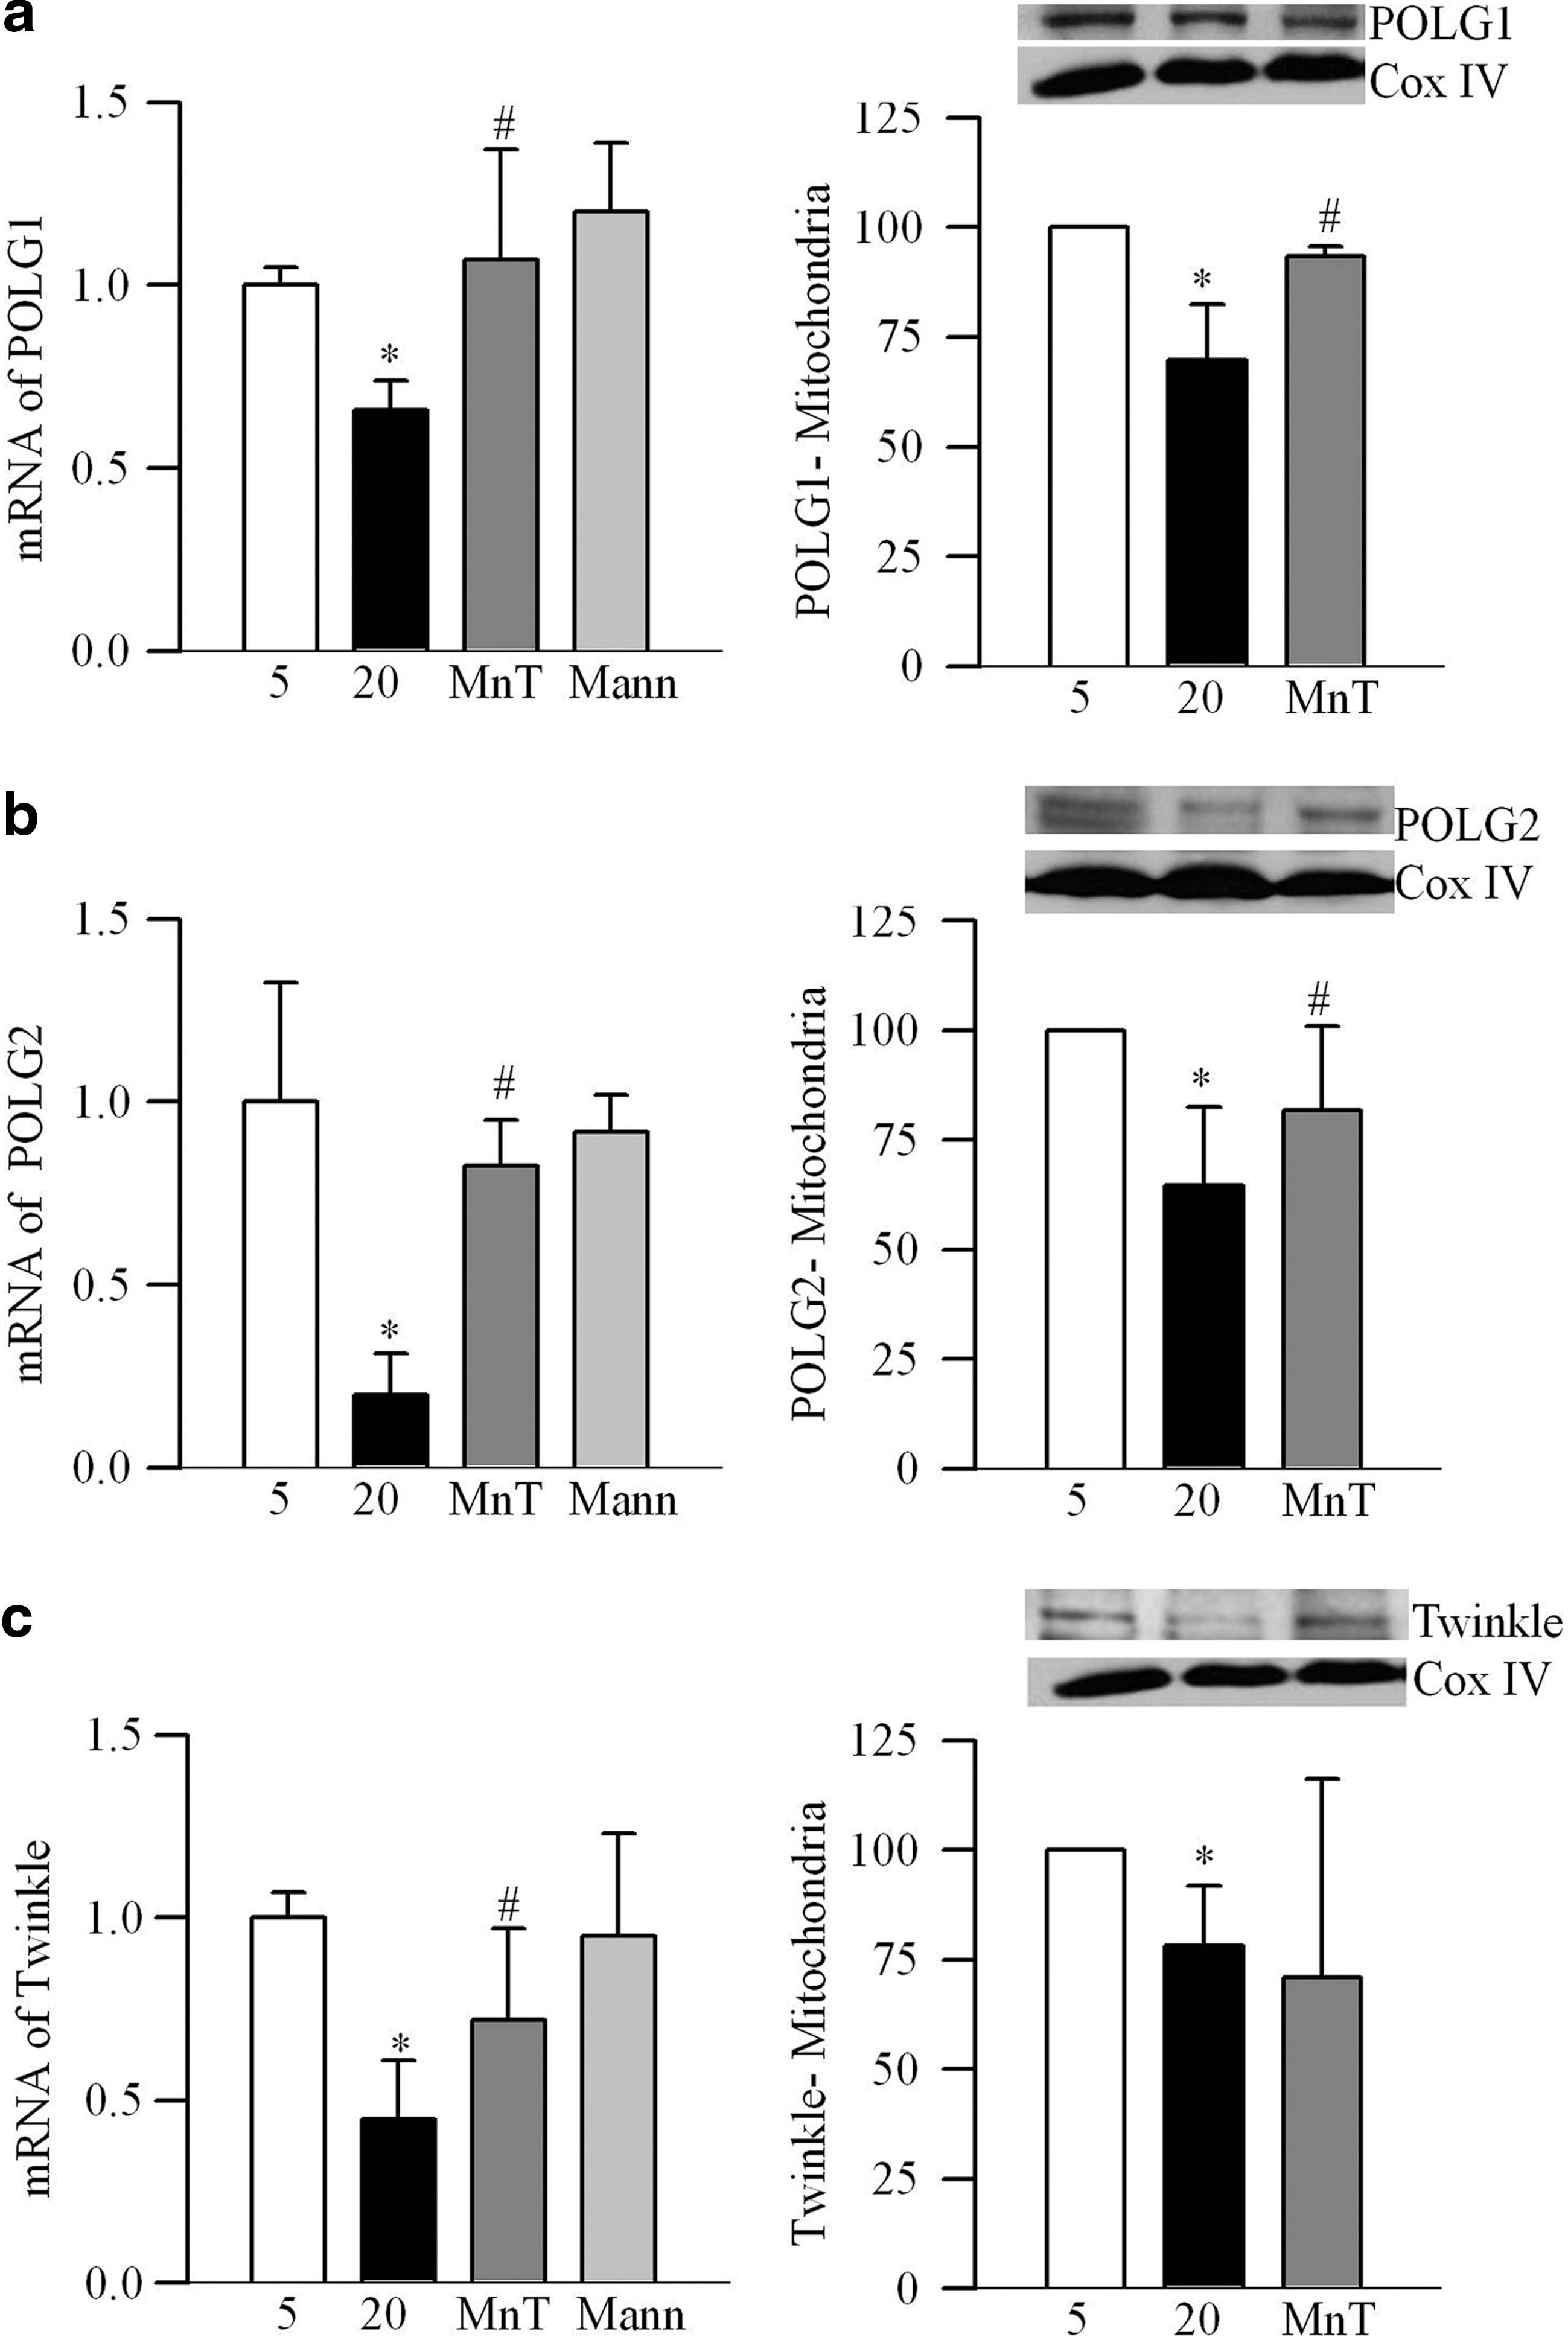
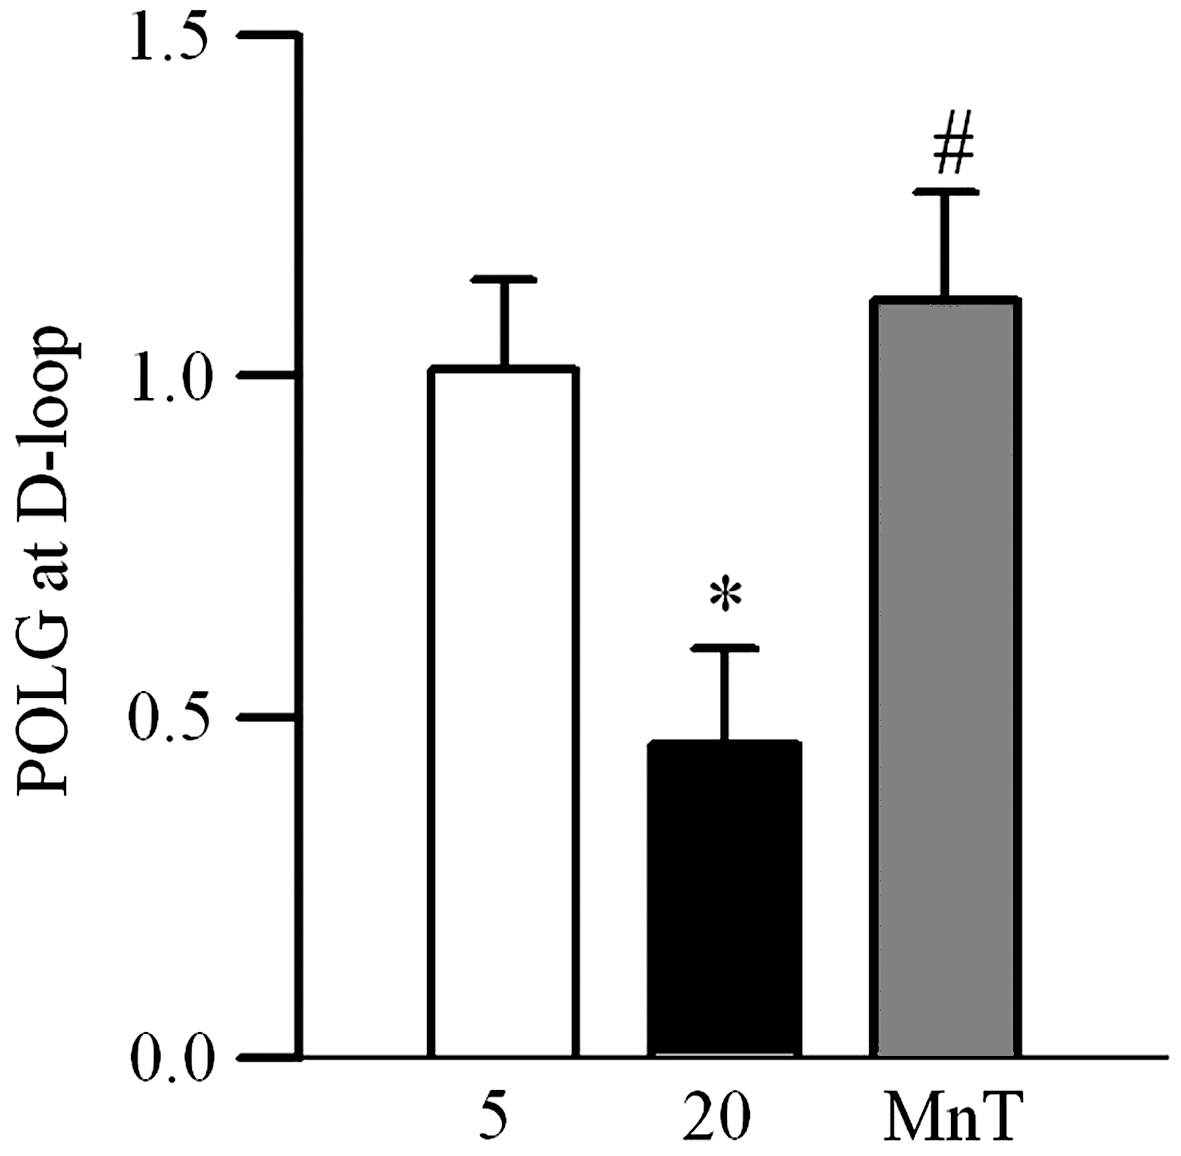
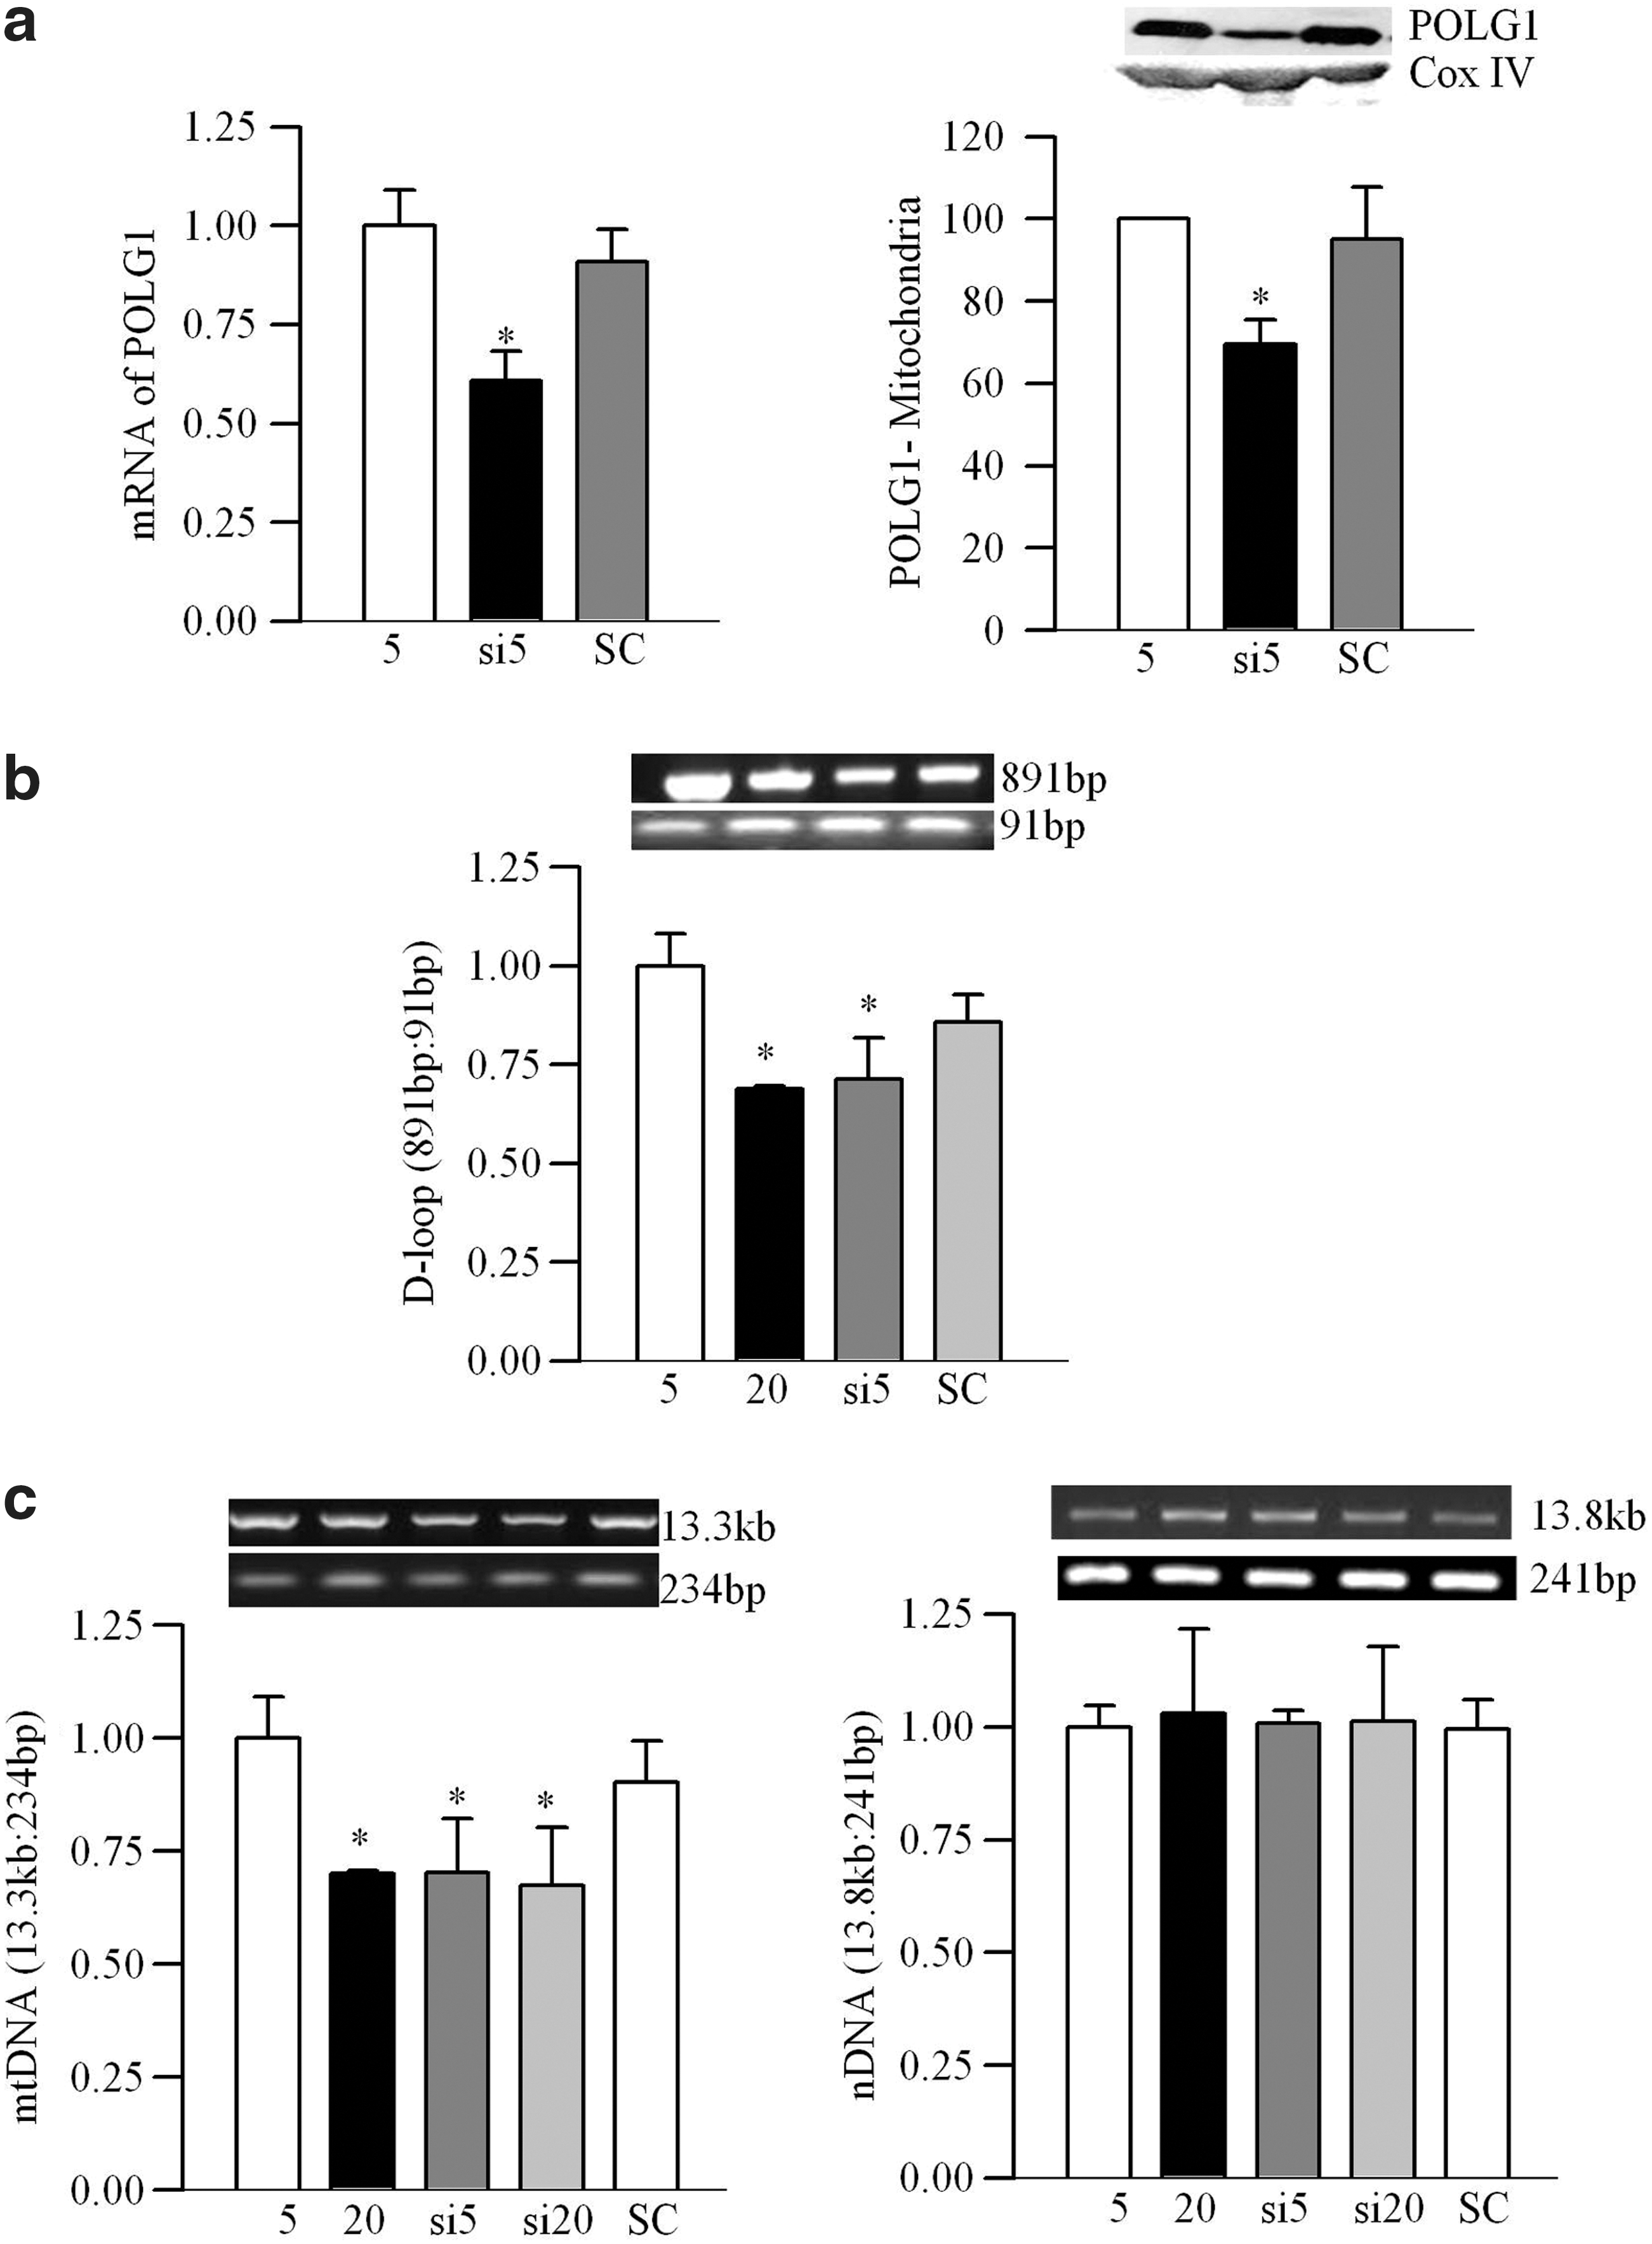
Abnormalities in retinal mtDNA replication machinery were confirmed in bovine retinal endothelial cells (BRECs). As shown in Figure 3a–c, high glucose decreased transcripts of POLG1, POLG2, and Twinkle by 35%–75%, and their mitochondrial expressions were significantly decreased, compared with the values obtained from cells exposed to normal glucose (p<0.05; Fig. 3). Scavenging of superoxide by MnSOD mimic manganese (III) tetrakis (4-benzoic acid) porphyrin chloride (MnTBAP), ameliorated glucose-induced decrease in the transcripts of POLG1, POLG2, and Twinkle and their mitochondrial accumulation compared with the cells incubated in high glucose alone (Fig. 3). Figure 4a shows 50% less POLG1 immunostaining in the mitochondria region in cells incubated in 20 mM glucose compared with 5 mM glucose, confirming decreased POLG1 mitochondrial localization.
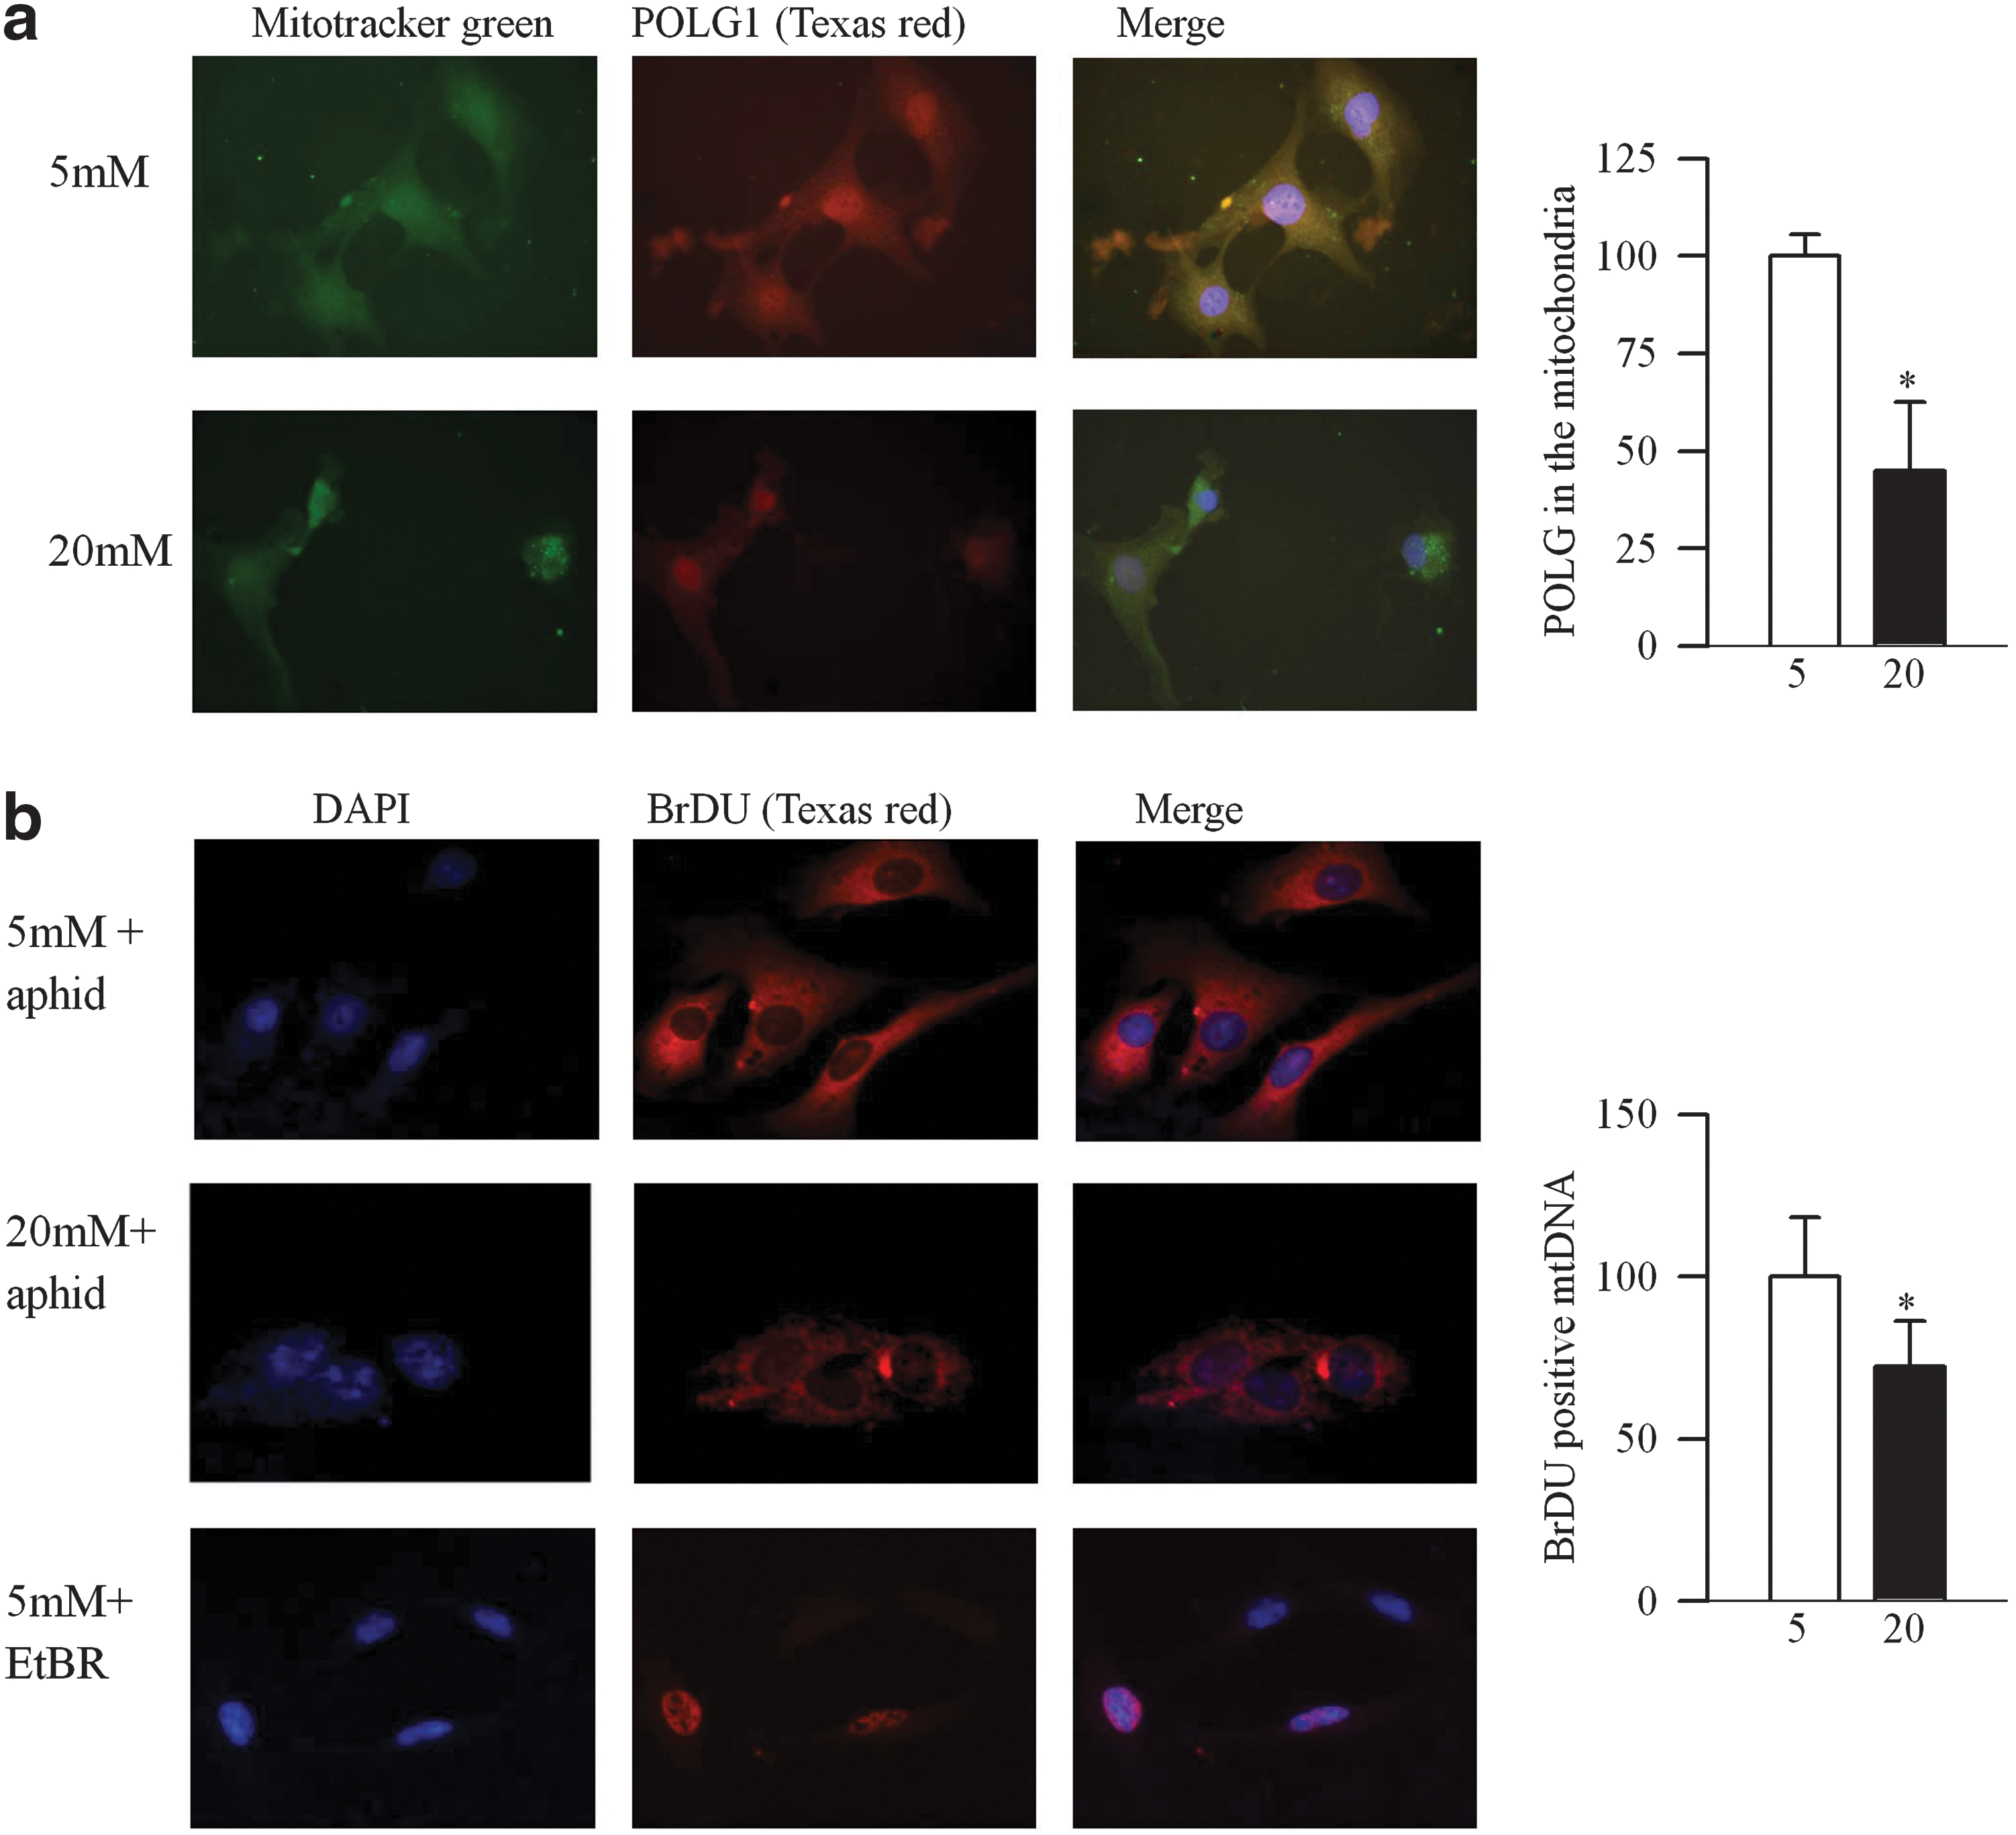
To evaluate the effect of high glucose on functionally active POLG, newly synthesized mtDNA strands were quantified by incorporation of bromodeoxyuridine (5-bromo-2′-deoxyuridine) (BrDU). Addition of aphidicolin, a selective inhibitor of DNA polymerase α, resulted in BrDU-positive fluorescence in the mitochondria, suggesting the presence of newly synthesized mtDNA. However, exposure of cells to 20 mM glucose decreased BrDU-positive fluorescence by ∼35%. As a control, cells in 5 mM glucose with an inhibitor of POLG, ethidium bromide (EtBr), showed BrDU incorporation only in the nDNA (Fig. 4b).
To assess the binding of the D-loop to POLG1, chromatin immunoprecipitation (ChIP) of POLG1 at the D-loop was performed, and Figure 5 shows that high glucose decreases the binding by 50%. Inclusion of MnTBAP prevented glucose-induced loss in the binding capacity of POLG1, the values obtained from the cells in high glucose supplemented with MnTBAP were similar to those from normal glucose.
Effect of genetic manipulation of POLG1
To further establish the role of POLG1 in mtDNA damage, POLG1 was silenced in BRECs using POLG1-siRNA. mRNA levels and mitochondrial expression of POLG1 were 30%–35% lower in the cells transfected with POLG1-siRNA compared with the untransfected cells or cells transfected with scrambled RNA (Fig. 6a). POLG1-siRNA also increased D-loop damage, and this was similar to that observed in the untransfected cells exposed to high glucose (Fig. 6b). Similarly, the relative amplification of long (13.3 kb) to short (234 bp) fragments of mtDNA was also significantly decreased. The values obtained from the transfected cells in 5 mM glucose were similar to those obtained from untransfected cells in 20 mM glucose, but were significantly different from the untransfected cells in 5 mM glucose (Fig. 6c).
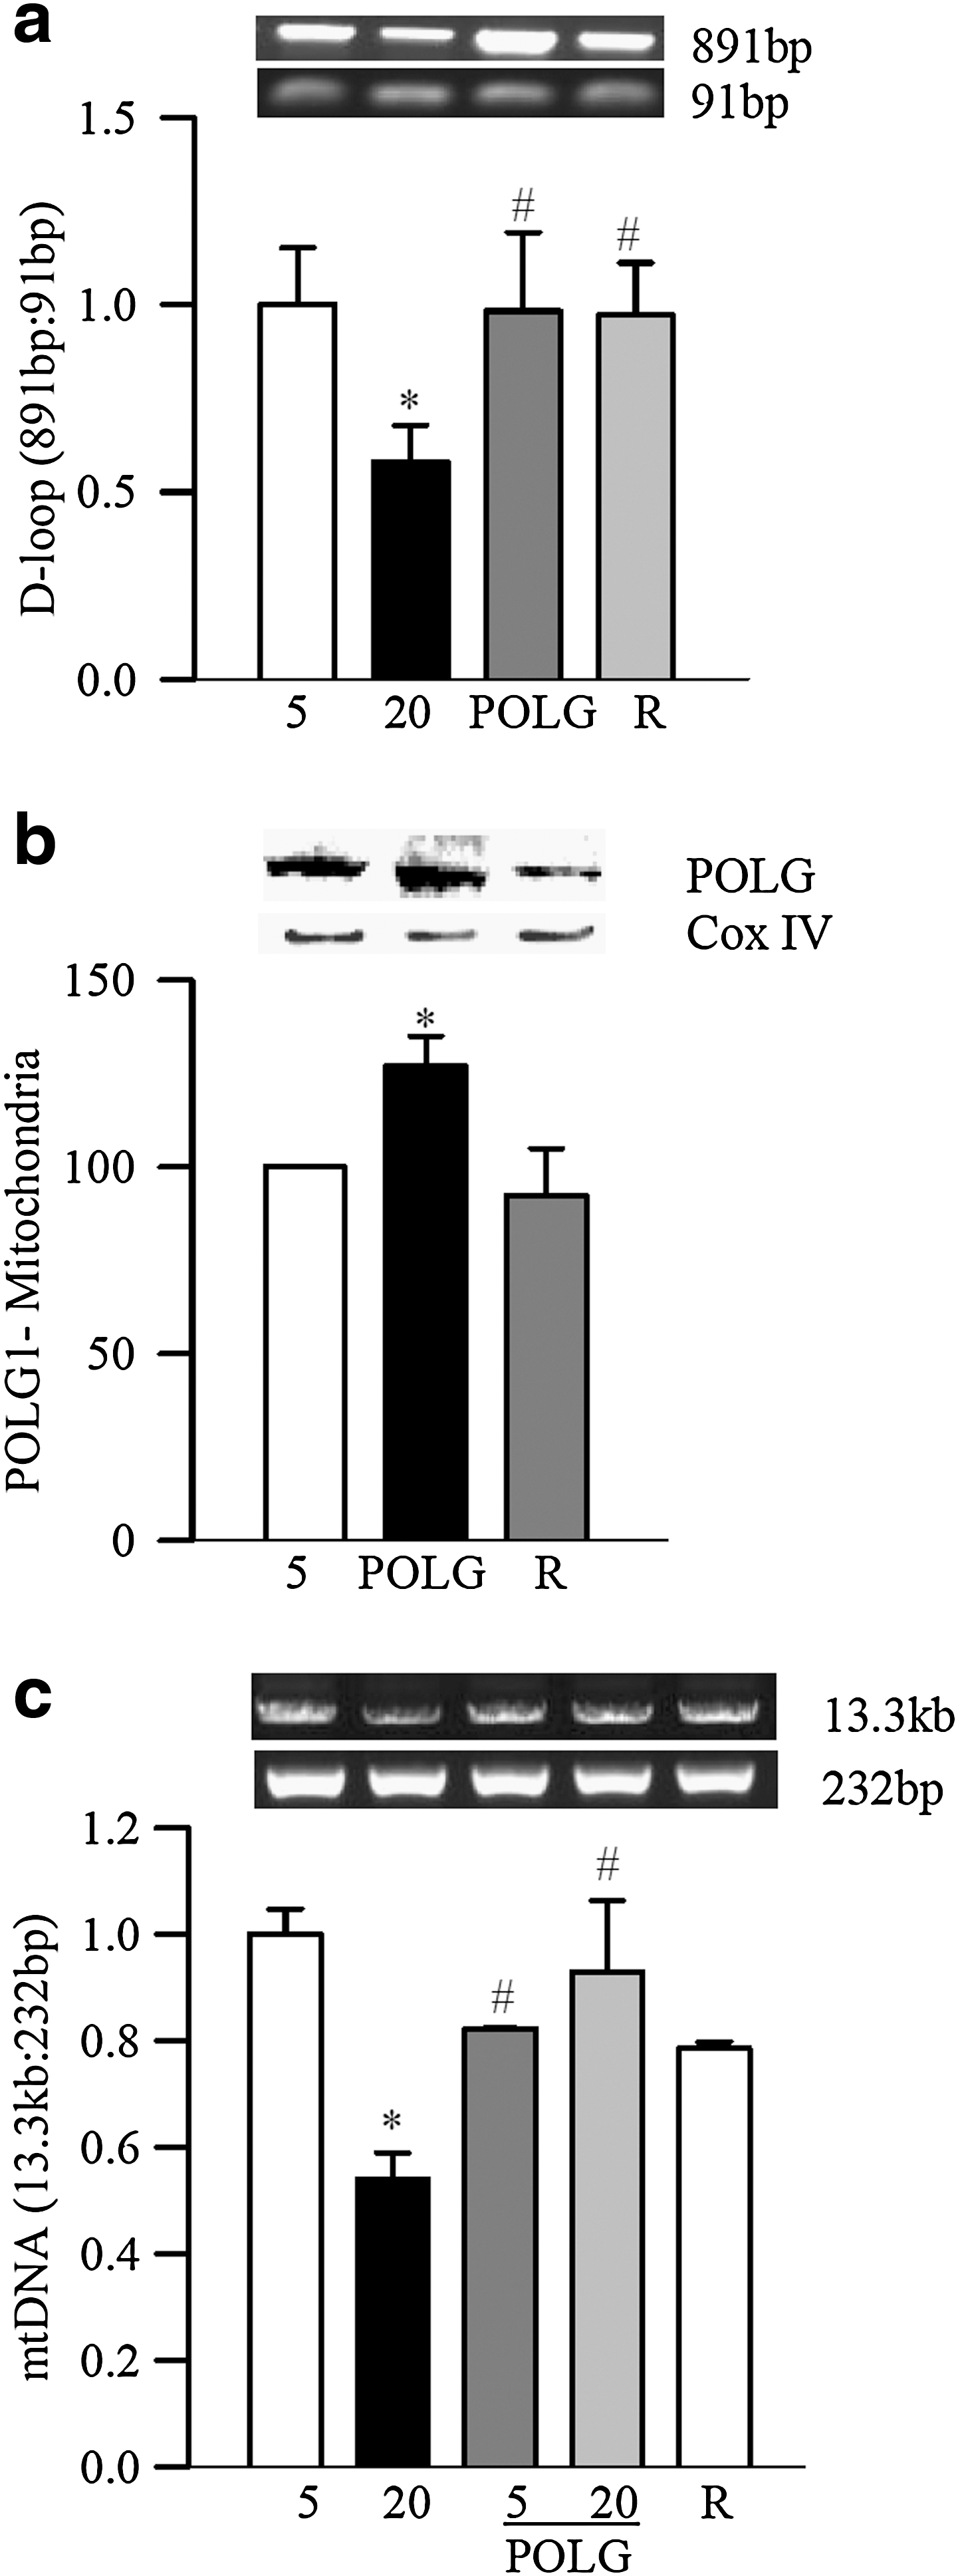
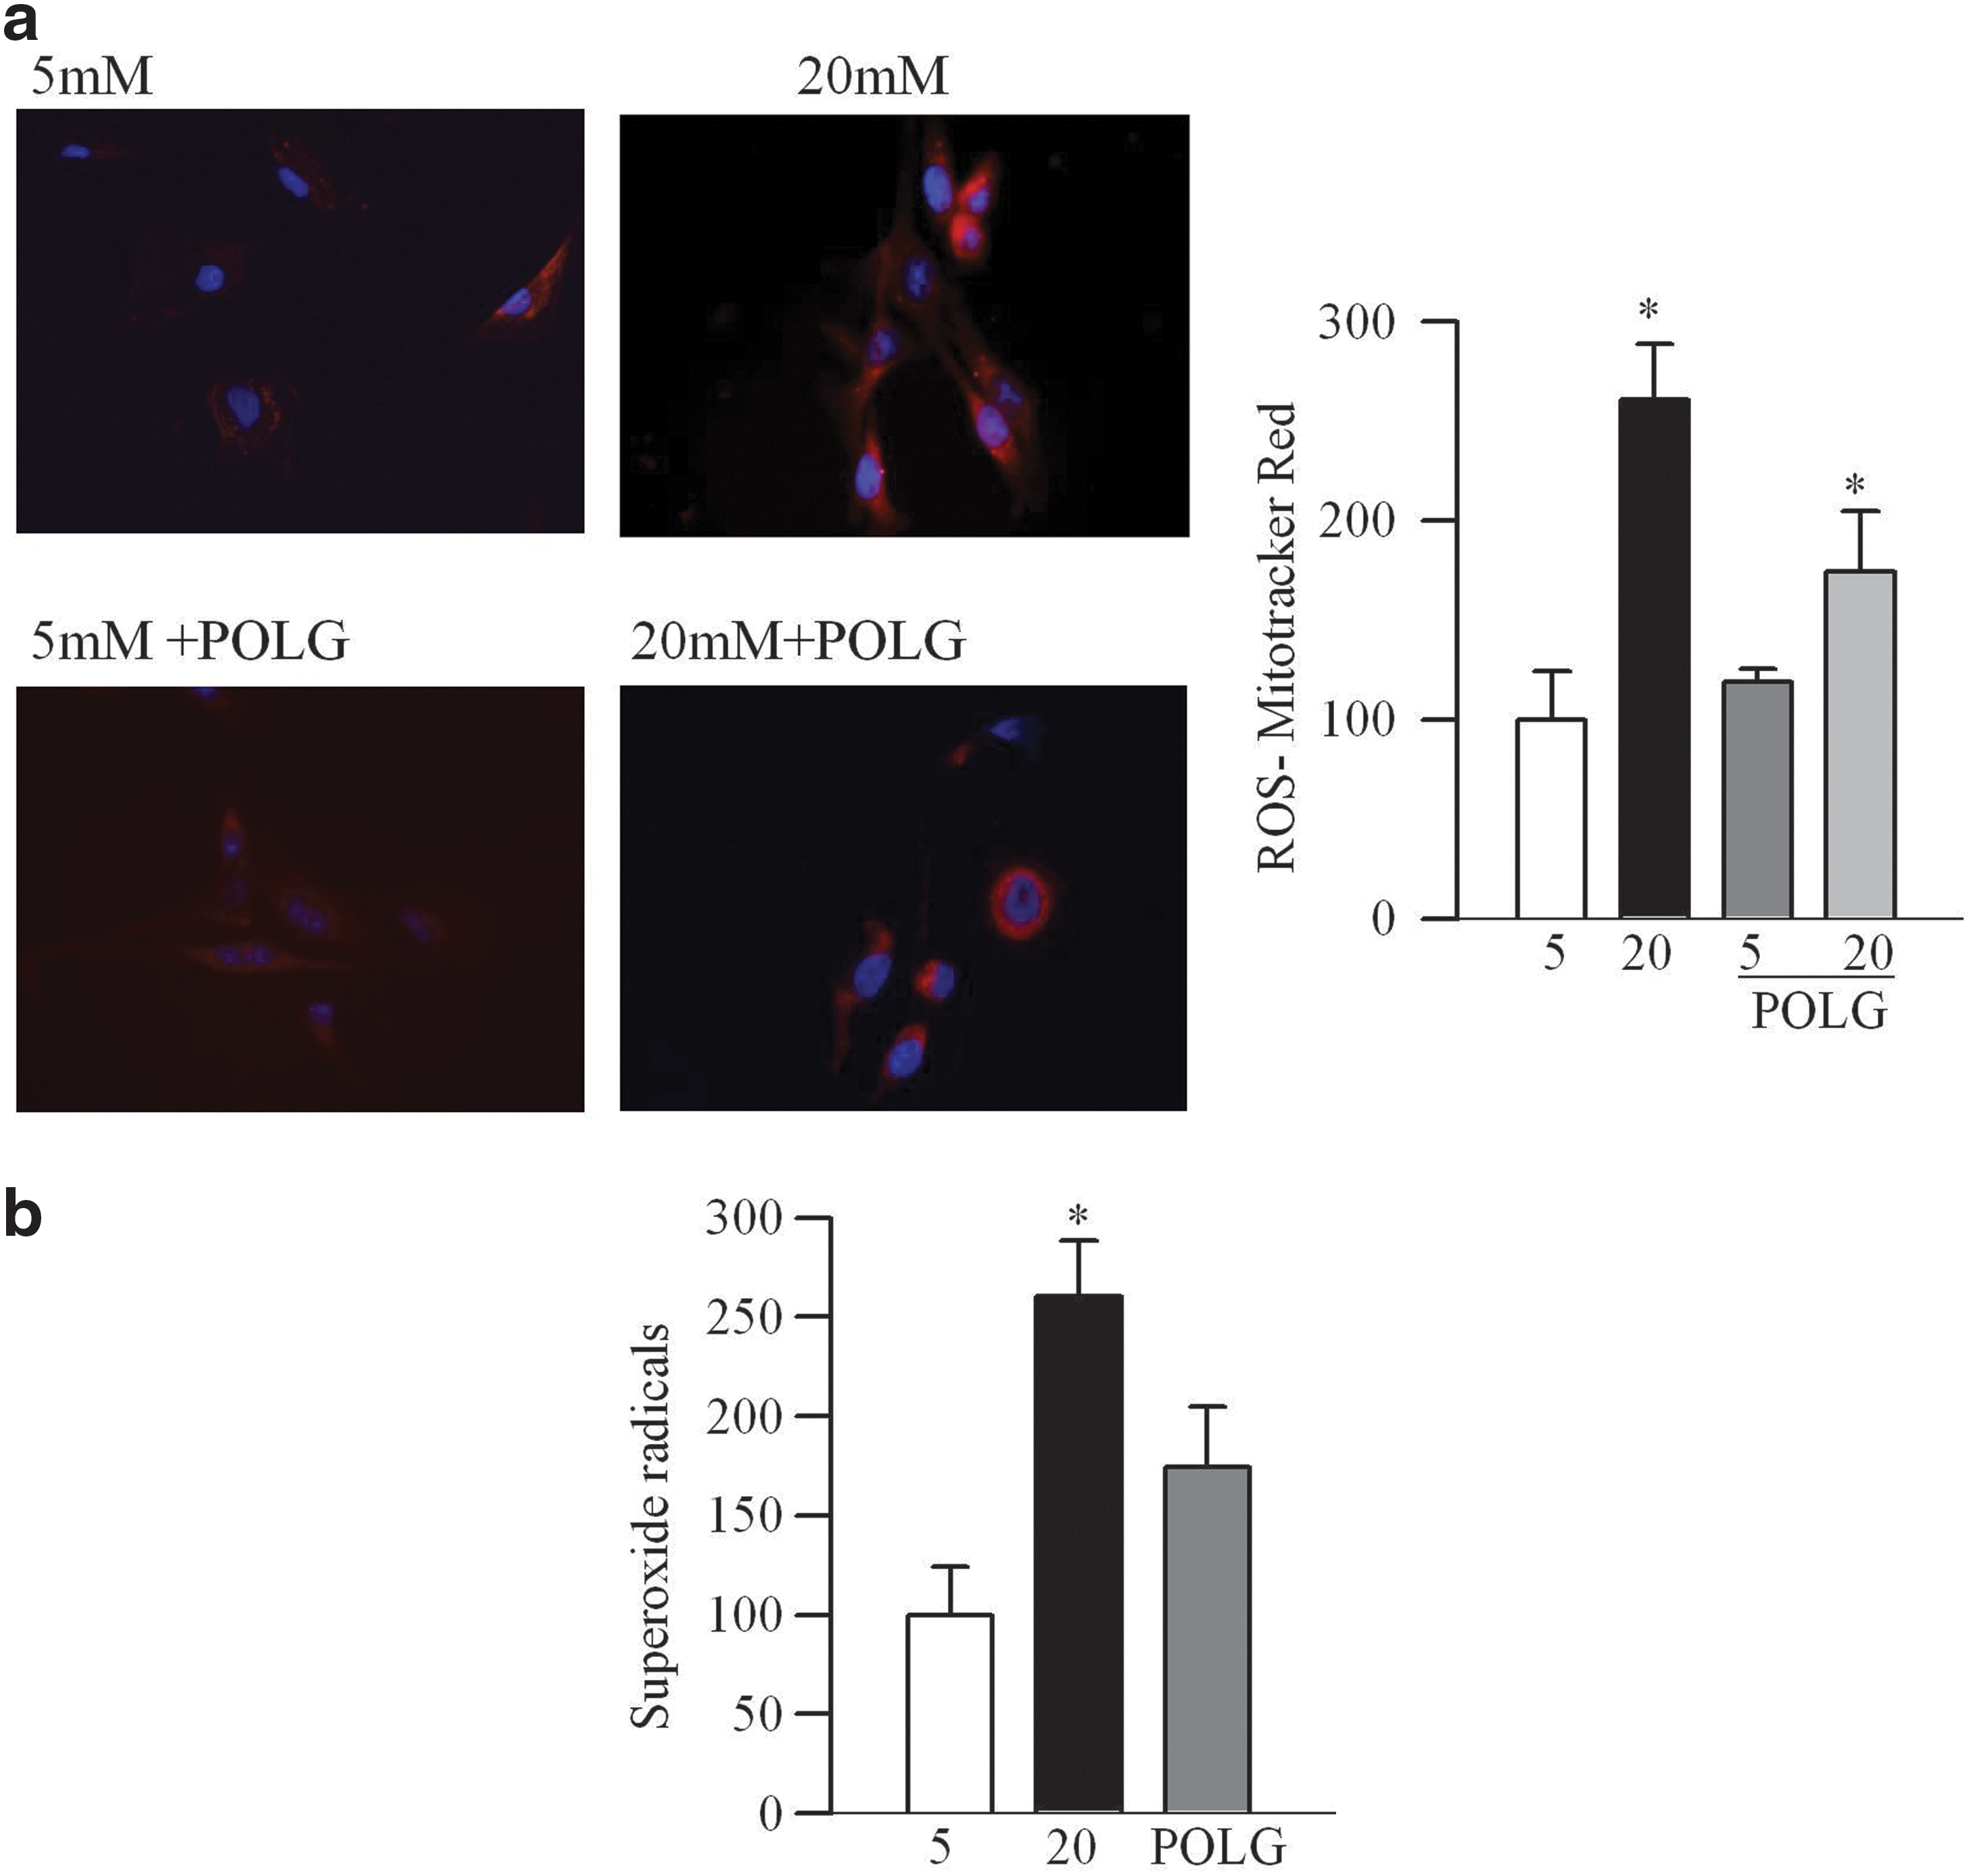
In contrast, when POLG1 was overexpressed, glucose-induced D-loop damage, as detected by the ratio of semi-long/short (891/91 bp) fragments, was prevented (p<0.05; Fig. 7a), and POLG1 levels in the mitochondria were increased (Fig. 7b). Damage of mtDNA was also prevented (Fig. 7c), suggesting a major role of POLG1 in mtDNA replication and repair machinery. Glucose-induced increase in mitochondria superoxide levels, as evidenced by increased immunostaining of MitoTracker Red, and by quantitative fluorometric method, was ameliorated by POLG1 overexpression (Fig. 8a, b).
Discussion
In the development of diabetic retinopathy, mtDNA is damaged and mitochondria copy numbers and mass are decreased, and overexpression of MnSOD prevents these diabetes-induced retinal abnormalities (13, 17, 25, 26, 38). The maintenance/replication of the mtDNA has a critical role in mitochondria function, and the D-loop region contains the binding sites for major factors for mtDNA transcription. Here, we present exciting data to show that diabetes decreases the copy number of the D-loop region in the retina, and this region encounters more damage than other regions of the mtDNA. To make the bad situation worse, mtDNA replication enzymes become subnormal, hampering the replication/repair process. Regulation of mitochondrial superoxide levels by MnSOD ameliorates diabetes-induced damage to the D-loop, and protects a decrease in mtDNA replication enzymes, suggesting that the D-loop damage and the replication of mtDNA are under the control of mitochondrial superoxide. Consistent with the results from the retina, high glucose also preferentially damages the D-loop region and the replication machinery in the retinal endothelial cells, the site of histopathology, and the binding of POLG1 to the D-loop is also compromised. Thus, our results strongly support a crucial role of the D-loop integrity and the mtDNA replication in the development of diabetic retinopathy.
The D-loop region has a control site for mtDNA replication containing the leading strand origin of replication (23, 28, 35, 41), and it regulates transcription and replication of mtDNA. Variations in the D-loop region are associated with a number of diseases, including cancer, leukemia, diabetes, and diabetic neuropathy (28, 31, 32, 40, 44). We have shown that despite increased gene transcripts of DNA repair enzymes, retinal mtDNA is damaged in diabetes (20, 25, 26, 38), and here we present results showing increased D-loop damage compared with the CytB region. These results suggest that the maintenance of the D-loop region is important in the pathogenesis of diabetic retinopathy.
POLG plays a crucial role in the maintenance of the mtDNA and function (9, 12). Overexpression of POLG1 is associated with increased expression of a mitochondrial transcriptional factor, TFAM, important in mitochondria biogenesis (5). In diabetes, the levels of TFAM are decreased in the retinal mitochondria, resulting in impaired mtDNA biogenesis and subnormal mtDNA copy number (36, 38). Furthermore, diabetes also decreases the number of mitochondria in the retinal vasculature (20, 36, 38, 48). Decreased expression of POLG1 and POLG2 in the retina in diabetes, thus, strongly suggests that impaired replication machinery further contributes to the decrease in the overall mitochondria number.
For replication of mtDNA, in addition to POLG, Twinkle also plays a significant role by serving as a replicative helicase (15). POLG and Twinkle together form replisome to bind, unwind, and extend mtDNA, and this process utilizes short stretches of RNA (RNA primers) synthesized by RNA polymerase to make a new complementary mtDNA strand (7, 21). Mutations in Twinkle and POLG genes have been reported to predispose mtDNA to multiple deletions, resulting in development of mitochondrial diseases, including progressive external ophthalmalgia, a condition with cytochrome C oxidase-deficient fibers (34, 46). Here, we show that diabetes significantly decreases the expression and mitochondrial accumulation of Twinkle, raising the possibility that the decreased mitochondrial levels could also be due to an impaired mitochondrial transport system, which the retina experiences in diabetes (48).
The development of diabetic retinopathy and abnormalities in mitochondria dysfunction are prevented in diabetic mice overexpressing MnSOD (13, 19, 30, 38). Our results clearly demonstrate that diabetes-induced damage to the D-loop and abnormalities in the replication machinery are also ameliorated in Tg-diabetic mice. In support, others have shown protection of UV-induced POLG damage by MnSOD (2). Furthermore, MnSOD overexpression has been shown by us to prevent decrease in other mtDNA repair glycolysases, TFAM, and mtDNA copy numbers (25, 26, 38). Thus, our results strongly suggest that the replication process is under the control of superoxide, and the prevention of the development of diabetic retinopathy in Tg mice could be due to protection of POLG. However, the role of NADPH oxidase-induced increase in retinal ROS in diabetes (1) cannot be ruled out.
The retina has multiple layers and cell types, and also a specialized vasculature that provides nutrients without interfering with light sensing (40). Retinal vasculature is the major sight of histopathology of diabetic retinopathy, and endothelial cells and pericytes are lost (8). To specifically understand the role of the mtDNA replication in the pathogenesis of diabetic retinopathy, our results from retinal microvessels and also isolated retinal endothelial cells confirm similar damage as observed in the retina from diabetic rodents. Subnormal mitochondria biogenesis and decreased copy number is also observed in retinal endothelial cells exposed to high glucose (36, 38). Furthermore, inhibition of mitochondrial superoxide accumulation by MnSOD mimic also prevents damage to the replication machinery, and this further confirms its importance in the development of diabetic retinopathy.
The balance between mtDNA repair and damage is important for mitochondria homeostasis, and oxidative stress-induced damage to POLG in human hepatoblast cells results in preferential D-loop damage (9, 11, 14, 47). Downregulation of retinal POLG in diabetes suggests that the repair of oxidative lesions of mtDNA is compromised, resulting in increased accumulation of oxidatively modified DNA. In support, diabetes increases the levels of oxidatively modified DNA in the retinal mitochondria (25, 26). POLG also plays an important role in mtDNA stability by interacting with DNA ligase III (6), and others have shown that the expression of dominant negative DNA polymerase depletes mtDNA (11). Here, we show that the binding of POLG1 to D-loop is compromised, further contributing to a decreased D-loop region. Consistent with this, POLG is the rate-limiting enzyme in mitochondrial base excision repair (BER), and its inactivation is likely to increase the buildup of cytotoxic BER pathway intermediates, including single-strand breaks (10, 24, 39). This raises the possibility that the decreased binding could be responsible for mtDNA synthesis, and could result in impaired retinal mitochondria biogenesis and subnormal copy number (36, 38, 48).
In conclusion, this is the first study demonstrating that the mtDNA presents differential damage in diabetes, the damage to the D-loop region is more extensive compared with the CytB region, and the replication/repair machinery is subnormal, further contributing to the dysfunctional mitochondria. Regulation of mitochondrial superoxide protects retinal mtDNA from such damage. Thus, regulation of mtDNA replication/repair machinery could present a plausible mechanism that prevents dysfunctional mitochondria, and the development of diabetic retinopathy, one of the most devastating complication of diabetes.
Methods
Animal models
Hemizygous MnSOD Tg mice with C57BL/6 background and their WT littermates were made diabetic by administering streptozotocin (55 mg/kg BW) for five consecutive days, a model of type I diabetes. Mice with blood glucose 250 mg/dl after 3 days of the last injection of streptozotocin were considered as diabetic. Age-matched normal WT mice and Tg mice served as controls. After ∼10 months of diabetes, mice were euthanized by carbon dioxide narcosis, and the retina was isolated. Treatment of animals was carried out as per the guidelines of National Institute of Health Principals of Laboratory Animal Care, the Association for Research in Vision and Ophthalmology resolution on the use of animals in research, and the Institutional guidelines. Average blood glucose values for normal and diabetic mice (WT or Tg) were 125±18 and 502±106 mg/dl, respectively. These methods are in use in our laboratory (13, 19, 26), and as previously reported, overexpression of MnSOD prevented diabetes-induced increase in the formation of acellular capillaries in the retina (13).
Retinal endothelial cells
BRECs from 4th to 6th passage were incubated in 5 mM glucose or 20 mM glucose media for 4 days in the presence or absence of MnTBAP (200 μM; Biomol, Plymouth Meeting, PA). The incubation media was changed every other day, and supplemented with fresh MnTBAP (16, 26). Cells incubated in 20 mM mannitol, instead of 20 mM glucose, served as osmotic controls.
Manipulation of POLG1
To establish the role of POLG1 in regulation of mtDNA, BRECs from 3rd to 5th passage were transfected with POLG1-siRNA (Santa Cruz Biotechnology, Santa Cruz, CA) as previously described (20, 25). Briefly, cells were incubated with the transfection complex consisting of the siRNA and transfection reagent for 8 h at 37°C, washed with PBS, and incubated in 5 or 20 mM glucose media for 4 additional days. Parallel incubations were carried out using scrambled siRNA, and the transfection efficiency was evaluated by quantifying POLG1 gene expression.
To investigate the effect of POLG1 overexpression in improving glucose-induced mtDNA damage, the enzyme was overexpressed using 5 μg POLG1 expression plasmid (RC204456; OriGene, Rockville, MD) and TurboFectin 8.0 transfection reagent. After transfection, the cells were incubated in 5 or 20 mM glucose for 4 days. Parallel incubations were carried out using the transfection reagent alone.
Isolation of DNA and RNA
Total DNA was isolated from the retina or BRECs using Blood tissue DNA kit (Qiagen, Valencia, CA), and quantified by the Quant-iT dsDNA assay (Invitrogen, Carlsbad, CA). The primers were designed using primer express-3 software (Table 1) and synthesized by Integrated DNA Technologies (Coralville, IA).
RNA (1–2 μg), isolated by TRIzol reagent (Invitrogen), was employed to make cDNA using High Capacity cDNA Reverse Transcription Kit (Applied Biosystem, Foster City, CA). Gene expressions for POLG1, POLG2, and Twinkle were measured by SYBR green-based real-time quantitative polymerase chain reaction (qPCR), with melting curve analysis on ABI 700 (Applied Biosystems) using their gene-specific primers (Table 1). β-actin was used as a housekeeping gene, and quantification of the transcripts was done by the ddCt method (38, 50).
Assessment of DNA damage
To evaluate mtDNA damage, three independent PCR-based methods were used. In the first method, mtDNA copy number of D-loop and that of CytB were measured by qPCR (SYBR green-based). Each reaction was performed in duplicate using 10 ng DNA and 0.5 μM each of forward and reverse primers. The thermal conditions included 10 min at 95°C followed by 40 cycles of 15 s at 95°C and 60 s at 60°C. To assess the formation of specific PCR products, the amplicons were also analyzed on an agarose gel. The amplification of D-loop or CytB regions were normalized to that of β-actin, nDNA-encoded gene, and quantification was done by ddCT method.
The second method quantified the ratio of semi-long to short PCR amplicons at the D-loop and at the CytB regions of mtDNA using the primers spanning around 800–900 bp. Their expressions were normalized by their respective short fragments of ∼100 bp, the fragments that are easy to amplify by DNA polymerase (35). This allowed us to analyze strand breaks in the long fragments, base modifications and also identify bulky DNA adducts that cause an inhibition of the primer annealing and forward movement of POLG (22). Each PCR reaction was performed using GoTaq™ Reaction Buffer, 0.2 mM of dNTPs (Promega, Madison, WI), 0.2 μM of each forward and reverse primers, GoTaq™ DNA polymerase, and 10 ng of template DNA. PCR conditions included 94°C for 5 min, 24 cycles of 94°C for 1 min, 60°C for 30 s, 72°C for 1 min, and a final extension at 72°C for 10 min. The linearity of the assay was performed using 1–12 ng DNA (Fig. 1f). The PCR products were separated on 2% agarose gel. The intensity of PCR products was measured using Un-Scan-It Gel digitizing software (26, 37, 38).
DNA damage was also evaluated in cells in which POLG1 was either silenced or overexpressed. Briefly, 15 ng DNA was amplified using GeneAmp XL PCR kit (Applied Biosystems), 200 mM dNTP, 1.1 mM Mg(OAc)2, 1 unit rTth DNA polymerase, and 0.1 mM primers. After 1 min at 75°C, polymerase was added followed by 1 min at 94°C, 24 cycles of 94°C for 15 s and 65°C for 12 min, and a final extension at 72°C for 12 min. PCR products were resolved on agarose gel.
Isolation of mitochondria and western blot
Mitochondria were isolated from the retina or BRECs using the Mitochondria Isolation kit from Invitrogen, as previously reported (29, 30, 38, 48). Protein content was determined by the Bicinchoninic Acid protein assay kit (Sigma-Aldrich, St. Louis, MO). The purity of the mitochondria was determined by measuring the expressions of nuclear protein, Histone 2-B, and of cytosolic protein, lactate dehydrogenase, using antibodies sc-31671 and sc-27235, respectively (Santa Cruz Biotechnology). As shown in Figure 2c, the method yielded largely purified mitochondria with little contamination of cytosolic or nuclear proteins.
Proteins (30–50 μg) were separated on a 4%–16% SDS-PAGE, and identified using antibodies against POLG1, POLG2, and Twinkle (sc-48815, sc-160290, sc-134915 respectively; Santa Cruz Biotechnology). Cytochrome oxidase IV (Cox IV; Molecular Probe, Molecular Probes, Eugene, OR) was used as a loading control for mitochondria and β-actin for the homogenate. Routine dilutions for primary antibodies were 1:500 and for horseradish peroxidase-conjugated secondary antibodies, they were 1:2000. The band intensity of western blot was quantified using Un-Scan-It Gel digitizing software (Silk Scientific Inc., Orem, UT). The individual blots were normalized to Cox IV/β-actin, and the values obtained from WT-normal mice or cells incubated in 5 mM glucose were considered as 100%.
Hydrogen peroxide
Retinal H2O2 levels were quantified using Amplex Red Hydrogen Peroxide/Peroxidase Assay kit (A-22188- Invitrogen). Homogenate (120 μg) was incubated with 100 μM Amplex red and 1 U/ml horse radish peroxidase for 30 min, and the resulting fluorescence was measured at 590/530 nm (emission and excitation). The assay was sensitive to as low as 0.01 pmol of H2O2.
Localization of POLG1 in the mitochondria
Localization of POLG1 in the mitochondria was performed by fluorescence microscopy using MitoTracker green (Invitrogen) (20, 38). Briefly, the cells were incubated for 45 min at 37°C with 500 nM MitoTracker green, rinsed with PBS, fixed in 4% formaldehyde for 15 min, and incubated with 0.2% Triton-X 100 for 10 min. After blocking for 1 h with 1% BSA, the cells were incubated with anti-POLG1 for 2 h, washed, and blocked with 10% goat serum. They were then incubated with Texas Red-conjugated anti-rabbit IgG for 1 h, rinsed, mounted with DAPI-containing Vectashield mounting medium (Vector Laboratories, Burlingame, CA), and imaged using ZEISS ApoTome fluorescence microscope at 40× magnification (Carl Zeiss, Chicago, IL). The intensity of POLG1 in the mitochondria was calculated by the Axio-Vision software depending on the presence or absence of combined fluorescence of Texas red (POLG1) and MitoTracker green in a cell. The background for red and green channels was normalized in each of the samples, and an intensity-scatter plot was generated displaying the Pearson's values and amount of green and red (yellow) co-localized channels.
Binding of POLG1 with D-loop
The binding affinity of POLG1 to its replication start site was assessed by ChIP of POLG1 at the D-loop of mtDNA. BRECs were cross linked with 1% formaldehyde for 10 min, and the DNA pull-down assay for the D-loop was performed as previously described (49). The protein was precleared with protein A agarose/salmon sperm DNA slurry, and 130 μg of precleared protein was incubated with 2 μg of POLG1 antibody. The antibody-protein-DNA complex was pulled down, washed, and reverse cross linked. The DNA was purified, and the D-loop region of mtDNA was quantified by qPCR.
Functional assay of POLG for mtDNA replication
After incubation of BRECs in 5 or 20 mM glucose for 4 days, they were incubated with aphidicolin (7 μM) or EtBr (1 μg/ml) for 4 h, rinsed and further incubated for 6 h with 15 μM BrDU with aphidicolin or EtBr (23). The cells were washed with PBS, fixed with 2% paraformaldehyde, and permeabilized with 0.1% TritonX-100. DNA was denatured with 2N HCl at 37°C for 30 min to recover the BrDU epitope. Cells were blocked with 5% goat serum, and incubated with mouse anti-BrDU antibody (Sigma-Aldrich; 1:50 dilution). After washing the cells with PBS, they were incubated with Texas Red-conjugated anti-mouse IgG for 1 h (at 1:250 dilution). Coverslips were mounted with DAPI containing mounting solution, and the fluorescence was visualized using ZEISS ApoTome at 40× magnification.
Mitochondrial superoxide
Mitochondrial superoxide were detected using MitoTracker Red (CM-H2XROS; Molecular Probes), a cell permeable dye that sequesters in the mitochondria and emits fluorescence when oxidized. After the desired incubations, the cells were rinsed with DMEM to remove nonadherent cells, and incubated with 400 nM MitoTracker Red for 30 min at 37°C (25, 29). The excess MitoTracker was removed, and the cells were fixed in 1% formaldehyde, rinsed, and mounted using Vectashield mounting media. The fluorescence was visualized at 40× magnification.
Mitochondrial superoxide levels were also quantified fluorimetrically by incubating the cell homogenate (2–5 μg protein) with 400 nM MitoTracker Red for 30 min at 37°C. The fluorescence was measured at 579 nm excitation and 599 nm emission wavelengths using an LS55 Fluorescence Spectrometer (25).
Statistical analysis
Data are expressed as mean±standard deviation. Statistical analysis was carried out using Sigma Stat software. The Shapiro–Wilk test was used to test for normal distribution of the data. For variables with normal distribution, ANOVA followed by Bonferrone test were applied, while Kruskal–Wallis test followed by Mann–Whitney U-test were used for data that did not present a normal distribution. A p-value < 0.05 was considered statistically significant.
Footnotes
Acknowledgments
The authors thank Doug Putt and Yakov Shamailov for their technical assistance. This study was supported in part by grants from the National Institutes of Health, Juvenile Diabetes Research Foundation, Thomas Foundation, and Research to Prevent Blindness.
Author Disclosure Statement
The authors declare that they do not have any competing financial interests.