




Abstract
Introduction
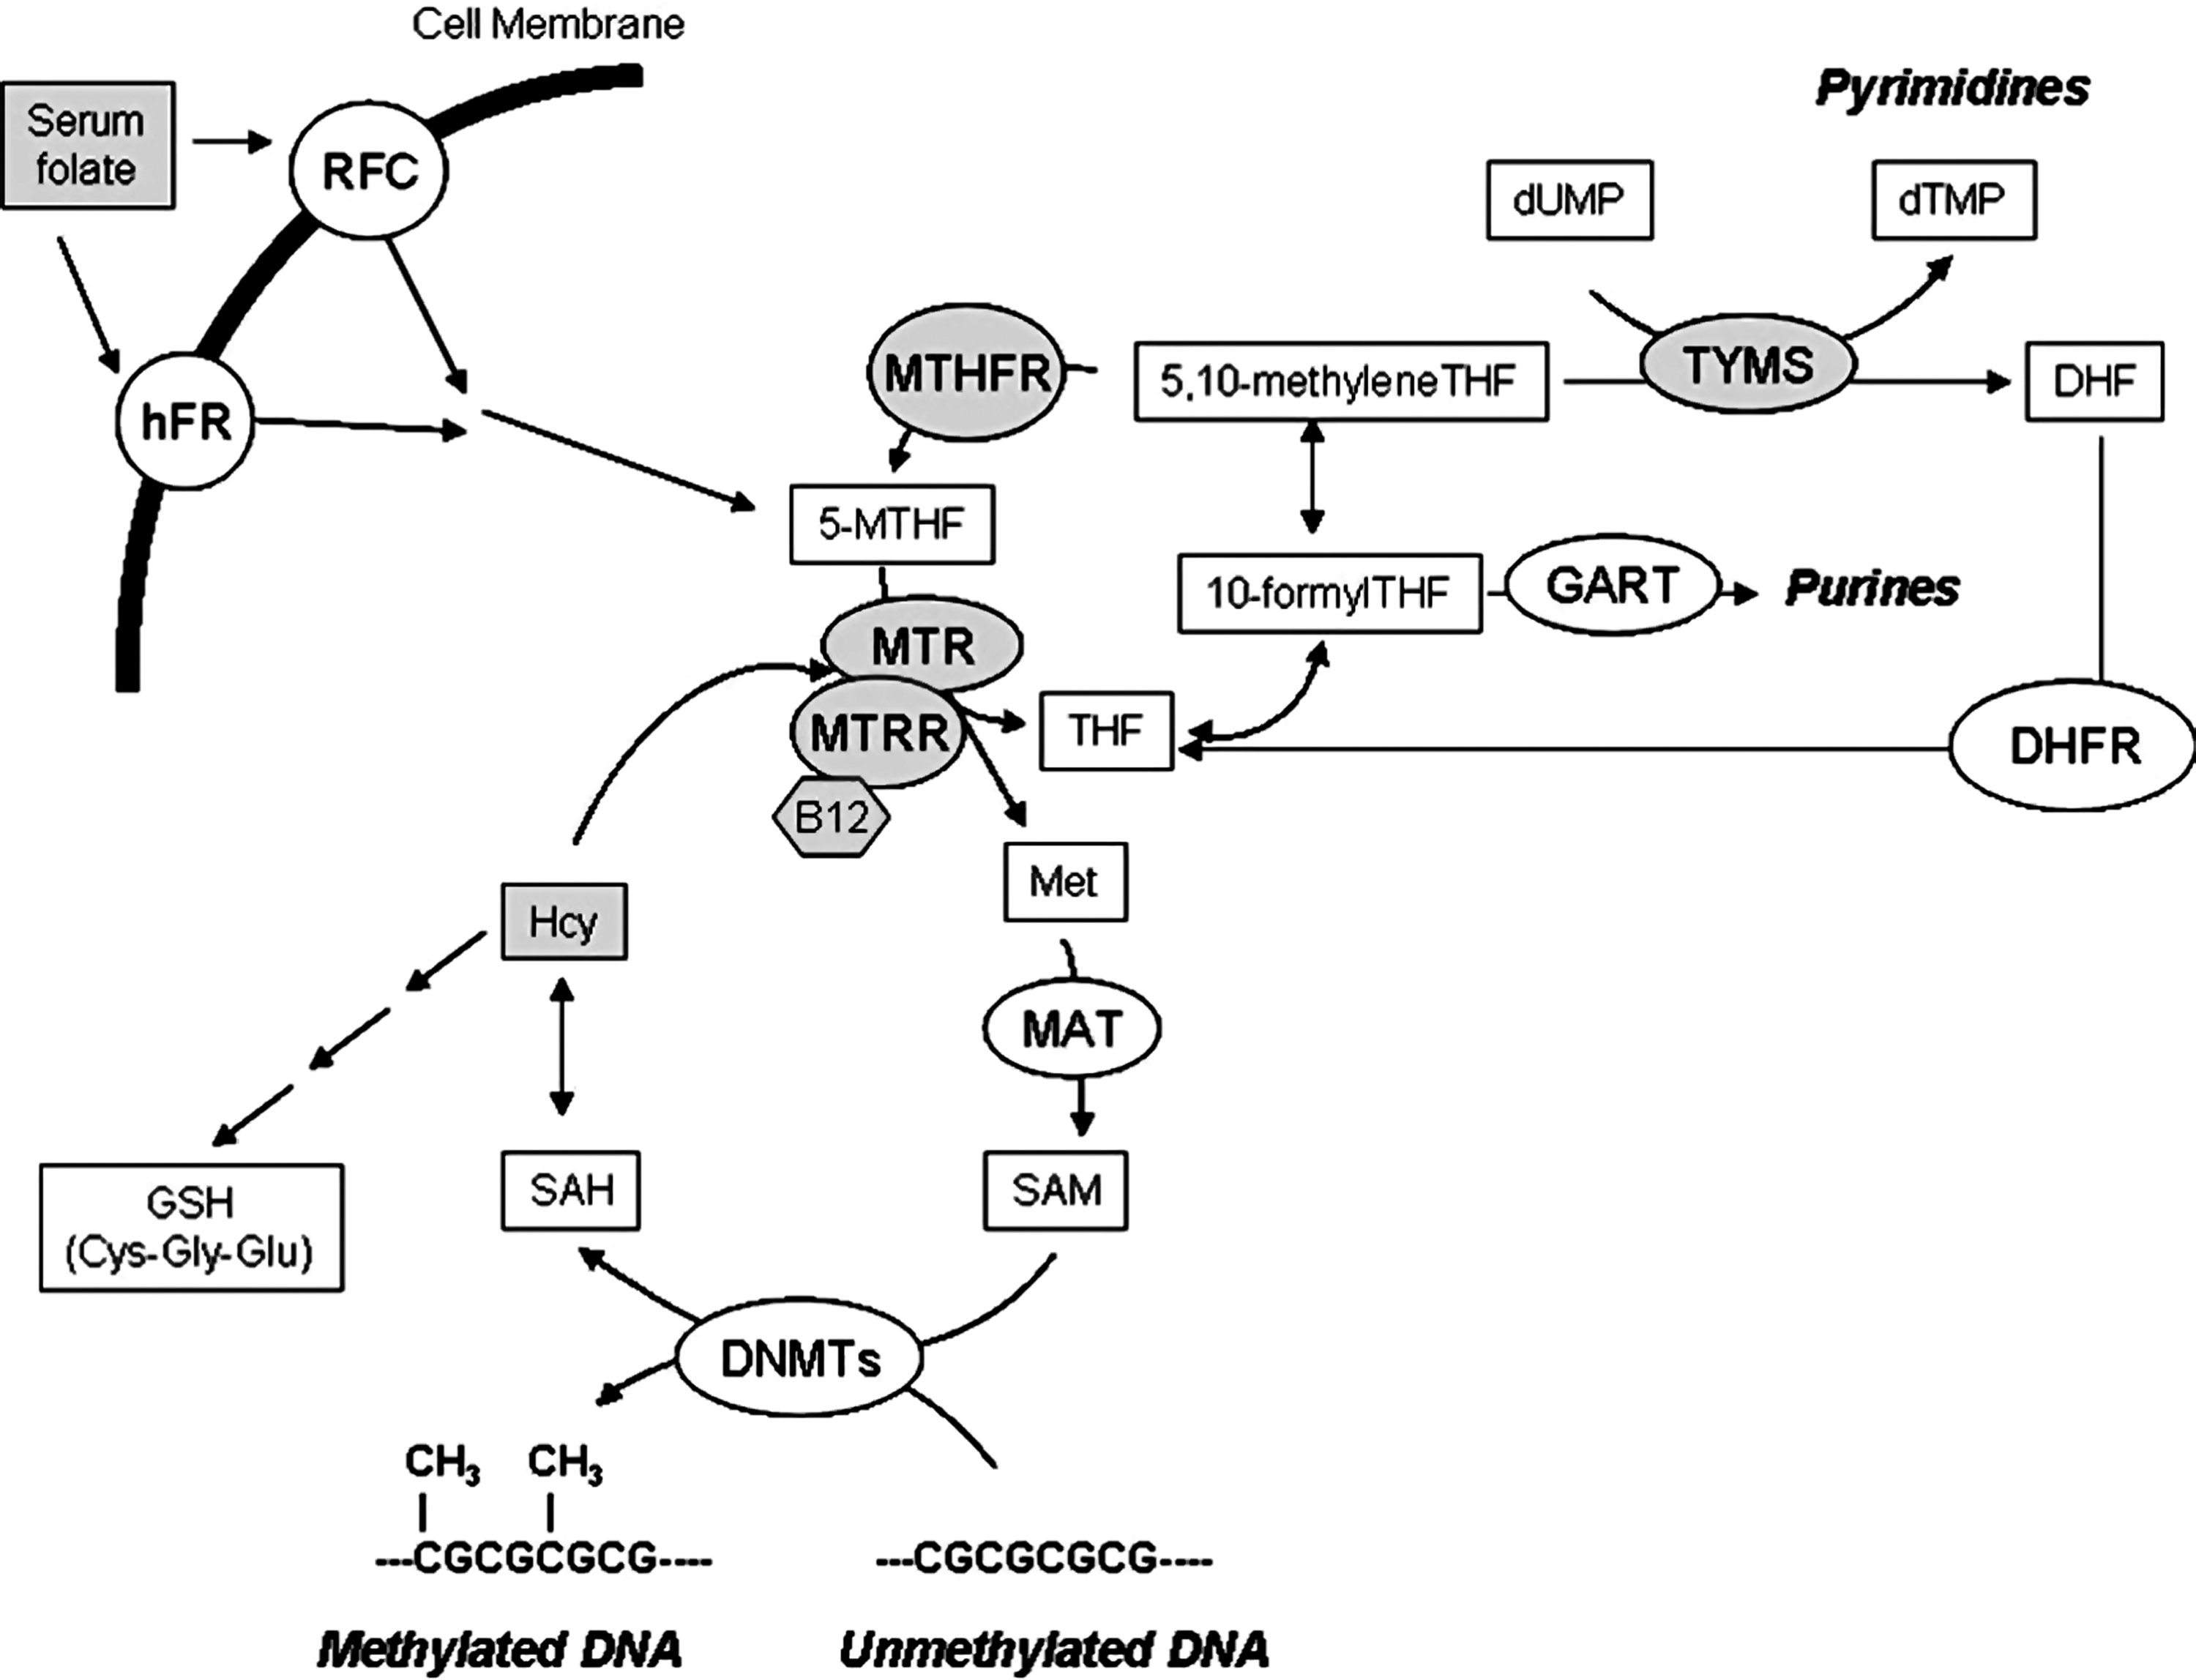
Folate is obtained from the diet and its metabolism (Fig. 1), also known as one-carbon metabolism, requires intestinal uptake and reduction and methylation into the liver to form 5-methyltetrahydrofolate (5-methylTHF). 5-methylTHF is released into the blood and internalized by cells for the synthesis of DNA and RNA precursors or for the conversion of homocysteine (Hcy) to methionine, which is then used to form the main DNA methylating agent S-adenosylmethionine (SAM) (8). Methylenetetrahydrofolate reductase (MTHFR) plays a pivotal role in regulating DNA methylation processes through the reduction of 5,10-methylentetrahydrofolate (5,10-MTHF) to 5-methylTHF, the one-carbon donor for the remethylation of Hcy to methionine mediated by the activity of methionine synthase (MTR). Vitamin B12 (or cobalamin) is a cofactor of MTR, and methionine synthase reductase (MTRR) is required for the maintenance of MTR in its active state. If not converted into methionine, Hcy can be condensed with serine to form cystathionine, which is then used to form the antioxidant compound glutathione (GSH) (Fig 1). A common MTHFR polymorphism (MTHFR 677C>T) is known to reduce enzyme activity (28). A G variant at nucleotide 2756 of the MTR gene (MTR 2756A>G) and a G variant at nucleotide 66 of the MTRR gene (MTRR 66A>G) are known, the former being associated with aberrant DNA methylation (26). 5,10-MTHF is also used by thymidylate synthase (TYMS) during the synthesis of nucleic acid precursors (Fig. 1). A common 28 bp repeat polymorphism (TYMS 28bp 2R/3R) in the promoter enhancer region of the TYMS gene is known to influence TYMS mRNA expression (14).
Innovation
Systematic meta-analyses of the literature point to a possible involvement of impaired one-carbon metabolism to LOAD (8, 29, 38, 40). In the present study, we evaluated four common polymorphisms in genes involved in one-carbon metabolism as possible LOAD risk factors. To the best of our knowledge, the present is the first genetic association study addressing the possible contribution of both MTRR 66A>G and TYMS 28bp repeat polymorphisms to LOAD risk. Therefore, we provided the first evidence of a possible contribution of the MTRR66G allele to LOAD pathogenesis. We also confirmed previous findings of the literature suggesting increased plasma Hcy values, decreased serum folate levels, and an increased frequency of the MTHFR 677T allele in LOAD patients with respect to controls (29, 38, 40). Moreover, we showed data on interactions among folate, Hcy, and vitamin B12 levels and each of the studied polymorphisms, thus adding to the current knowledge of one-carbon metabolism in LOAD subjects and healthy controls.
Given the pivotal role of one-carbon metabolism in DNA synthesis and integrity, in chromosome stability, in DNA and protein methylation, and in antioxidant defense, impairments of this pathway have been often linked to AD risk (8, 29). Despite some conflicting results, the vast majority of the available literature suggests that AD patients are characterized by increased plasma Hcy levels (hyperhomocysteinemia) and decreased serum folate values (29). However, the question of whether hyperhomocysteinemia is a cause of AD or rather a consequence of the degenerative process is still largely debated (40). Indeed, several hypotheses have been formulated linking impaired Hcy and folate values to AD risk, including the vascular hypothesis (hyperhomocysteinemia is a cardiovascular risk factor commonly observed in people with vascular dementia) (15), the oxidative stress hypothesis (Hcy is required for the production of GSH) (27), the chromosome instability hypothesis (folate restriction is linked to chromosome damage and instability, a feature of AD subjects) (21), and the most recently developed epigenetic hypothesis suggesting that impairments in one-carbon metabolism might result in altered SAM production, epigenetic modifications of key AD genes such as PSEN1, and increased production and deposition of amyloid peptides (11, 12). In addition, hyperhomocysteinemia and decreased SAM production might result in impaired tau protein phosphorylation and NFT formation (6).
Genome-wide association studies (GWAS) and meta-analyses of genetic association studies point to a possible contribution of polymorphisms of genes participating in one-carbon metabolism to LOAD risk (16, 29, 38). Moreover, a study performed in peripheral blood and postmortem brain regions of LOAD subjects revealed altered methylation patterns in the promoter of genes involved in one-carbon metabolism, namely MTHFR and DNA methyltransferase 1 (DNMT1), thus strengthening the possible contribution of this pathway to LOAD pathogenesis (32).
In the present study we screened a large cohort of LOAD subjects and matched healthy controls for the presence of the common MTHFR 677C>T, MTRR 66A>G, MTR 2756 A>G, and TYMS 28bp repeat polymorphisms, searching for association with disease risk and age at onset. Moreover, we searched for correlation between each of the studied polymorphisms and data on plasma Hcy, serum folate, and vitamin B12 values which were available in a subgroup of the study population.
Results
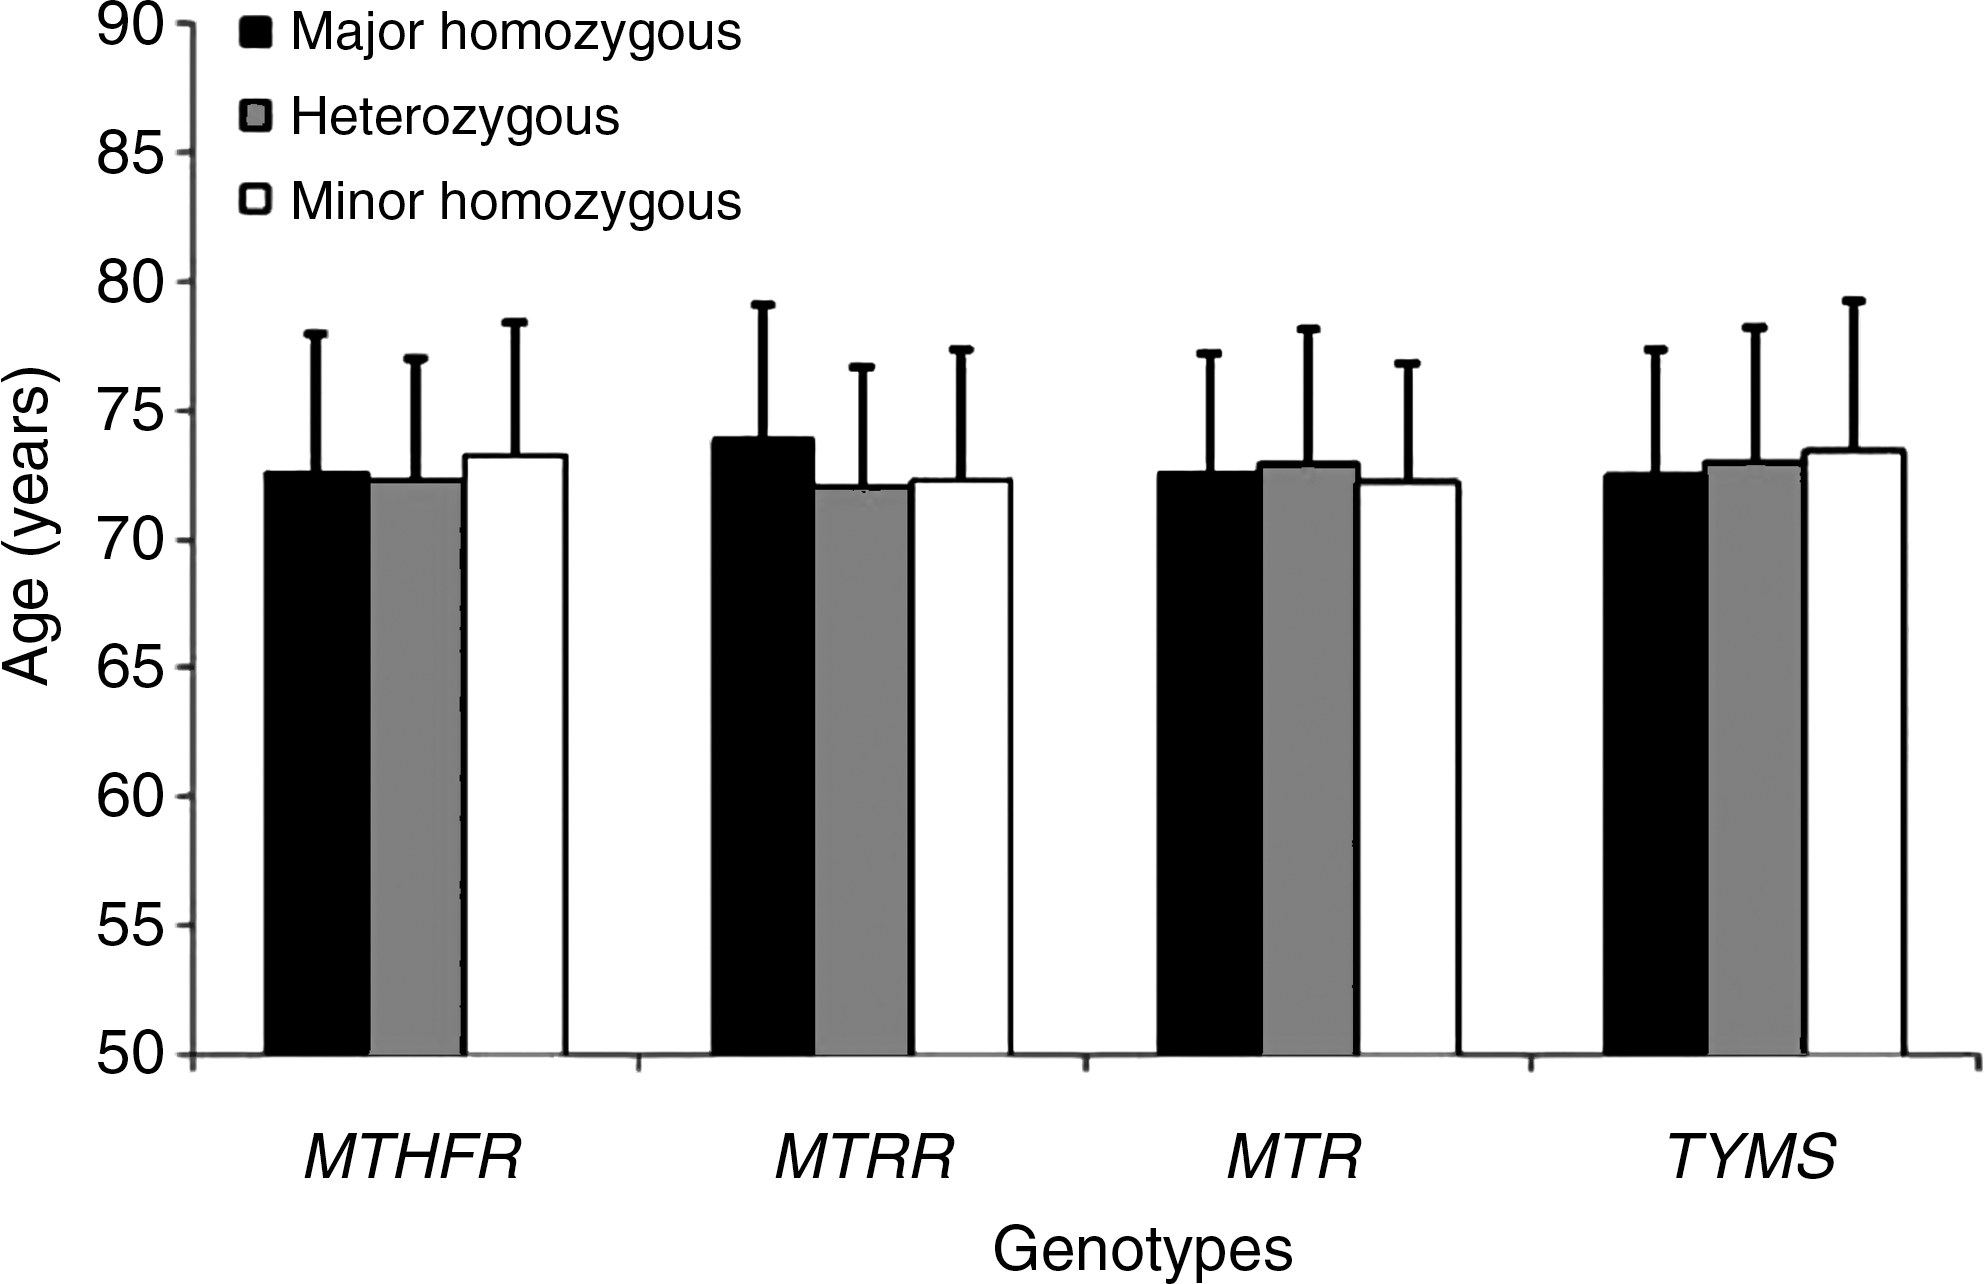
Demographic data of the study population are shown in Table 1. Tables 2 and 3 show allele and genotype frequencies of each of the studied polymorphisms, respectively. All the genotype frequencies conformed to Hardy-Weinberg expectations in controls. We observed a significant increase in MTHFR 677T allele frequency in AD subjects with respect to controls (0.48 vs. 0.42, p=0.019). Moreover, the MTHFR 677CT genotype (OR=1.46; 95% CI=1.03–2.06), the MTHFR 677TT genotype (OR=1.62; 95% CI=1.05–2.49), and the combined MTHFR 677CT+TT genotype (OR=1.50; 95% CI=1.08–2.09) were associated with increased LOAD risk. The study had an a priori power to detect ORs of 1.4 or higher. Also the MTRR 66G allele was more frequent in LOAD subjects than in controls (0.49 vs. 0.43, p=0.044), and the MTRR 66GG genotype was associated with increased LOAD risk (OR=1.57; 95% CI=1.01–2.46). Concerning the MTR 2756A>G polymorphism, both allele and genotype frequencies were closely similar between LOAD subjects and controls (Tables 2 and 3). The TYMS 28bp 2R allele was less frequent in LOAD subjects than in controls (Table 2), but the difference did not reach statistically significance. None of the studied polymorphisms was associated with disease age at onset in our cohort (Fig. 2).
Not all the 378 AD subjects and 308 controls have been genotyped due to DNA run out in a few subjects; †Reference value for OR; ‡ P value obtained by χ2 analysis.
Reference value for OR; † P value obtained by χ2 analysis.
Data on plasma Hcy and serum folate and vitamin B12 were available in a subgroup of the study population (Table 4). Linear regression analysis in the total population (LOAD+controls) showed a positive correlation between age at sampling and plasma Hcy values (r=0.46; p<0.001); in contrast, both serum folate and vitamin B12 values were inversely correlated with increasing age at sampling (r=− 0.17; p=0.03, and r=−0.18; p=0.02, respectively). An inverse correlation was observed between plasma Hcy and folate values (r=− 0.46; p<0.001), and between plasma Hcy and vitamin B12 values (r=−0.37; p<0.001), whilst serum folate and vitamin B12 values showed a positive correlation (r=0.34; p<0.001). Similar results were obtained also when data were stratified into LOAD and control subgroups (not shown). No significant effect of gender on mean plasma Hcy (p=0.819), folate (p=0.580), and vitamin B12 (p=0.408) values was observed.
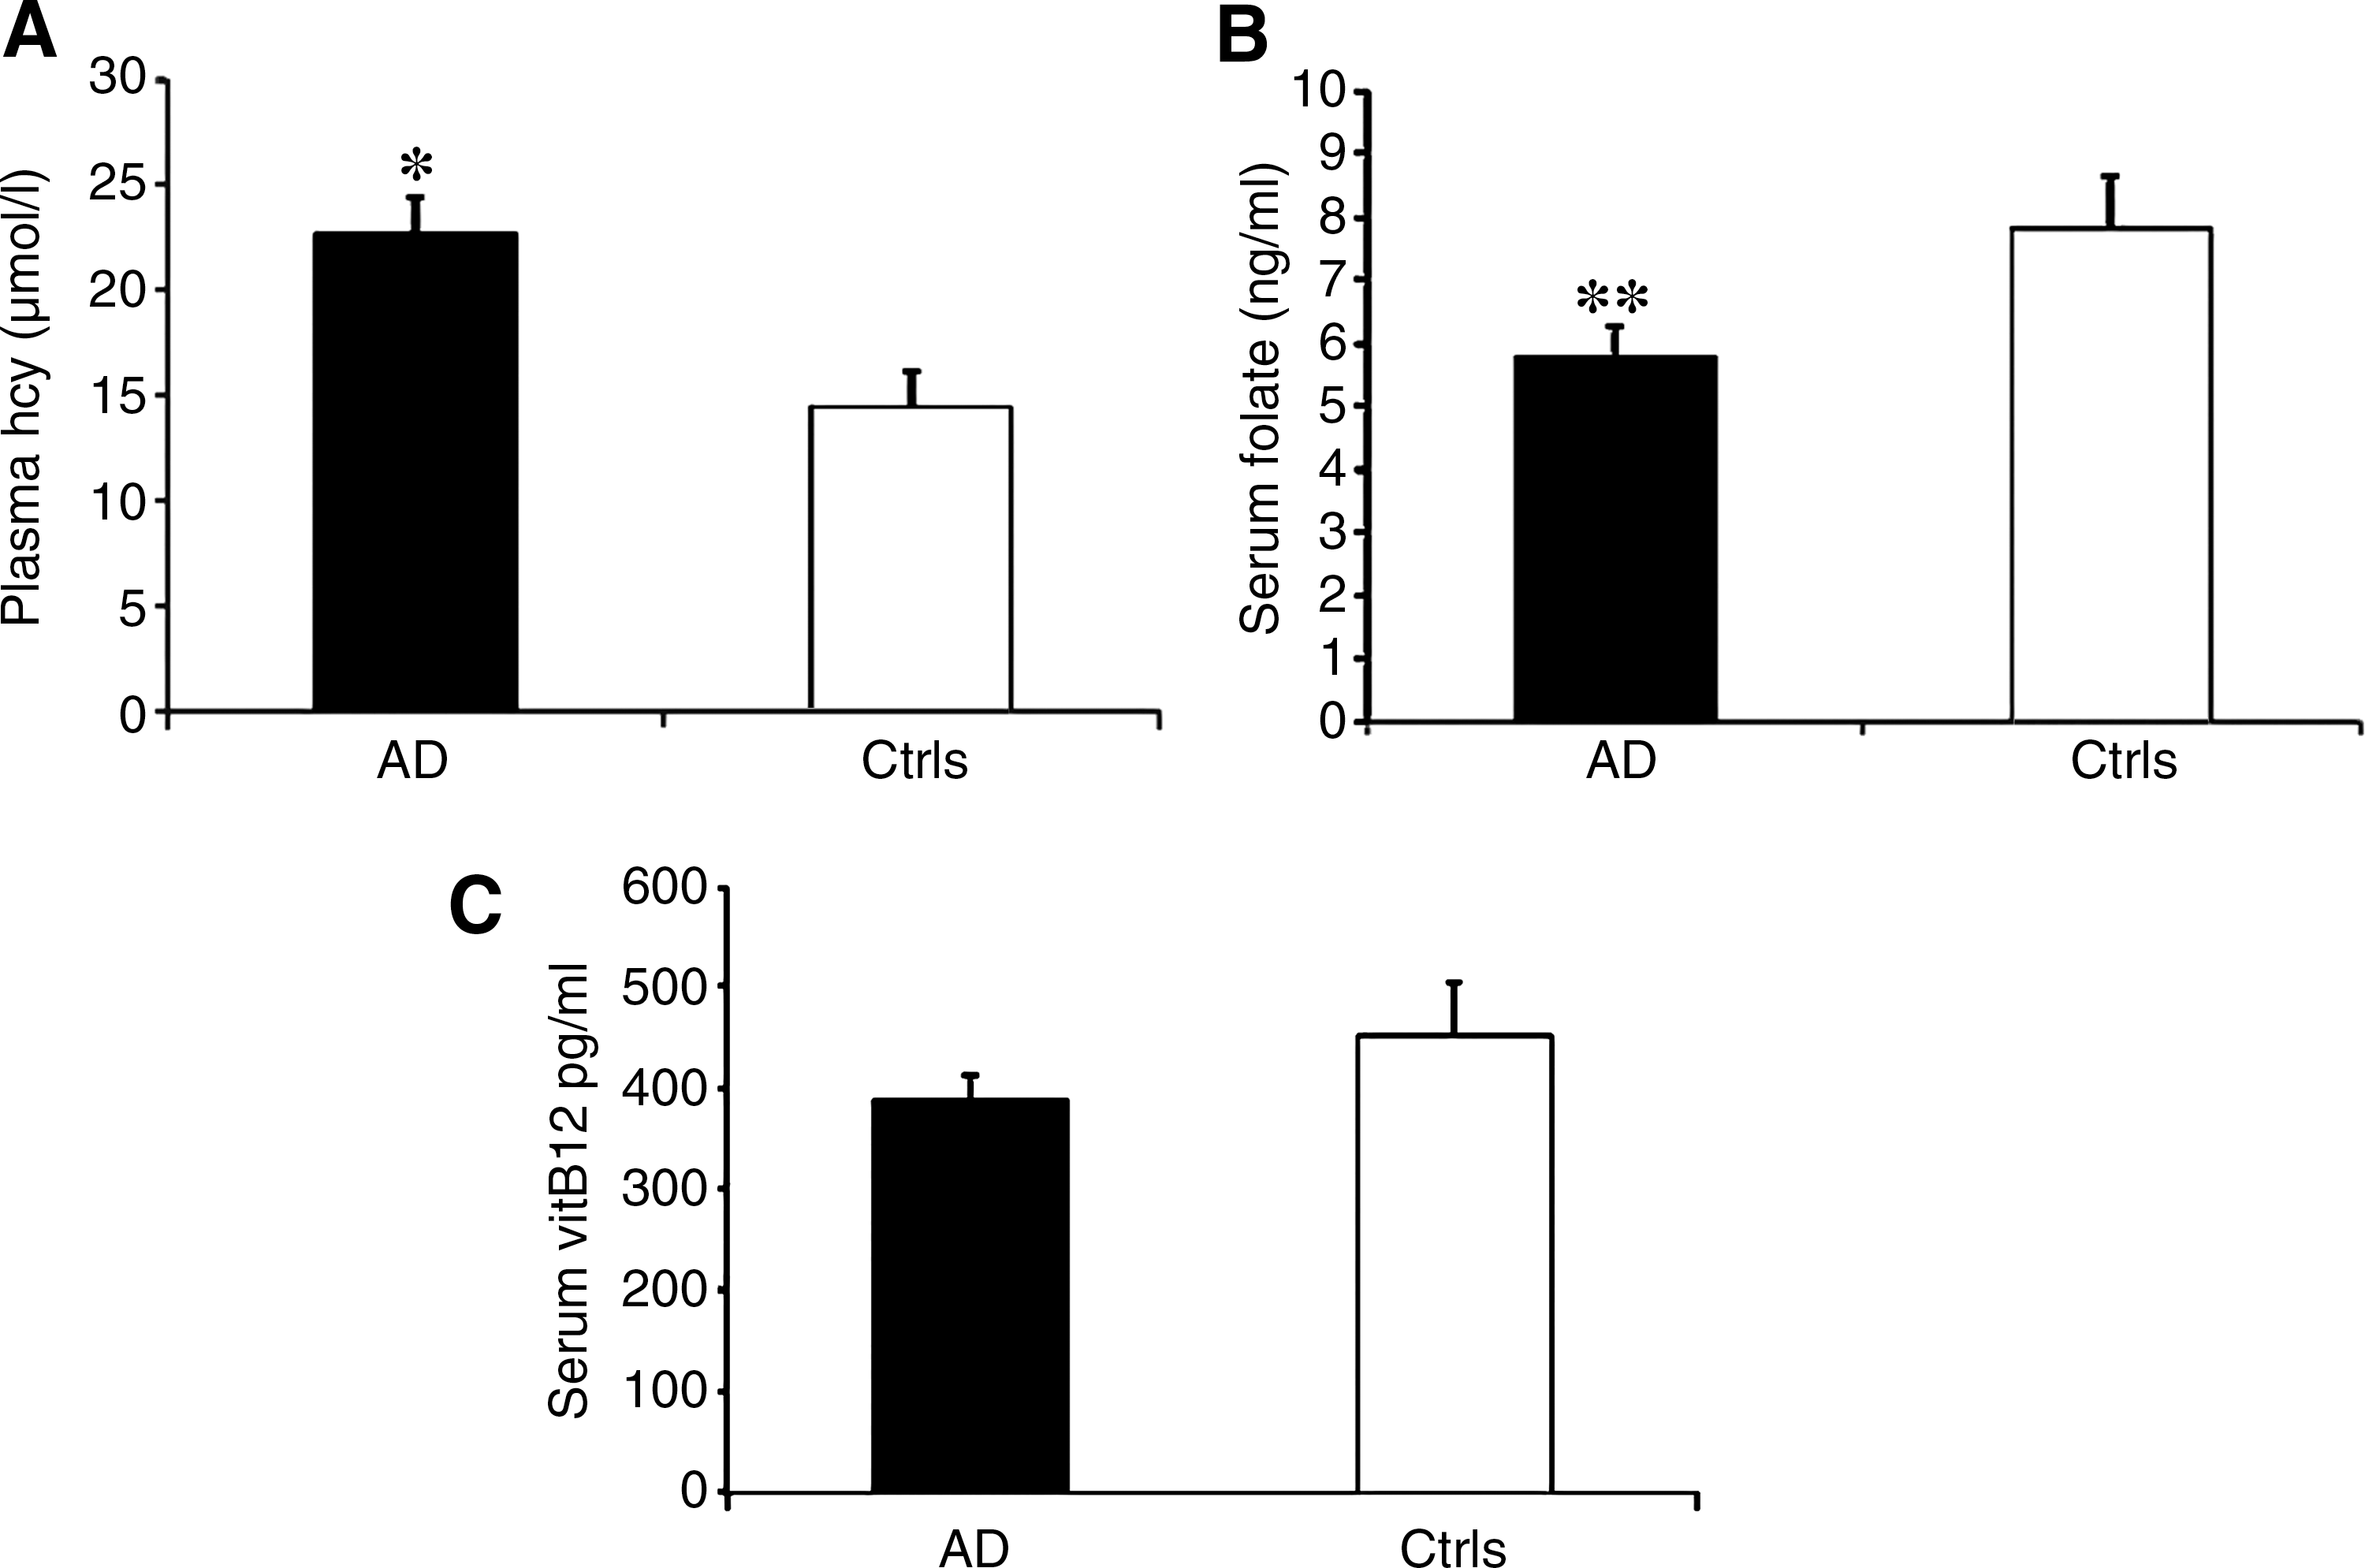
After correcting for age at sampling and gender, we observed a significant increased mean Hcy concentration [22.7±1.7 (mean±standard error of the mean) vs. 14.5±1.7 μmol/L; p=0.037] (Fig. 3A), and significantly decreased mean folate values (5.7±0.5 ng/ml vs. 7.8±0.8 ng/ml, p=0.005) in LOAD subjects with respect to controls (Fig. 3B). Mean vitamin B12 values were lower in LOAD subjects than in controls, but the difference was not statistically significant (387±25.1 pg/ml vs. 451±52.8 pg/ml, p=0.163) (Fig. 3C).
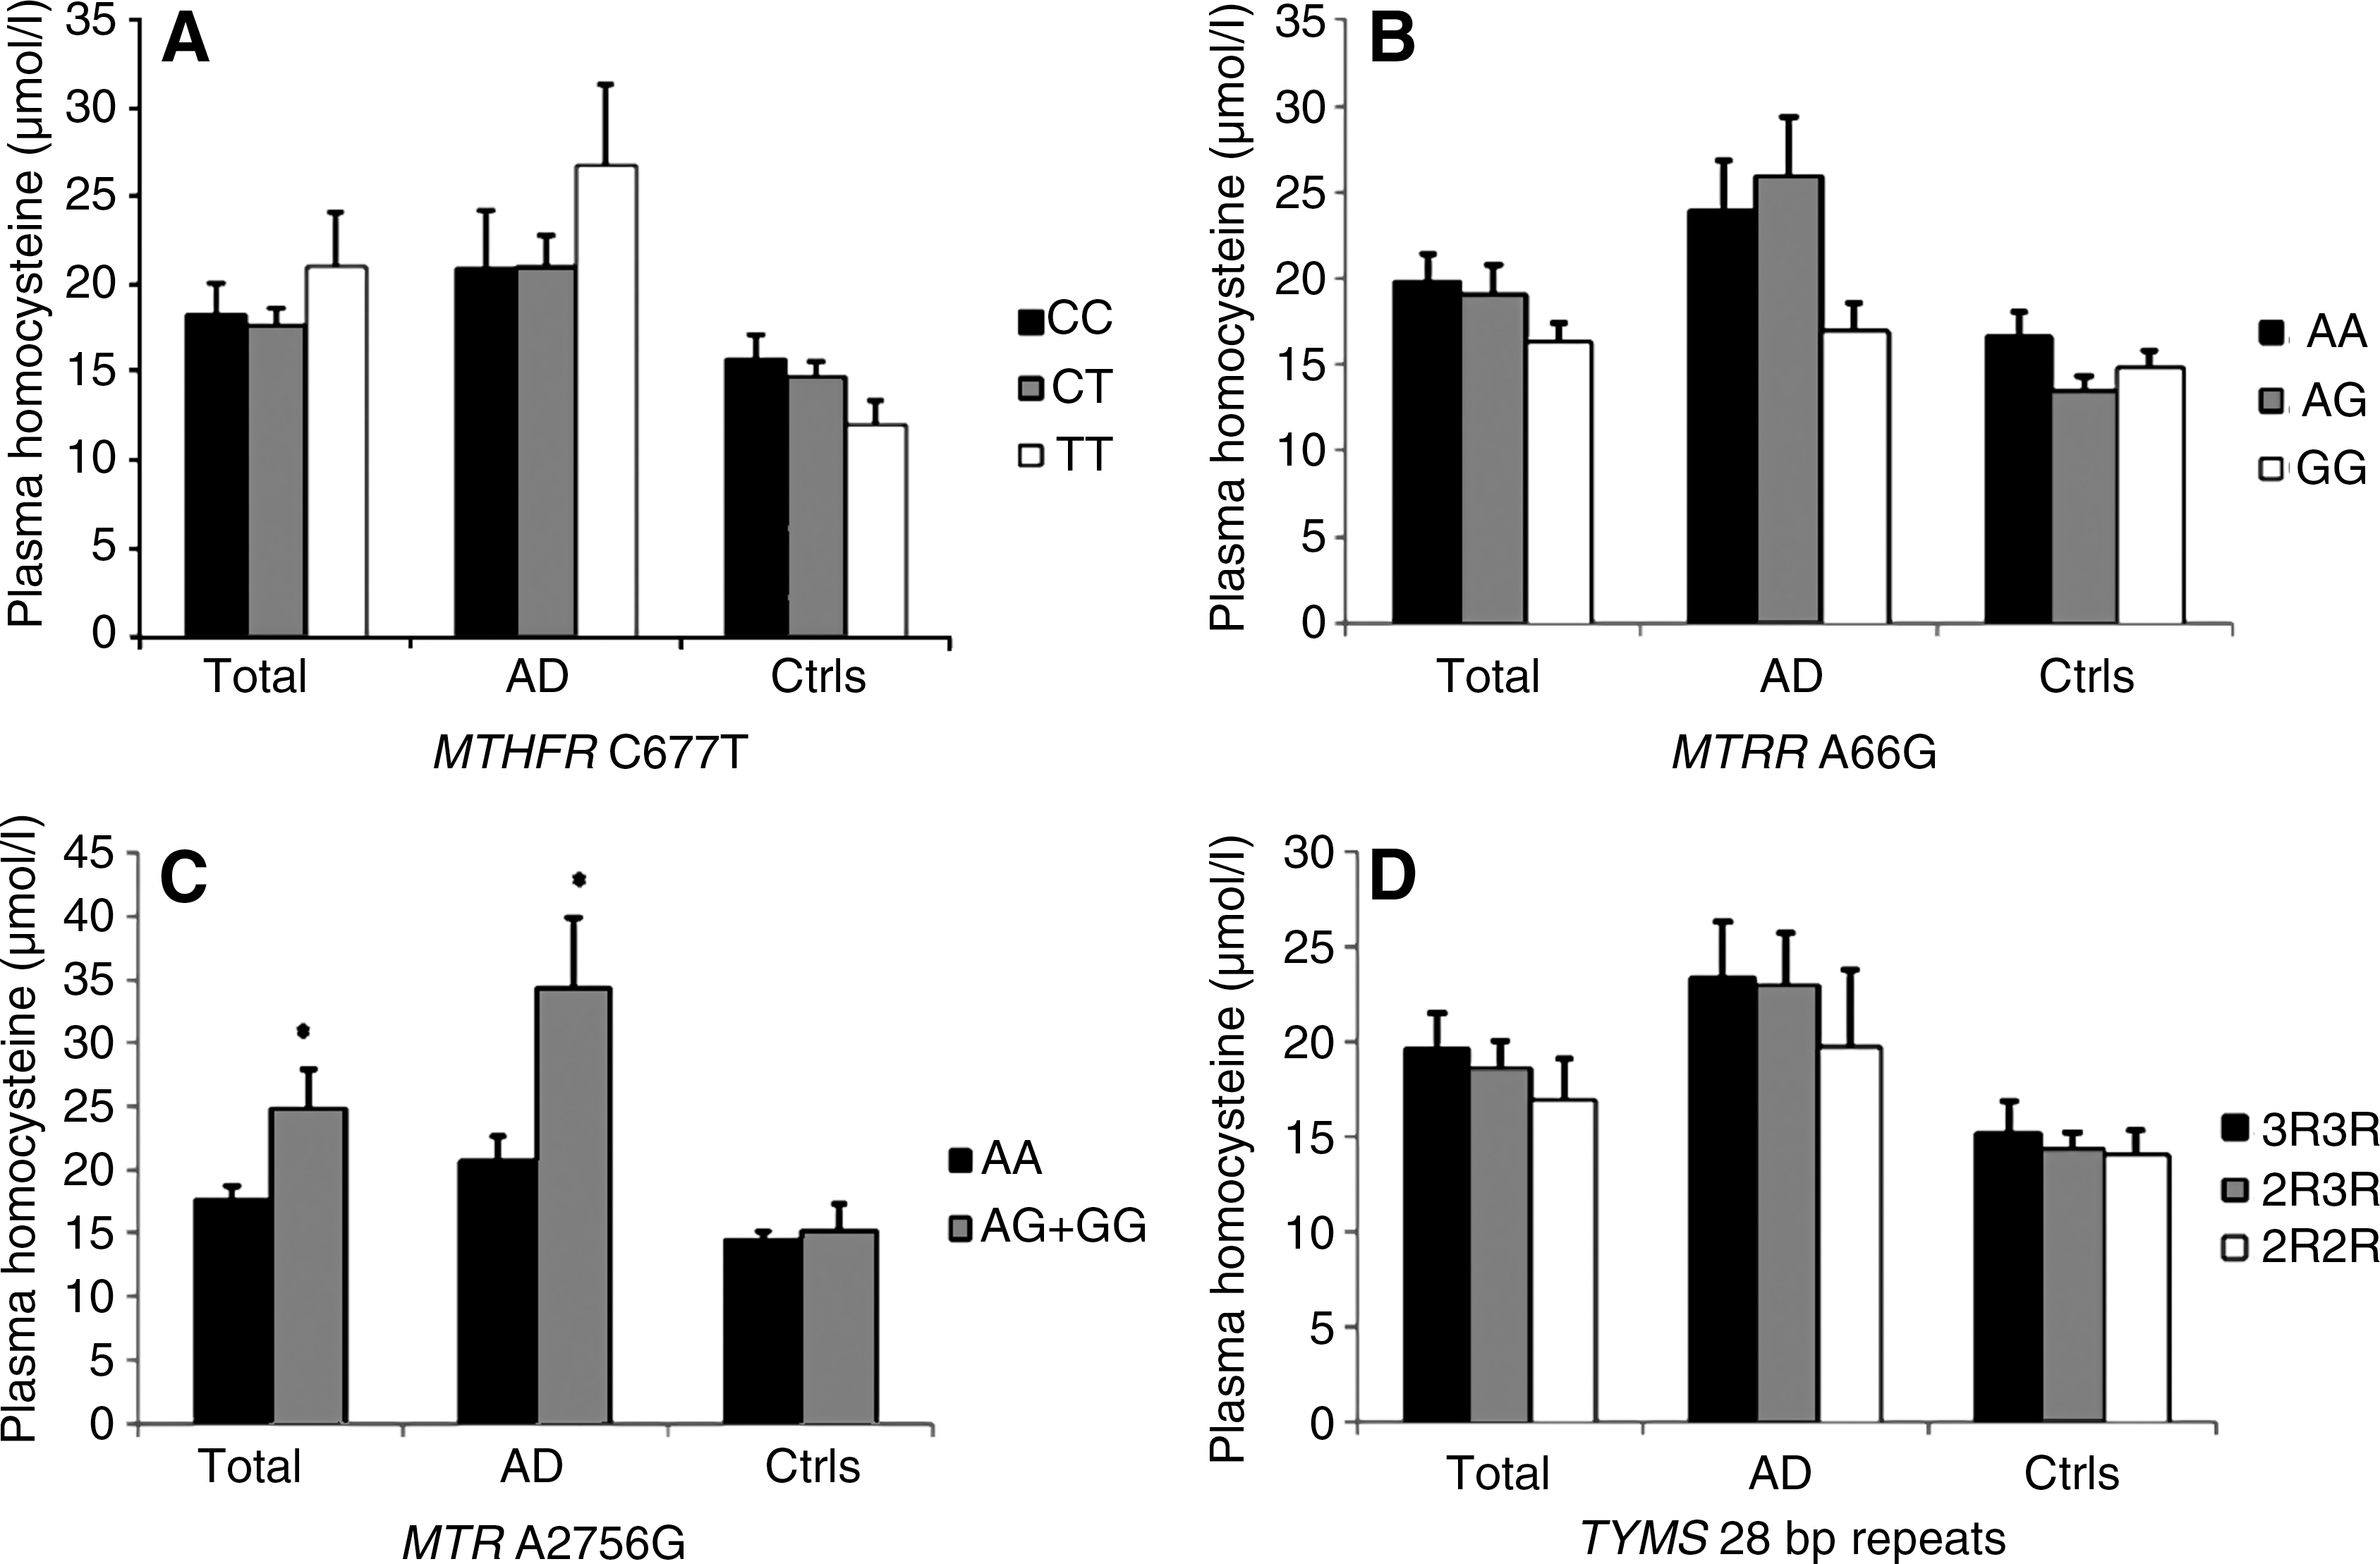
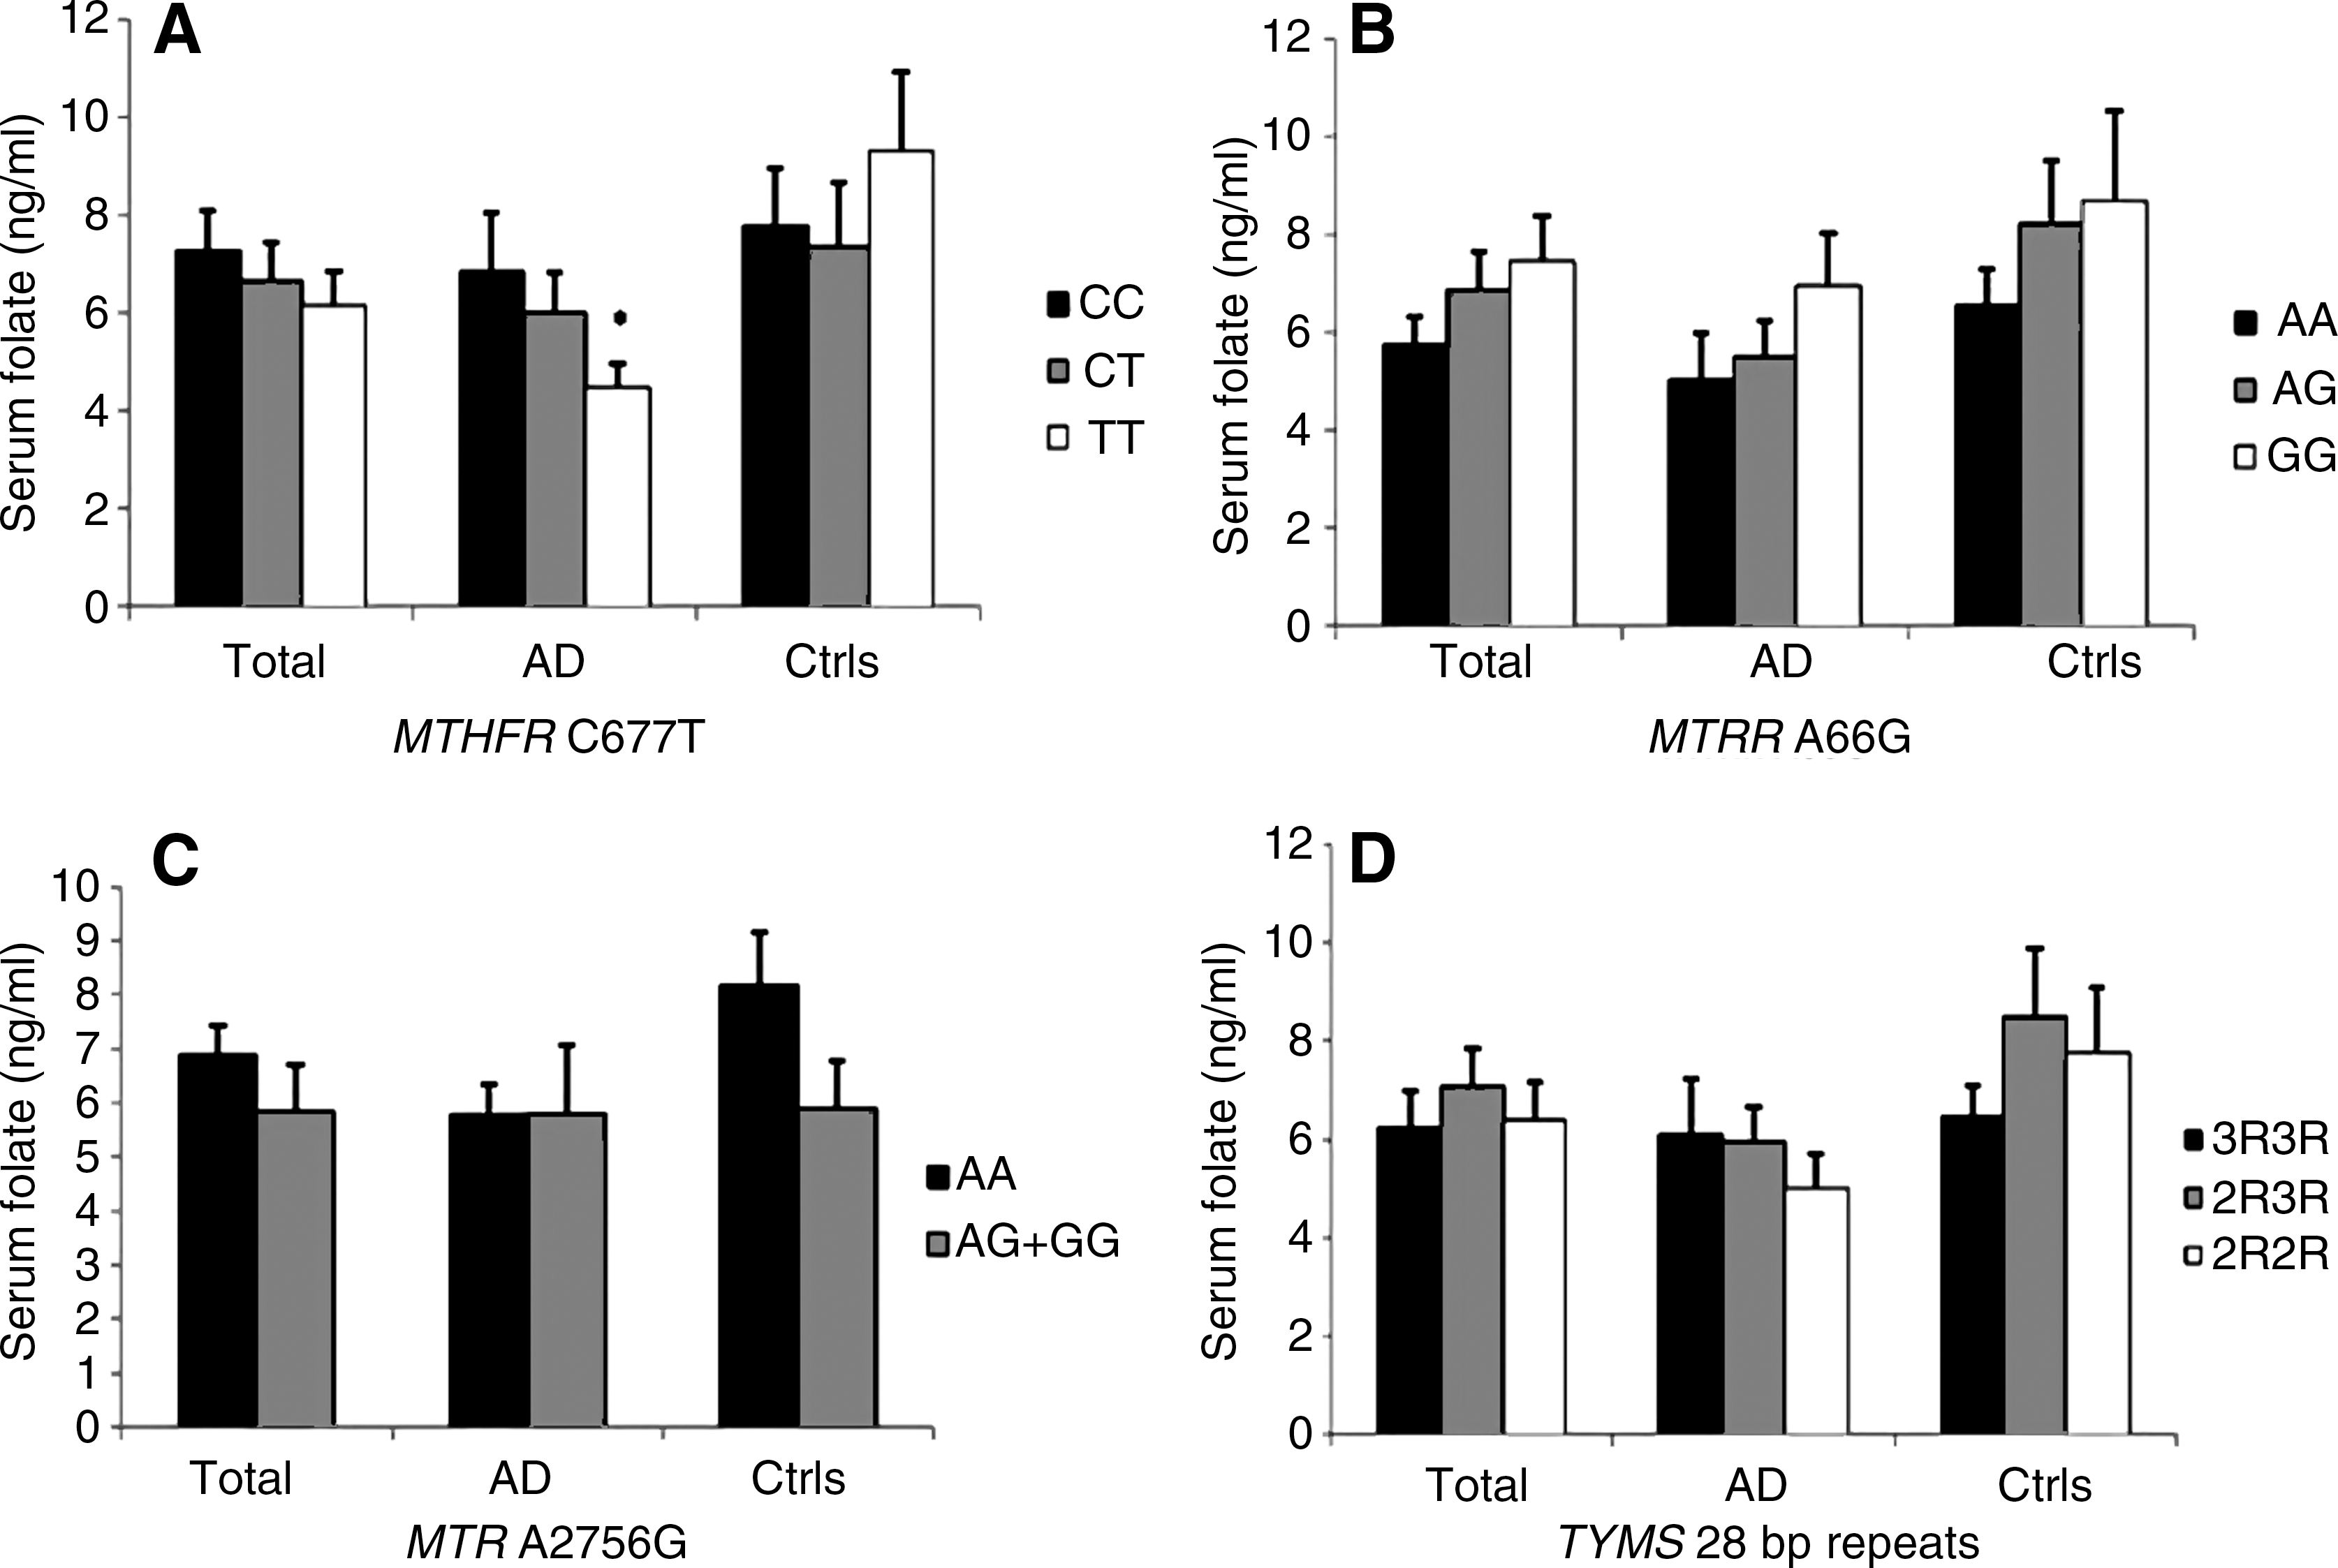
Correlations between plasma Hcy, folate and vitamin B12 values and the different MTHFR, MTR, MTRR, and TYMS genotypes are shown (Figs. 4 –6). Demographic data and genotype distributions of this subgroup of patients and controls are shown in Table 4. ANCOVA analysis showed a correlation between the MTHFR genotype and vitamin B12 levels in the total population (p=0.034) (Fig. 6A). Moreover, in the LOAD subgroup the MTHFR genotype was significantly associated with both vitamin B12 (p=0.018) (Fig. 6A) and folate values (p=0.049) (Fig. 5A), particularly after pooling together MTHFR 677CT+TT subjects (p=0.005 for vitamin B12, and p=0.019 for folate, respectively). The MTRR genotype was associated with serum vitamin B12 values in control subjects (p=0.0016) (Fig. 6B), particularly after pooling together MTRR 66AG+GG individuals (p=0.0003). The MTR genotype was associated with plasma Hcy values in the total population (p=0.04) and in the LOAD subgroup (p=0.041) (Fig. 4A); we always pooled together MTR 2756AG+GG genotypes in the analyses (Figs. 4 –6) because of, as shown in Table 4, we only had two MTR 2756TT individuals, one LOAD patient and one control, respectively. TYMS genotypes were not associated with plasma Hcy, folate, or vitamin B12 values (Figs. 4 –6).

Discussion
We observed a significant increased frequency of the MTHFR 677T allele and of MTHFR 677CT and TT genotypes in LOAD subjects with respect to controls. A significant increased frequency of the MTRR 66G allele and of the MTRR 66GG genotype in the LOAD group was also observed (Tables 2 and 3). Significantly increased mean plasma Hcy levels and decreased serum folate values were found in LOAD subjects than in controls, whilst serum vitamin B12 was decreased in LOAD subjects but the difference with controls did not reach statistical significance (Fig. 3). Present data are in agreement with the most recent meta-analyses of the literature (13, 29, 40), overall indicating increased plasma Hcy levels and decreased serum folate and vitamin B12 values in AD subjects. Interactions between the studied polymorphisms and biochemical data were observed (Figs. 4 –6). None of the studied polymorphisms was associated with disease age at onset (Fig. 2).
A meta-analysis of 26 genetic association studies aimed at addressing the possible contribution of the MTHFR 677C>T polymorphism to AD risk revealed a significant association of the MTHFR 677T allele with AD risk (OR=1.13; 95% CI=1.04–1.23). After stratification into ethnics groups, a strong association was observed in Asian studies (OR=1.25; 95% CI=1.05–1.50) (
Folate bioavailability is another important factor interacting with MTHFR gene polymorphisms in impairing MTHFR activity. The MTHFR protein works as a dimer which is stabilized by physiological levels of folates, and MTHFR 677TT individuals are particularly subjected to dimer destabilization under conditions of reduced folate biovailability (17, 25).
We also observed that MTHFR 677TT LOAD subjects showed the lowest mean values of folate (Fig. 5A). These data are in agreement with several previous studies reporting decreased serum folate levels in MTHFR 677TT individuals that foster increased Hcy levels (9, 25). Indeed, we observed a significant inverse correlation between serum folate and plasma Hcy values in our population and, as shown in Figure 4A, MTHFR 677TT LOAD subjects had higher mean Hcy values than CC or CT individuals, though the difference was not significant. We also observed a significant correlation between the MTHFR 677T allele and serum vitamin B12 values in the total population and in LOAD subjects, further indicating that this gene variant might affect several vitamins involved in one-carbon metabolism (Fig. 6A).
Present results suggest that the MTRR 66G allele, particularly in homozygosis, might modestly increase LOAD risk (Tables 2 and 3). Our search of PubMed as well as other public available databases, such as the AlzGene database (
At best of our knowledge the present is the first genetic association study aimed at addressing the contribution of TYMS variants to LOAD risk. The TYMS 28bp repeat polymorphism was not associated with LOAD risk (Tables 2 and 3) or disease age at onset (Fig. 2). We also failed to observe any correlation between the studied polymorphism and biochemical variables (Figs. 4 –6).
Overall, present data confirm previous findings of the literature suggesting that AD patients are characterized by hyperhomocysteinemia and decreased serum folate values (8, 29, 40), as well as the possible involvement of polymorphisms of genes participating in one-carbon metabolism to both folate, Hcy, and vitamin B12 values and disease risk (16, 29, 38). Even if it is still debated whether hyperhomocysteinemia and impaired folates are a cause or rather a consequence of dementia (40), recent evidence of a possible contribution of epigenetic modifications to disease pathogenesis (11, 12, 32) indicates that further investigation of the one-carbon metabolic pathway in AD is warranted. Particularly, the analysis of postmortem brains revealed a marked reduction of DNA methylation in cortical neurons of AD samples with respect to controls (18, 19).
Others observed that genes that participate in Aβ processing and one-carbon metabolism, including PSEN1, MTHFR, and DNMT1, show interindividual epigenetic variability and an age-specific “epigenetic drift” that might contribute to LOAD predisposition (32). Studies in rodents and human neuroblastoma cells revealed that B vitamin restriction results in hypomethylation of the PSEN1 promoter, with subsequent PSEN1 overexpression and Aβ deposition. By contrast, SAM administration reversed the effects of B vitamin restriction (11, 12). Early life exposure of monkeys and rodents to lead (Pb) resulted in epigenetic modifications of AD genes, such as APP, and subsequent overexpression later in life (3, 34). In addition, the reduced methylation potential resulting from impaired one-carbon metabolism contributes to a deregulation of the equilibrium between protein kinases and phosphatases regulating tau phosphorylation, leading to abnormal hyperphosphorylated tau and NFT formation (6, 24, 37). Overall, there is broad evidence linking impaired one-carbon metabolism to epigenetic modifications critical to either Aβ deposition or NFT formation, making this pathway a timely hot topic in AD research.
Materials and Methods
Study population
The study was performed on LOAD patients and controls with similar geographic origins (all individuals were Caucasians from North-West Tuscany and neighboring areas). DNA samples from a total of 378 LOAD patients were collected at the Department of Neurosciences, University of Pisa, and at the Department of Neurological and Psychiatric Sciences, University of Florence. Diagnosis of probable AD was performed according to DSM-IV (1) and NINCDS-ADRDA criteria (20). DNA samples collected from a group of 308 age- and sex-matched nondemented healthy volunteer subjects were used for normal controls. Family history of dementia was ascertained, excluding all the subjects with even one relative who developed AD or other dementias. All the control subjects were evaluated in order to exclude the presence of cognitive impairment. Each subject gave an informed and written consent for genotype analysis before blood drawing. The study was performed in accordance with the Declaration of Helsinki, following the requirements of the local Ethics Committee, Faculty of Medicine, University of Pisa. Demographic characteristics of the case-control group are shown in Table 1.
Genotyping
Genomic DNA was isolated from whole blood by means of the QIAamp® Blood Mini Kit (Qiagen, Milan, Italy), and stored at −20°C until assayed. Genotype analyses were performed by means of PCR-RFLP technique as previously described (7). Digestion products were visualized after electrophoresis on a 3% agarose gel stained with ethidium bromide. Internal control samples, whose genotypes had been previously assessed, were always included and analyzed on each gel.
Biochemical analyses
Data on plasma Hcy, folate, and vitamin B12 were available in our databases for a total of 94 LOAD patients and 74 healthy controls (Table 4, Fig. 3). As shown in Table 4, this subgroup of LOAD subjects and controls was not perfectly matched for gender and age at sampling. This was mainly due to the fact that, in order to achieve a large number of cases and controls for the genetic association studies, we used DNA samples collected over several years and stored in our gene banks. All the individuals enrolled in the study agreed to donate their DNA for research purposes at the time of DNA collection, but not all were favorable to take additional blood drawings for biochemical analysis. Therefore, we always corrected for age and gender during statistical analyses, in order to minimize the effects of these two variables. Peripheral blood samples from LOAD patients and controls had been collected during the neurological visit. Plasma was immediately separated and stored in freezer at −80°C. All the analyses were performed with standard protocols at the diagnostic laboratory of the University Hospital of Pisa. Plasma Hcy was measured by liquid chromatography/tandem mass spectrometry. Serum folate and vitamin B12 were determined by electrochemiluminescence immunoassay analyses.
Statistical analyses
To verify that allele frequencies were in Hardy-Weinberg equilibrium, and to assess differences in allele distributions between groups, we used the Chi-square (χ2) analysis. The differences in genotype frequencies were analyzed between the case and the control group by 2×2 contingency tables using χ2 analysis. Odds ratios (ORs) have been calculated by means of logistic regression analysis and given with 95% confidence intervals (CIs). All individual values were analyzed with the SPSS 11.0 statistical package for Windows. The statistical power of the study was evaluated by means of the statistical package QUANTO 1.2.4.exe. Test for association between each of the studied polymorphisms and disease age at onset was performed by means of one-way analysis of variance (ANOVA) using the STATGRAPHICS 5.1 Plus software package for Windows.
Linear regression analysis was performed to search for correlation among the studied biochemical data (i.e., plasma Hcy, folate, and vitamin B12 values). Linear regression was also applied for correlation among each of the biochemical data and age at sampling. The effect of gender on mean plasma homocysteine, folate, and vitamin B12 levels was evaluated by means of ANOVA, including age at sampling as a covariate. Differences in mean plasma homocysteine, folate, and vitamin B12 levels between groups were evaluated by means of analysis of covariance (ANCOVA), including age at sampling and gender as covariates. ANCOVA was also used to correlate biochemical data with each of the studied polymorphisms, including age, gender, all the other biochemical data, and all the other studied polymorphisms as covariates. Since the plasma concentrations of homocysteine, folate, and vitamin B12 had a skewed distribution, natural logarithm transformation of all values was done before analysis. Analyses were performed with the STATGRAPHICS 5.1 Plus software package for Windows.
Footnotes
Author Disclosure Statement
No competing financial interests exist for any of the authors.