
Abstract
A genetically encoded sensor for parallel measurements of phosphatidylinositol 3-kinase activity and hydrogen peroxide (H2O2) levels (termed PIP-SHOW) was developed. Upon elevation of local phosphatidylinositol 3,4,5-trisphosphate (PIP3) concentration, the sensor translocates from the cytosol to the plasma membrane, while a ratiometric excitation change rapidly and simultaneously reports changes in the concentration of H2O2. The dynamics of PIP3 and H2O2 generation were monitored in platelet-derived growth factor-stimulated fibroblasts and in T-lymphocytes after formation of an immunological synapse. We suggest that PIP-SHOW can serve as a prototype for many fluorescent sensors with combined readouts. Antioxid. Redox Signal. 17, 505–512.
Introduction
Phosphorylated forms of phosphoinositide lipids (PIPs) transduce signals via recruiting the PIP-binding domains that vary in their selectivity toward the number and position of phosphates of the inositol ring, allowing a fairly precise specificity of downstream signaling activation (8). One important lipid messenger is phosphatidylinositol 3,4,5-trisphosphate (PIP3). Phosphatidylinositol 3-kinase (PI3K) phosphorylates PI(4,5)P2 to PIP3, while the lipid phosphatase and tensin homolog (PTEN) reverses the phosphorylation (7). FPs fused with PIPn-sensitive protein domains allow monitoring of PIPn formation by translocation of the fluorescently labeled domain from the cytosol to the plasma membrane (PM) (8).
The global signaling activity of hydrogen peroxide (H2O2) is much less commonly addressed (3). H2O2 selectively and reversibly oxidizes a small population of cysteines that tend to be deprotonated at physiological pH (9). H2O2 production by NADPH oxidase (NOX)/dual oxidase (DUOX) enzymes and generation of PIP3 by receptor tyrosine kinase activation can be highly cooperative: The NOX subunits p47 and p40 are recruited to membranes by their PX domains that recognize products of PI3K activity and activate the oxidase activity (4). The subsequent H2O2 production then generates a positive feedback loop by oxidizing the active-site thiolate of PTEN, leading to an increased lifetime of PI3K products (5). To delineate the interplay of both signaling molecules more precisely, simultaneous detection of both PI3K activity and H2O2 levels would be necessary.
Innovation
Combinations of various fluorophores with distinct excitation and emission spectra in a single cell enable monitoring of multiple cellular processes simultaneously, usually termed multiparameter imaging. We successfully combined two different readouts in a single probe: ratiometric for hydrogen peroxide (H2O2) and translocation for phosphatidylinositol 3-kinase. The probe simultaneously detects the lipid messenger phosphatidylinositol 3,4,5-trisphosphate (PIP3) and H2O2, showing that the two signals are highly cooperative. The performance of the sensor was tested in two cellular models, including immunological synapse formation of primary human T-cells, where we use it for kinetical measurements of two second messengers simultaneously. Making use of the subcellular localization of PIP3 at the immune synapse, we are able to analyze H2O2 in subcellular domains with good resolution and a very good signal-to-noise ratio. Our data show as a proof of principle that different readouts can be easily combined in a single sensor, increasing a number of measured substances in a multiparameter imaging and minimizing a number of expression constructs.
Genetically encoded sensor for H2O2, HyPer, is based on insertion of a yellow FP into regulatory domain of Escherichia coli H2O2 sensor OxyR (2). Upon oxidation and S-S bond formation within the OxyR domain, the excitation spectrum of HyPer changes in a ratiometric manner, proportionally decreasing its 420 nm and increasing its 500 nm excitation peak. Considering the interdependence of H2O2 and PI3K signaling, the simultaneous and spatially resolved measurement of both is desired in many cases. For this purpose, we have generated a sensor that reported changes in both PIP3 and H2O2 concentration utilizing two different types of readout. Fusing HyPer with a PIP3-sensitive PH domain should allow visualization of both PIP3 generation (by translocation of the probe from the cytoplasm to the PM) and of H2O2 generation (by monitoring the excitation ratio 500/420 nm of HyPer).
Results, Discussion, and Future Directions
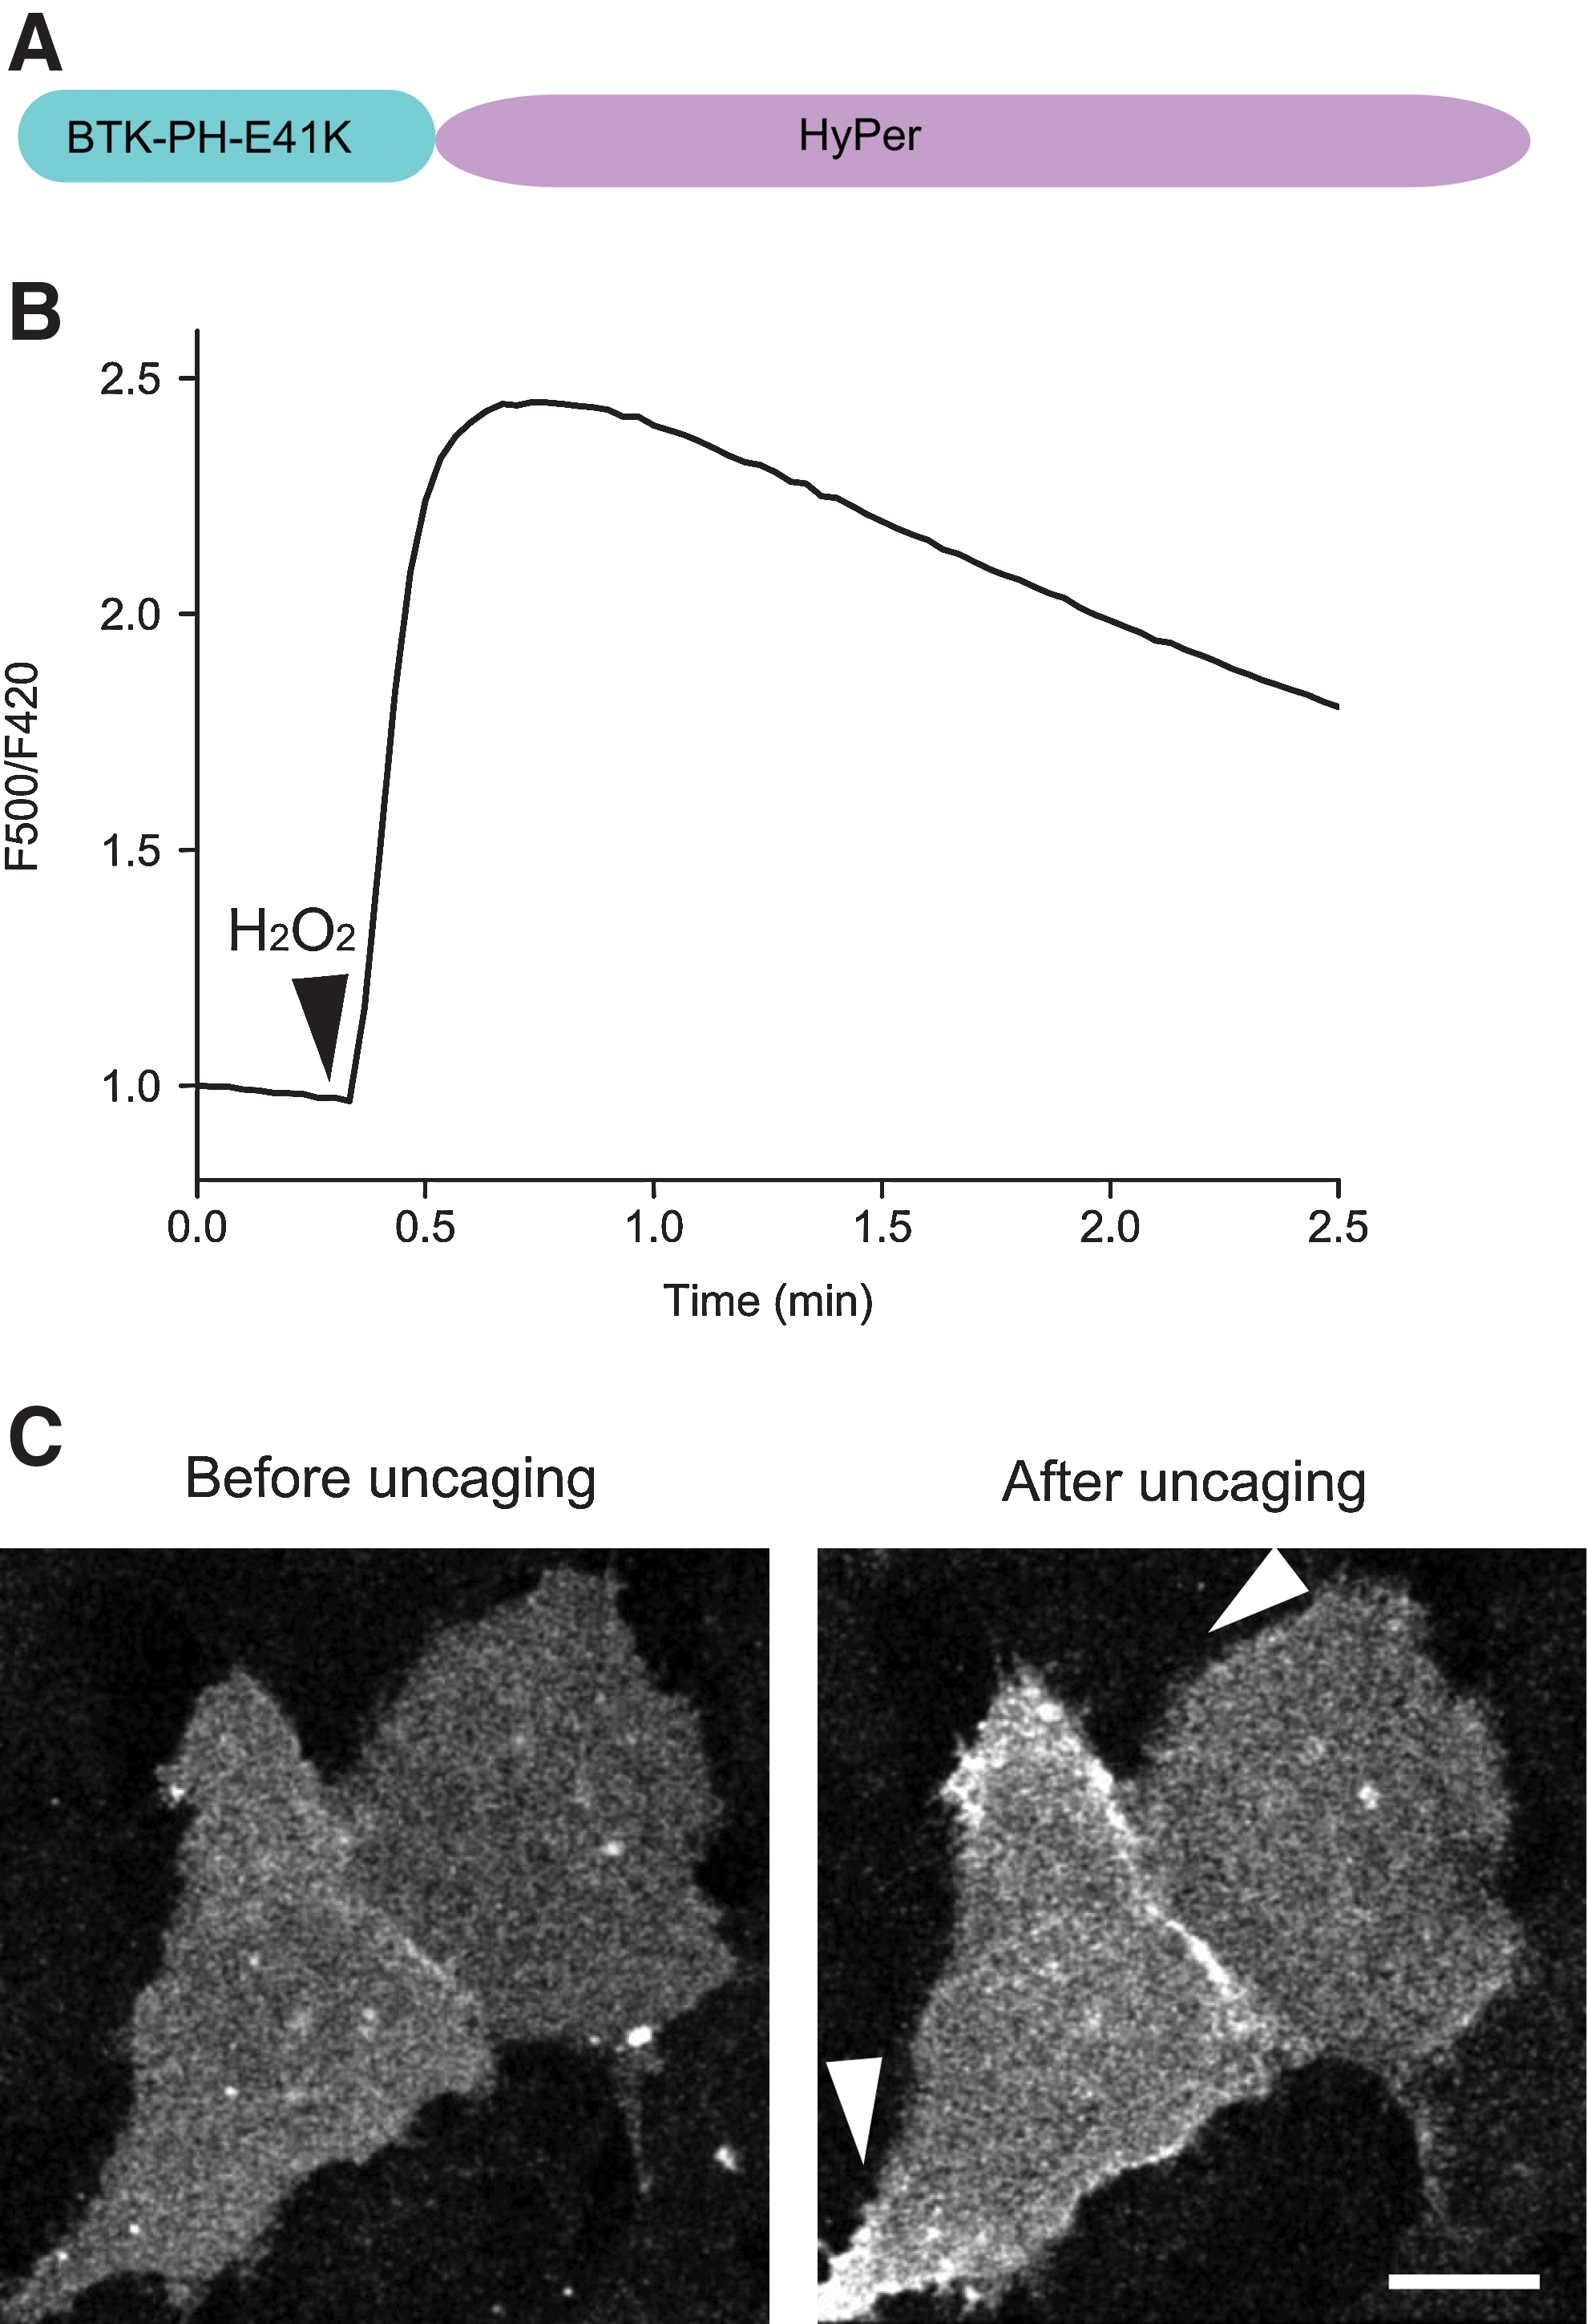
To generate a dual, PI3K and H2O2, sensor, we fused HyPer with a mutated PH domain (E41K) of Bruton's tyrosine kinase (BTK). The resulting reporter, named PIP-SHOW (PIP3 and − SH Oxidation Watching) (Fig. 1A), emitted fluorescence signals in the expected wavelength range (500–550 nm) when expressed in NIH-3T3 fibroblasts. We then verified if the PIP-SHOW retained the ability of both domains, BTK-PH-E41K and HyPer, to respond to the respective stimuli, H2O2 and PIP3. Addition of H2O2 resulted in the expected change in the probe's excitation ratio (Fig. 1B) similar to that of HyPer. Incubation of cells with 10 μM of a membrane-permeant photoactivatable version of PIP3 (cgPIP3/AM) and subsequent brief illumination with 405 nm light led to partial redistribution of the probe to the PM (Fig. 1C). Hence, both the translocation domain and the HyPer performed correctly.
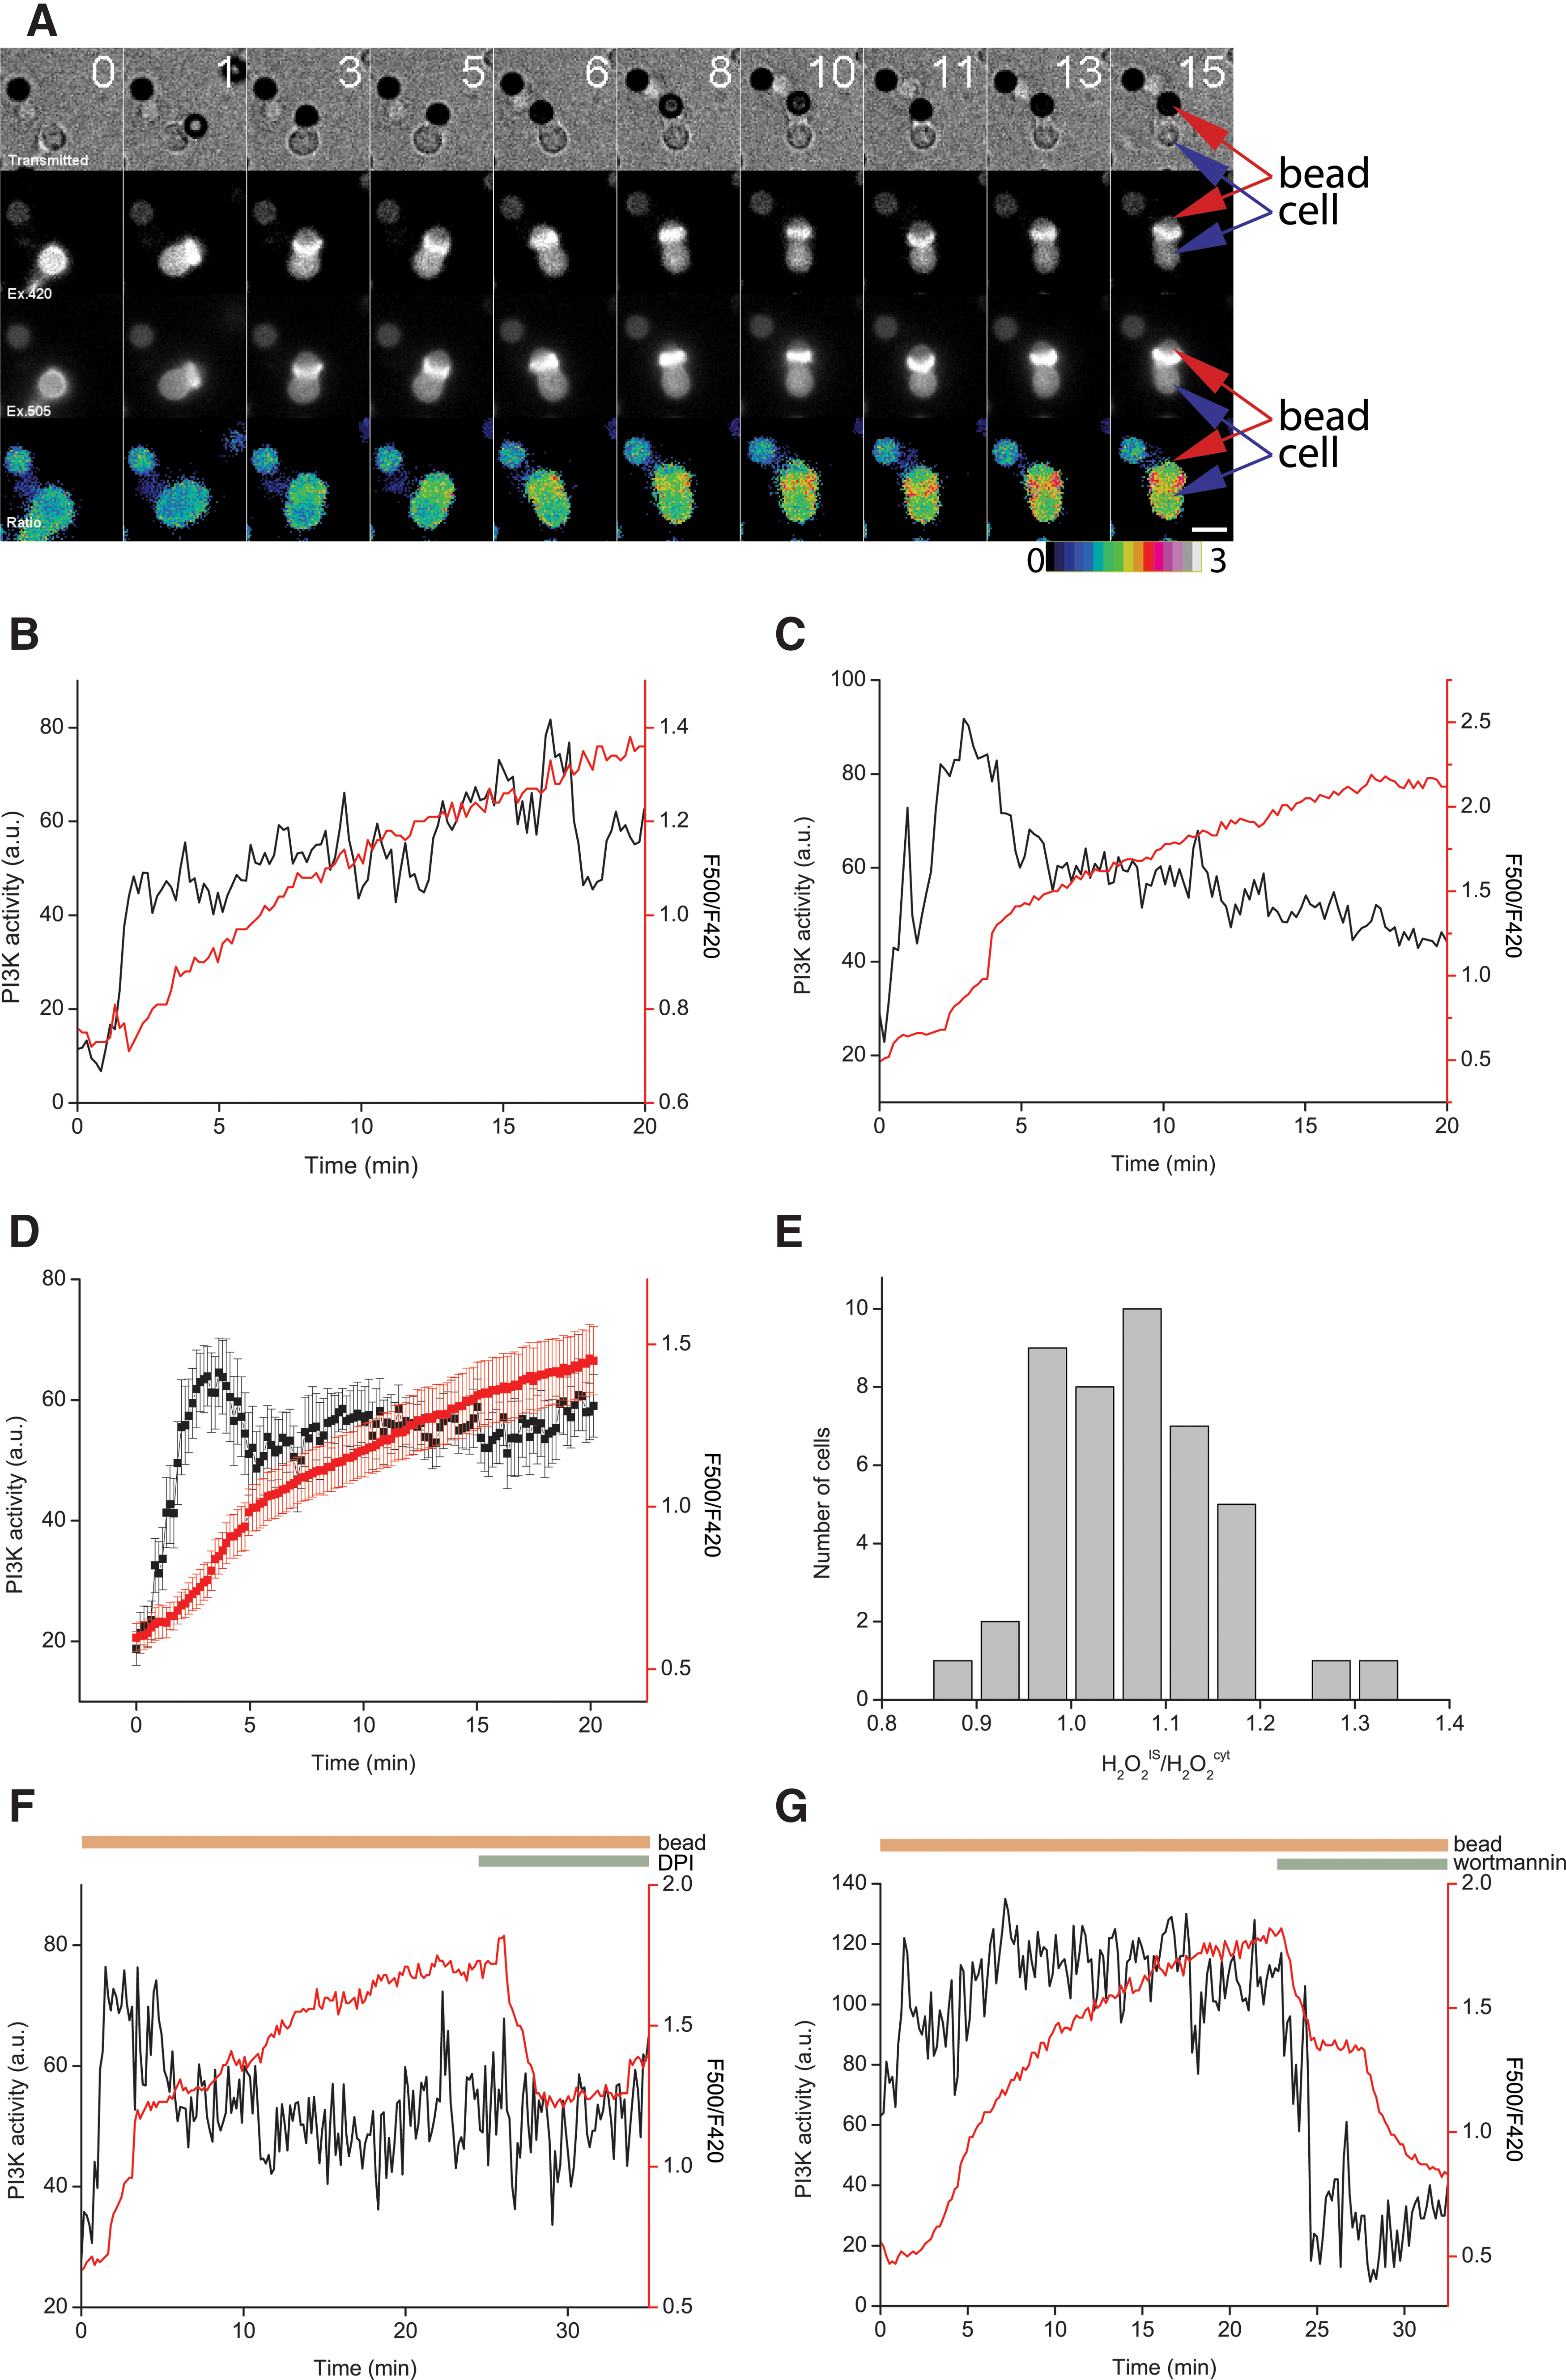
To further characterize PIP-SHOW, we stimulated NIH-3T3 fibroblasts with platelet-derived growth factor (PDGF) and analyzed the fluorescence signals over time. Addition of PDGF initiated translocation of the probe to the PM reflecting PI3K activation and caused a significant change in the excitation ratio 500/420 nm, indicating generation of H2O2 (Fig. 2A; Supplementary Video S1). To quantify PI3K activity and H2O2 production in more detail, we analyzed their respective dynamics within single cells. Both signals were initially highly cooperative (Fig. 2B–E). Furthermore, Figure 2A–E showed that while both signals rose at similar times, PI3K accumulation reversed with a much slower time course, while H2O2 production was strictly transient. This indicates that both signals are not necessarily coupled for prolonged periods of time and highlights the importance of a dual sensor such as PIP-SHOW. This difference in kinetics could result from different sensitivities of the two domains comprising PIP-SHOW. However, this scenario is unlikely given their high sensitivity: BTK-PH-E41K domain was able to detect resting PIP3 in the membrane of nonstimulated T-cells (see below) and the OxyR-RD domain of HyPer has extremely high reaction rates with H2O2 (107 M−1s−1), enabling intracellular H2O2 detection even in the presence of peroxiredoxins and glutathione peroxidases. PIP-SHOW does not completely translocate to the PM, and this allows comparison of the excitation ratio between the PM and the cytoplasm. Figure 2A shows that NIH-3T3 cells generate H2O2 in the vicinity of the PM, and that this H2O2 is unable to distribute uniformly throughout the cytoplasm. Because PI3K activity acts upstream of NOX/DUOX activation (4), we analyzed the effect of the PI3K inhibitor wortmannin on PI3K activity and H2O2 production, after stimulation with PDGF. Figure 2F shows that wortmannin prevented PI3K translocation but also inhibited H2O2 production. To further characterize PIP-SHOW, we inhibited NOX enzymes with diphenyleniodonium (DPI). Obviously, DPI led to a rapid drop in PIP-SHOW ratio reflecting decrease in H2O2 production (Fig. 2G). Because we did not observe a decrease in PIP3 levels after DPI treatment, a potentially possible feedback loop between PI3K and NOX/DUOX activity via PTEN inhibition can be excluded.

Next, we utilized PIP-SHOW to study lipid and redox signaling events in the first phase of CD4+human T helper (TH) cell activation (Supplementary Data). Transient expression of PIP-SHOW in human TH cells led to its localization within the cytoplasm as well as within the nucleus. However, a fraction of the probe showed membrane localization, indicating of pre-existing PI3K activity (Fig. 3A). Stimulation of TH cells expressing PIP-SHOW with anti-CD3/CD28-coated beads led to establishment of stable contacts, immunological synapses (IS), between TH cells and the beads (Fig. 3A; Supplementary Video S2). This was followed by a massive and immediate redistribution of PIP-SHOW to the IS indicative of locally elevated PIP3 levels. The probe remained in the contact region for the duration of the experiment (up to 1 h). Notably, PI3K activity decreased at the rest of the PM of the activated cell as the ring-like fluorescence pattern disappeared immediately after IS formation (Fig. 3A). Furthermore, IS formation also led to a rapid elevation of H2O2, ∼1 min after translocation of the PIP3 sensor (Fig. 3; Supplementary Video S2). Interestingly, in most of the cells H2O2 production was highest in the region adjacent to the central synapse (Fig. 3E), implicating a ring-like localization of NOX/DUOX enzymes around the central IS. DPI quickly attenuated H2O2 production (Fig. 3F), suggesting that PM-localized NOX/DUOX are the source of H2O2. Similar to NIH-3T3 cells, there was no fast positive feedback loop between PI3K and NOX/DUOX activities, as we did not observe a decrease in PIP3 upon addition of DPI (Fig. 3F). However, it is possible that the oxidant-induced decrease in phosphatase activity is only slowly reversible and acts in a long-term memory-like fashion. This might be the reason that a decrease in PIP3 concentration was not detected in the time course of this experiment. Inhibition of PI3K by wortmannin, however, led to a rapid decrease in both PI3K activity and H2O2 production (Fig. 3G) as expected.
We demonstrated that the novel dual-parameter sensor PIP-SHOW is well suited for simultaneous monitoring of PIP3 and H2O2 levels and can thereby serve as a prototype for indicators with combined readouts. The concept of a translocating domain fused to a ratiometric sensor is widely applicable to other combinations of intracellular signaling parameters as well. The second component of PIP-SHOW, HyPer, was designed and used to report H2O2 levels (2). Because HyPer is a protein of moderate size (∼2 green fluorescent protein [GFP] molecules), it can be fused with subcellular localization tags. As HyPer is derived from a bacterially encoded protein, it is unlikely to interfere with other proteins and signaling pathways in mammalian cells. An important advantage of HyPer and therefore PIP-SHOW is the ratiometric response to H2O2, which is independent on the relative amount of the sensor, its redistribution, cell movement, or shape change. Indeed, in the theoretical case of intensiometric readout for H2O2, it would be impossible to discriminate between PIP3 and near-membrane H2O2 during PI3K activation and PIP-SHOW translocation. Thus, the ratiometric nature of HyPer is necessary to allow the simultaneous quantification of H2O2 during PI3K activity. In addition, we also showed that PIP-SHOW is combinable with RFP-based sensors, allowing synchronous measurements of an additional third parameter (Supplementary Fig. S1; Supplementary Data).
We validated PIP-SHOW using two cellular systems in which both PI3K and NOX/DUOX (reactive oxygen species [ROS]) were already shown to be important determinants of several signaling pathways. Our results provide relevant information about the effectiveness of the sensor but also new information about the cooperative dynamics of the two signaling systems. While PDGF stimulated fibroblasts are a well-documented experimental model to study lipid and redox signaling, not much was known about the role of ROS and their interaction with PI3K and, respectively, PIP3 in human TH cells.
In both cellular systems, H2O2 and PIP3 demonstrated a high degree of synchronicity, particularly in the initial phase after stimulation (see Figs. 2 and 3). In fibroblasts, however, the decrease in H2O2 was accompanied by decrease in PIP3 only in a fraction of the cells. In polarized T cells, on the other hand, the PI3K activity rapidly redistributed and increased at the IS and decreased in the rest of the PM. The H2O2 distribution demonstrated a higher degree of heterogeneity: whereas in most of the cells highest H2O2 levels were detected at the IS, in some H2O2 was more evenly distributed (Fig. 3E). Nevertheless, in most cases the source of H2O2 was visibly associated with either the PM or, more specifically, the IS. Interestingly, in contrast to fibroblasts, PI3K activity in the stimulated TH cells started before H2O2 production was detectable with HyPer (Figs. 2 and 3). More physiological studies are needed to determine the functional role of local ROS microdomains close to the IS not only in TH but also in other immune cells.
PIP3 concentration at the PM is a result of the concerted action of the PI3-kinases and lipid phosphatases. The latter contain, similar to protein tyrosine phosphatases, thiolates in the active site, rendering them redox sensitive. H2O2 was shown to oxidize the lipid phosphatase PTEN, enabling positive feedback loop in the phosphorylation cascade. We would therefore expect to see a decrease in PIP3 concentration upon elimination of H2O2. The kinetics of PIP-SHOW disulphide reduction should be similar to the reduction of the phosphatases. To our surprise, in both experimental models we did not see an effect of NOX inhibition on the PIP3 content. While the HyPer signal (H2O2) decreased rapidly upon addition of DPI, the localization of the PH domain did not change, indicating that PIP3 concentrations did not decrease significantly. A possible explanation is that in strongly stimulated cells, PI3K activity is dominating over phosphatases activity in such a way that inhibition of the phosphatases (at least lipid phosphatases) by H2O2 does not shift the equilibrium significantly. Another interpretation might be an increased sensitivity of the probe to PIP3 due to the E41K mutation that prevents retrograde translocation of the sensor. However, this explanation appears unlikely because inhibition of PI3K by wortmannin led to rapid redistribution of the probe from PM to cytoplasm, implicating a high lipid phosphatase activity.
In summary, we successfully combined two different readouts in a single probe. In fact, a variety of translocation-based sensor domains are suitable to be fused with any ratiometric indicator regardless whether it is single fluorophore or a Forster resonance energy transfer pair. Ratiometric sensors can serve as the fluorescence tags instead of conventional FPs, and they can provide additional read-out parameters, such as 2nd messenger concentrations in time-lapse imaging experiments. Obvious other benefits are that only a small part of the usable spectra is occupied and additional colors may be used for other sensors in a multiparameter imaging setup. Most importantly, only one expression construct is needed for the dual-parameter readout, which makes the relative quantification and the interpretation of the results much easier.
Notes
Materials used
H2O2, DPI, EGF, and PDGF-BB were purchased from Sigma. Dulbecco-phosphate-buffered saline, Dulbecco's modified Eagle's medium (DMEM), Opti–minimal essential medium (MEM), MEM, fetal calf serum (FCS), and FuGene6 transfection reagent were from Invitrogen. Glass-bottomed dishes were fromMatTec. NIH-3T3 cells were from ATCC. HeLa-Kyoto cell line was provided by EMBL. Encyclo polymerase chain reaction (PCR) kit and HyPer expression vectors were from Evrogen. Restriction endonucleaseswere from SibEnzyme.
DNA constructs
To make PIP-SHOW, the PH-domain coding region of BTK was amplified from pEGFP-BtkPH encoding vector using the primers 5′-ATCCGCTAGCATGGCCGCAGTGATTCTG GAGA-3′ and 5′-CGGTGGATCCCCGTTCTCCAAAATTT GGCAGCCCA-3′. The PCR product was digested with NheI and BamHI and cloned into pHyPer-dMito vector (Evrogen) in place of double MTS-coding sequence. It has been shown that E41K mutation increases the affinity of the BTK-PH to PIP3 (1). To introduce E41K mutation, site-directed mutagenesis of Btk PH-domain was applied using the PCR overlap extension procedure with the primers 5′-CTCCTACTATA AGTATGACTTTGA-3′ and 5′-TCAAAGTCATACTTATAG TAGGAG-3′. All constructs were confirmed by sequence analysis.
Cell culture and transfection
NIH-3T3 cells were cultured in DMEM supplemented with 10% FCS at 37°C in an atmosphere containing 95% air and 5% CO2. Cells were split every 2nd day and seeded on glass bottom dishes. Twenty-four hours later cells were transfected by the mixture of vector DNA and FuGene6 transfection reagent according to the manufacturer recommendations.
Human TH cells were isolated from leukocyte reduction filters from healthy blood donors. First, peripheral blood lymphocytes (PBLs) were purified by a density gradient centrifugation at 450 g for 30 min at room temperature (Ficoll-Paque PLUS, Amersham Biosciences), while the remaining red blood cells were removed using a lysis buffer (155 mM NH4Cl, 10 mM KHCO3, and 0.1 mM EDTA [pH 7.3]). PBLs were resuspended in PBS buffer containing 0.5% bovine serum albumin, and CD4+ TH cells were negatively isolated using CD4+ negative isolation kit (Invitrogen). Naïve TH cells were transfected ∼ 4 h after isolation using Nucleofector II electroporator (Lonza, program U-014) and Human T cell Nucleofector kit (Lonza) according to manufacturer's instructions. Per one million cells 1 μg DNA was electroporated 24 to 48 h after transfection, and the cells were attached (∼10 min, 37°C) to poly-l-ornithine–coated (0.1 mg/ml) glass coverslips, and imaged.
Imaging
The T
cgPI(3,4,5)P3/AM treatment and uncaging
Caged, membrane permeable form of PI(3,4,5)P3, cgPI(3,4,5)P3/AM (6) was dissolved in dimethyl sulfoxide (DMSO) at stock concentration of 10 mM. Just before applying to cells it was mixed with 10% pluronic/DMSO solution (Invitrogen) in 1:1 ratio to facilitate cell entry. cgPI(3,4,5)P3/AM was used on cells in a concentration of 10 μM. Uncaging and imaging were performed on Carl Zeiss LSM 510-META confocal microscope, equipped with environment control box (37°C, 0% CO2), using HCX PL APO Ibd. 60×1.4NA oil objective. Cells were preincubated with cgPI(3,4,5)P3/AM 2 h before uncaging in the imaging medium. For uncaging, cells were illuminated with 405 nm laser (7%) every 10 s. Imaging of PIP3-SHOW was done using 488 nm laser excitation (5%) with 10 s time resolution.
Time series processing
Time series were analyzed using ImageJ software. For H2O2 dynamics calculation, stacks corresponding to 420 and 500 nm excitation peaks of PIP-SHOW were converted to 32 bit after background subtraction. 420-nm stack was thresholded to remove pixel values from background (Not-a-Number function). A 500-nm stack was divided by the corresponding 420-nm stack frame by frame. The resulting stack was depicted in pseudocolors using a “ratio” lookup table. Time course of PIP-SHOW fluorescence was calculated for regions of interest (ROI) inside the imaged cell. The anti-CD3/CD28- coated beads used for T cell stimulation are fluorescent in both channels; however, that fluorescence does not change. The F500/F420 ratio of the beads was set as 1 and all the ratio stacks were normalized to this value. For PI3K activity monitoring, different quantification strategies were applied for the NIH-3T3 cells and for the lymphocytes. For NIH-3T3 cells, two ROI were set up for each cell corresponding to the cytoplasm and to the PM. Distribution of the probe was calculated as Value=(Fmem − Fcyt)/Fcyt. Fmem is a mean value of the fluorescence intensity in a ROI associated with the plasma membrane. Fcyt is a mean fluorescence value in a ROI associated with the cytoplasm. Application of this equation to either 420 or 500 nm channels gives similar results. Since T
Footnotes
Acknowledgments
We thank Christian Junker for help with imaging. This work was supported by the Russian Foundation for Basic Research (10-04-01561-a, V.V.B; 11-04-12187-ofi, S.L); the Ministry of Education and Science of the Russian Federation (16.512.11.2139, 16.740.11.0367); the Measures to Attract Leading Scientists to Russian Educational Institutions program (11.G34.31.0017 to S.L); ESF (TraPPs, C.S); DFG: BO 3643/2-1 to I.B., Schu 943/7-1 to C.S.; SFB 894 and GK 845 to M.H.; NI671/3-1, SFB 894 and GK 1326 to B.A.N; SB Cancer to C.S.
Abbreviations Used
References
Supplementary Material
Please find the following supplemental material available below.
For Open Access articles published under a Creative Commons License, all supplemental material carries the same license as the article it is associated with.
For non-Open Access articles published, all supplemental material carries a non-exclusive license, and permission requests for re-use of supplemental material or any part of supplemental material shall be sent directly to the copyright owner as specified in the copyright notice associated with the article.