
Abstract
Innovation
H2S as a novel gasotransmitter exerts a wide range of actions in our body, and one of the signaling mechanisms of H2S is the post-translational modification of proteins through S-sulfhydration. In this study, we highlight a novel function for H2S in the cellular aging. H2S, which by S-sulfhydration of Keap1 at cysteine 151, enhances Nrf2 nuclear translocation, antioxidant gene transcription, and GSH production, and protects cells from oxidative stress and premature senescence. These findings point to an important function of H2S against cellular aging via the post-translational modification of the Keap1/Nrf2 axis in associated oxidative stress.
Introduction
H2S directly interacts with the sulfhydryl groups of selective proteins, yielding a hydropersulfide moiety (–SSH) in a process termed S-sulfhydration (27). S-sulfhydration is a novel and important redox signaling mechanism in regulating different cellular functions (18). The importance of S-sulfhydration is indicated by the large proportion of S-sulfhydrated proteins, and about 10%–25% of some major liver proteins, including actin, β-tubulin, and glyceraldehyde-3-phosphate dehydrogenase, are S-sulfhydrated (27). H2S also has been shown to S-sulfhydrate p65 at cysteine-38 and mediate the antiapoptotic effect of NF-κB (33). H2S-induced S-sulfhydration of phosphatase PTP1B alters the endoplasmic reticulum stress response (21). More recently, it was reported that H2S modulates cellular redox signaling via direct S-sulfhydration of electrophiles, and this reaction suppresses electrophile-mediated H-Ras activation and cardiac cell senescence, contributing to the beneficial effects of H2S on myocardial infarction-associated heart failure (26).
Aging at the cellular level is known as cellular senescence (1). Several lines of evidence point to the implication of H2S signaling in the process of aging (8, 25, 34). The level of cysteine is significantly decreased in the livers of older mice compared to young mice due to reduced activities of CSE and CBS (8). The mRNA and protein levels of CSE are decreased in the lenses from old rats, and inhibition of CSE activity leads to cataractogenesis in vitro (32). Calorie restriction maintains the normal H2S level in vascular tissues from rats during aging (31). Nematodes exposed to H2S are long-lived (25). The roles of H2S signaling in the aging process and the underlying mechanisms have been unclear.
Oxidative stress has been considered one of the crucial factors associated with cellular senescence (1, 3, 7). Nuclear factor (erythroid-derived 2)-like 2, also known as Nrf2, is a transcription factor that is involved extensively in antioxidant responses (14). In response to oxidative stress, Nrf2 binds to antioxidant-response element (ARE) and promotes ARE-mediated transcription of the genes involved in glutathione (GSH) synthesis and maintenance (14, 35). Under normal and unstressed circumstances, Nrf2 is found mostly in the cytosol bound to Kelch-like ECH-associated protein 1 (Keap1), which promotes Nrf2 ubiquitination and degradation by a Cul3-E3-dependent mechanism (6, 11). Nrf2 can be dissociated from Keap1 directly through post-translational modulation of crucial cysteine residues in Keap1 protein (17). After dissociation from Keap1, Nrf2 translocates to the nucleus and binds to promoters containing the ARE sequence, activating the transcription of antioxidant genes (6, 20). It was shown that H2S upregulates antioxidant defenses through the activation of Nrf2 (2, 12, 13). The mechanisms for H2S-induced activation of Nrf2 and its impact on aging and cellular senescence remain elusive.
In the present study, we analyzed cellular senescence and oxidative stress in MEFs isolated from the mice that lack the expression of CSE (CSE KO mice). Post-translational modification of Keap1, the intracellular redistribution of Nrf2, and changes in the expression levels of various antioxidant proteins in these MEFs were examined. Our study indicates an important role of endogenous H2S in protecting against the cellular aging process.
Results
CSE deficiency reduces H2S production and stimulates senescence in MEFs
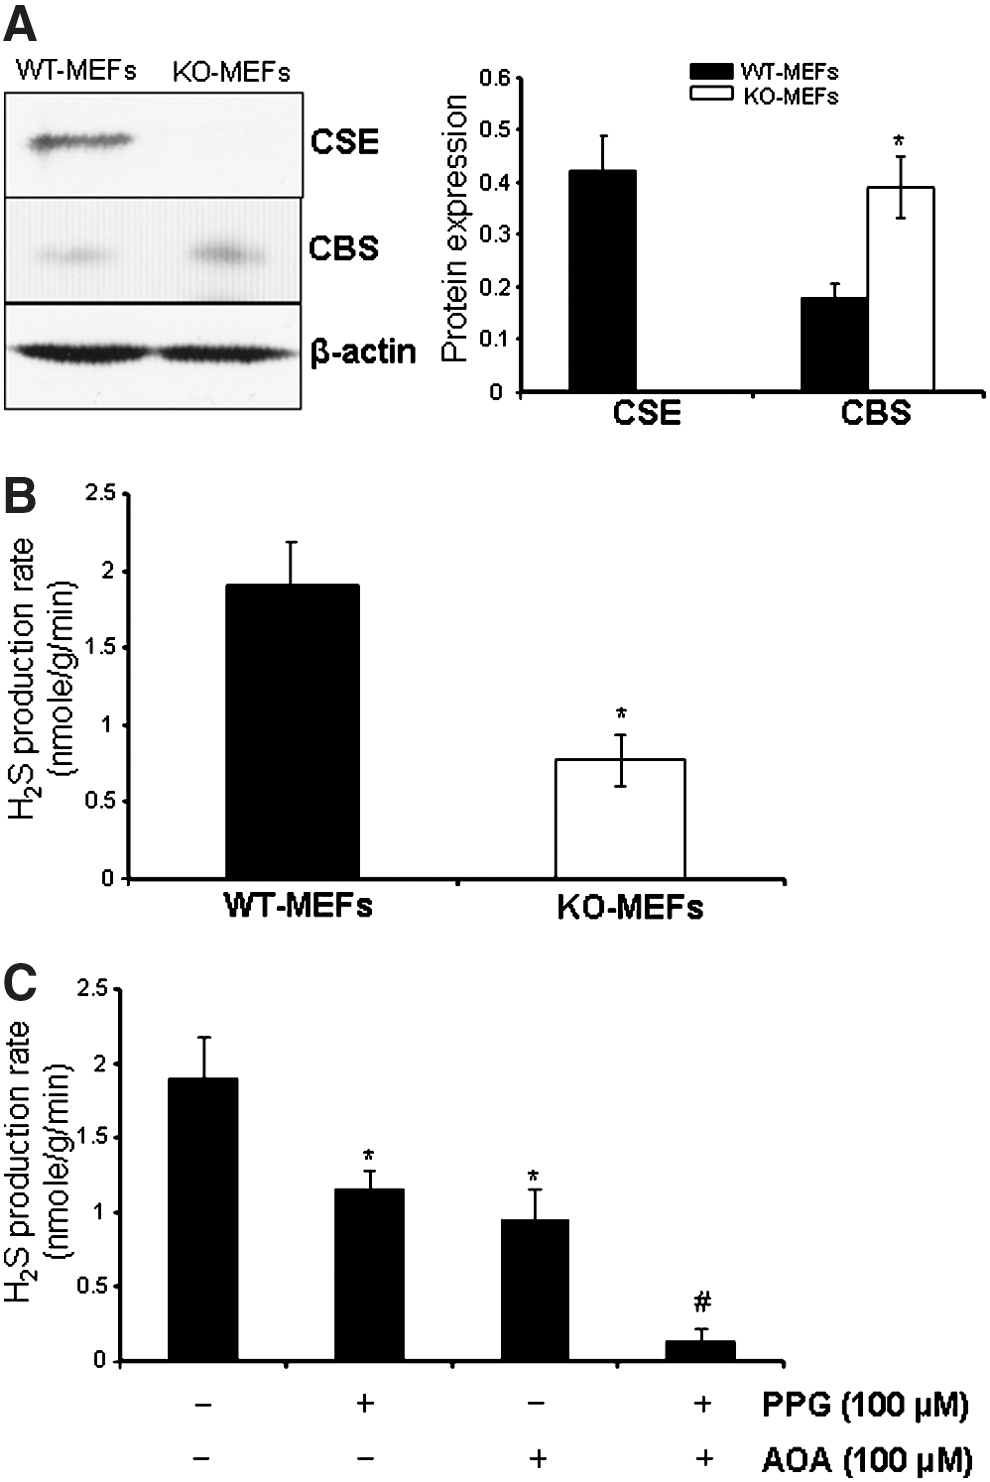
To study whether H2S affects cellular senescence, we isolated MEFs from both CSE KO mice (CSE KO-MEFs) and WT littermates (WT-MEFs). MEFs are commonly used as a model to study cellular senescence (1, 7). CSE protein was not detected (Fig. 1A), and the H2S production rate (Fig. 1B) in KO-MEFs was 40% of that in passage-matched WT-MEFs. CBS is another H2S-producing enzyme. CBS protein expression was significantly increased in KO-MEFs compared with WT-MEFs (Fig. 1A), indicating a partial compensatory reaction in KO-MEFs. Blockage of both CBS and CSE activity by their respective inhibitors, amino-oxyacetic acid and DL-propargylglycine (35, 36, 43), completely inhibited H2S production in MEFs (Fig. 1C), while blockage of CBS or CSE alone only reduced H2S production by 38%–50% (p<0.05), indicating that CBS and CSE both contribute to endogenous H2S production in MEFs.
Starting from passage 1, KO-MEFs showed growth inhibition. KO-MEFs almost stopped growing at passage 7, and the maximum population-doubling number was below 4.5 (Fig. 2A). However, WT-MEFs displayed a normal growth pattern from passage 0 to 9, and the population number reached to 14.2 at passage 9. After passage 9, the population-doubling number for WT-MEFs was dramatically increased and reached to 21.6 at passage 12, possibly as a result of spontaneous immortalization (Fig. 2A). KO-MEFs became enlarged, flattened, and more transparent with a decreased nucleus-to-cytoplasm ratio starting from passage 1 (Fig. 2B), a fingerprint of senescent cells. We stained the cells for senescence-associated β-galactosidase (SA-β-gal), a characteristic of senescent cells (1, 7, 40). Compared with WT-MEFs, KO-MEFs showed higher positive staining for SA-β-gal in a passage-dependent manner. At passages 1, 3, and 6, SA-β-gal-positive cells were 44.6%, 68.2%, and 92.3% for KO-MEFs, but only 4.8%, 7.1%, and 22.1% for WT-MEFs (Fig. 2C, p<0.05), respectively. Substantial cell cycle arrest was found in KO-MEFs in comparison with WT-MEFs (Fig. 2D).
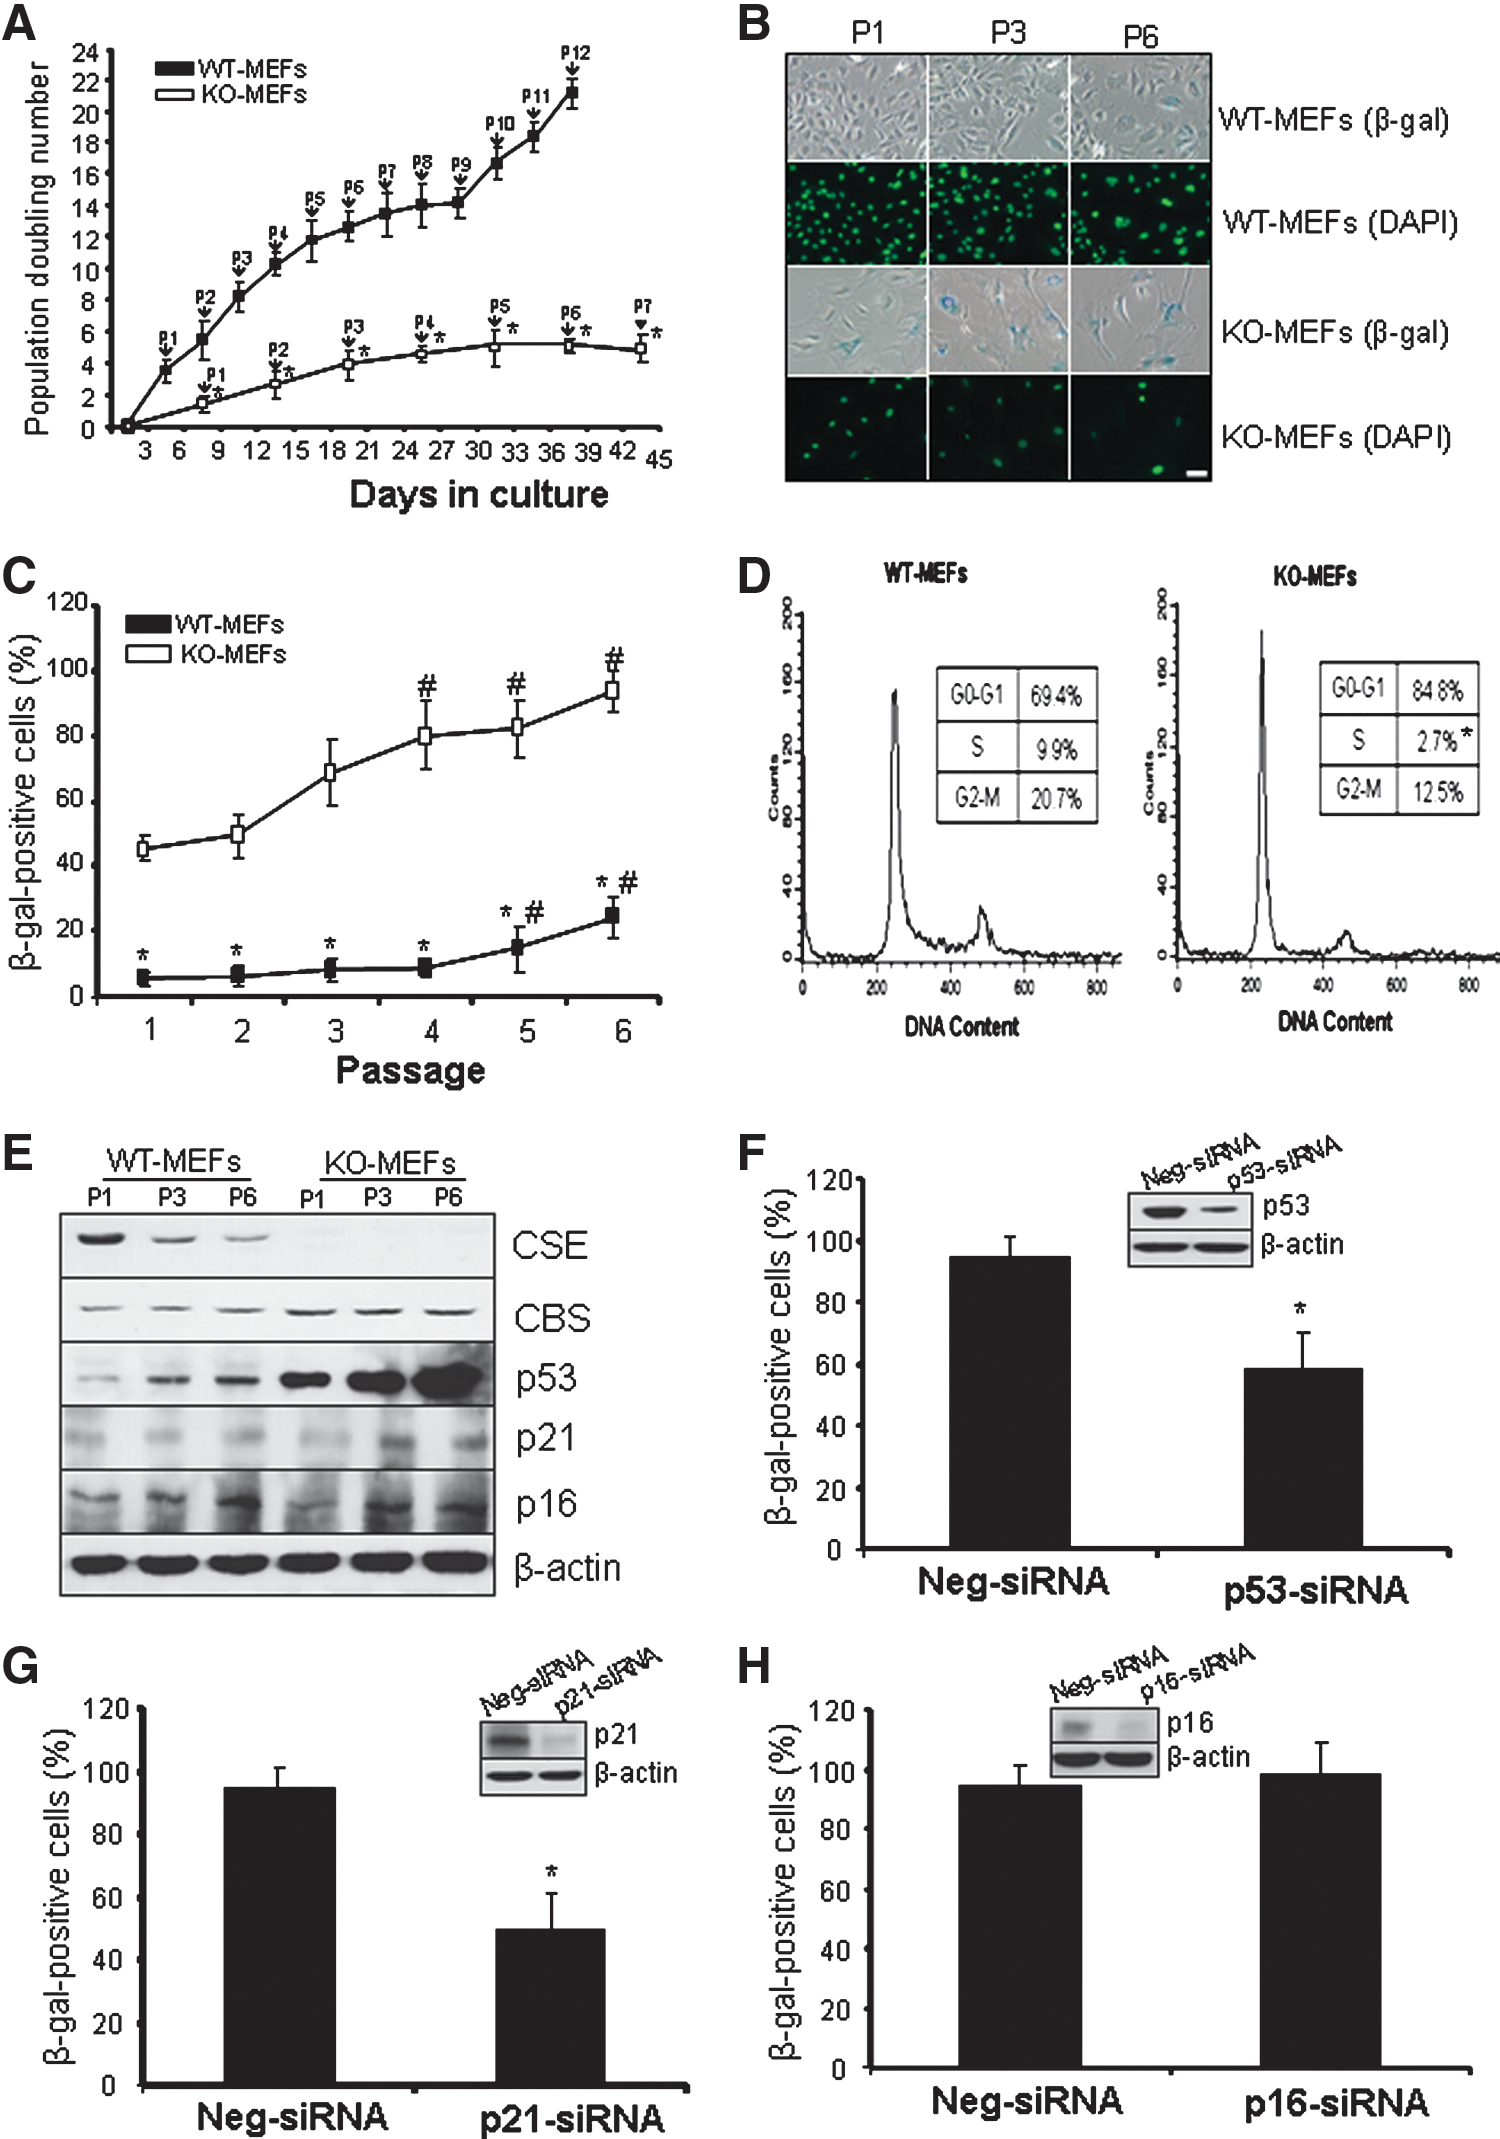
We further found that CSE protein expression is significantly reduced in WT-MEFs in a passage-dependent way (Fig. 2E). CBS protein expression was increased in KO-MEFs compared with WT-MEFs, but it showed no change with the passage. Several paradigmatic tumor suppressor proteins, p53, p21 and p16, are the central activating pathway of senescence (1, 29). The protein expression of p53 and p21 was significantly increased in KO-MEFs in a passage-dependent manner in comparison with WT-MEFs. p16 protein expression was significantly induced in both MEFs in a passage-dependent manner, but showed no difference between WT-MEFs and KO-MEFs at the same passage (Fig. 2E).
To further investigate the involvement of p53, p21, and p16 in increased cellular senescence, we used short-interfering RNA (siRNA) to knockdown the expression of p53, p21, or p16 in KO-MEFs, respectively. As shown in Figure 2F–H, knockdown of p53 or p21, but not p16, significantly reversed CSE deficiency-induced senescence in MEFs, suggesting that increased cellular senescence in KO-MEFs is truly p53/p21 dependant.
H2S enhances GSH contents and alleviates oxidative stress and cellular senescence
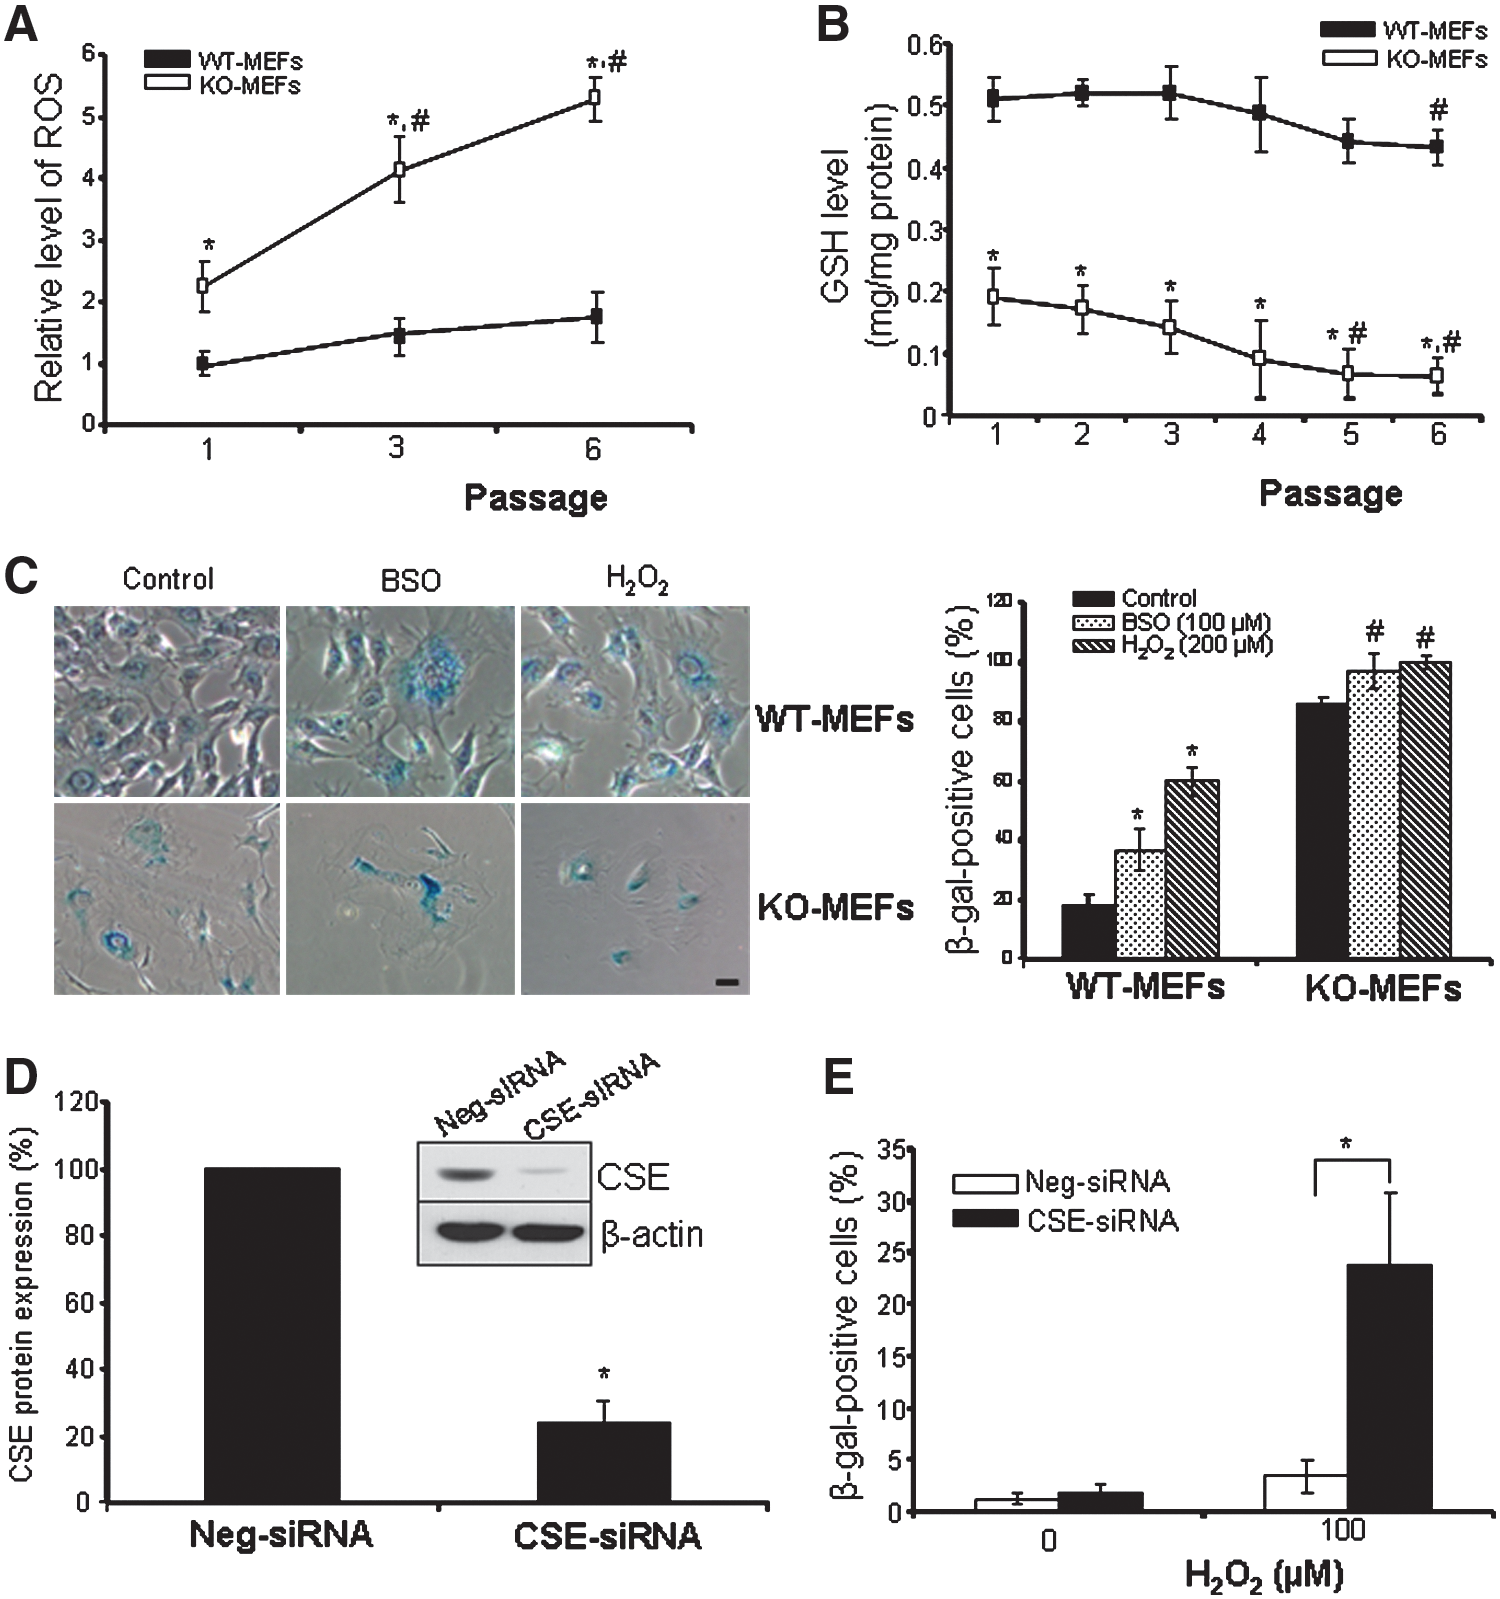
The reactive oxygen species (ROS) level in KO-MEFs was almost doubled compared with WT-MEFs at passage 1 (Fig. 3A). Compared with passage 1, the ROS level in KO-MEFs was markedly increased by 90% and 150% at passage 3 and passage 6, respectively. GSH is a major scavenger of free radicals (4, 22). Starting from passage 1, the GSH level in KO-MEFs (0.18±0.03 mg/mg protein) was significantly lower than that in WT-MEFs (0.51±0.02 mg/mg protein, p<0.05). At passage 6, the GSH level was decreased by 70% when compared with KO-MEFs at passage 1. The intracellular GSH level tended to decrease in WT-MEFs with increased passage, but it only showed significance at passage 6 (Fig. 3B). Depleting intracellular GSH by buthionine sulfoximine (BSO) or increasing cellular oxidative stress by H2O2 significantly induced cellular senescence in both MEFs, while KO-MEFs were more sensitive to BSO- or H2O2-induced damage than WT cells (Fig. 3C) (22). We further found that knockdown of CSE in human fibroblast cells significantly strengthens cellular senescence induced by H2O2 (Fig. 3D and 3E).
We next investigated the effects of exogenously applied GSH and H2S on cellular senescence. GSH from 1 mM to 20 mM dose-dependently reduced β-gal-positive KO-MEFs, while it had a little effect on WT-MEF senescence (Fig. 4A). NaHS, an H2S donor, also significantly reduced cellular senescence in KO-MEFs from 10 μM to 50 μM (Fig. 4B). Both GSH (10 mM) and NaHS (30 μM) reduced the protein expression of p53 and p21 in KO-MEFs (p<0.05, Fig. 4C).

As earlier as 4 h after GSH (10 mM) incubation, the ROS level was significantly reduced in both MEFs (Fig. 5A). However, NaHS started to decrease the ROS level only in KO-MEFs at 8 h after treatment. Similarly, GSH significantly reduced β-gal-positive cells in KO-MEFs at 4 h, while NaHS started to have the effect at 12 h (Fig. 5B). Daily supplement of H2S or GSH induced cell growth and increased the population-doubling number in KO-MEFs (Fig. 5C). Interestedly, H2S significantly increased the intracellular GSH level in both WT-MEFs and KO-MEFs starting from 8 h after NaHS treatment. After 48 h, GSH levels were increased by 30% in WT-MEFs and 230% in KO-MEFs, respectively (Fig. 5D, p<0.05). Glutamate cysteine ligase (GCL) catalyzes the synthesis of γ-glutamylcysteine from glutamate and cysteine and is the rate-limiting enzyme in the synthesis of GSH (4). GCL consists of a catalytic subunit (GCLC) and a modifier subunit (GCLM). GSH reductase (GR) reduces GSH disulfide to form GSH, and is an important GSH-maintaining gene (14). The mRNA expression of all these three genes was significantly decreased in KO-MEFs in comparison with that in WT-MEFs (Fig. 5E). Treatment of KO-MEFs with NaHS (30 μM) for 6 h markedly enhanced the mRNA expression of GCLM, GCLC, and GR (Fig. 5F). It is known that Nrf2 induces gene expression of GCLC, GCLM, and GR via an ARE-mediated transcription (4, 14). By using chromatin immunoprecipitation (ChIP) assay, we found that H2S stimulates the binding of Nrf2 with the promoters of GCLC, GCLM, and GR (p<0.05, Fig. 5G). No IP and amplification were seen with a nonspecific IgG antibody. Bioinformatic prediction did not find the Nrf2-binding site in the mouse CSE core promoter, and here we also assessed the binding of Nrf2 with the CSE core promoter to exclude the unspecific Nrf2 binding. As expected, no signaling was observed for the binding of Nrf2 with the mouse CSE core promoter.

H2S induces Nrf2 nuclear translocation by S-sulfhydrating Keap1 at cysteine 151
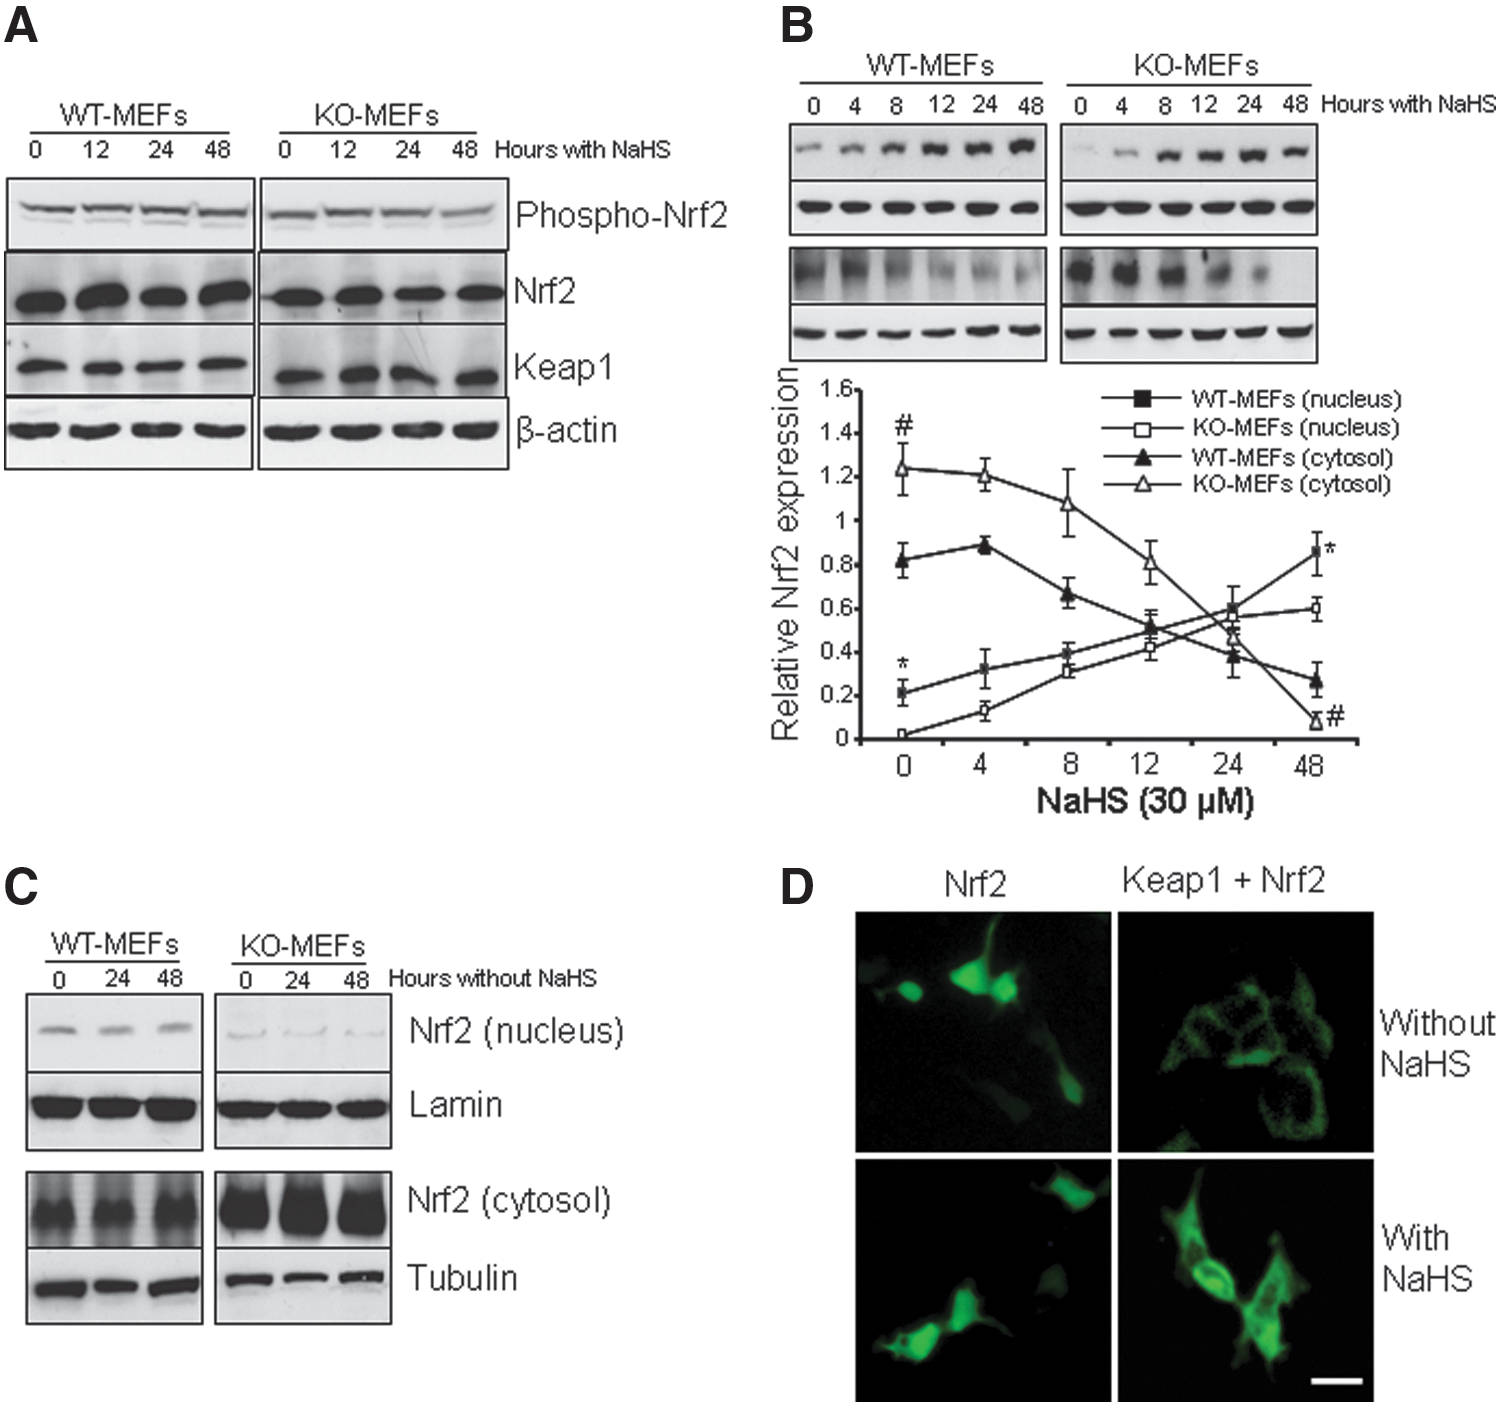
NaHS had a little effect on the protein expression of both Nrf2 and Keap1 from whole-cell lysates, neither on Nrf2 phosphorylation (Fig. 6A). However, NaHS treatment significantly stimulated Nrf2 nuclear translocation (Fig. 6B). The basic proportion of nuclear Nrf2 in KO-MEFs was much less than that in WT-MEFs (p<0.05). In contrast, the proportion of cytosolic expression of Nrf2 in KO-MEFs was significantly higher than that in WT-MEFs. NaHS-induced Nrf2 nuclear translocation was not due to the culturing time, because the expression of Nrf2 in both the cytosol and the nucleus had a little change after 24-h and 48-h culture without NaHS treatment (Fig. 6C). We next transfected HEK-293 cells with the plasmid green fluorescent protein (GFP)-tagged Nrf2 either alone or with the plasmid expressing Keap1 (11). When GFP-tagged Nrf2 was singly transfected, the GFP signals localized predominantly in the nucleus and also displayed visible cytoplasmic staining (Fig. 6D). When coexpressed with the Keap1 plasmid, the GFP signals were substantially decreased and most of them localized in the cytosol, consistent with a role of Keap1 in repressing Nrf2 activity. Incubation of the cells with NaHS reversed Keap1-reduced GFP signals in the nucleus (Fig. 6D).
No S-sulfhydration of Nrf2 was detected in our study (data now shown). On the other hand, Keap1 was S-sulfhydrated in WT-MEFs, but not in KO-MEFs (Fig. 7A and 7B). NaHS induced Keap1 S-sulfhydration in a dithiothreitol (DTT)-sensitive fashion in both WT-MEFs and KO-MEFs, and DTT can break the disulfide bond and reverse H2S-modulated S-sulfhydration (27). The supplement of cysteine, the substrate for CBS and CSE to generate H2S, stimulated Keap1 S-sulfhydration in WT-MEFs, but not KO-MEFs (Fig. 7A and 7B). NaHS at 30 μM enhanced Keap1 S-sulfhydration in Keap1-overexpressed HEK-293 cells (Fig. 7C). Keap1 is a cysteine-rich protein with a high degree of sequence homology between species (17). It has three functional domains: a six-Kelch repeat domain (Kelch) that binds the Neh2 domain of Nrf2, Tramtrack and Bric-á-Brac (BTB)2 dimerization domain that is toward the N-terminus, and an intervening region (IVR) that conjoins the former two domains (Fig. 7D) (11, 20). The lack of the BTB domain in Keap1 completely eliminated H2S-induced Keap1 S-sulfhydration (Fig. 7E), suggesting that the cysteine residues located in the BTB domain contribute to H2S-mediated Keap1 S-sulfhydration. To identify the S-sulfhydrated cysteine residue of Keap1, we mutated cysteine-151 in the BTB domain, which has been shown to be modified by sulforaphane (an H2S donor) (15, 30). We also randomly mutated cysteine-288 in the IVR domain (17). Mutation of C151, but not C288, abolished the basal level of Keap1 S-sulfhydration, and NaHS further strengthened Keap1 S-sulfhydration in the C288-mutant-transfected cells, but had no effect in the C151-mutant-transfected cells, pointing to the critical role of C151 in Keap1 S-sulfhydration (Fig. 7F). To determine whether cysteine-151 is involved H2S-stimulated disassociation of Nrf2 from Keap1, IP experiments were performed. We found that cotransfection of the plasmids Nrf2 and Keap1 in HEK-293 cells reduces the expression of Nrf2, which was reversed by NaHS treatment (Fig. 7G). H2S also inhibited the association of Nrf2 and Keap1 proteins; however, mutation of C151, but not C288, reversed the H2S effect on Nrf2 dissociation from Keap1 protein.

Discussion
According to the free-radical theory of aging, the balance between production and elimination of intracellular oxidative stress is a major determinant of cellular senescence (1, 7). CSE-deficient MEFs displayed premature senescence at earlier passages, which is caused by increased oxidative stress. Elimination of oxidative stress reversed CSE deficiency-induced senescence. With increased passages, more oxidative stress and cellular senescence were observed in KO-MEFs. Oxidative stress activates two paradigmatic tumor suppressor proteins, p53 and p16, which are the central activating pathway of senescence (29). p53 functions as a sequence-specific transcription factor at the crossroads of cellular stress-response pathways by activating its downstream targets, p21 (29). p21 initiates growth arrest by preventing pRb phosphorylation. p16 also activates the Rb pathway and inhibits the action of the cyclin-dependent kinases, leading to cell cycle arrest (1, 40). The present study demonstrated that CSE deficiency induces, but exogenous applied H2S reduces, the expression of both p53 and p21 in CSE-deficient MEFs. The passage-dependent increase in p53 and p21 and decrease in CSE expression are also correlated well with cellular senescence. CSE/H2S did not change the expression of p16; however, p16 did mediate passage-dependent increases in cellular senescence of both WT-MEFs and KO-MEFs. More directly, we found that p53/p21, but not p16, contributes to increased cellular senescence in KO-MEFs, because knockdown of p53 or p21, but not p16, significantly weakened CSE deficiency-induced senescence.
GSH, a tripeptide
The mechanisms underlying H2S-regulated Nrf2 translocation may involve the oxidative regulation of Keap1. Activation of Nrf2 due to the modification of Keap1 cysteine residues, leading to upregulation of antioxidant genes containing ARE, is an important mechanism of cellular defense against oxidative stress (14, 35). It has been proposed that various Nrf2 inducers have the common chemical property of reacting with the sulfhydryl groups of cysteine resides in Keap1 (20, 44). Keap1 contains 25 cysteine residues that are highly conserved among species (36, 44). Site-directed mutagenesis experiments coupled with mass spectrometry analysis predict that Keap1 contains at least two distinct cysteine motifs. The first is located in the IVR domain between cysteine-273 and 288. The second is located at cysteine-151 in the BTB domain (17, 44). Adduction or oxidation of these cysteine residues abolished the effects of various activators to change Keap1 function (44). In our study, we found that Keap1 is S-sulfhydrated under basal conditions, and the supplement of NaHS increases Keap1 S-sulfhydration. By comparing the stimulatory effects of NaHS on Keap1 S-sulfhydration between the WT and BTB domain-deleted mutant in cultured HEK-293 cells, we demonstrated that the BTB domain in Keap1 protein is required for H2S-mediated S-sulfhydration. We further identified cysteine-151 in the BTB domain is responsible for S-sulfhydration, because mutation of cysteine-151 to alanine completely abrogated S-sulfhydration of Keap1. Cysteine-288 in the IVR domain appears not responsible for Keap1 S-sulfhydration. The interaction of H2S and Keap1 through cysteine-151 may cause a conformational change in Keap1, triggering Nrf2 nuclear translocation and antioxidant gene transcription (11, 17, 44).
Sulforaphane, a thiol-containing compound occurring in cruciferous vegetables such as broccoli, is a potent natural ARE activator that functions by modifying Keap1 at cysteine-151 (15, 16). We recently observed that sulforaphane releases H2S, and H2S mediates the anticancer effect of sulforaphane, pointing to potential involvement of H2S in sulforaphane-modified Keap1 activity (30). Moreover, previous studies showed that several other thiol-reactive substances such as 3H-1,2-dithiole-3-thione, pyrrolidine dithiocarbamate, and (R)-α-lipoic acid modify the Keap1/Nrf2 axis and increase cellular GSH (17). It would be interesting to test whether H2S also mediates the antioxidative effects of these thiol-reactive substances through S-sulfhydration regulation of Keap1.
H2S-induced activation of Nrf2 is not caused by Nrf2 phosphorylation, although it has been reported that Nrf2 phosphorylation facilitates its capacity of nuclear–cytoplasmic shuttling and ARE binding (6). H2S-induced Nrf2 nuclear accumulation also may not involve newly synthesized Nrf2, because H2S had no effect on the protein expression level of Nrf2. Moreover, H2S alone had no effect on Nrf2 S-sulfhydration. We cannot exclude the possibility that however H2S may activate Nrf2 through interaction of an Nrf2-ARE-containing complex.
The expression of both CBS and CSE has been identified in many human and other mammalian cells, including those from the liver, kidney, stomach, and prostate (5, 39, 42, 45). In the brain and nervous system, CBS is the predominant H2S-generating enzyme, while CSE is the main H2S-producing enzyme identified in the vasculature and heart (37, 43). We demonstrated here that both CBS and CSE are expressed and contribute to endogenous H2S production in MEFs. CSE deficiency only eliminated 60% H2S production in MEFs, and H2S production was hardly detected after inhibition of both CBS and CSE activity. Another enzyme 3-mercaptopyruvate sulfur transferase has been suggested for its potential role in producing H2S in different cell preparations, but controversy exists on whether this enzyme can really produce H2S, especially considering the lack of evidence for the existence of 3-mercaptopyruvate in cells or tissues (36). In any rate, that the inhibition of both CBS and CSE completely eliminates endogenous H2S production in MEFs would leave no role for 3-mercaptopyruvate sulfur transferase to play.
In summary, we have demonstrated that H2S plays an important role in protecting against cellular senescence. This effect is mediated by S-sulfhydration of Keap1 and nuclear translocation of Nrf2, and enhanced antioxidant protection (Fig. 8).

Materials and Methods
Mice and cell culture
CSE KO mice were generated as described previously (43). All animals were maintained on standard rodent chow, and had free access to food and water. MEFs were obtained from about 13.5-day WT or CSE KO sibling embryos and were grown in the Dulbecco's modified Eagle's medium supplemented with 10% fetal bovine serum, 100 U/ml penicillin, and 100 μg/ml streptomycin at 37°C under 5% CO2 (5). The first batch of cells was designated as passage number 0 (P0), and MEFs were passaged when they became 80%–90% confluent. All animal experiments were conducted in compliance with the NIH Guide for the Care and Use of Laboratory Animals (NIH Publication No. 85-23, revised 1996) and approved by the Lakehead University Animal Care Committee.
HEK-293 cells and human fibroblast cells (American Type Culture Collection) were cultured at 37°C under 5% CO2 in a minimal essential medium supplemented with 10% fetal bovine serum, 100 U/ml penicillin, and 100 μg/ml streptomycin. The cultured cells were subjected to gene transfection when they had grown to 70%–80% confluence.
Population doubling
Equal number of MEFs (1×10⁵ cells) was seeded in a 35-mm plate. The MEFs were split when they became 80%–90% confluent and replated at the same density. This cultivation was repeated for 12 passages for WT-MEFs and 7 passages for KO-MEFs. The population-doubling number was calculated according to the formula log2(Nf/N0), where Nf is the final number of cells, and N0 is the number of cells that were initially seeded (7). In a separate experiment, KO-MEFs at passage 5 were daily treated with 30 μM NaHS or 10 mM GSH, and split when they became 80% confluent for measuring the population-doubling number.
SA-β-gal staining
Cellular senescence was evaluated by an SA-β-gal staining kit from New England Biolabs (7). The cells were counterstained with 4′,6-diamidino-2-phenylindole. Cells were counted on five random fields of at least 200 cells.
Flow cytometry
Both WT-MEFs and KO-MEFs at passage 6 (5.0×10⁵ cells per well) were cultured in six wells/plate and allowed to adhere to the well walls overnight at 37°C and 5% CO2. After 72 h, the cells were collected, washed in phosphate-buffered saline (PBS), and fixed in 70% cold ethanol at 4°C overnight. Then, the cells were centrifuged at 380g for 5 min at room temperature. The supernatant (ethanol) was carefully removed, and the cells were resuspended in 4 ml of PBS and centrifuged at 380g for 5 min at room temperature. The supernatant was removed, and the cell pellet was resuspended in 400 μl of PBS. The cell solution was transferred to a flow tube, and 10 μl of RNase A (0.25 mg/ml) was added. Tubes were then incubated for 1 h at 37°C. Finally, 64 μl of propidium iodide (34.5 μg/ml) was added, and the cells were incubated for an additional 15 min (dark) at 37°C. The cell cycle distribution was determined by flow cytometry for DNA content analysis (FACScan; Becton Dickinson, Heidelberg).
Measurement of ROS and GSH contents
2′,7′-Dichlorodihydrofluorescein diacetate (H2DCFDA; Invitrogen) was used to detect ROS (5). Total GSH contents were measured using a commercial GSH assay kit (Cayman Chemical), as we previously described (5, 24).
Preparation of nuclear extracts
Nuclear proteins were prepared with the CelLytic™ NuCLEAR™ Extraction kit (Sigma) (11). In brief, the cells at 80% confluence were collected and lysed. The cell lysate was centrifuged at 500g for 10 min at 4°C to separate the nuclei and cytosol. The nuclear pellet was washed once with a lysis buffer and resuspended in an assay buffer. The nuclear fractions were then subjected to immunoblotting analysis using an anti-Nrf2 or anti-lamin A/C antibody (Santa Cruz Biotechnology).
Determination of mRNA level
Total RNA of MEFs was isolated using TriReagent (Invitrogen) (41). First, strand cDNA was prepared by reverse transcription using M-MuLV reverse transcriptase and random hexamer primers according to the manufacturer's protocol (New England Biolabs). Real-time polymerase chain reaction (PCR) was performed in iCycler iQ5 apparatus (Bio-Rad, Mississauga, Ontario) associated with iCycler optical system software (version 3.1) using the SYBR Green PCR Master Mix, as described previously (41). The primers of GCLM were 5′-ATGGCATGCTCCGTCCTT-3′ (forward, position 334–351) and 5′-CAATCCTGGGCTTCAATGTC-3′ (reverse, position 706–725). These primers produced a product of 390 bp. The primers of GCLC were 5′-GGCACGGCATCCTCCAGTTCCT-3′ (forward, position 71–92) and 5′-CCTCCTTCCGGCGTTTCCTCATA-3′ (reverse, position 369–391). These primers produced a product of 360 bp. The primers of GR were 5′-AAAGCGCTTCTCACCCCAGTTG-3′ (forward, position 1069–1090) and 5′-GGCCCCCATTTTCACCGCTACA-3′ (reverse, position 1410–1431). These primers produced a product of 362 bp. The primers of β-actin were purchased from Ambion, which produce a product of 295 bp.
ChIP assay
The binding of Nrf2 for the promoters of GCLC, GCLM, GR, or CSE was determined by ChIP assay as previously described (41). Briefly, after different treatments, MEFs in 100-mm dishes were fixed by adding formaldehyde to the culture medium for 10 min at 37°C to cross-link the protein to DNA. The cells were then collected and sonicated to shear DNA to lengths between 500 bp to 2000 bp. The sonicated supernatant was diluted with a ChIP dilution buffer, and incubated with an antibody against Nrf2 overnight at 4°C with rotation. The samples incubated with a nonspecific IgG antibody acted as the negative control. A fraction of the protein–DNA was not precipitated, but set aside for the total chromatin examination (termed input). The chromatin–antibody complexes and the input were eluted, reversed, and purified. The aimed sequences containing ARE sites in the promoters of GCLC, GCLM, and GR were amplified by PCR using the respective primers. The GR primer sequences were 5′-TGAGATTGACTGACACAATGGA-3′ (forward) and 5′-GATCACAAAAGGGAAACCAACT-3′ (reverse). The GCLC primer sequences were 5′-AGCATGGTGGCAAAGGTGGTA-3′ (forward) and 5′-GTAATGGGCTGCTATGTGGAGTCT-3′ (reverse). The GCLM primer sequences were 5′-GTGCCGTTGAATTTGCCGTGAG-3′ (forward) and 5′-TTTGGGGAGGACTGTGGAAGGACT-3′ (reverse). We also assessed the interaction of Nrf2 with the mouse CSE core promoter. The CSE primer sequences were 5′-GGCCACGCGAGGCTGCTGGAGG-3′ (forward) and 5′-CCTTCTGGACTTTGGCGC-3′ (reverse). The following PCR program was used: 94°C for 5 min followed by 36 cycles of 94°C for 45 s, 60°C for 45 s, and 72°C for 1 min followed by a final extension at 72°C for 8 min. The PCR bands produced were sequenced to confirm their identity. The Nrf2 and ARE interaction was quantitatively analyzed by real-time PCR, and the binding intensity of Nrf2 with the promoters was normalized to the level of input by using the same primers.
H2S production measurement
The H2S production rate was measured as described everywhere (2, 9, 42). Briefly, the cells were lysed in 50 mM ice-cold potassium phosphate buffer (pH 6.8). The flasks containing the reaction mixture (100 mM potassium phosphate buffer, 10 mM
Plasmid preparation, point mutation, and cell transfection
The plasmids pcDNA3-HA2-Keap1, pcDNA3-HA2-Keap1ΔBTB, and pcDNA3-EGFP-Nrf2 were purchased from Addgene (11). Single mutation at cysteine-151 or cystiene-288 in Keap1 was conducted using the QuickChange Site-Directed Mutagenesis kit (Stratagene) (41). The oligonucleotides used for mutagenesis were 5′-ctccatgggcgagaagtg
Western blotting and IP
After different treatments, cells or tissues were obtained and lysed (41). Equal amounts of proteins were boiled and separated by sodium dodecyl sulfate–polyacrylamide gel electrophoresis (SDS-PAGE) and electrophoretically transferred to a nitrocellulose membrane as described previously (41). The dilutions of primary antibodies were 1:2000 for CSE (Abnova), 1:2000 for CBS (Abnova), 1:1000 for p53, p21, and p16 (New England Biolabs), 1:200 for Nrf2, Keap1 and HA (Santa Cruz Biotechnology), and 1:10000 for β-actin (Sigma).
For IP assay, HEK-293 cells were transfected with Nrf2 plasmid with or without the plasmids of WT Keap1, Keap1-C151 mutant, or Keap1-C288 mutant for 48 h. Thereafter, NaHS (30 μM) was added for another 2 h. The cells were harvested and lysed as we previously described (10). Soluble cell lysates were incubated with 5 μg of anti-Keap1 antibody for 4 h at 4°C followed by incubation with protein A-agarose beads for 2 h at 4°C. The beads were washed three times with a lysis buffer, and bound proteins were eluted by boiling for 5 min with 2×SDS-loading buffer and analyzed by Western blotting with anti-Nrf2 antibody.
RNA interference
RNA interference was performed as described previously (5). Briefly, MEFs were transfected with a gene-specific short-interfering RNA (siRNA; Santa Cruz Biotechnology) for 48 h using the Lipofectamine™ 2000 transfection agent in a serum-free medium following the manufacturer's protocol. The cells transfected with scrambled siRNA acted as a nonsilencing control. These gene-specific siRNA products generally consist of pools of three to five target-specific 19–25 nt siRNAs designed to knockdown gene expression, and the control siRNA consists of a scrambled sequence that will not lead to the specific degradation of any cellular message.
S-sulfhydration assay
H2S S-sulfhydration was assessed as described previously (27). Briefly, cells were homogenized in a HEN buffer (250 mM Hepes–NaOH [pH 7.7], 1 mM EDTA, and 0.1 mM neocuproine) supplemented with 100 μM deferoxamine and centrifuged at 13,000 g for 30 min at 4°C. Cell lysates were added to the blocking buffer (HEN buffer with 2.5% SDS and 20 mM methyl methanethiosulfonate [MMTS]) at 50°C for 20 min with frequent vortexing. MMTS was then removed by acetone, and the proteins were precipitated at −20°C for 20 min. After acetone removal, the proteins were resuspended in a HENS buffer (HEN buffer with 1% SDS). To the suspension was added 4 mM biotin–HPDP in dimethyl sulfoxide without ascorbic acid. After incubation for 3 h at 25°C, biotinylated proteins were precipitated by streptavidin–agarose beads, which were then washed with the HENS buffer. The biotinylated proteins were eluted by an SDS-PAGE gel and subjected to Western blotting analysis using anti-Keap1, anti-HA, or anti-Nrf2 antibody.
Chemicals and data analysis
Chemicals were obtained from Sigma unless otherwise mentioned. Data were presented as means±SEM, representing at least three independent experiments. Statistical comparisons were made using Excel 2003 (Microsoft) with Student's t-test. The significance level was set at p<0.05.
Footnotes
Acknowledgments
This study was supported by operating grants from the Canadian Institutes of Health Research to G.Y and R.W. G.Y. was supported by a New Investigator award from the Heart and Stroke Foundation of Canada.
Author Disclosure Statement
No competing financial interests exist.