
Abstract
Introduction
Innovation
This study provides insights into mechanisms involved in the replicative senescence of mesenchymal stem cells (MSCs), revealing senescence-related increases in reactive oxygen species (ROS) as a factor affecting MSC differentiation capacity. We found that the effect of senescence on MSCs resulted in altered differentiation and proliferation capacity by mechanistically different pathways, with protein kinase C–p21 involved in proliferative decline, while ROS and c-MAF, an hydrogen-peroxide-responsive transcription factor, involved in altered differentiation capacity away from osteogenesis. Our data demonstrate the mechanisms involved in the detrimental effects of replicative senescence on MSC proliferation and differentiation, and provide possible targets—including reversal of ROS—in enhancing the function of MSCs.
As with most SSCs, MSCs need to be highly expanded ex vivo for clinical use. This often results in senescence, which clearly affects proliferation adversely (44). Effects of senescence on differentiation, on the other hand, is less clear (12,38,48). While fetal cells are known to be more proliferative, even embryonic/fetal cells undergo replicative decline with prolonged in vitro culture (19). We therefore studied how senescence affects the proliferation and differentiation capacity of PDMCs, a population of fetal MSCs, and the mechanisms involved. We found that while PDMCs are more proliferative than BM-MSCs, senescence does eventually occur during in vitro culture, affecting not only the proliferative capacity of PDMCs but also its differentiation ability. The effect of senescence on differentiation and proliferation was mediated by mechanistically different pathways, with reactive oxygen species (ROS) involved in lineage commitment alterations while protein kinase C (PKC) was involved in proliferative decline. Our data showed the adverse effects of senescence on both the proliferation and differentiation capacity of PDMCs, and shed mechanistic light on this critical obstacle in the clinical use of MSCs.
Results
PDMCs become senescent with prolonged in vitro culture
We previously have demonstrated that PDMCs are multilineage cells, having a surface marker profile similar to BM-MSCs as well as expressing some human embryonic stem cell markers, such as CD9 and SSEA-4 (8,46). Moreover, we found that PDMCs are more proliferative than adult BM-MSCs. As shown in Figure 1A, PDMCs are more proliferative than BM-MSCs in vitro. The doubling time (DT, hours required for the cell number to double) is an index reflecting the growth of cultured cells, and an increase of DT reflects a deceleration in cell growth. When calculated for DT, BM-MSCs showed a dramatic increase in DT as early as the 8th to 10th passage, whereas this does not occur for PDMCs until the 25th passage (Fig. 1B). Notably, despite being more proliferative, PDMCs eventually cease growing. Based on our findings, we define early-passage PDMCs (termed E-PDMCs) as passage 15 (P15) or less, and late-passage PDMCs (L-PDMCs) as being between P25 and P30. E-PDMCs and L-PDMCs differed not only in the rate of proliferation, but also in terms of cell morphology; E-PDMCs were smaller and had a fibroblast-like morphology, while L-PDMCs were flattened and much larger in size (Fig. 1C). Senescence-associated β-galactosidase staining (SA-β-gal) revealed that L-PDMCs were senescent, as shown in Figure 1C (lower left and middle), by the blue positive staining for β-gal; BM-MSCs stain positive for β-gal at a much earlier passage of P12 (Fig. 1C, lower right). In addition to morphological changes and SA-β-gal positivity, the histone deacetylase sirtuin-1 (SIRT1), also a marker of cellular senescence (37), was also decreased in L-PDMCs from different donors (Fig. 1D, E). Collectively, these findings show that PDMCs are more proliferative than adult BM-MSCs, but still undergo senescence after prolonged in vitro culture.

L-PDMCs are biased toward adipogenic differentiation
Similar to BM-MSCs, PDMCs differentiate readily into mesodermal lineages, such as adipocytes, osteoblasts, and chondrocytes (6,21,46). We were interested as to whether senescence would affect the differentiation capacity of PDMCs, in addition to proliferative decline. As shown in Figure 2A, both E- and L-PDMCs are able to differentiate to adipocytes after culturing in an adipogenic medium (AM) for 7 days with positive staining for Oil red O for oil droplet formation. However, in L-PDMCs, osteogenic differentiation is attenuated compared with E-PDMCs as evidenced by decreased Alizarin Red staining for calcium deposition (Fig. 2A). After quantification, the ratio of differentiation extent for L-PDMCs/E-PDMCs was 0.8 and 6.3 for Alizarin Red and Oil-red-O staining, respectively, showing a greater potential for adipogenesis in L-PDMCs. We also examined in E- and L-PDMCs the expression levels of Runx2 and PPARγ, the major transcription factors controlling osteogenesis and adipogenesis, respectively. In line with the phenotypic data, Runx2 expression was slightly decreased in L-PDMCs cultured in an osteogenic medium (OM), whereas PPARγ expression was highly increased when cells were cultured in the AM. The relative expression of Runx2 in L-PDMCs was ∼67% of E-PDMCs, whereas PPARγ expression after AM culture in L-PDMCs was 2.8 times higher than E-PDMCs (Fig. 2C). These results indicate that L-PDMCs are biased toward adipogenic differentiation with a concomitant decrease of osteogenic differentiation capacity.

Upregulation of p21 in L-PDMCs is through a p53-independent pathway
To study the mechanisms involved in the senescence of PDMCs, we analyzed for the expression of senescence-related genes in E- and L-PDMCs by real-time quantitative polymerase chain reaction (qPCR). No differences were found in the expression levels of cell cycle inhibitors p16, p27, and plasminogen activator inhibitor-1 in PDMCs of different passages (Fig. 3A). Notably, gene and protein expression of p21 increased with increasing passage (Fig. 3A, B). p21 is a known inhibitor of the cell cycle, we further analyzed cell cycle dynamics in E- and L-PDMCs. As shown in Figure 3C, cell cycle analysis of L-PDMCs showed a 10% increase in the G0/G1 phase when compared with E-PDMCs. These findings suggest that the proliferation of L-PDMCs is inhibited by p21 with a subsequent G0/G1 cell cycle arrest. p53 is a known tumor suppressor gene regulating cell proliferation. LKB1 is a kinase that coordinates with p53 to regulate the transcription of p21 (47) and negatively regulated by SIRT1 (49). Since we found SIRT1 to be decreased in L-PDMCs (Fig. 1D, E), we further examined whether the regulation of p21 in L-PDMCs involved LKB1 and p53. Surprisingly, the expression of p53 was decreased in L-PDMCs at both the gene expression and protein level (Fig. 3D, E). Moreover, LKB1 expression was not increased in L-PDMCs (Supplementary Fig. S1; Supplementary Data are available online at

Accumulation of hydrogen peroxide in L-PDMCs is not the major cause of proliferative decline
Many reports have shown that ROS accumulate in senescence cells and accompany cell cycle arrest (27). We therefore first analyzed the ROS levels of L-PDMCs by staining for 2′,7′-dichlorodihydrofluorescein diacetate (DCF-DA), which detects hydrogen peroxide (H2O2) and superoxide anion levels, and hydroethidine (HE), which stains for superoxide anion. Figure 4A shows that the staining of DCF-DA, but not HE, is increased in L-PDMCs, indicating that the accumulation of ROS in L-PDMCs is caused by H2O2. We then measured the expression levels of mitochondrial ROS-regulating genes and found that the expression of catalase, glutathione peroxidase 1, and peroxiredoxin-6 was increased in L-PDMCs, but not in a significant fashion. On the other hand, the expression levels of the two H2O2-generating superoxide dismutases manganese superoxide dismutase (MnSOD) and copper/zinc superoxide dismutase (CuZnSOD) were both upregulated in L-PDMCs, with the increase of MnSOD being statistically significant (p<0.01; Fig. 4B). These findings are compatible to the previous finding of H2O2 accumulation, with the increased expression of MnSOD presumably caused H2O2 elevation. The accumulation of H2O2 was attenuated by N-acetyl cysteine (NAC), a H2O2 scavenger (Fig. 4C), demonstrating bona fide accumulation of H2O2 in L-PDMCs.

We then examined whether ROS, as induced by toxic compounds or direct exposure of H2O2, was the cause of the increased p21 expression and cell cycle arrest in L-PDMCs, since this has been reported previously (16,22). However, we found that NAC inhibition of H2O2 accumulation had no effect on cell cycle arrest (Fig. 4D) or on p21 expression in L-PDMCs (Fig. 4E). These results indicate that the accumulation of H2O2 is not the major cause of growth inhibition in L-PDMCs.
Extracellular signal-regulated kinase activation in L-PDMCs is correlated to H2O2 induction, but not p21 elevation
In addition to p53, p21 expression can also be regulated by p53-independent pathways, such as mitogen-activated protein kinases (MAPKs) (9). We therefore examined whether p21 elevation in L-PDMCs was regulated by MAPK. As shown in Figure 4F, activation of extracellular signal-regulated kinase (ERK) was found in L-PDMCs as detected by phosphorylated ERK, but p38 MAPK was not activated. ERK activation could be inhibited by the MEK inhibitors U0126 or PD98056 rapidly (within 6 h after treatment), but activation was restored by 24 h, suggesting that ERK may be constitutively activated in L-PDMCs. However, despite the brief and rapid inhibition of activated ERK, p21 levels (protein and gene) in L-PDMCs were not reduced (Fig. 4G, H). These results suggest that activation of ERK as well as the accumulation of H2O2 in L-PDMCs have only minor contributions to p21 expression levels. Interestingly, we found that inhibition of ERK reduced H2O2 accumulation in L-PDMCs. As shown in Figure 4I and J, the ERK inhibitor U0126 inhibited H2O2 accumulation in L-PDMCs as effectively as the H2O2 scavenger NAC. Without definitive activation of p38, inhibition of p38 by SB203580 had no effect on H2O2 accumulation in L-PDMCs (Supplementary Fig. S2). Further, we found that NAC scavenging of H2O2 can also inhibit the activation of ERK in L-PDMCs (Fig. 4K). Collectively, these results suggest that ERK activation and H2O2 accumulation may have a bidirectional regulatory effect on each other.
PKC-α and -β regulate p21 expression and cell cycle arrest in L-PDMCs
PKC is a family of protein-serine/threonine kinases controlling many cellular functions, including proliferation, ROS induction, and senescence (24,29). To investigate whether PKC is involved in PDMC senescence, we first detected for expression of different PKC isoforms in PDMCs by reverse transcription polymerase chain reaction (RT-PCR) and qPCR. As shown in Figure 5A, the PKC isoforms expressed in PDMCs include conventional PKCs α, β, and γ; novel PKCs δ, ɛ, η, and θ; and atypical PKC-ζ. In particular, PKC-α and PKC-β showed increased expression in L-PDMCs. To narrow down which specific PKC isoforms have functional relevance in L-PDMCs, we used a variety of PKC isoform-specific inhibitors. We found that PKC-α and β isoform inhibitors, including Ro31-8220, Ro32-0432, and Gö6976, were able to inhibit p21 protein expression in L-PDMCs (Fig. 5B), whereas the PKC-δ inhibitor Rottlerin had no effect. Notably, PKC inhibition had no effect on ERK phosphorylation in L-PDMCs (Fig. 5B and Supplementary Fig. S3), excluding ERK as a key regulator in the control of p21 expression. p21 gene expression in L-PDMCs was found to be reduced by 60% after Ro31-8220 inhibition (Fig. 5C); conversely, the H2O2 scavenger NAC or MEK inhibitor U0126 alone or in combination did not attenuate p21 expression, indicating that PKC, but not H2O2 or ERK, was involved in the increased expression of p21 in L-PDMCs.

The inhibition of p21 gene and protein expression by the PKC inhibitor Ro31-8220 also resulted in a reversal of cell cycle arrest in L-PDMCs. As shown in Figure 5D, treatment of Ro31-8220 released L-PDMCs from cell cycle arrest with a concomitant increase in the proportion of cells in the S and G2/M phases. In contrast, the proportion of cells in the G0/G1 arrest in L-PDMCs was unchanged when the cells were treated with NAC, U0126, or a combination of these two compounds. However, L-PDMCs treated with Ro31-8220 did not show an increase in cell number (Supplementary Fig. S4), likely due to the fact that many factors are involved in restarting cell proliferation. Since there is one report that induction of ROS in senescent cells is under the regulation of PKC (30), we further tested the effect of Ro31-8220 on the accumulation of H2O2 in L-PDMCs. However, H2O2 accumulation in L-PDMCs was not inhibited by Ro31-8220 (Supplementary Fig. S5). These results suggest that p21 expression and cell cycle arrest in L-PDMCs are regulated by PKC-α and PKC-β through p53- and H2O2-independent pathways.
H2O2 accumulation in L-PDMCs affects lineage commitment by decreasing c-MAF expression
Our data showed that the inhibition of proliferation in L-PDMCs is due to p21 expression and G0/G1 cell cycle arrest, which are both affected by PKC, but not H2O2. Thus, we were curious as to what role, if any, H2O2 has in mediating senescence in PDMCs, since levels were clearly increased in senescent PDMCs, but did not seem to be involved in proliferative decline. Earlier, we had found that, in addition to decreased proliferation, senescence also alters the differentiation capacity of PDMCs (Fig. 2). To elucidate whether increased levels of H2O2 were involved in the altered differentiation capacity of senescent PDMCs, L-PDMCs were simultaneously treated with NAC while undergoing adipogenic or osteogenic differentiation and analyzed for expression of the lineage-specific transcription factors Runx2 and PPARγ. As shown in Figure 6A, NAC treatment increased Runx2 expression in L-PDMCs while simultaneously decreasing PPARγ expression. Moreover, when E-PDMCs were undergoing osteogenic differentiation, the differentiation can be inhibited by additional treatment of H2O2 as demonstrated by a decrease in Alizarin Red staining (Fig. 6B). Further, alkaline phosphatase (ALP) activity, an early osteogenic marker, was also inhibited by H2O2 in E-PDMCs under OM culture (data not shown). These findings suggest that the effect of H2O2 in senescent PDMCs is on modifying differentiation capacity.
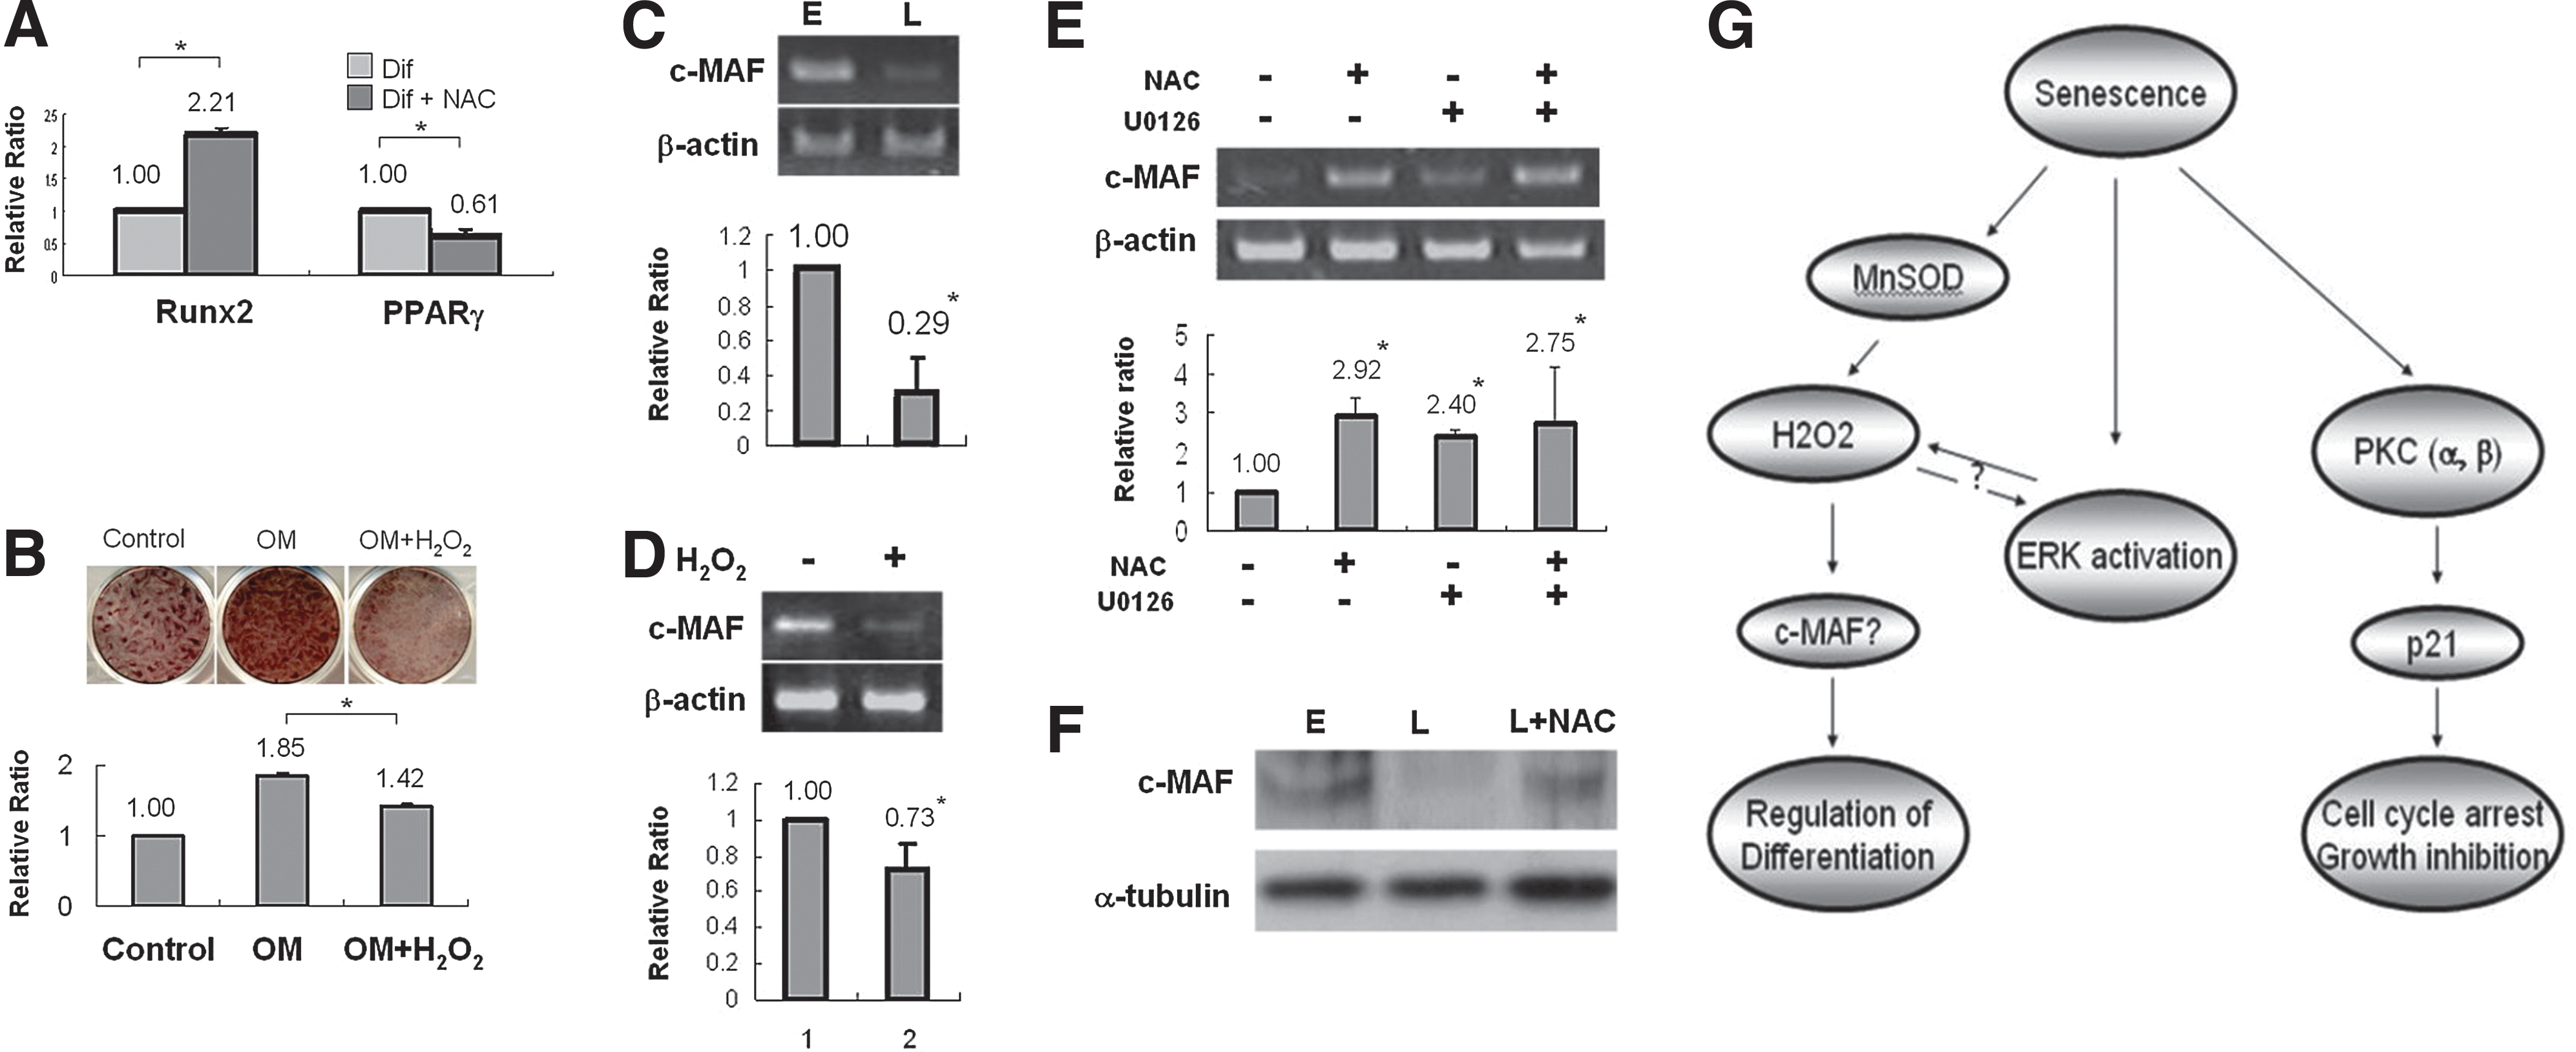
To investigate the mechanism involved in H2O2-induced differentiation alteration of L-PDMCs, we searched for genes involved in MSC lineage commitment, which could also be modulated by H2O2. SIRT1 has been reported to harbor antioxidant activities as well as regulate the expression of PPARγ negatively (33); however, NAC treatment of L-PDMCs did not reverse the decreased expression of SIRT1 (Supplementary Fig. S6A). Further, addition of H2O2 to E-PDMCs had no effect on SIRT1 expression (Supplementary Fig. S6B). We did find that the expression levels of c-MAF, a transcription factor recently shown to affect lineage commitment of mouse BM-MSCs in an age-dependent manner (32), is decreased in L-PDMCs (Fig. 6C). The protein level of c-MAF was decreased in L-PDMCs as well (Fig. 6F). Moreover, the expression of c-MAF is inhibited by H2O2, as seen by the decreased expression of c-MAF in E-PDMCs treated with H2O2 (Fig. 6D). Further, NAC treatment can restore the c-MAF expression in L-PDMCs as presented in Figure 6E and F. Scavenging of H2O2 by NAC resulted in a shifting of differentiation potential in L-PDMCs from adipogenesis toward osteogenesis, toward a differentiation capacity similar to nonsenescent PDMCs. The ERK inhibitor U0126 and NAC had similar effects on increasing c-MAF expression in L-PDMCs. These findings provide evidence that H2O2 accumulation as well as ERK activation in L-PDMCs is involved in altering the differentiation capacity of these multilineage cells. Our data also suggest that in senescent human MSCs, the accumulation of H2O2 can influence differentiation capacity through the repression of c-MAF, a transcription factor that in BM-MSCs controls the switch between osteogenesis and adipogenesis in an age-dependent manner.
Discussion
MSCs are multipotential and immunomodulatory SSCs that can be used therapeutically for a wide range of diseases. However, ex vivo expansion to satisfy the immense cell numbers required for clinical use often results in senescence (27,31). We found that PDMCs, a population of multilineage MSCs derived from fetal placental tissue, are far more proliferative in vitro than adult BM-MSCs. However, after prolonged in vitro expansion, PDMCs still become senescent, which results in proliferative decline and a decreased ability for osteogenic differentiation. Our data suggest that that senescence in human MSCs affects differentiation as well as proliferative capacity, and that different mechanisms are involved in mediating these two critical parameters of stem cell biology.
The involvement of ROS induction, ERK activation, and PKC in senescence has been reported, revealing a complicated network of regulation in a very cell-specific manner (3,11,15,35). Our results demonstrate that the proliferative decline in senescent PDMCs is accompanied by upregulation of p21 along with cell cycle arrest at the G0/G1 phase. We also found that overexpression of p21 in E-PDMCs resulted in G0/G1 arrest without affecting the differentiation capacity (Supplementary Fig. S7B, C). Cell cycle inhibitors, such as p16, p19, and p21, have all been reported to regulate proliferation in senescent cells, but less has been investigated regarding the expression of these genes in MSC senescence and the mechanisms involved. While we found that in BM-MSCs, expression of all of these senescence markers was elevated (Supplementary Fig. S8), in PDMCs, only p21 was elevated. p16 has been reported to be increased in senescent BM-MSCs or umbilical-cord-derived MSCs (7,23), but this was not found in senescent PDMCs, suggesting that senescence may be mediated through slightly different mechanisms for different sources of MSCs. Further, we found surprisingly that p21 upregulation in senescent PDMCs was not induced by p53, but rather by PKC-α and β; this is in line with a previous study in which PKC-α and β were found to control the transcription of p21 via the transcription factor sp1 (25). Western blotting showed that levels of phospho-PKC-α and PKC-β were relatively higher in L-PDMCs than E-PDMCs (Supplementary Fig. S9). While p53 has been shown to mediate apoptosis as well as senescence, in stem cells it appears that p53 may be more involved in apoptosis and tumor suppression while its downstream effectors, including p21, may be more involved in senescence. ERK has also been reported to regulate p21 expression in a p53-independent manner in senescent cells (39). However, in PDMCs, ERK inhibition did not reverse p21 elevation or cell cycle arrest. While Clark et al. reported that ERK activation is required for PKC-induced p21 upregulation and cell cycle arrest in intestinal crypt cells (9), we did not find PKC inhibition in L-PDMCs to affect ERK activation (Fig. 5B); moreover, the localization of p-ERK in PDMCs is in the cytosol rather than the nucleus, signifying a less-active role. These differences between our results and earlier reports are likely due to cell-specific differences, since we focused on an SSC population, whereas others used end-differentiated somatic cells. Regardless of cell specificity, the role of p21 in cellular senescence is well known, and our findings are in line with many studies (48). A recent study, however, shows that p21 is also involved in modulating tumor necrosis factor-induced osteoinhibitory effect in aged mice (45). Thus, the importance of p21 in senescence may not be limited to mediating proliferative decline in senescent stem cells, but extend to influence differentiation.
Accumulation of ROS is a common occurrence in senescent cells; studies have shown that induction of ROS in senescent cells is involved in inhibiting proliferation (14,41). We have also found intracellular accumulation of H2O2 in senescent PDMCs, but the accumulation was not involved in inhibiting proliferation. Rather, H2O2 was involved in altering the differentiation potential of senescent PDMCs. The effect of senescence on stem cell differentiation potential is still unresolved, since some reports show that there is an increased adipogenic potential at the expense of osteogenesis in senescent (43) or aged BM-MSCs (10), while others found that senescence does not affect differentiation capacity (40). In the current study, we not only found that senescent PDMCs differentiate more easily toward an adipogenic than osteogenic lineage, but also show that H2O2 was involved, since removal of H2O2 by NAC can reverse this process. SIRT1 has been reported to negatively regulate PPARγ (33)—the master adipogenesis transcription factor—and modulate Runx2 expression—one major transcription regulator for bone (42). While SIRT1 expression was decreased in senescent PDMCs, it was unrelated to H2O2 accumulation (Supplementary Figs. S3 and S6). Rather, the accumulation of H2O2 in senescent PDMCs involved the downregulation of c-MAF, a transcription factor important in T cell development (17) and lens development (36). c-MAF has very recently been found to regulate osteogenesis in mouse BM-MSCs and aged individuals, with expression levels decreased after H2O2 treatment (32). Our data suggest that in senescent PDMCs, H2O2 regulates the expression of c-MAF, linking the accumulation of ROS in replicative senescence of MSCs to alterations in differentiation capacity. The role of ERK activation in senescent PDMCs also appears to affect the accumulation of H2O2—mechanisms similar to one report using chondrocytes (20)—rather than the p21/proliferative pathways. While ERK could only be transiently inhibited in senescent PDMCs, we speculate that the effect of ERK on H2O2 might be mediated also through the regulation of ROS-related genes, since ERK inhibition resulted in increased catalase expression while inhibiting MnSOD and CuZnSOD expression (Supplementary Fig. S10). We did not find PKC isoforms to be involved in this process, since inhibition of PKC-α and β by Ro31-8220 did not inhibit the formation of H2O2 in L-PDMCs (Supplementary Fig. S5). Thus, our data suggest that the alteration of differentiation capacity in senescent PDMCs is regulated by H2O2/ERK activation through c-MAF (Fig. 6E), but the exact contribution of the H2O2/ERK axis to lineage commitment in senescent MSCs would require more detailed investigation. Our findings offer a mechanistic explanation for the detrimental effects of ROS on stem cell differentiation capacity, pointing to potential targets to reverse the alteration of differentiation capacity in replicative senescence.
Materials and Methods
Cell culture
PDMCs were isolated from term placentas and expanded as described in previous studies (46), with tissue obtained from healthy donor mothers with informed consent approved according to the procedures of the institutional review board. Three donors of PDMCs were used in this study (labeled #1 to #3), and the specific donor used in each experiment is described in the figure legend. BM-MSCs were purchased from Cambrex (East Rutherford, NJ). PDMCs and BM-MSCs were cultured in a Dulbecco's Modified Eagle's Medium low-glucose (Invitrogen, Carlsbad, CA) containing 10% fetal bovine serum (Hyclone, Logan, UT), 0.5% penicillin and streptomycin (Invitrogen), and 2 mM
Differentiation studies
PDMCs were incubated with the OM or AM for differentiation as previously described (46). Oil droplet formation for adipogenesis and calcium deposition for osteogenesis were characterized by Oil-red-O and Alizarin Red staining, respectively. The stains were subsequently eluted by an acetic acid buffer (acetic acid:ethanol=1:3) and cetylpyridinium chloride buffer (10% cetylpyridinium chloride in 10 mM sodium phosphate, pH=7) for quantification of Oil-red-O and Alizarin Red staining, respectively. ALP functional assay was also used for the detection of osteogenic differentiation using an Alkaline Phosphatase Yellow Liquid Substrate System for enzyme-linked immunosorbent assay (Sigma-Aldrich), and the ALP function was measured as described by the manufacturer. Cell viability was determined by 3-(4,5-cimethylthiazol-2-yl)-2,5-diphenyl tetrazolium bromide assay. All buffer ingredients were purchased from Sigma-Aldrich.
SA-β-gal staining
Cells were fixed with 2% formaldehyde and stained for β-gal activity by the Senescence β-gal Staining Kit (Cell Signaling, Dancers, MA) as described by the manufacturer's protocol.
Western blotting
Cells were lysed and applied to sodium dodecyl sulfate polyacrylamide gel electrophoresis and subsequently transferred to a nitrocellulose paper for hybridization. ERK inhibitor PD98059 and P53 inhibitor PFT-α were purchased from Sigma-Aldrich and U0126 from Cell Signaling. PKC inhibitors Ro31-8220, Gö6976, and Ro32-0432 were purchased from Calbiochem (San Diego, CA) and Rottlerin from Sigma-Aldrich. Western blot antibodies against p21, p53, and β-actin (BD Biosciences, San Diego, CA); phospho-ERK, phospho-p38, and p38 (Cell Signaling); SIRT1, ERK1, and c-MAF (Santa Cruz Biotechnology, Santa Cruz, CA); and α-tubulin from Sigma-Aldrich were applied for hybridization. The blot was completed by horseradish peroxidase-conjugated secondary antibody (GE Biosciences), reacted with peroxidase substrate ECL (Millipore, Billerica, MA), and exposed to X-ray films (Fuji, Tokyo, Japan).
RNA extraction, reverse transcription, and PCR
RNA extraction and RT-PCR was performed as previously reported (46). qPCR was accomplished utilizing the 7500 Real-Time PCR System (Applied Biosystems, Warrington, United Kingdom) according to manufacturer's protocol. All PCR primers are listed in Supplementary Table S1.
Cell cycle analysis
Cells were trypsinized and fixed in 70% ethanol at 4°C before analysis. The fixed cells were stained with propidium iodine (PI) staining buffer (20 μg/ml PI, 0.1 mg/ml RNase A, and 1% Triton X-100; all from Sigma-Aldrich) for 30 min on ice. Analysis was carried out on a Becton Dickinson FACSCalibur flow cytometer (BD Biosciences).
Detection of ROS
PDMCs were incubated in a medium containing 40 (M DCF-DA or 5 (g/ml HE (Molecular Probes, Carlsbad, CA) at 37°C in the dark for 10 min. The fluorescence intensity was recorded by a flow cytometer (BD Biosciences) with the excitation wavelength at 488 nm and emission wavelength at 535 nm and 580 nm for DCF-DA and HE, respectively.
Statistics
Experiment values are provided as the mean±standard deviation using at least triplicate data. Measurement and quantitative results were analyzed for significance by Student's t-test.
Footnotes
Acknowledgments
This study was supported in part by the grants from National Health Research Institutes (CS-099-PP-05 and CS-100-PP-05) and the National Science Council of Taiwan (NSC97-2320-B-400 and NSC97-2314-B-001-060-MY3).
Author Disclosure Statement
No competing financial interests exist.
Abbreviations Used
References
Supplementary Material
Please find the following supplemental material available below.
For Open Access articles published under a Creative Commons License, all supplemental material carries the same license as the article it is associated with.
For non-Open Access articles published, all supplemental material carries a non-exclusive license, and permission requests for re-use of supplemental material or any part of supplemental material shall be sent directly to the copyright owner as specified in the copyright notice associated with the article.