
Abstract
Introduction
A
This study provides new insights into understanding the critical role of redox balance in regulating vascular endothelial growth factor (VEGF)-mediated angiogenic signal. In normal homeostasis, thioredoxin (TRX) system regulated by thioredoxin-interacting protein (TXNIP) counters the endogenously formed peroxynitrite to maintain VEGF receptor phosphorylation. Acute shift in redox balance genetically using TXNIP-knockout mice or high dose of N-acetyl cysteine impaired VEGF-mediated angiogenesis but not VEGF expression in vivo. We also illustrated that S-glutathionylation of the phosphatase low molecular weight protein tyrosine phosphatase (LMWPTP) as a possible mechanism by which silencing TXNIP expression impairs VEGFR2 phosphorylation in endothelial cells. These results highlight the importance of TXNIP as a potential target to control angiogenic response.
Endothelial cells have two major antioxidant systems, the glutaredoxin system and the thioredoxin (TRX) system. The crosstalk between the two systems, as indicated by the ratio of the oxidized to reduced glutathione (GSSG/GSH) reflects antioxidant capacity of the cell (18, 19). Shifting redox state to more GSSG reflects a state of oxidative stress, while shifting to more GSH reflects a state of reductive stress. A great body of evidence supports the emerging role of the TRX system in modulating VEGF and angiogenesis (17, 31, 33, 50). The TRX system is a ubiquitous thiol-reducing system that consists of TRX, NADPH, and homodimeric selenoprotein TRX reductase (36). TRXs are a family of proteins that have been identified in regulation of multiple biological processes in a cell-compartment specific fashion. TRX has two distinct isoforms; the cytosolic (TRX-1) and the more recently identified mitochondrial (TRX-2) isoform. The activity and expression of TRX is regulated by thioredoxin-interacting protein (TXNIP) that tightly control cellular redox state (41). TXNIP-knockout (TKO) mice have been previously characterized by marked increase in antioxidant defense compared to wild-type (WT) mice (28, 44). Upregulation of TXNIP expression has been reported under stress conditions including inflammation and hyperglycemia (7, 13, 42). Yet, whether TXNIP expression can play a role in modulating cellular redox state and VEGF-mediated angiogenesis remains unstudied.
Previous studies showed that VEGF-induced ROS targets protein tyrosine phosphatases (PTP) to regulate angiogenic signal (1, 30, 49). We have recently demonstrated that VEGF caused transient S-glutathionylation and oxidative inhibition of the low molecular weight PTP (LMW-PTP), a redox-regulated phosphatase that regulates cell adhesion and migration. While overexpression of LMW-PTP blunted VEGF-mediated angiogenic response (26), its inhibition enhanced VEGF-induced cell migration in endothelial cells (1). Yet, the redox-dependent role of TXNIP in regulating LMW-PTP and how it can modulate VEGF-mediated angiogenic response in vivo remain to be elucidated. The current studies utilized hypoxia-induced murine neovascularization model, a standard model for retinal angiogenesis (45). The model has two distinguished stages: initial stage of hyperoxia (75% oxygen) characterized with capillary dropout in the central retina, followed by a later stage of relative hypoxia (21% oxygen) characterized with retinal neovascularization including a physiological angiogenesis to fill the central retina and a pathological angiogenic response at the retina periphery. Using TKO or WT mice treated with high dose of the glutathione precursor NAC, we tested the hypothesis that shifting cellular redox state to reductive stress will scavenge VEGF-induced peroxynitrite and impair VEGFR2 phosphorylation and VEGF angiogenic signal by a mechanism involving the hyperactivation of LMW-PTP.
Results
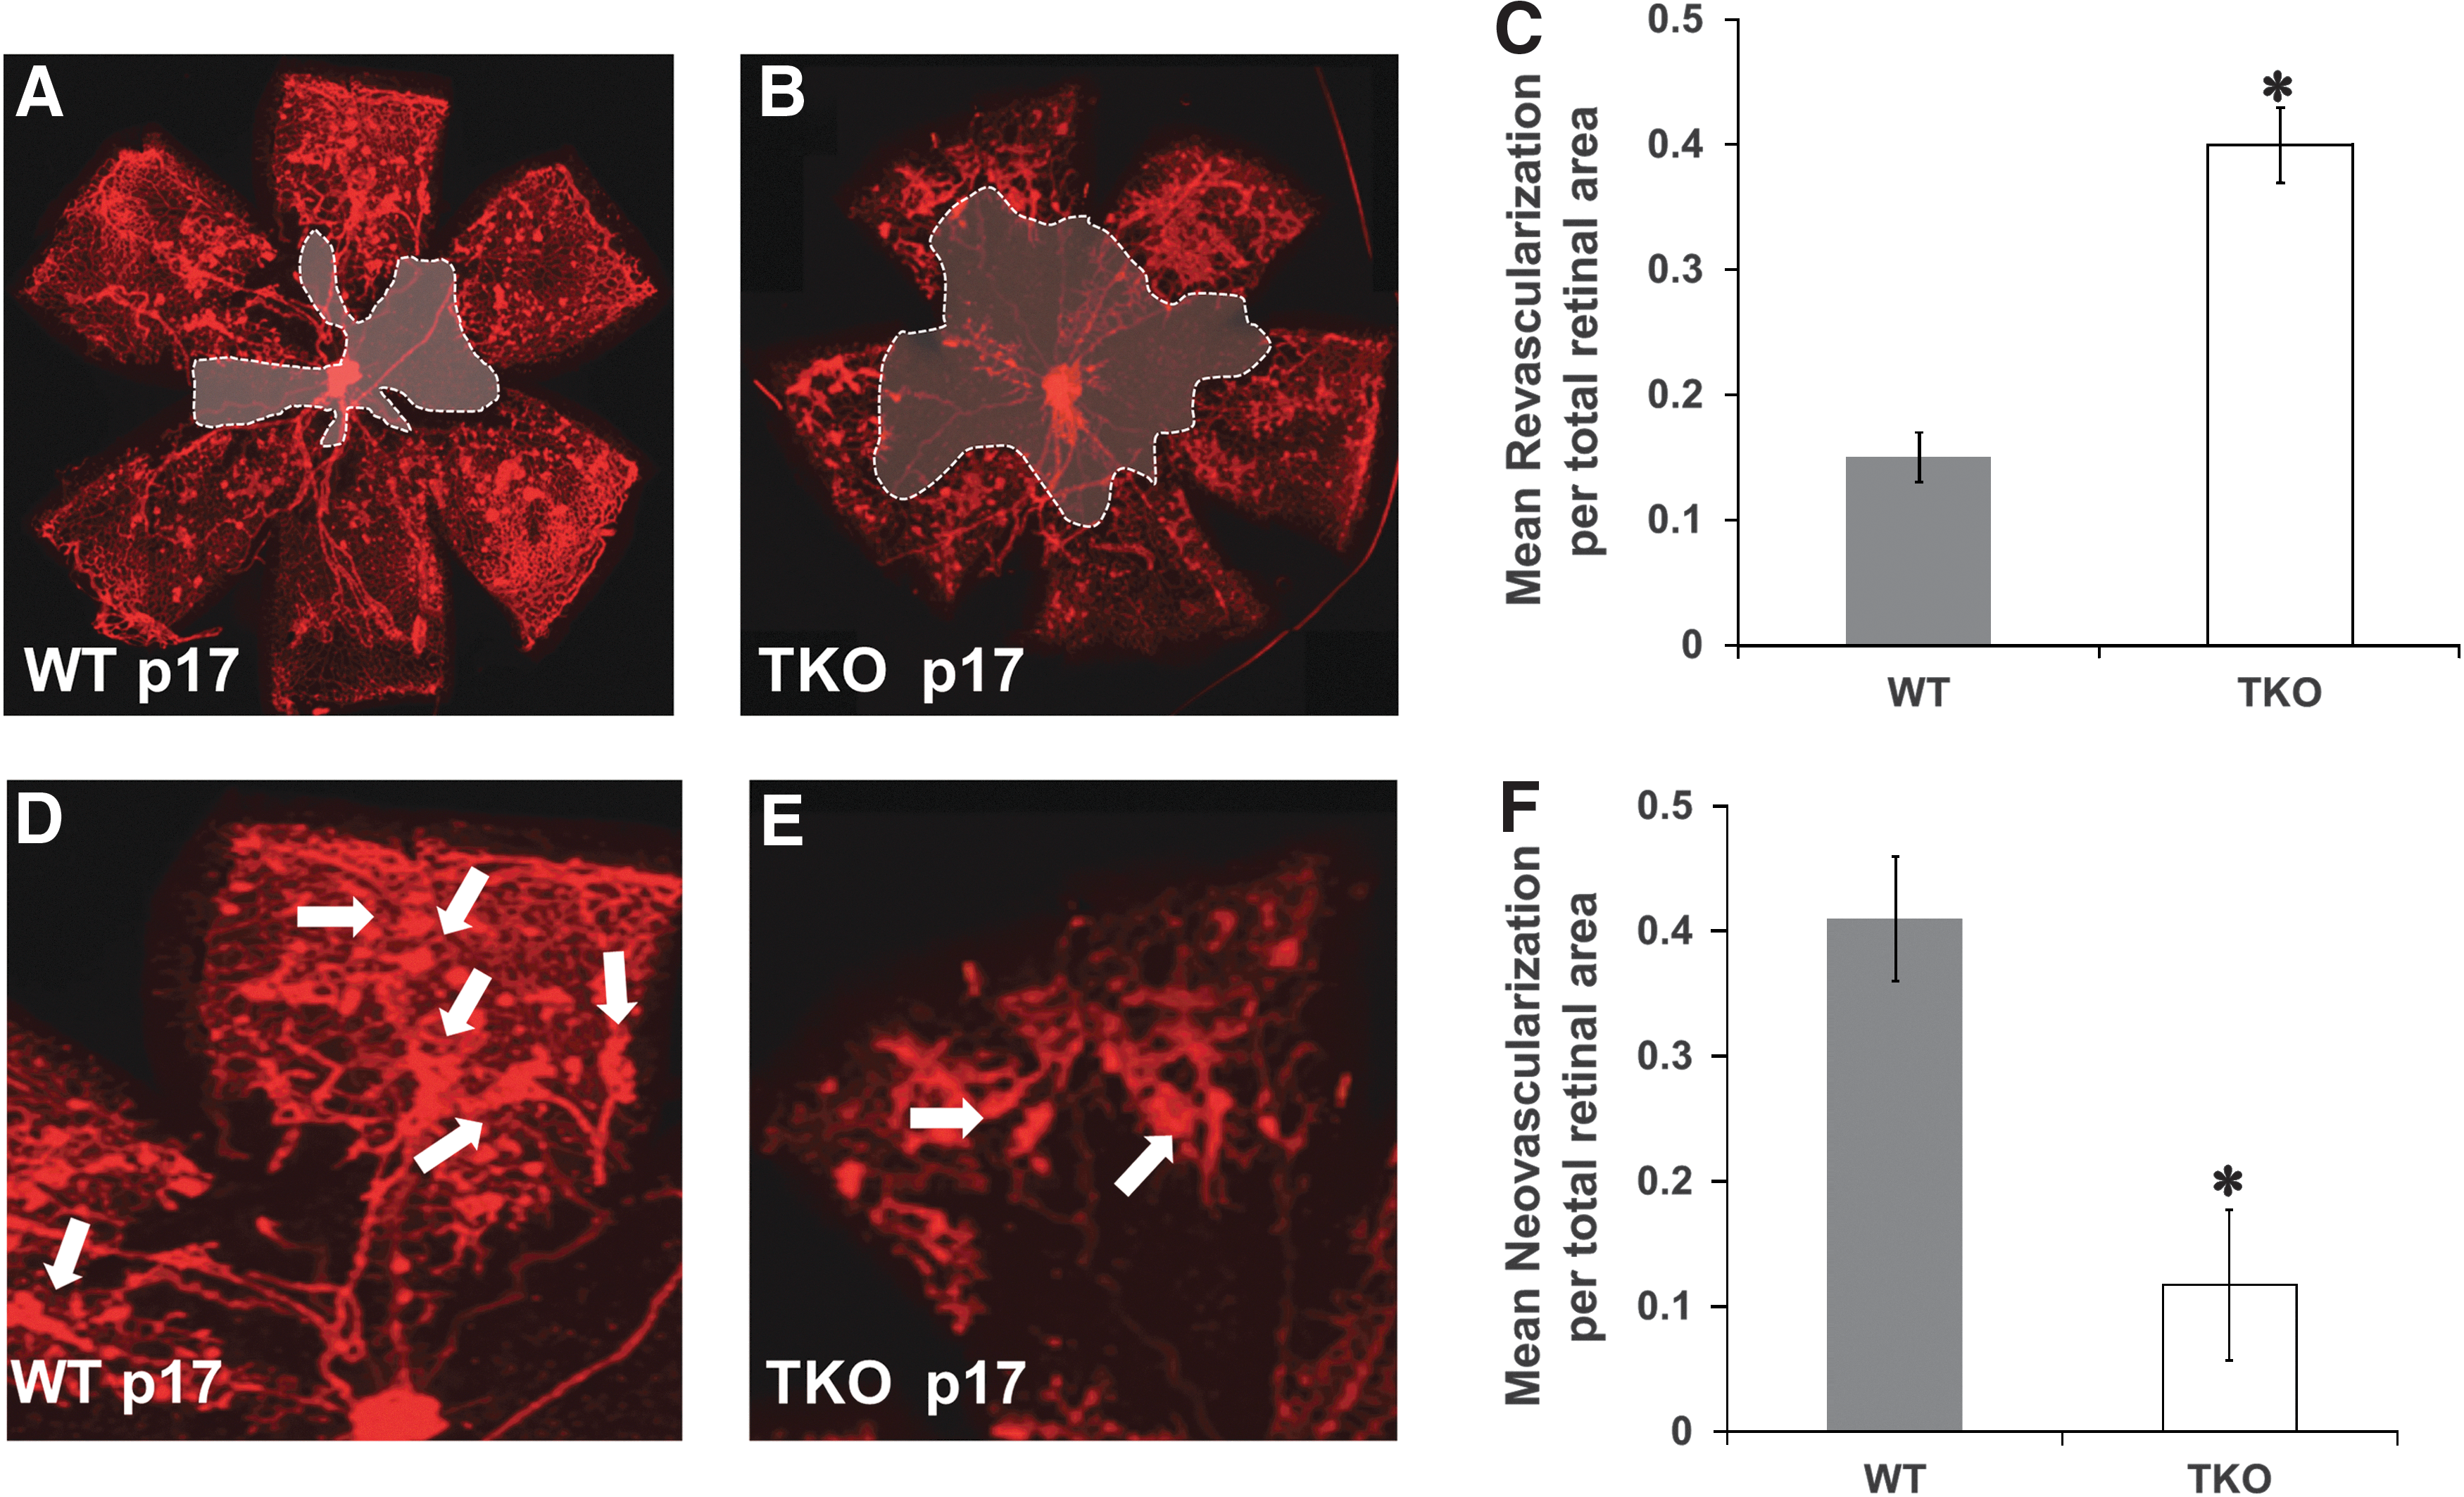
Deficiency of TXNIP impairs reparative and pathological retinal neovascularization
TKO mice and WT mice were subjected to hypoxia-induced neovascularization model, a standard model of VEGF-mediated retinal angiogenesis in neonates (3, 45). In this model depicted in Supplementary Figure S1 (Supplementary Data are available online at
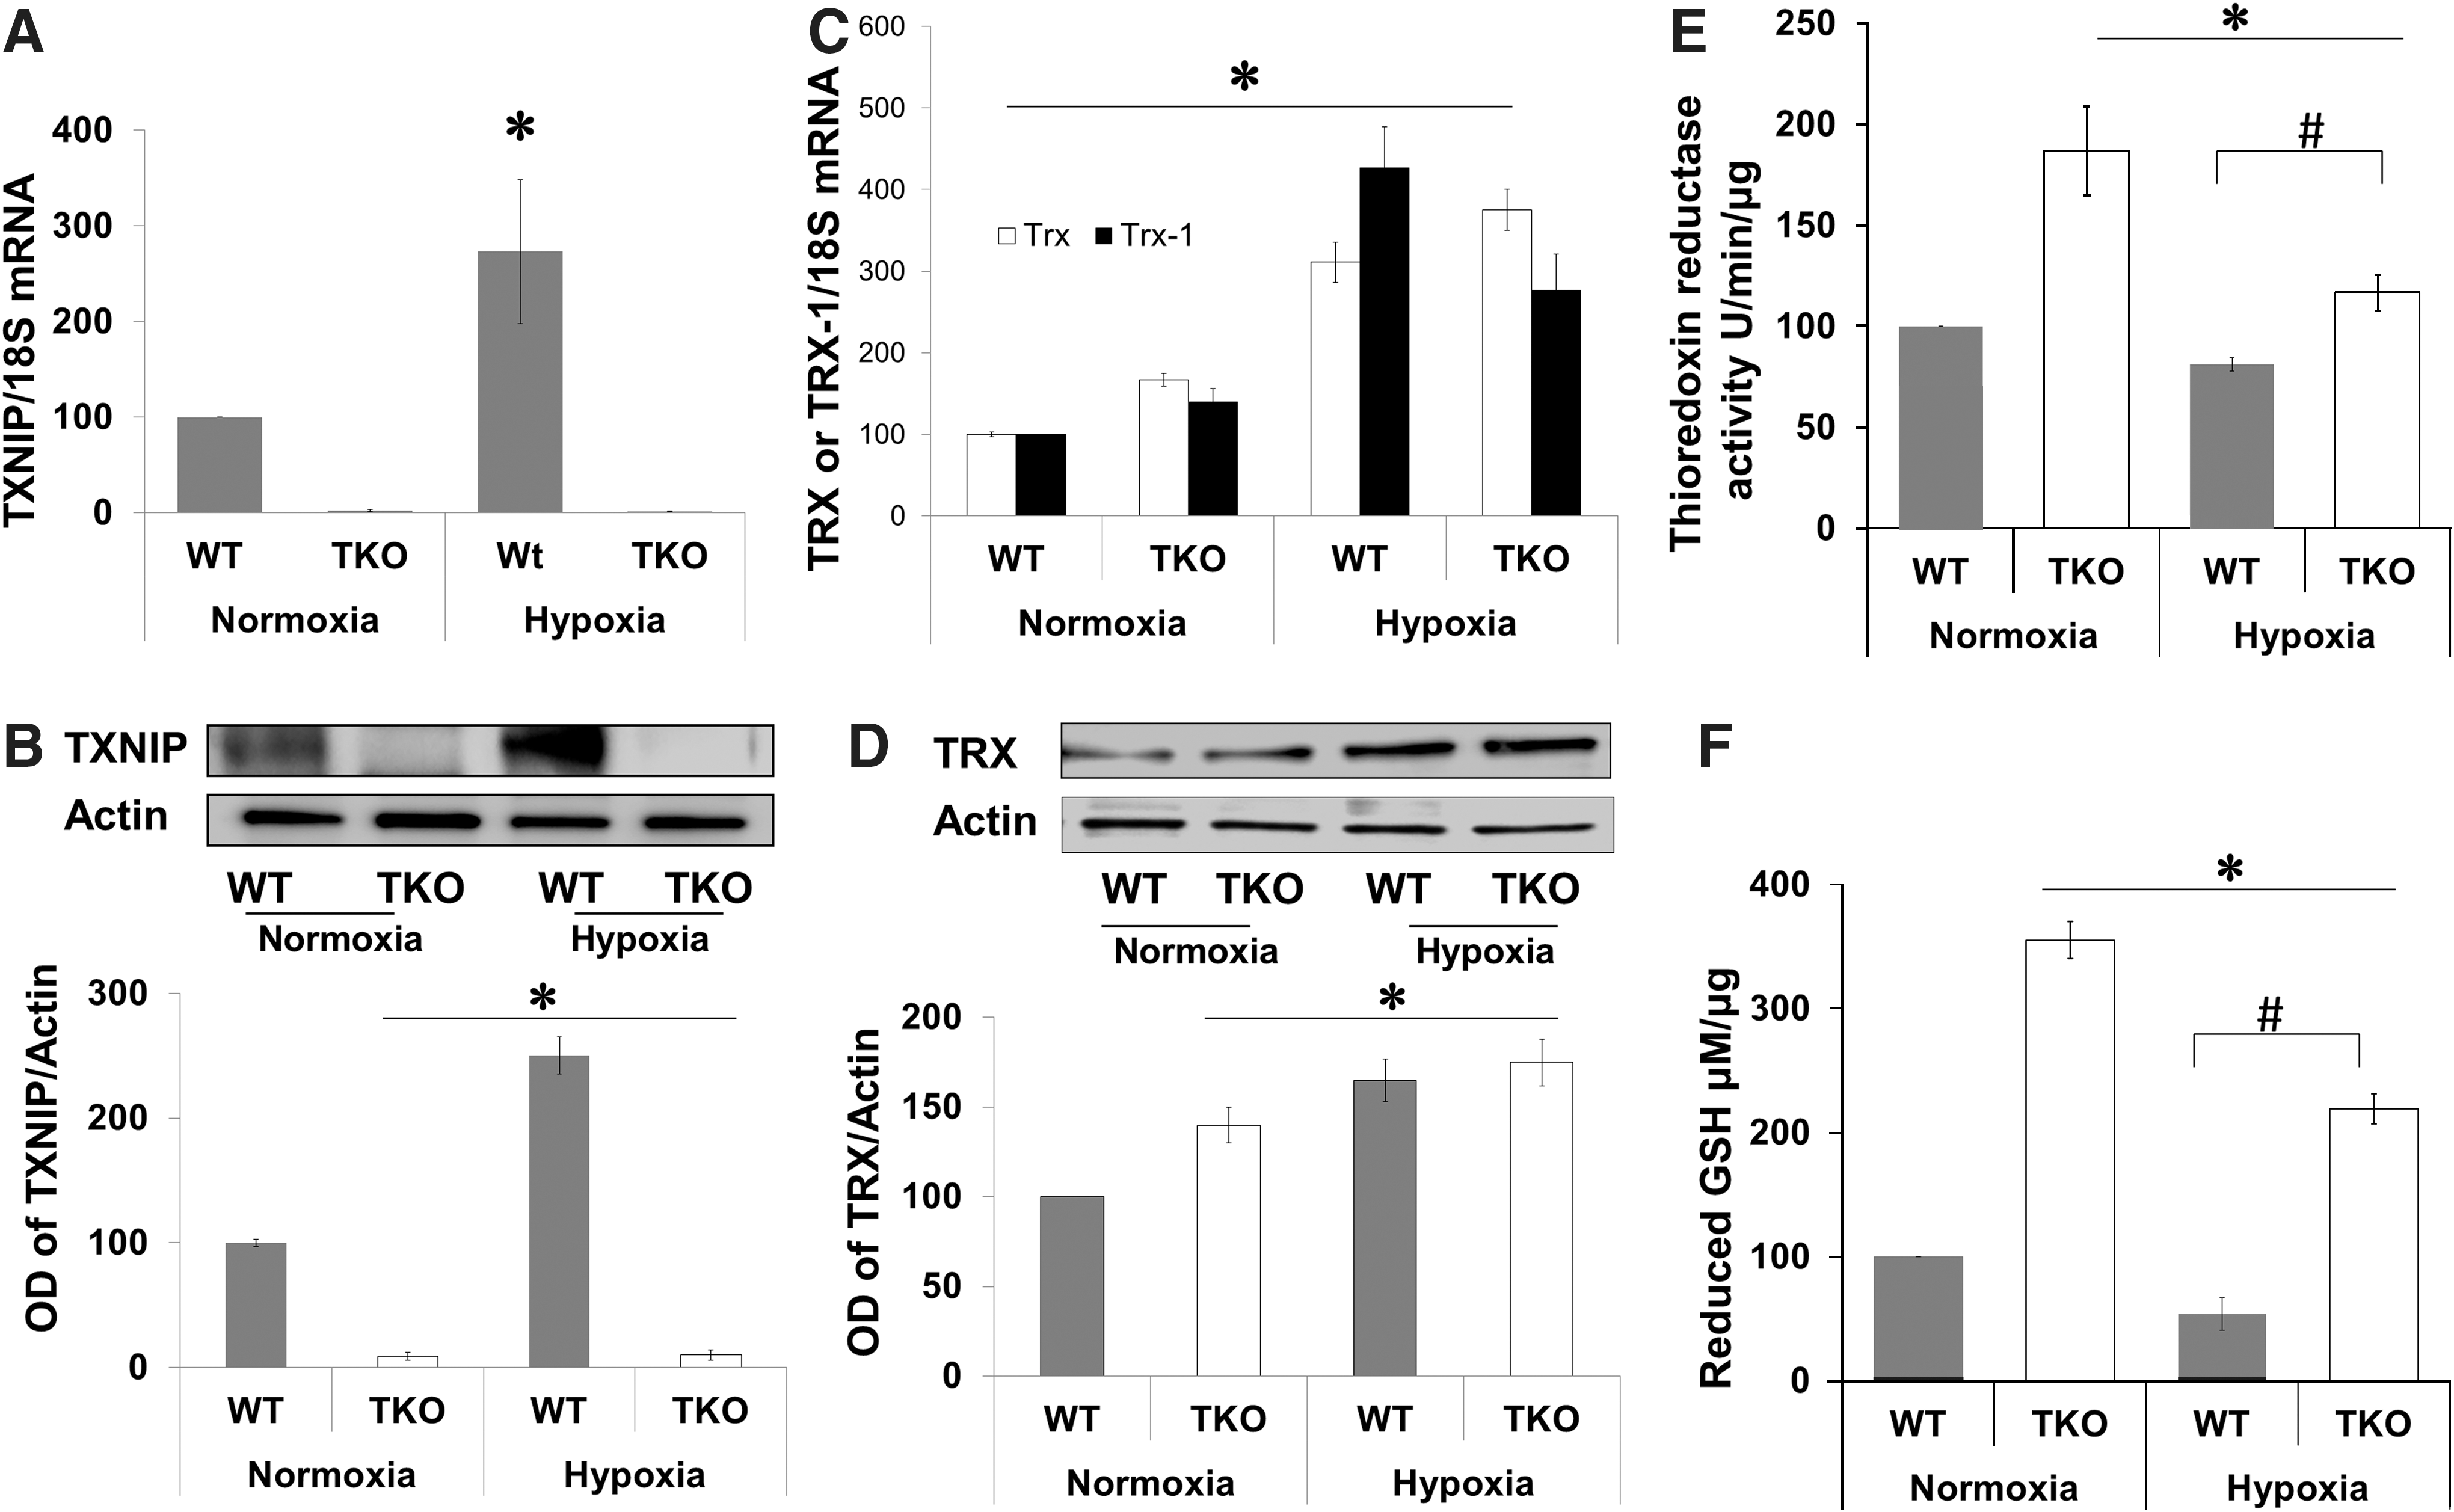
Deficiency of TXNIP expression shifts redox state to reductive stress
We next evaluated expression of TXNIP and TRX-1 and antioxidant defense in response to hypoxia. In WT, hypoxia (p12–p14) induced TXNIP mRNA expression (2.2-fold) and protein expression (2.5-fold) compared with normoxia (Fig. 2A, B). TKO mice showed no TXNIP mRNA or protein expression under both normoxic and hypoxic conditions (Fig. 2A, B). A two-way ANOVA (2×2) analysis showed significant difference between hypoxia versus normoxia in both WT and TKO. In comparison with WT, retinas from TKO mice showed significant 1.7-fold increase in TRX mRNA and 1.6-fold increase in TRX-1 mRNA under normoxic (Fig. 2C). In WT, hypoxia (p12–p14) induced TRX mRNA expression (3-fold) and TRX-1 mRNA expression (4.25-fold) (Fig. 2C) and total TRX protein expression (1.6-fold) compared with normoxia (Fig. 2D). In TKO, hypoxia induced significant 2.2-fold increase in TRX and 2-fold in TRX-1 mRNA expression (Fig. 2C). Statistical analysis also showed a significant difference between WT versus TKO on TRX or TRX-1 expression. For protein levels, retinas from TKO showed 1.45-fold increase in TRX under normoxia and 1.8-fold under hypoxic condition. TKO were previously characterized by having significant increase in the ratio of NADH to NAD and the hepatic ratios of reduced to GSSG (28, 44). Under normoxic condition, TKO had significant 2-fold increases in retinal TRX reductase activity and 3.5-fold in plasma GSH when compared with age-matched p17 WT mice (Fig. 2E, F). Hypoxia is known to increase oxidative stress and consume antioxidant capacity. A two-way ANOVA (gene/Oxygen levels) revealed a significant difference between (WT vs. TKO) and (Normoxia vs. Hypoxia) on their interaction on TRX reductase activity and GSH levels. Exposure to hypoxia (p12–p17) caused 20% and 40% reduction in retinal TRX reductase activity in WT and TKO, respectively and 40% and 45% reduction in plasma GSH levels in WT and TKO, respectively (Fig. 2E, F).
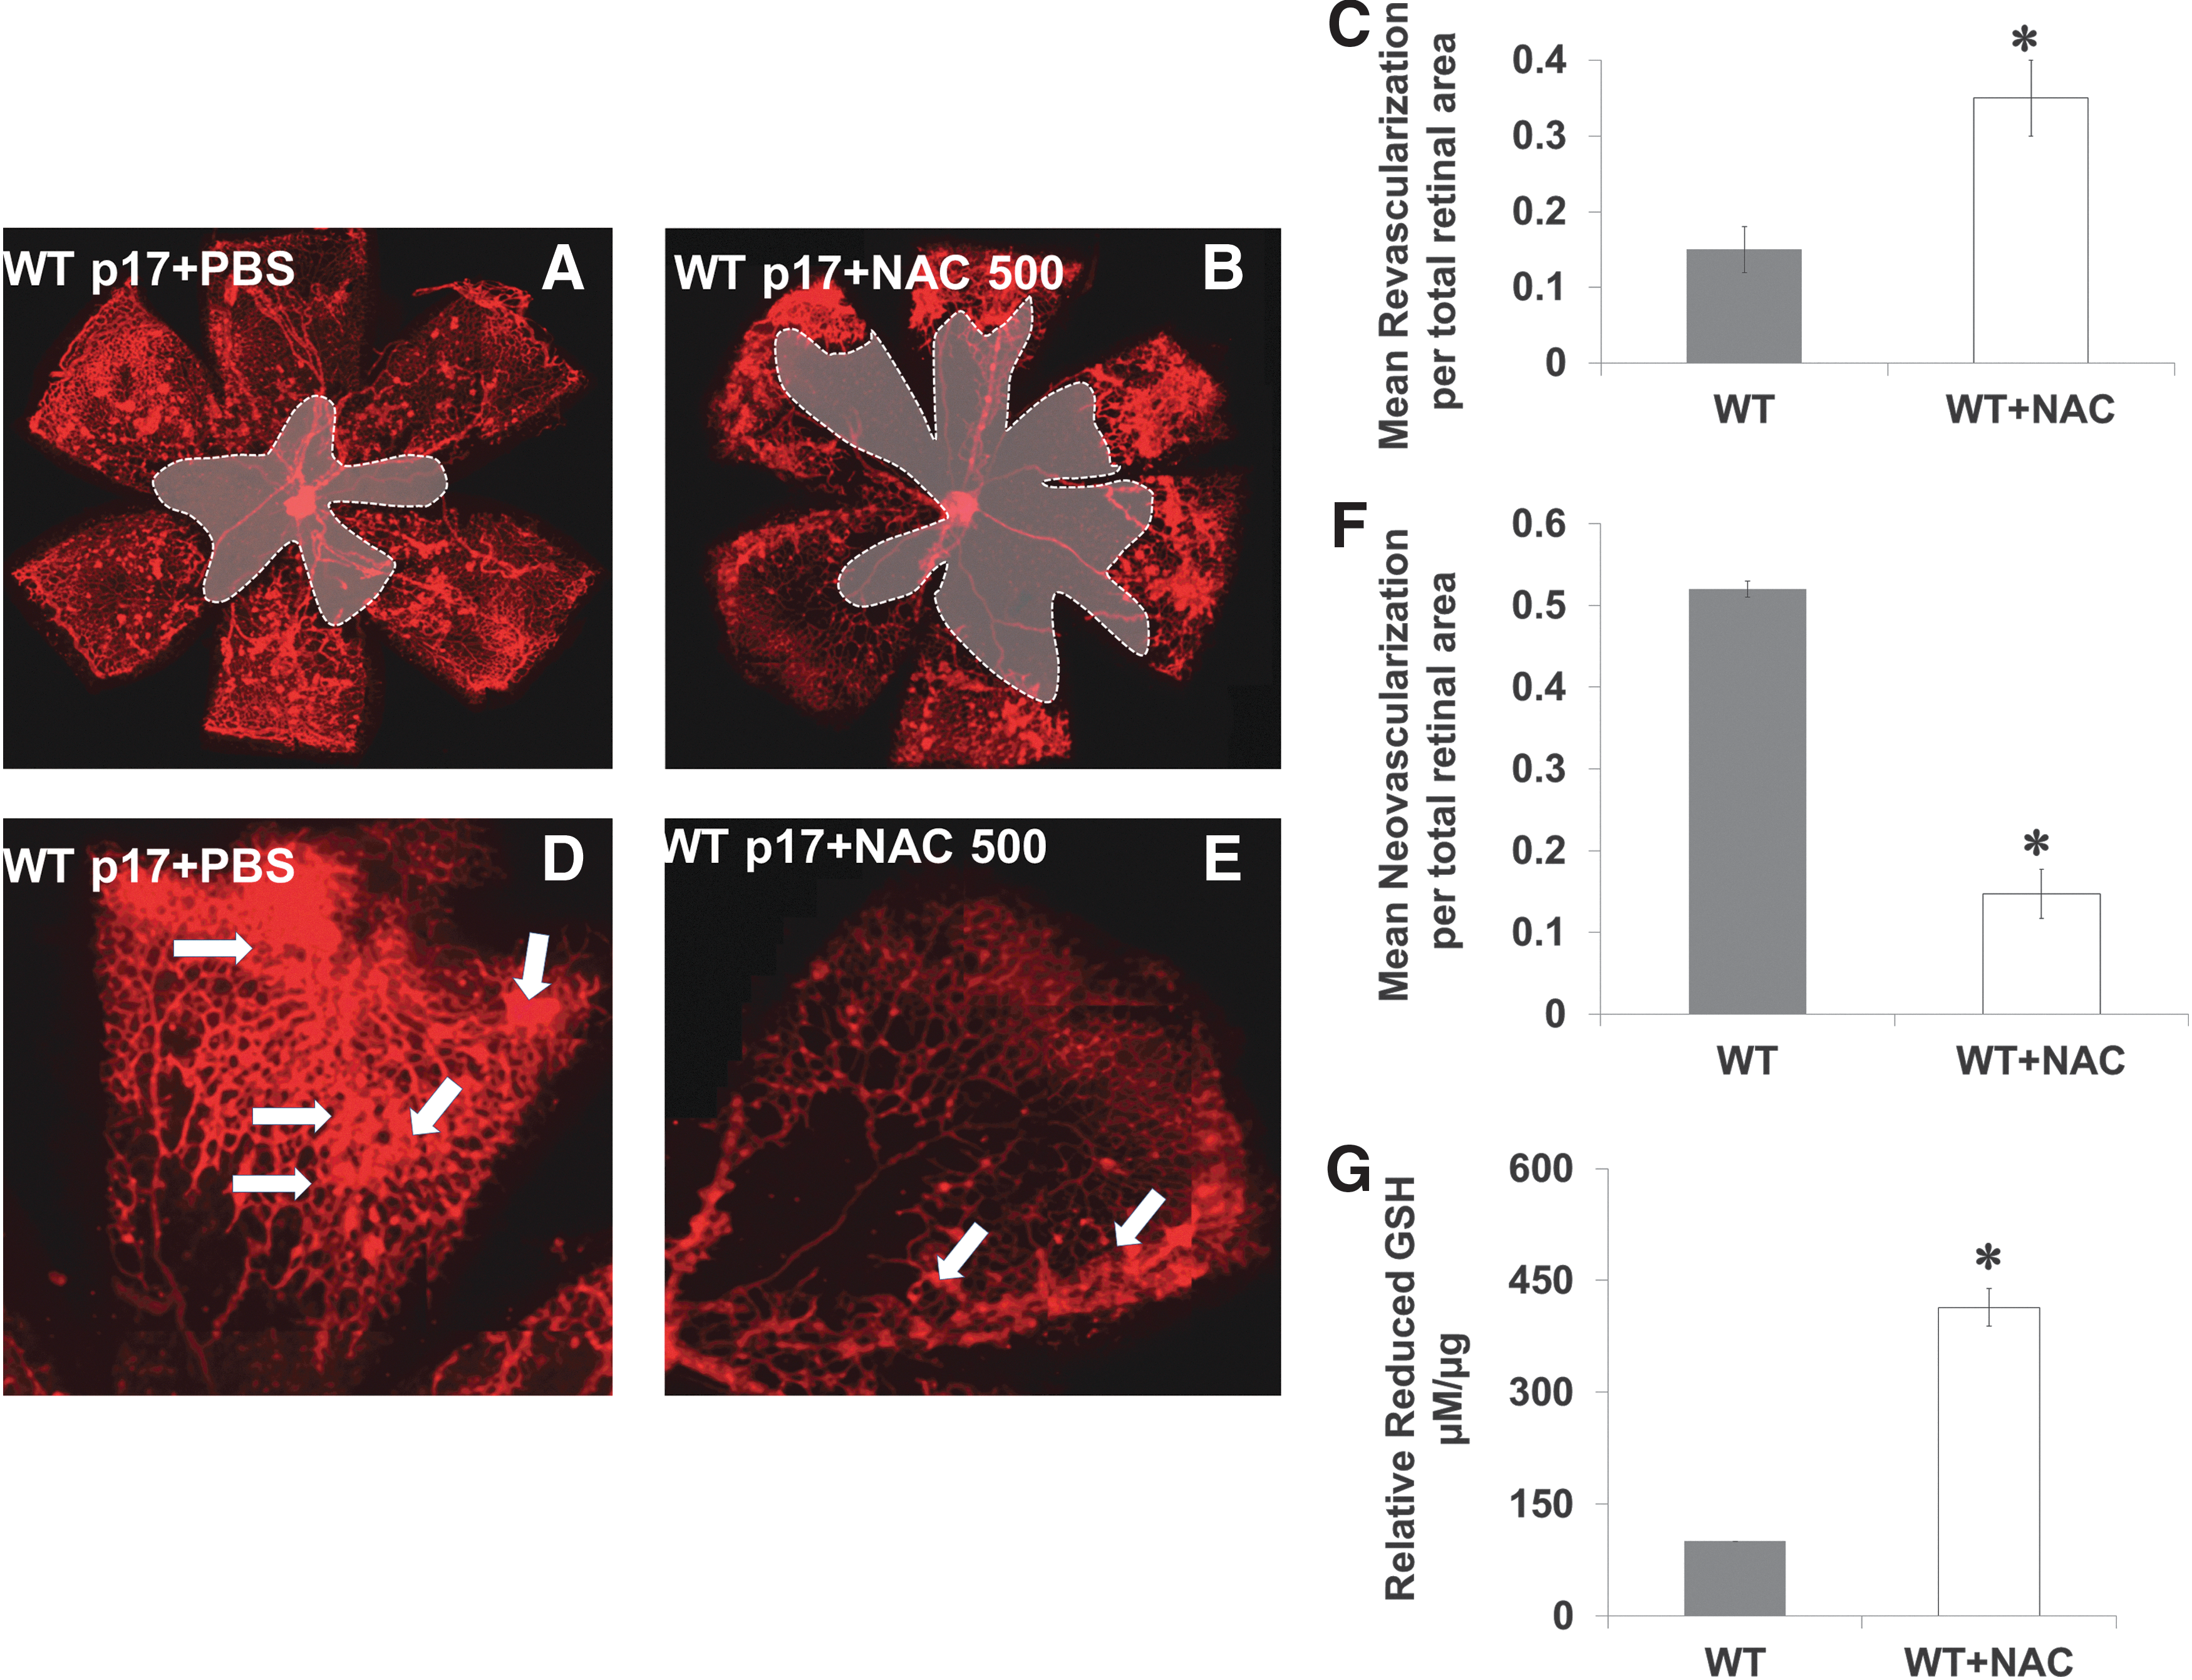
Pharmacologically induced reductive stress impairs VEGF-induced neovascularization
We mimicked the acute shift in redox state observed in TKO by treating WT mice with a high dose (three times of the traditional antioxidant dose) of the thiol donor and GSH-precursor N-acetyl cysteine (NAC, 500 mg/kg, IP) during hypoxia from p12–p17. In comparison with WT (Fig. 3A, D), treatment with NAC (WT+NAC) decreased reparative angiogenesis indicated by 2.3-fold increase in central capillary-free area (Fig. 3B, C) and decreased pathological neovascularization by 70% at peripheral retina (Fig. 3E, F). Plasma of WT+NAC pups showed a fourfold increase in reduced-GSH levels when compared with age-matched p17 WT mice (Fig. 3G). We next evaluated the effect of TXNIP deficiency or high dose of NAC on peroxynitrite formation assessed by nitrotyrosine formation. As shown in Supplementary Figure S3, under normoxic condition, TKO mice showed 45% reduction in nitrotyrosine formation compared with WT. Hypoxia (p12–p14) induced 2.5-fold increase in the retinal nitrotyrosine formation in WT but not in TKO or WT+NAC.
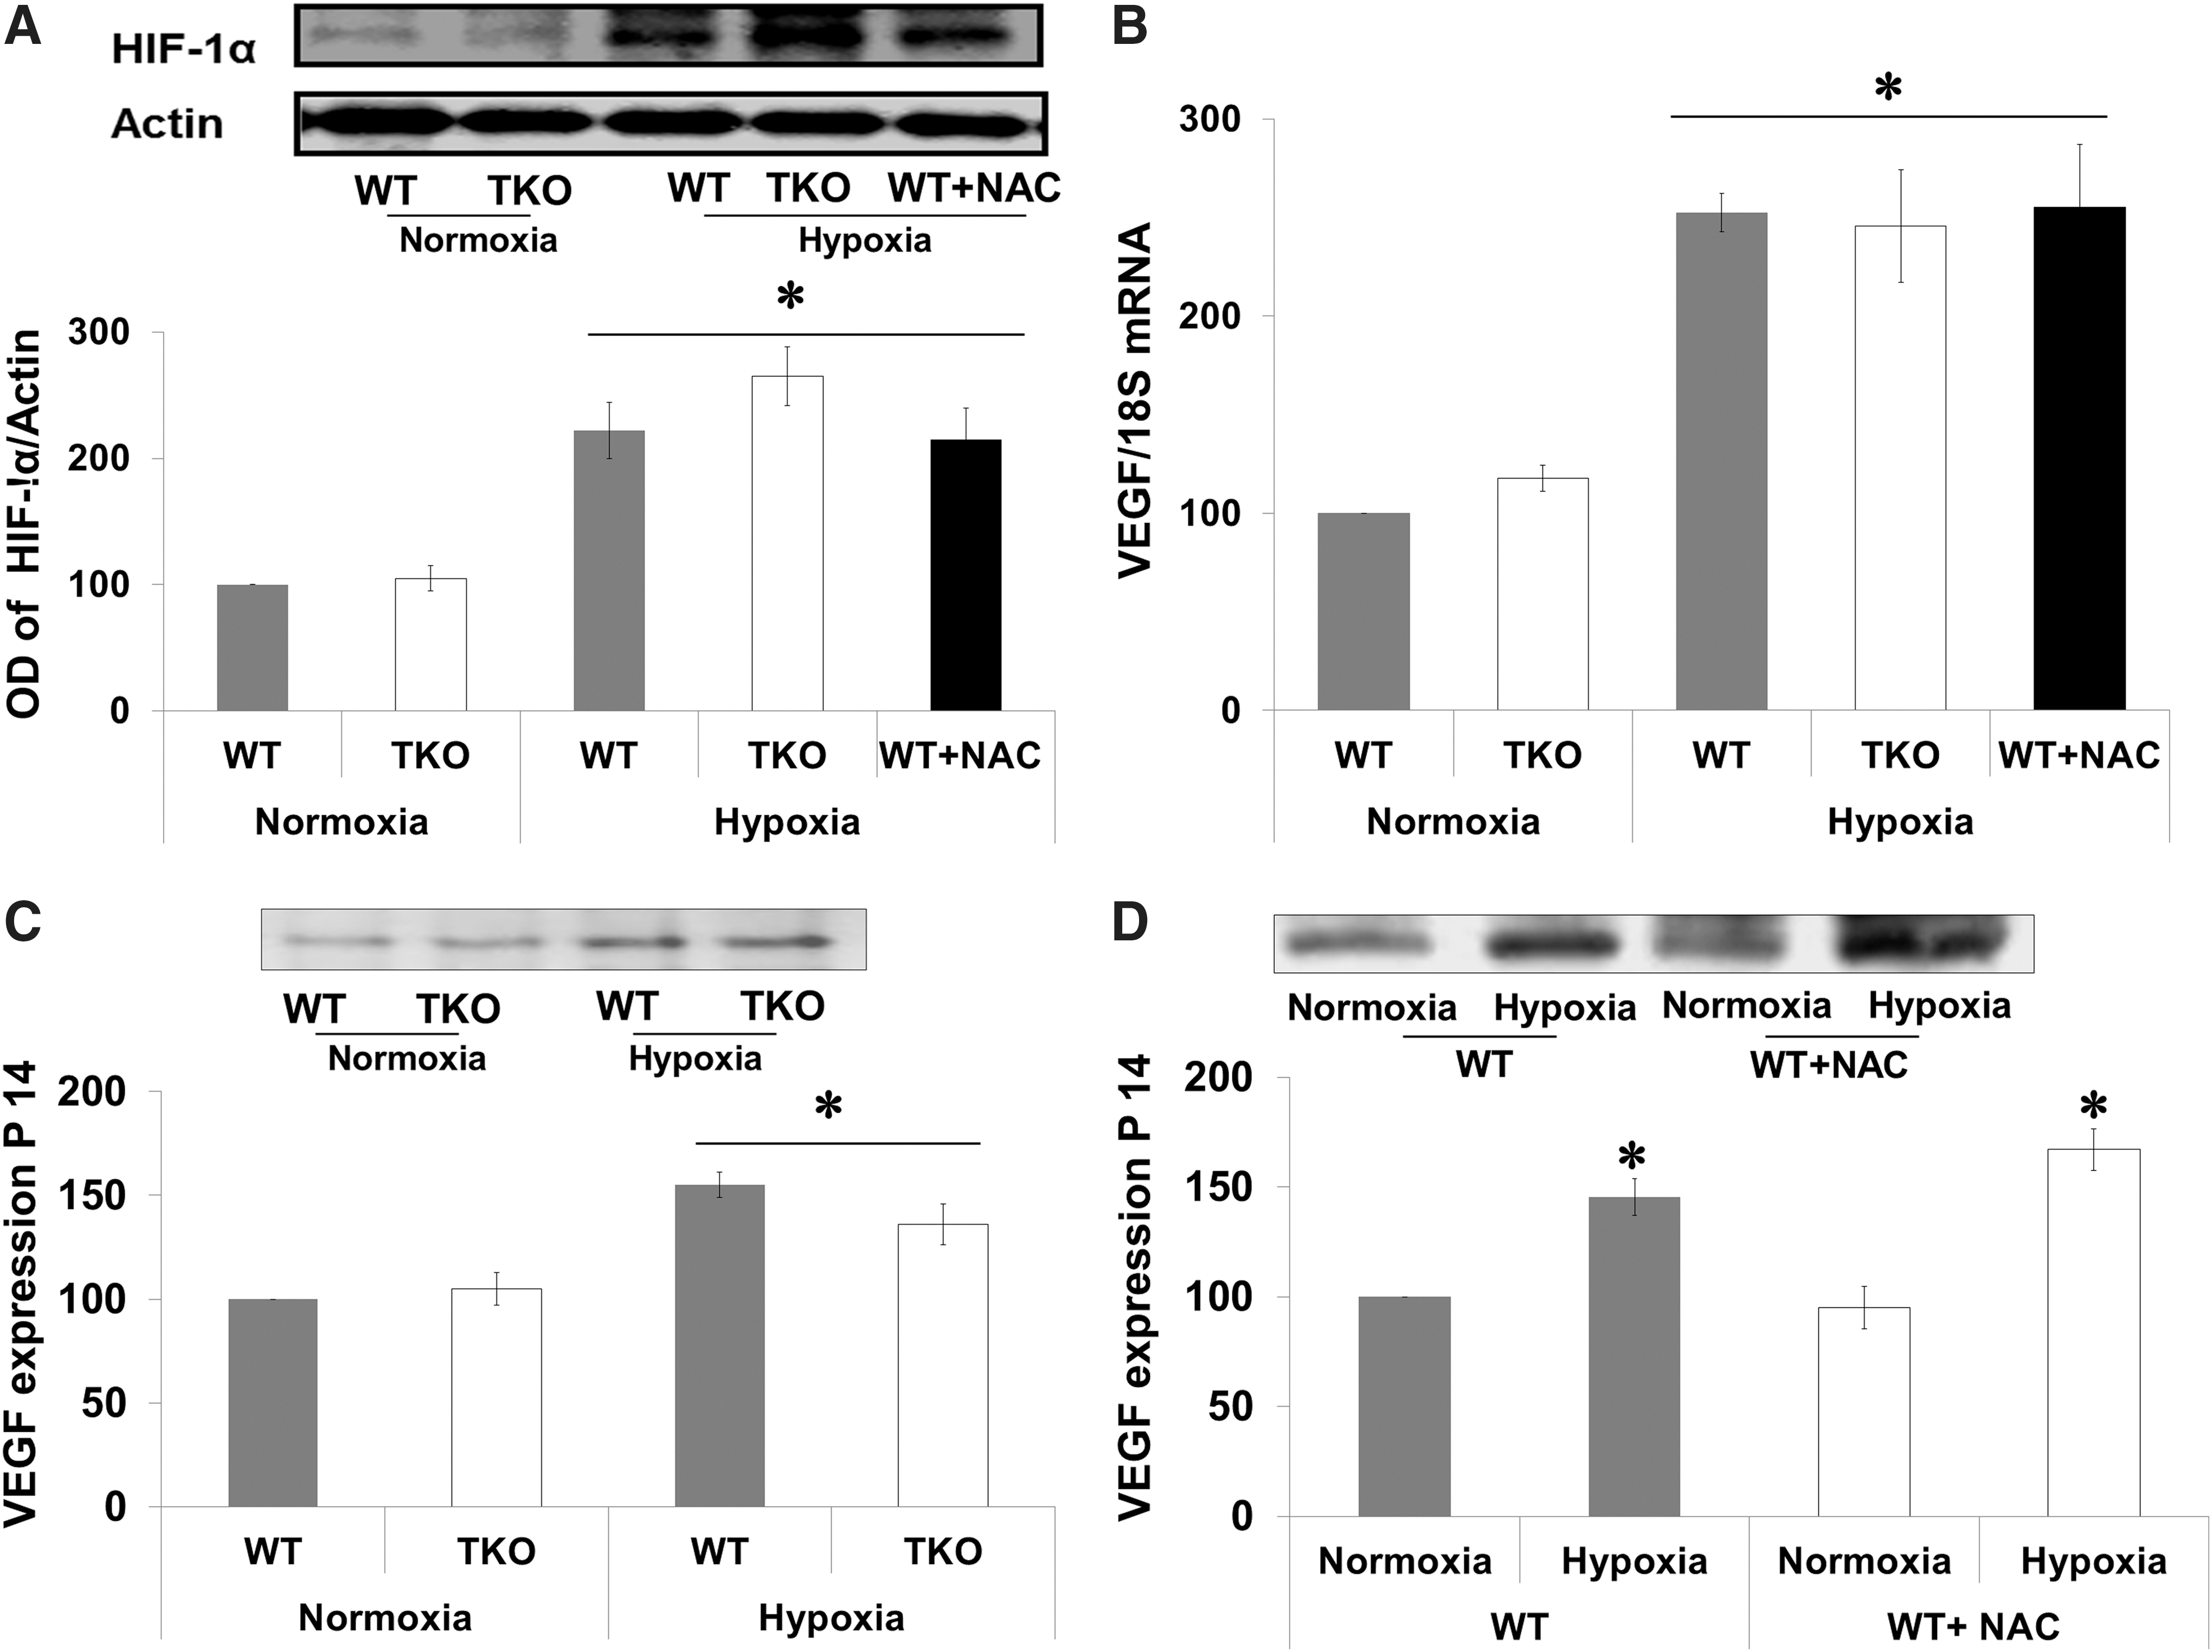
Acute shift to reductive stress did not alter hypoxia inducible factor-1α or VEGF expression
TXNIP is a known target gene for hypoxia inducible factor 1α (HIF-1α), which is an essential transcriptional regulator for hypoxia-induced angiogenesis. Therefore, we examined the effect of hypoxia on retinal expression of HIF-1α and VEGF at p14, a time point for maximum VEGF expression in this model (8). Hypoxia (p12–p14) increased the expression of HIF-1α 2.2-fold in WT, 2.6-fold in TKO mice, and 2.1-fold in WT-NAC compared with corresponding normoxic controls (Fig. 4A). We next examined the impact of increased cellular antioxidant defense on VEGF mRNA and expression. A two-way ANOVA 2×2 analysis showed no significant interaction between WT versus TKO or WT-NAC. Statistical analysis showed a significant interaction between hypoxia versus normoxia in both WT and TKO. Hypoxia induced comparable increases in VEGF retinal mRNA (2.5-fold) in WT and (2.45-fold) in TKO mice and (2.55-fold) in WT-NAC compared with corresponding normoxic controls (Fig. 4B). Hypoxia also induced retinal VEGF protein expression (1.5-fold) in WT and (1.4-fold) in TKO mice (Fig. 4C) and (1.6-fold) in WT-NAC compared with corresponding normoxic controls (Fig. 4D).
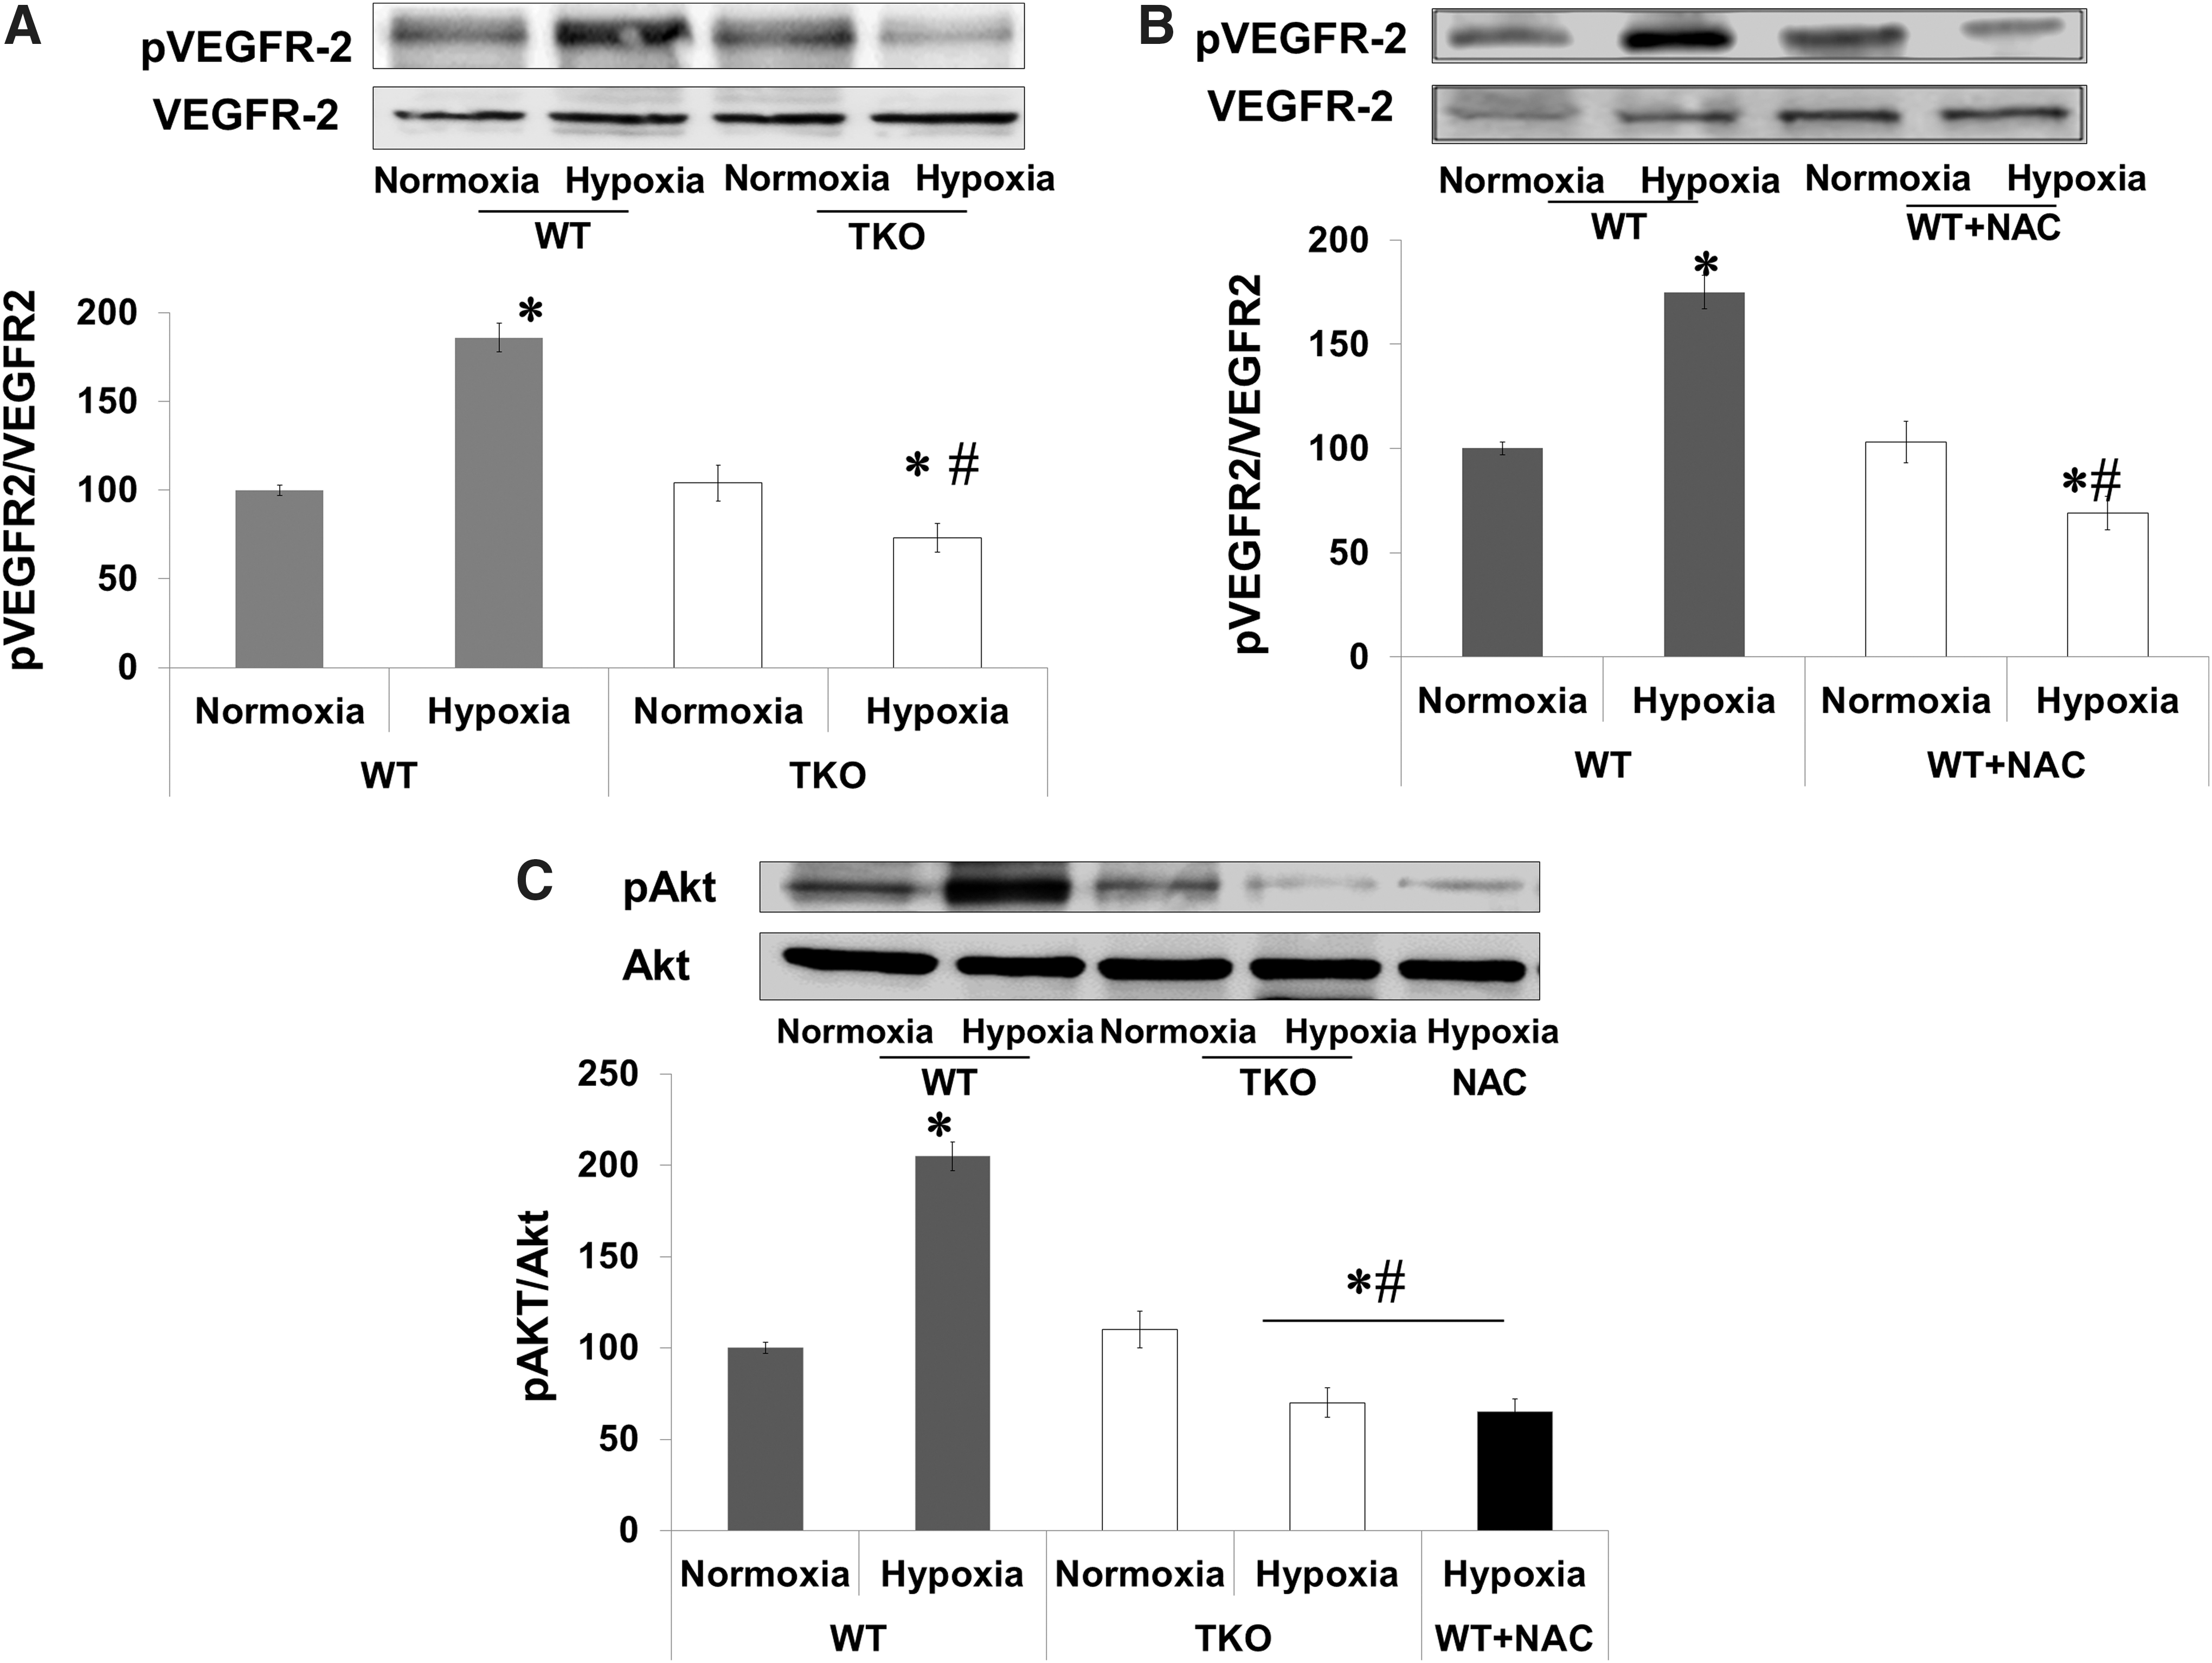
Acute shift to reductive stress impairs retinal VEGFR2 activation in vivo
We next examined the auto-phosphorylation site (Y966), which is required for the VEGFR2 kinase activity. A two-way ANOVA was used to examine the effect of manipulation (WT vs. TKO or WT+NAC) and oxygen levels (Normoxia vs. Hypoxia) and revealed a significant interaction between WT versus TKO/WT+NAC on the phosphorylation of VEGFR2. Retinas from WT showed 1.8-fold increases in VEGFR2 phosphorylation in response to hypoxia. On the other hand, retinas from TKO mice showed a 60% reduction of VEGFR2 activation compared with WT under hypoxia and 35% reduction when compared with TKO under normoxia (Fig. 5A). In comparison to WT, retinas from WT+NAC showed significant 56% reduction in VEGFR2 phosphorylation under hypoxia (Fig. 5B) and 30% reduction under normoxia. To confirm our results, we examined the activation of Akt, a downstream target from VEGFR2. A 2×2 statistical analysis showed a significant difference between WT and TKO/WT+NAC in pAKT phosphorylation in normoxia and hypoxia. Hypoxia (p12–p14) stimulated Akt phosphorylation twofold in retinas from WT but not from TKO or WT+NAC (Fig. 5C).
VEGF stimulates protein–protein interaction between VEGFR2 and LMW-PTP
We and others have shown that LMW-PTP can modulate VEGF-mediated angiogenic response in endothelial cells (1, 26). We examined interaction of VEGFR2 with LMW-PTP, a redox-regulated phosphatase (14). Results show that VEGF stimulated protein–protein interaction of LMW-PTP with VEGFR2 evident by maximum co-precipitation after 15 min of VEGF stimulation in human microvascular endothelial (HME) cells (Fig. 6A). These results suggest that LMW-PTP regulates sustained rather than immediate VEGFR2 activation.
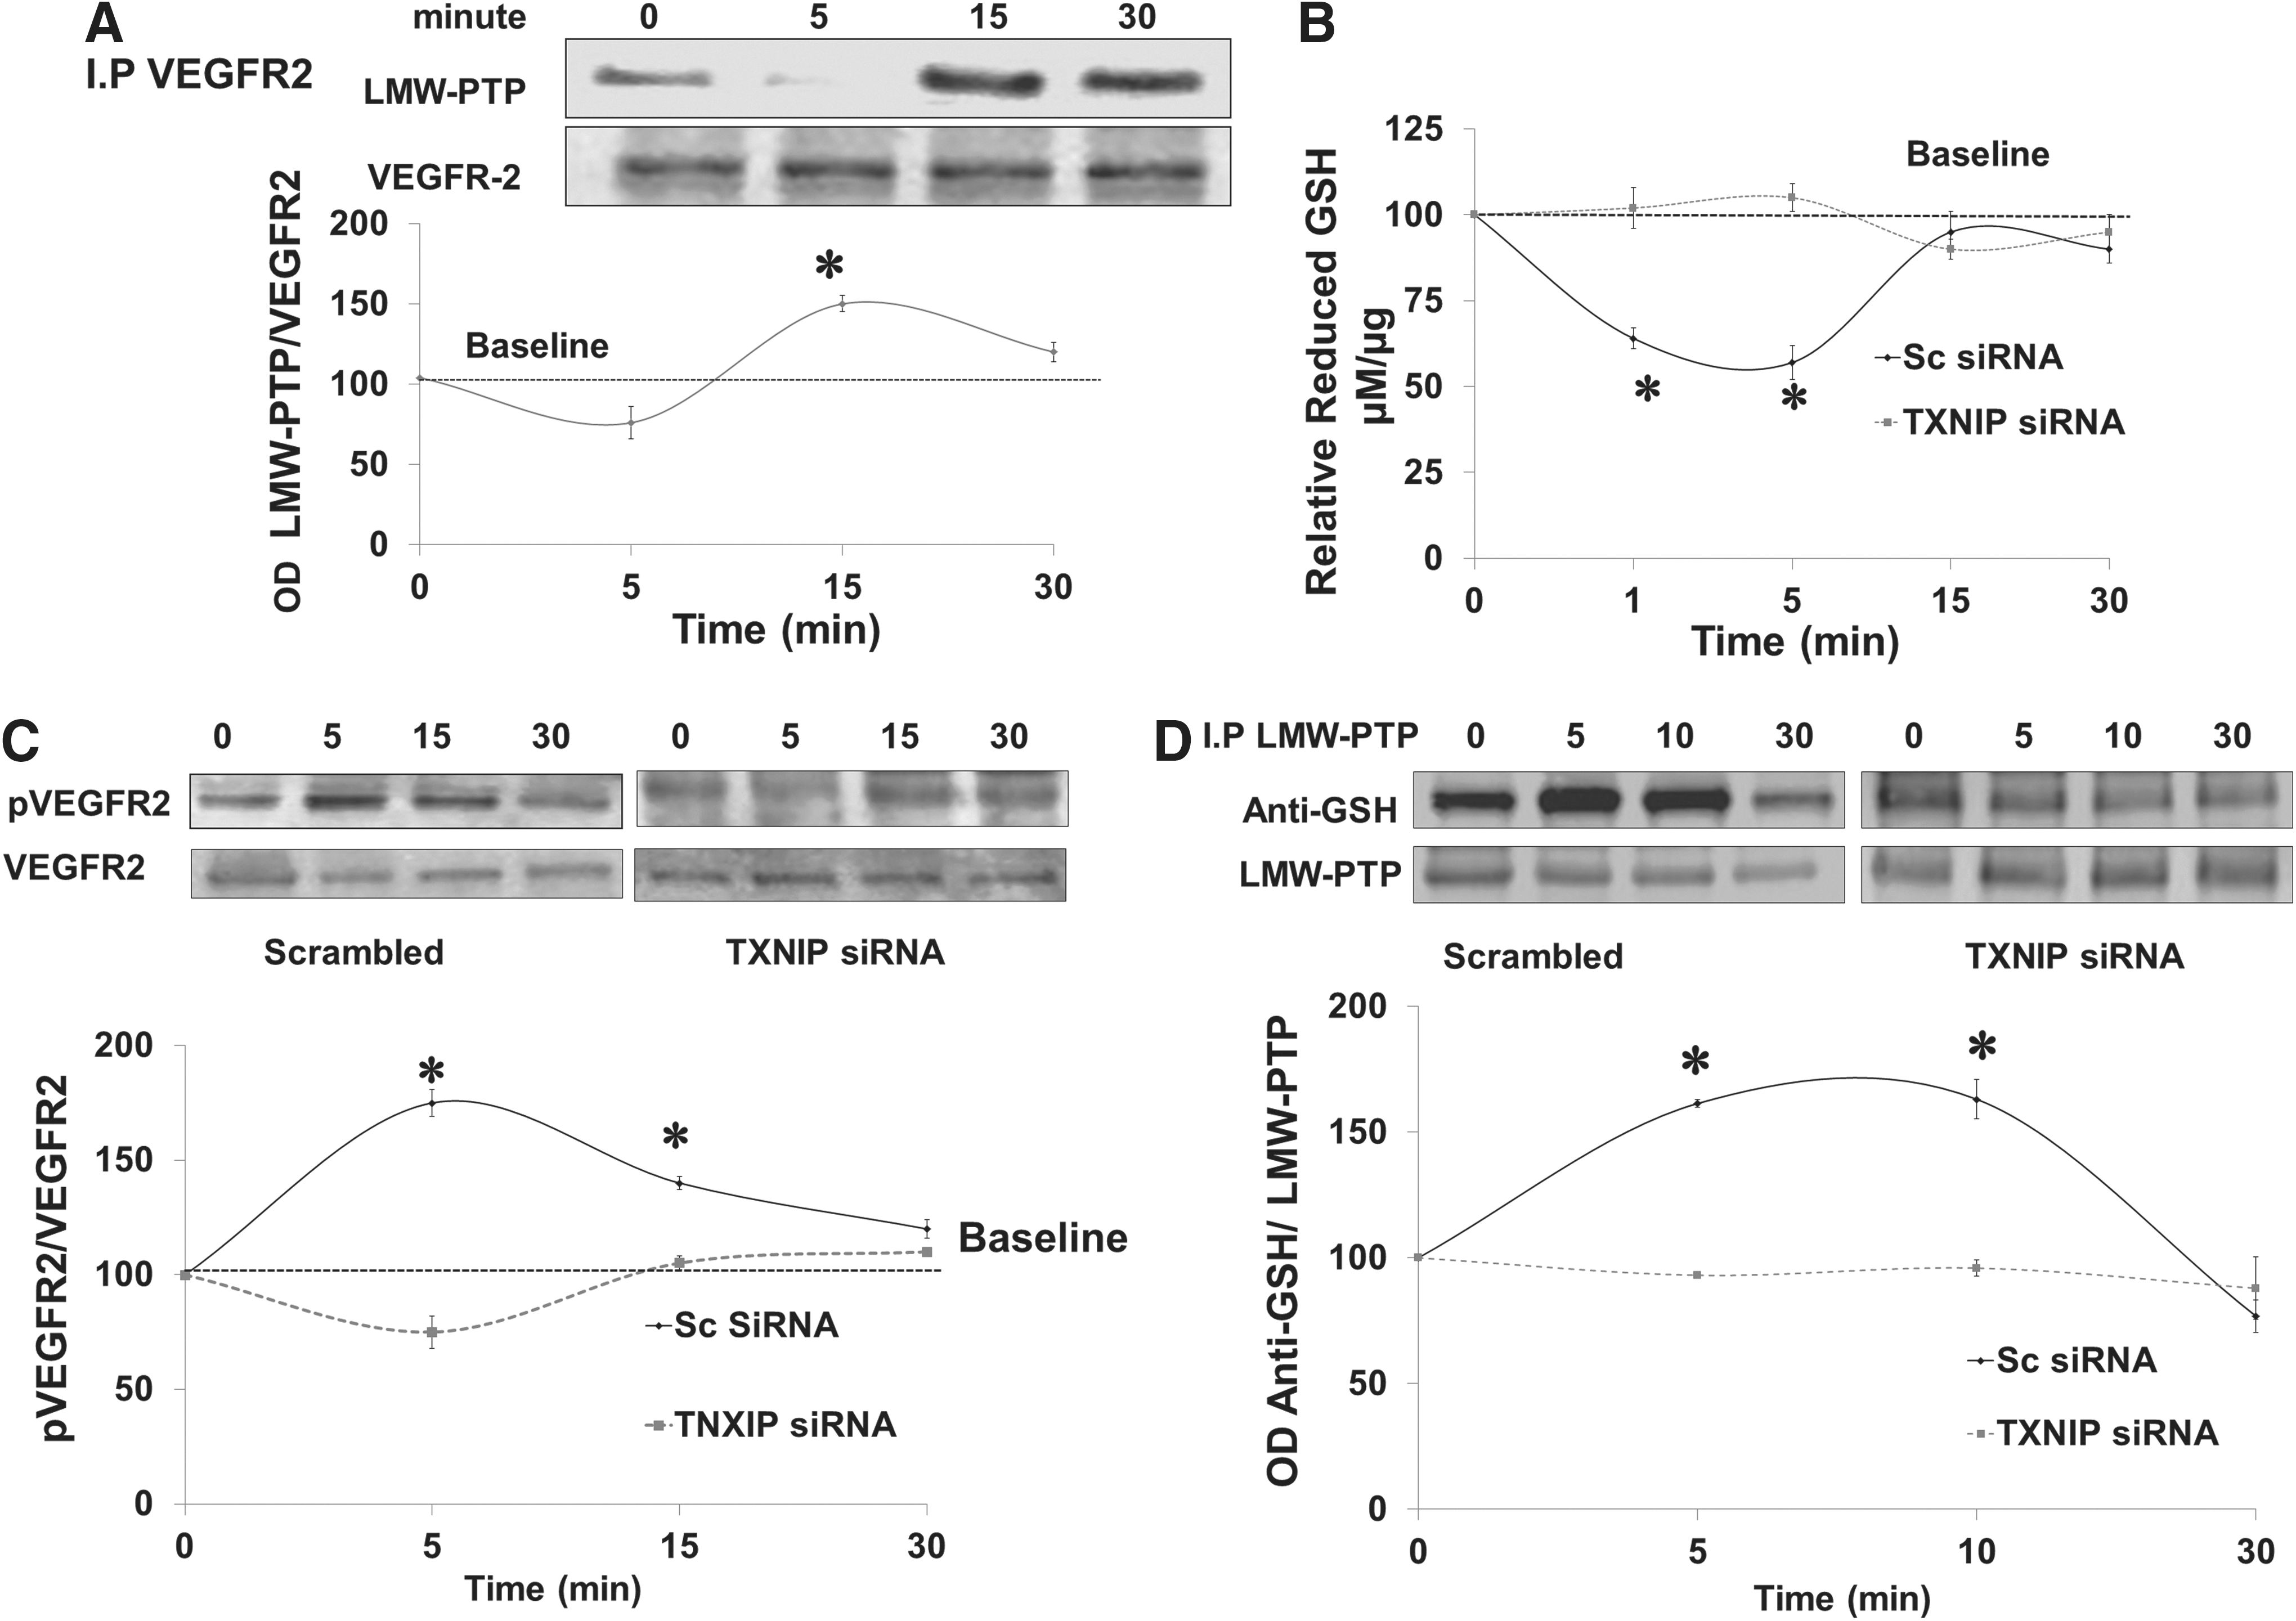
Silencing TXNIP expression blunts VEGF-mediated S-glutathionylation of LMW-PTP
We further investigated the molecular mechanism by which deficiency of TXNIP impairs VEGFR2 phosphorylation. TXNIP expression was successfully silenced in HME cells using siRNA as detailed in Supplementary Figure S4A. Silencing TXNIP expression caused a shift in cellular redox state toward more reductive milieu as indicated by 1.6-fold increase in GSH and 80% reduction of peroxynitrite formation assessed by nitrotyrosine formation in HME cells (Supplementary Fig. S4B, C). As shown in Figure 6B, VEGF caused a transient and significant decrease (∼40%) in reduced-GSH levels that was restored back to normal after 15 min in HME treated with scrambled siRNA. Silencing TXNIP with siRNA increased the cellular antioxidant buffer capacity so that it blunted the VEGF-mediated decreases in reduced-GSH levels. VEGF induced immediate receptor autophosphorylation as indicated by 1.8-fold increase in VEGFR2 activation in HME treated with scrambled siRNA but not in cells treated with TXNIP siRNA (Fig. 6C). S-glutathionylation is a reversible protective mechanism for cysteine modification in response to oxidative stress. We have recently shown that VEGF causes S-glutathionylation and inactivation of LMW-PTP that is reversible after 15–30 min (1). Indeed, VEGF caused S-glutathionylation of LMW-PTP that peaked at 5–10 min that went back to baseline by 30 min in HME treated with scrambled siRNA. Silencing TXNIP expression using siRNA blunted VEGF-mediated S-glutathionylation of LMW-PTP over 30 min of VEGF treatment (Fig. 6D).
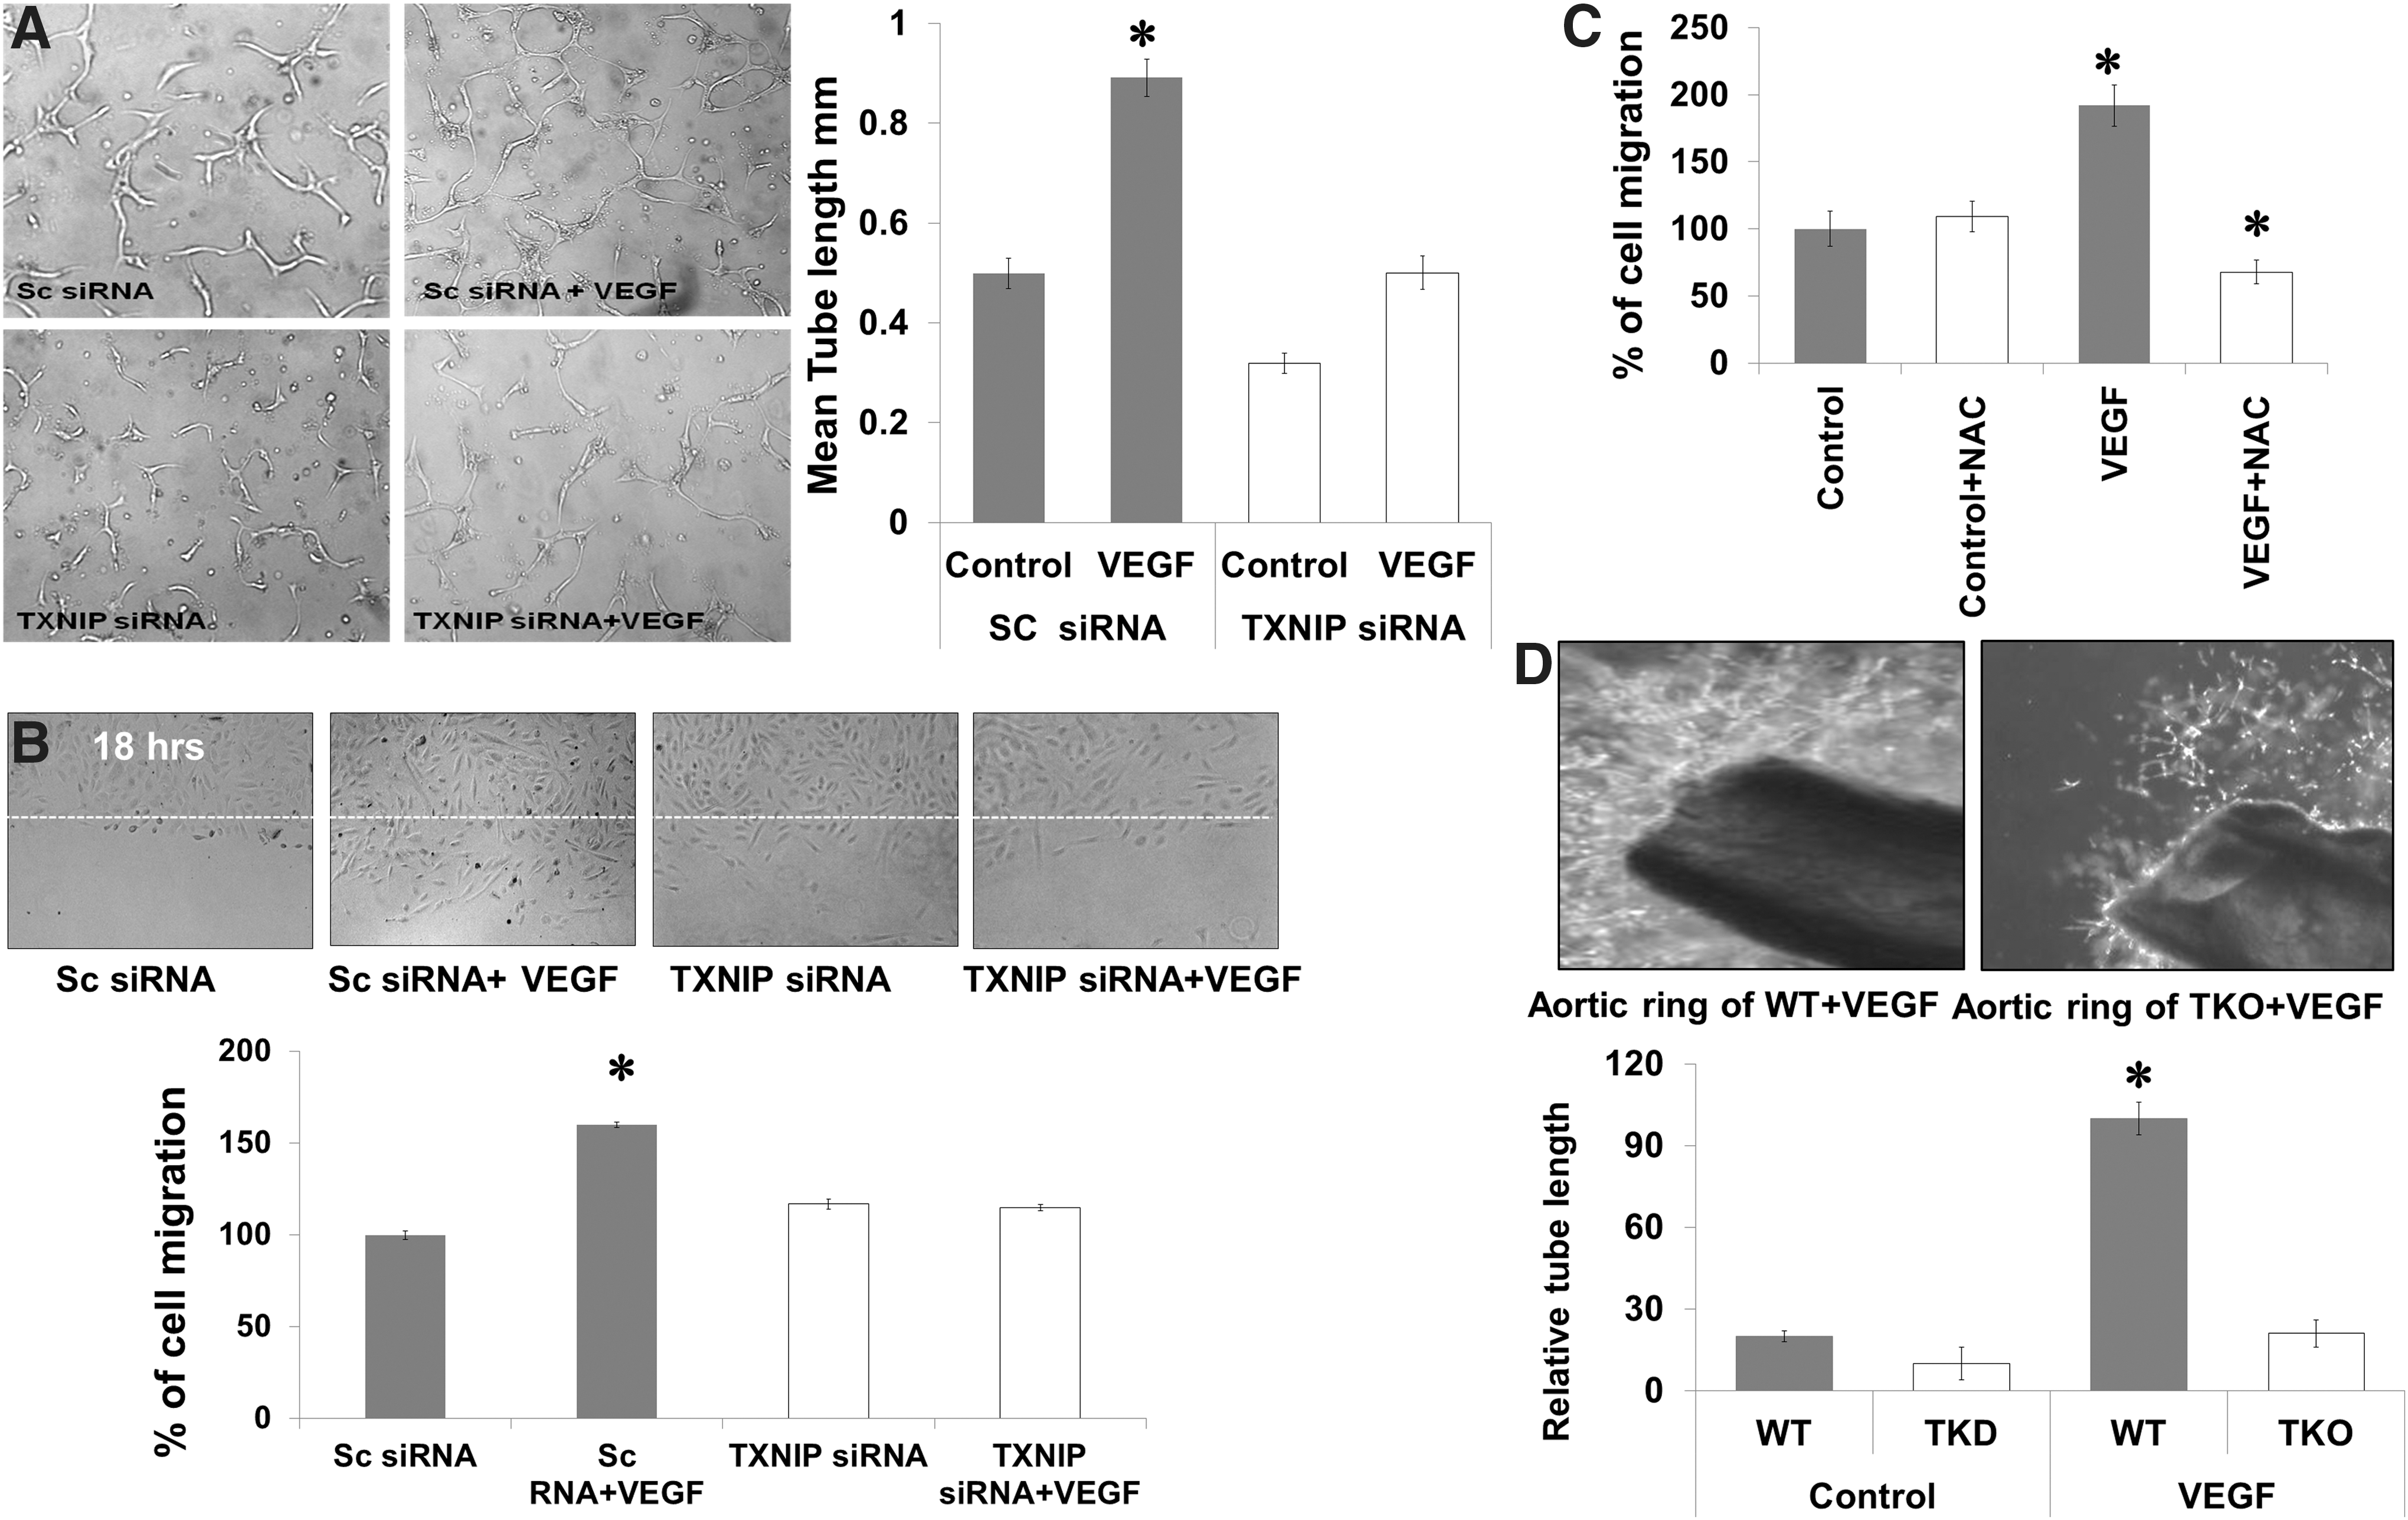
Silencing TXNIP expression inhibits VEGF angiogenic response
VEGF-angiogenic properties were examined after silencing TXNIP in different assay models such as tube formation, cell migration, and aortic ring assay. As shown in Figure 7A, VEGF caused a 1.9-fold increase in the mean length of tube formation in HME cells treated with scrambled siRNA, but not in TXNIP siRNA. In parallel, VEGF caused a 1.6-fold increase in cell migration of HME treated with scrambled siRNA. Silencing TXNIP with siRNA impaired VEGF-mediated endothelial cells migration and did not show any significant difference from control microvascular endothelial cells (Fig. 7B). Inducing acute reductive stress using a high dose of NAC (10 mM), a five times higher than traditional antioxidant dose (2 mM) blunted VEGF-induced cell migration (Fig. 7C). Moreover, ex vivo studies using aortic rings of adult TKO mice showed 80% reduction in sprouting angiogenesis as indicated by length of tubes formed in Matrigel in response to VEGF when compared to WT (Fig. 7D).
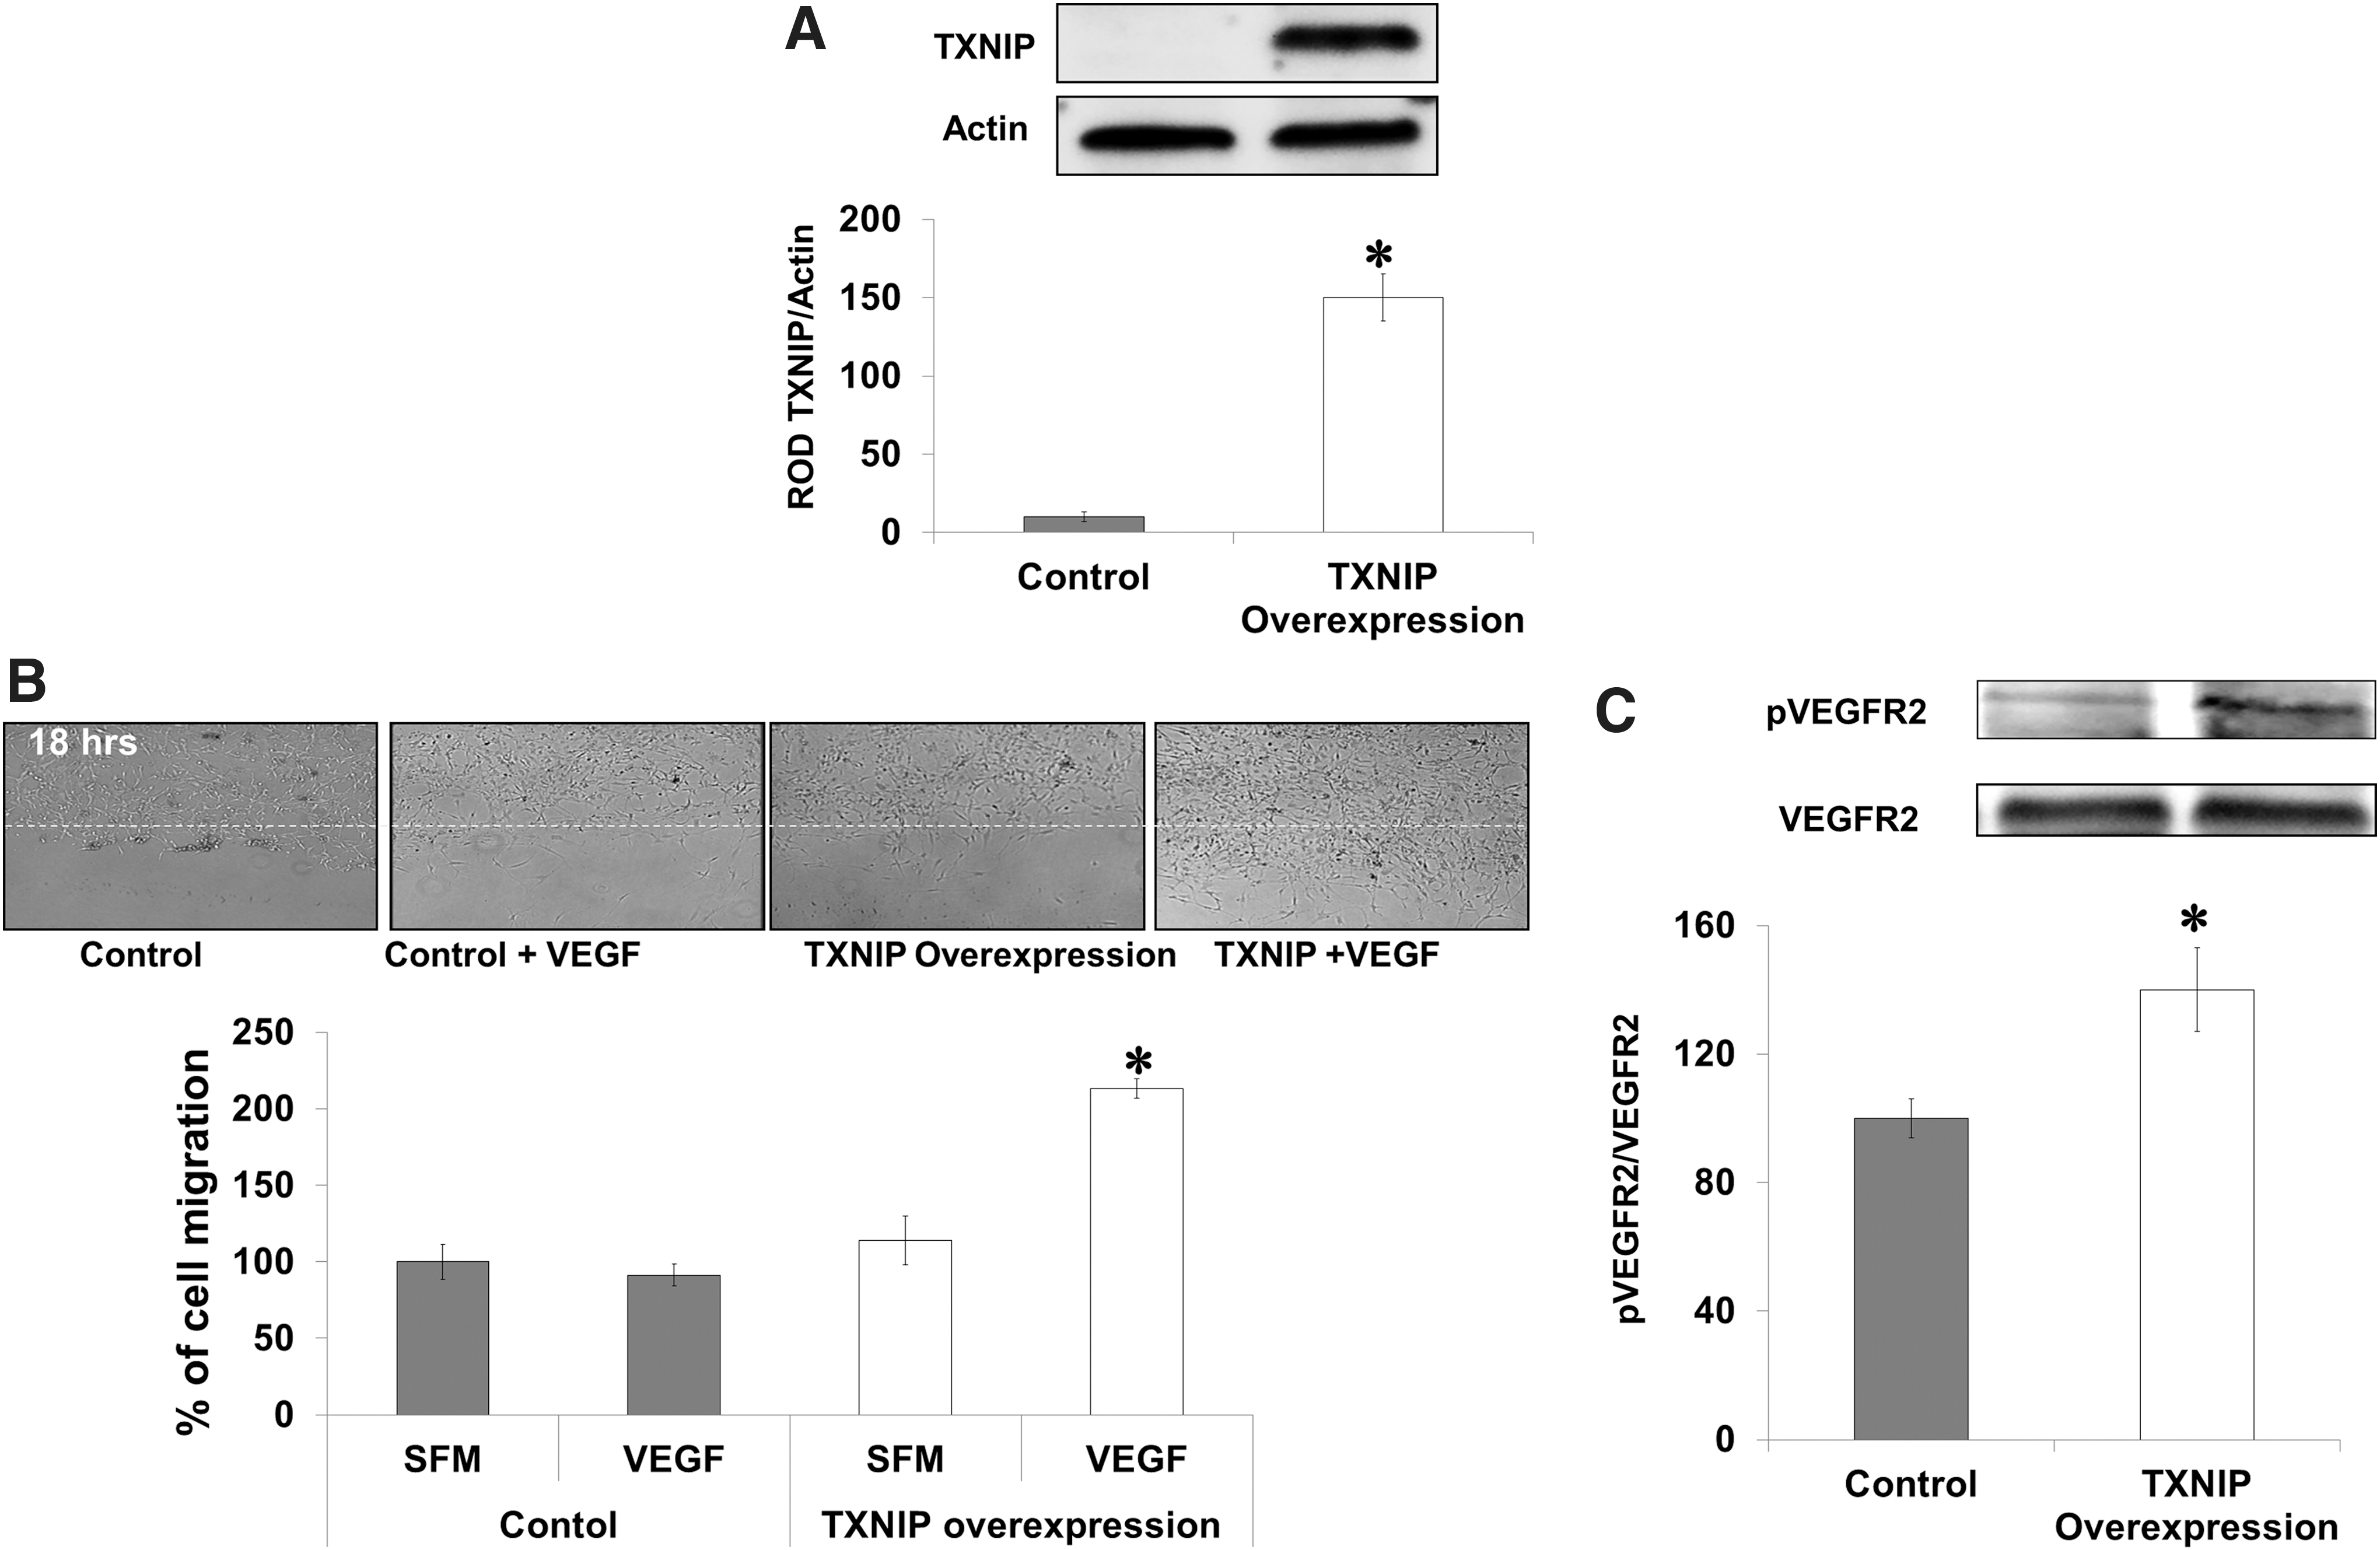
TXNIP overexpression in TKO-endothelial cells restores VEGF angiogenic function
To demonstrate gain of VEGF angiogenic function in TKO-endothelial cells, we isolated and characterized microvascular endothelial cells from brains of TKO mice (Supplementary Fig. S5A). TXNIP was overexpressed using plasmid transduction via electroporation in TKO-endothelial cells (Supplementary Fig. S5B). Western blot analysis showed 10-fold increase in protein TXNIP expression (Fig. 8A). Transduction of TXNIP in TKO-endothelial cells restored VEGF-mediated VEGFR2 phosphorylation (1.4-fold) compared to TKO-endothelial cells (Fig. 8B). These effects coincided with twofold increase in VEGF-mediated cell migration in TKO cells expressing TXNIP (Fig. 8C).
Discussion
Our study demonstrated for the first time a novel redox-dependent mechanism of TXNIP in modulating VEGF-mediated angiogenic response in vivo and in vitro. Our results showed that TXNIP expression is required to achieve homeostasis of redox state and facilitate VEGF's angiogenesis in endothelial cells. Induction of reductive stress genetically using TKO mice or pharmacologically using high dose of NAC can blunt VEGF-mediated angiogenesis but did not alter VEGF levels. Our results demonstrate a critical role of S-glutathionylation of LMW-PTP as a novel regulatory mechanism for VEGFR2 activation and VEGF angiogenic function. Modulating TXNIP expression is a viable therapeutic target in diseases characterized by aberrant angiogenesis.
TXNIP is identical to vitamin D3 upregulated protein-1 (VDUP-1) and also is called thioredoxin-binding protein-2 (TBP-2). TXNIP belongs to the α-arrestin family so it may serve as adaptor and scaffold protein with several interacting domains to activate various signaling pathways [reviewed in Masutani et al. (34)]. TXNIP has been established to regulate the cellular redox state by binding to and inhibiting TRX. Although increasing evidence that cellular redox homeostasis can be an important regulator of angiogenesis (18), the role of TXNIP in mediating VEGF angiogenic signal is not fully understood. The present study documents the first in vivo evidence for redox-dependent mechanisms of TXNIP in modulating VEGF angiogenic signal rather than VEGF expression. Retinas from p12 TKO mice showed vascular density similar to WT at resting condition (Supplementary Fig. S2). Our results clearly demonstrate impaired VEGF-mediated angiogenic response observed in retinas from TKO or WT+NAC in vivo (Figs. 1 and 3), aortic rings from TKO (Fig. 7D) was not due to decreases in VEGF levels (Fig. 4), rather it can be attributed to disturbed cellular redox-state homeostasis. The current study highlights the importance of antioxidant dose for modulating VEGF angiogenic response. Administration of high dose of NAC (500 mg/kg) induced reductive stress, blunted both reparative and pathological angiogenesis. In contrast, we demonstrated that a standard dose of NAC (150 mg/kg) exerted vascular protective actions and promoted reparative angiogenesis in hypoxia-induced neovascularization (3). Similar to previous reports, our analyses (Fig. 2) demonstrated that TKO mice had no TXNIP mRNA expression or protein expression (27) and marked increases in antioxidant defense (28, 44). TKO and WT+NAC also showed significant reduction in peroxynitrite formation assessed by nitrotyrosine formation compared with WT under basal normoxic and hypoxic condition (Supplementary Fig. S3).
Changes in the intracellular GSSG/GSH ratio not only reflect redox state but can also alter angiogenic response by regulating expression of VEGF and stabilization of the redox-sensitive transcription factor HIF-1α (33, 46, 50). Of note, previous reports showed that the ratio of cytoplasmic Trx1 to TXNIP expression can be an important factor in redox-mediated regulation of angiogenesis (6, 43). Our results showed that hypoxia triggered expression of retinal total TRX and the TRX-1 (Fig. 2C) equally in WT and TKO and stabilized retinal HIF-1α levels and VEGF expression in WT, TKO, and WT+NAC (Fig. 4). These results suggest that HIF-1α is upstream of TRX protein expression as TXNIP deletion did not alter expression of total TRX or TRX-1 expression or stabilization of HIF-1α compared to WT. Prior studies pointed out that inhibiting TXNIP expression could impair VEGF expression independent to TRX binding (13, 21, 42). Other studies showed that enhanced TRX can increase VEGF expression (17, 19, 31, 50), which can account for the observation of similar VEGF levels in TKO and WT animals. These findings clearly suggest that impaired VEGF angiogenic response in this model is likely due to its impaired signaling rather than levels of VEGF. We have previously shown that peroxynitrite is required to sustain VEGFR2 activation in endothelial cells (20). Silencing TXNIP expression resulted in blunting VEGF-mediated peroxynitrite formation and shifting redox state to reductive stress and impaired VEGFR2 activation in HME (Figs. 6 and 7). Activation of VEGFR2 and its downstream target Akt was also impaired in retinas from TKO or WT+NAC (Figs. 5 and 6). Moreover, expression of TXNIP plasmid in TKO-endothelial cells restored VEGFR2 activation and angiogenic response (Fig. 8). Our results lend further support to recent reports showing that peroxiredoxin2 (29) or TXNIP expression (40) are essential for VEGFR2 activation and angiogenic response. The latter study demonstrated another redox-independent mechanism by which TXNIP is required for VEGFR2 internalization and activation. These results highlight the crucial and multiple roles by which TXNIP modulates VEGFR2 activation in endothelial cells. Future studies are warranted to explore similar roles in other tyrosine kinase receptors.
Negative regulation of VEGFR2 signaling by phosphatases is equally important for controlling angiogenic response. Several phosphatases have been identified to associate with and regulate VEGFR2 at different steps of angiogenesis including vascular endothelial PTP (35); SHP-1 (10); SHP2 (37); and LMW-PTP (26). The activity of LMW-PTP is tightly linked to redox changes and can be a molecular switch for regulation of the cell migration and the angiogenic process (14, 25). Our recent work showed that LMW-PTP activity is regulated by transient oxidation and S-glutathionylation resulting in its inactivation in response to VEGF (1). Previous studies showed a positive association between LMW-PTP and VEGFR2 (26, 39, 51). Herein, we confirmed the association between LMW-PTP and VEGFR2 in HME cells at 15 min, a time point where LMW-PTP activity is restored after a transient inactivation (1). Our results showed that knocking down TXNIP expression blunted VEGF-induced S-glutathionylation of LMW-PTP resulting in its hyperactivation and inhibition of VEGFR2. In support, LMW-PTP activity has been shown to be regulated by the glutathione reducing system and cellular redox state (9, 53). Although, recent report by Park et al. (2013) excluded the involvement of PTP1B or SHP1 in TXNIP-mediated regulation of VEGFR2 activation (40), future work is warranted to examine whether S-glutathionylation can play a role in modulating other phosphatases similar to LMW-PTP. In summary, the study provides mechanistic insight into modulating TXNIP expression as a potential therapeutic target in diseases characterized by aberrant angiogenesis. Our findings support a redox-dependent pathway by which TXNIP can modulate VEGFR2 angiogenic signal. We also identified blunting of the VEGF-induced S-glutathionylation of LMW-PTP as a molecular switch for angiogenesis.
Materials and Methods
Animals
Experiments were approved by the Institutional Committee for Animal Use in Research and Education at Charlie Norwood VA medical Center (ACORP # 04-12-043) and conformed to the ARVO Statement for the Use of Animals in Ophthalmic and Vision Research. All experiments were performed using age-matched WT mice C57Bl/6 mice (Jackson Laboratory, Bar Harbor, Maine) and TXNIP-knockout mice (TKO) that was provided as a kind gift from Dr. AJ Lusis and Dr. ST Hui at the BioSciences Center, San Diego State University (San Diego, CA). TKO mice have a global knockdown of the expression of functional TXNIP as characterized previously (27). TKO mice are similar in weight and activity to WT or heterozygous littermates, with no differences in food consumption or litter sizes.
TKO breeding and genotyping
Littermates of WT and homozygous TKO were used and genotyping was performed as described previously (27). Briefly, DNA was prepared by incubating ear tissue with proteinase K and digestion buffer for 1 h at 95°C. A mixture of primer sequence (5′-TGA-GGT-GGT-CTT-CAA-CGA-CC-3′. 5′-GGA-AAG-ACA-ACG-CCA-GAA-GG-3′ and 5′-CCT-TGA-GGA-AGC-TCG-AAG-CC-3′ [Integrated DNA Technnologies, Inc., San Diego, CA]), buffer and 2 mM MgCl2, and polymerase enzyme (GoTAG Hot start polymerase; Promega) were added to the DNA template. DNA segments were amplified using the Master plex-RealPlex2 (Eppendorf, Germany) and were detected with 1% agarose gel electrophoresis. Deleted TXNIP allele was detected at 530 bp while WT was detected at 699 bp.
Hypoxia-induced neovascularization
Hypoxia-induced neovascularization was induced in newborn mice as described previously (3, 16) and depicted in Supplementary Figure S1. On postnatal day 7 (p7), mice were placed along with their dam into a custom-built chamber (Biospherix, Redfield, NY) in which the partial pressure of oxygen was maintained at 70% for 5 days followed by 5 days in room air (relative hypoxia, 21%). One set of WT mice was treated during hypoxia (p12–p17) with the GSH precursor, NAC (500 mg/kg/day IP, from [p12–p17]; Sigma Chemical Co.). Pups were deeply anesthetized by IP injection of Avertin 240 mg/kg. One eye was enucleated and fixed in 2% paraformaldehyde overnight to be flat-mounted for vascular density. For the other eye, retinas were isolated and snap frozen for biochemical assays.
Analysis of physiological revascularization and pathological neovascularization
Retinal vascular density was analyzed using flat-mounted retinas labeled with biotinylated Griffonia simplicifolia lectin B4 and Texas Red–conjugated Avidin D (Vector Laboratories). Retinas were viewed and imaged with fluorescence AxioObserver Zeiss Microscope. The areas of retinal neovascularization were assessed on p17 as described previously (3). Results were expressed as percentage of the total retinal area. For comparing normal retinal vasculature at p12, flat-mounted retinas were imaged as shown in Supplementary Figure S2 and processed via FIJI software.
Cell culture
Primary cultures of HME cells from retina and supplies were purchased from Cell Systems Corporation. Experiments were performed using cells between passages (3 –6). Cells were switched to serum-free medium 6 h prior to stimulation with VEGF 20 ng/ml (R&D).
Isolation of primary endothelial cells from TKO mice
Due to small tissue limitation of the retina, we elected to isolate microvascular endothelial cells from the brain. Isolation of endothelial cells was performed according to protocol by Wu et al. (52) with small modification. For each isolation six to ten mouse brains (at 0.3–0.5 g/mouse brain) were aseptically collected and rinsed in MCDB131 medium (Gibco BRL) supplemented with 2% fetal bovine serum (FBS; Gibco), 100 U/ml penicillin, and 100 μg/ml streptomycin (Sigma Chemical Co.). Cerebral cortices devoid of cerebella, white matter, and leptomeninges were prepared by aseptic macroscopic dissection. The cortices were cut into small pieces. The brain pieces were digested in 15 ml 0.1% of collagenase/dispase (Boehringer Mannheim) supplemented with 2% FBS for 6 h at 37°C with occasional agitation. The digested microvessels were collected with centrifugation at 1000 g for 5 min. The pellet were suspended in 5 ml PBS and centrifuged at 20,000 g for 10 min at 4°C. The microvessels and individual endothelial cells located in the top layer were transferred to a new 14 ml tube and washed once with PBS. Twenty microliters of CD31 rat anti-mouse (BD Pharmingen, San Jose, CA) were added with gentle shaking for 3 h at 37°C. The microvessel pellets were centrifuged at 20,000 g for 10 min at 4°C and washed once. Fifty microliters of Dynabeads (sheep anti-rat I gG) (Invitrogen) were added to the microvessel and shaken for 35 min at room temperature. The beads were isolated using magnet, washed thrice with PBS, and then resuspended in 10 ml MCDB 131 complete medium supplemented with 30 μg/ml ECGS (Sigma Chemical Co.), 10% FBS, 15 U/ml heparin, 325 μg/ml glutathione, 1 μl/ml 2-mecaptoethanol, 100 U/ml penicillin, and 100 μg/ml streptomycin (all were obtained from Sigma Chemical Co.). The microvessel suspension was platted on rat tail collagen I (Roche Diagnostics) coated plastic ware and incubated at 37°C with 5% CO2 in air. The medium was changed after every 2 days. Final recovering is ∼1×10⁶ P0 cells per gram of mouse brain tissue. Isolated cells were stained with the endothelial specific marker Isolectin-B4 as previously described for flat-mounted retinas (Supplementary Fig. S5A).
Silencing TXNIP expression
Transfection of HME cells was performed using Amaxa nucleofector and a kit for primary endothelial cells according to the manufacturer's protocol (Lonza). Optimization experiments that were performed showed that T005 program and 300 ng of TXNIP siRNA (Dharmacon) gave the maximum transfection efficacy for HME cells. Cells suspended in a nucleofection mixture with the siRNA and pmaxGFP were zapped and left in complete medium for 48 h to recover before experiments. Transfection efficiency was between 80%–90% as indicated by the number of GFP-expressing cells (data not shown) and western blots for TXNIP expression shown in Supplementary Figure S4A.
TXNIP overexpression
Overexpression of TXNIP in HME cells isolated from TKO mice was performed using Amaxa nucleofector and a kit for primary endothelial cells according to the manufacturer's protocol (Lonza). Optimization experiments that were performed showed that T005 program and 300 ng of TXNIP plasmid (Dharmacon) gave the maximum transfection efficacy for HME cells. Cells suspended in a nucleofection mixture with the plasmid and pmaxGFP were zapped and left in complete medium for 48 h to recover before experiments. Transfection efficiency was 85%–90% as indicated by the number of GFP-expressing cells (Supplementary Fig. S5B) and western blots for TXNIP expression (Fig. 8A).
Cell migration assay
Wound healing assay was performed as described before (20). Briefly, HME cells were grown to confluence and switched to serum-free medium 6 h prior to experiment. The monolayer was wounded with a single sterile cell scraper of fixed diameter. Images of wounded areas were taken immediately and after 18 h. Cell migration was calculated by measuring migration distance normalized to initial distance of wounding using AxioObserver Zeiss Microscope software and expressed as the percentage of untreated control cells.
Tube formation assay
Tube formation assay was performed using growth factor-reduced Matrigel (BD Biosciences) as described previously (32). HME were counted and plated at 2×10⁴ cells/ml with Matrigel in a 96 well-plate. Eighteen hours later, images of the tube-like structures were captured and analyzed using Zeiss Axiovert microscope software.
Aortic ring assay
Eight-week-old adult males of WT and TKO mice were euthanized and the aortas were removed and immediately transferred to iced serum-free media. The periaortic fibroadipose tissue was carefully removed without damaging the aortic wall. The aorta was cut into one millimeter-long aortic segments. The aortic rings were then individually embedded in growth factor-reduced Matrigel for 10 days. Images of vascular sprouts were captured and analyzed using a Zeiss Axiovert microscope. The greatest distance from the aortic ring body to the end of the vascular sprouts was measured in three rings per animal, and each group contained three to four animals.
Oxidized and reduced glutathione
GSH was measured using the Northwest Life Science kit as described before (3). Briefly, reduced-GSH was calculated by subtracting the oxidized-GSSG from the total glutathione. For total glutathione, cells were lysed in phosphate buffer (100 mM potassium phosphate and 1 mM EDTA) and were mixed with an equal amount of DTNB (10 mM 5, 5′-dithiobis 2-nitrobenzoic acid (DTNB) in the presence of glutathione reductase and NADPH producing a yellow color measured at 412 nm. To detect GSSG, samples were treated with 10 mM 2-vinylpyridine (Sigma Chemical Co.) in ethanol to sequester all the reduced GSH then measured using the same protocol as the total glutathione.
TRX reductase activity
TRX reductase activity was performed using a colorimetric kit (Sigma Chemical Co.) as described previously (7). Briefly, retinal samples were homogenized in assay buffer followed by the addition of DTNB with NADPH. Reduction of DTNB produced a strong yellow color that was measured colorimetrically at 412 nm. TRX reductase activity was measured by the difference between DTNB measurement of sample and sample plus selective TRX reductase inhibitor and expressed as unit/μg/min. As the TRX reductase activity increases, the availability of free TRX increases. TXNIP is the endogenous inhibitor of the TRX and can affect the cellular redox state that will be reflected in TRX reductase activity.
Quantitative real-time PCR
The One-Step qRT-PCR kit (Invitrogen) was used to amplify 10 ng retinal mRNA and quantification was performed as described previously (7). PCR primers were designed to amplify TXNIP, TRX-1, and VEGF and were purchased from Integrated DNA Technnologies, Inc. TXNIP primers: forward 5′AAGCTGTCCTCAGTCAGAGGCAAT3′ and reverse primer 5′ATGACTTTCTTGGAGCCAGGGACA3′. Total TRX primers 5′GCCAAAATGGTGAAGCTGAT3′ and reverse primer 5′TGATCATTTTGCAAGGTCCA3′. VEGF primers were: forward 5′TGAGCCTTGTTCAGAGCGGAGAAA3′ and 5′TTCGTTTAACTCAAGCTGCCTCGC3′. TRX-1 primers were forward: 5′ATGGTGAAGCTGATCGAGAG3′ and reverse: 5′ TTAGGCATATTCAGTAATAGAGGCTTC3′. Amplification of 18S RNA (forward 5′CGCGGTTCTATTTTGTTGGT3′ and reverse 5′AGTCGGCATCGTTTATGGTC3′) was used as an internal control. Quantitative PCR was performed using a Realplex Master cycler. Expression of TXNIP, total TRX, VEGF, or TRX-1 was normalized to the 18S level and expressed as relative expression to control.
Immunoprecipitation and western blot analysis
Protein expression in isolated retinas or HME cells were analyzed as described previously (7). For VEGF, retinal lysates were subjected to heparin beads (Sigma Chemical Co.) as described before (23). The beads were pelleted at 5000 g for 1 min, washed in 400 mM NaCl and 20 mM Tris and loaded onto a 4%–20% gradient Trisglycine precast gel (BioRad). The primary antibodies were purchased as follows: VEGF (Rabbit polyclonal; Calbiocam), phospho-Akt (Rabbit polyclonal; Cell Signaling), or Akt (Rabbit polyclonal; Cell Signaling), LMW-PTP (Sheep; Exalpha), anti-GSH (Mouse monoclonal; Virogen), total TRX (Mouse monoclonal; Santa Cruz), and TXNIP (Rabbit polyclonal; Life Technology, Invitrogen). Primary antibodies were detected using a horseradish peroxidase-conjugated antibody and enhanced chemiluminescence (GE Healthcare).The films were scanned, and band intensity was quantified using densitometry software (Alpha Innotech). For S-glutathionylation immunoprecipitation, cell lysate (200 μg) was immunoprecipitated with LMW-PTP primary antibody (5 μg) and A/G agarose beads (Santa Cruz) overnight. The precipitated proteins were analyzed by SDS-PAGE and blotted with Anti-GSH and anti-LMW-PTP for loading.
Data analysis
All the results were expressed as mean±SE and the data were evaluated for normality and appropriate transformations were used when necessary. Figures 1, 3, 6, 8B, and Supplementary Figures S3 and S4 were evaluated by analysis of variance, and the significance of difference between groups was assessed by the post hoc test (Fisher's PLSD) and significance was defined as p<0.05. A two-way ANOVA was used to examine the effect of manipulation (WT vs. TKO or WT+NAC) and oxygen levels (Normoxia vs. Hypoxia) and their interaction on mRNA and expression of TXNIP, TRX-1; expression of HIF-1α, VEGF; nitrotyrosine levels; activation of Akt; GSH levels and TRXR activity. A two-way ANOVA was used to study the effect of manipulation (WT vs. TKO) and treatment (control vs. VEGF) and their interaction on tube formation, cell migration, and aortic ring assay. A Tukey's test was used to adjust for the multiple comparisons used to assess significant effects. NCSS 2007 was used for all analyses (NCSS, version 07.1.14 LLC; Kaysville). Statistical significance was determined at alpha=0.05.
Footnotes
Acknowledgments
Authors are grateful to Dr. A.J. Lusis for providing TKO mice. Source of research support: American Heart Association predoctoral fellowship award#10PRE3660004 to M.A.A., AHA Scientist Development Grant to A.B.E., and Career Development Award from Juvenile Diabetes Research Foundation (2-2008-149) to A.B.E. and R01-EY022408 to A.B.E.
Author Disclosure Statement
We do not have any commercial associations that might create a conflict of interest in connection with this article.
Abbreviations Used
References
Supplementary Material
Please find the following supplemental material available below.
For Open Access articles published under a Creative Commons License, all supplemental material carries the same license as the article it is associated with.
For non-Open Access articles published, all supplemental material carries a non-exclusive license, and permission requests for re-use of supplemental material or any part of supplemental material shall be sent directly to the copyright owner as specified in the copyright notice associated with the article.