
Abstract
Introduction
Innovation
Peroxisomes are redox organelles, and their involvement in the pathogenesis of endotoxic stress is scarcely investigated at present. We demonstrated that autophagic degradation of peroxisomes, pexophagy, is a default response to endotoxic injury. However, when LPS-activated lysosomal dysfunction (a frequent companion of chronic diseases) is superimposed, peroxisomal recycling is impaired, leaving functionally compromised organelles with imbalance between the preserved hydrogen peroxide-generating beta-oxidation and defective antioxidative catalase system. This intraperoxisomal redox imbalance with ensuing peroxisomal burnout contributes to increased oxidative stress and aggravated kidney damage.
Autophagy is a lysosome-dependent pathway maintaining the quality of cellular constituents through continual recycling of damaged proteins or even entire organelles (32). Induction of autophagy may help to preserve homeostasis during stress. It has been argued that enhanced clearance of damaged mitochondria (mitophagy) is responsible for the improved cell viability (39). Considering the tight link between mitochondrial and peroxisomal maintenance of metabolic and redox homeostasis, an additional explanation can be offered, namely that autophagic degradation of peroxisomes (pexophagy) also contributes to cell survival. The role of pexophagy in LPS-induced renal injury has not been examined yet, with very few studies examining peroxisomes in organ damage.
In the present study, we examined the regulation of peroxisomes in LPS-induced AKI. Specifically, we studied if the endotoxic stress (a) affects peroxisomal activity and pexophagy, (b) damages peroxisomes, (c) how a pre-existing peroxisomal dysfunction in impaired LYS autophagy affects responses to stress, and (d) the mechanisms of peroxisomal involvement in kidney injury. To accomplish this, we studied the impact of lysosomal (LYS) dysfunction and subverted autophagy on peroxisomes in vivo using a mouse model with impaired lysosomes and ex vivo in cells with pharmacologically induced LYS dysfunction.
Results
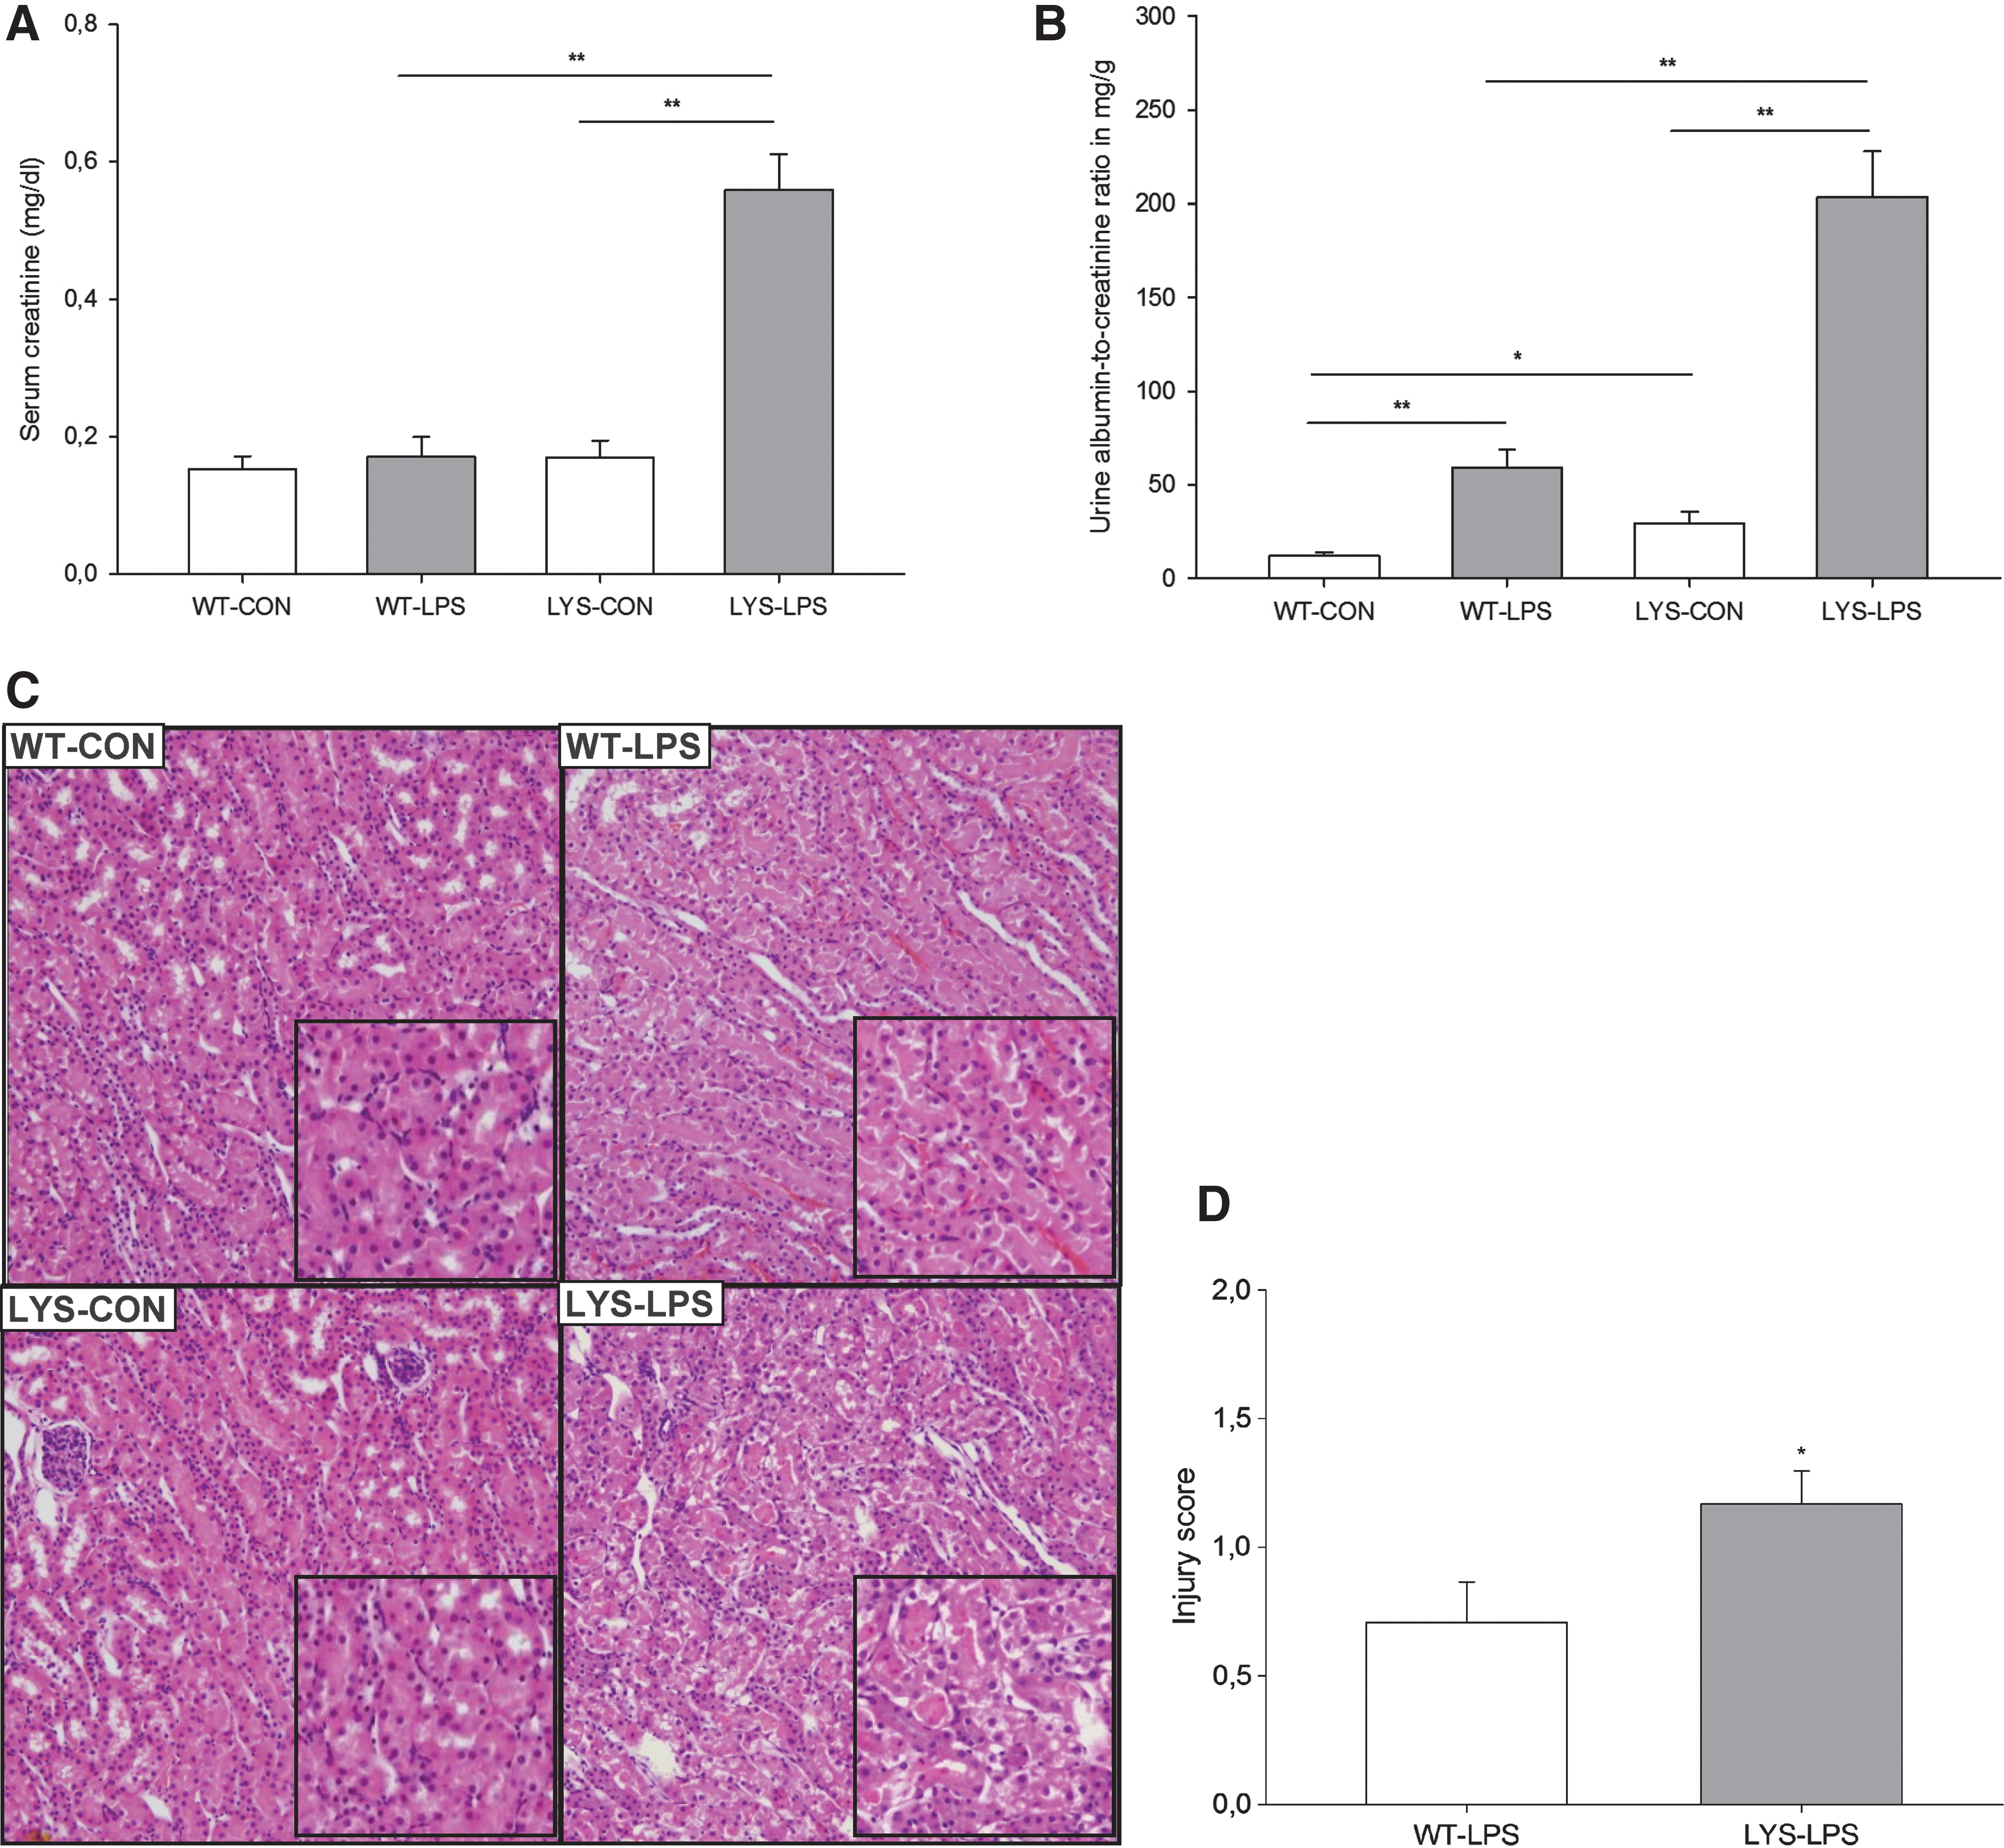
Treatment with LPS results in increased serum levels of inflammatory cytokines, higher albuminuria, and aggravated renal injury in C57BL/6J-Lystbg-J mice with impaired LYS function
To investigate the role of LYS dysfunction in AKI, we compared WT mice with C57BL/6J-Lystbg-J (Lyst-mice) counterparts characterized by defective LYS function. Under physiological conditions, there were no differences in serum creatinine, though mild albuminuria was noted in Lyst-mice (Fig. 1B, WT vs. Lyst-mice, albumin–creatinine ratio [ACR], 12.1±1.9 vs. 28.6±5.2 mg/g). A single injection of a nonlethal dose of LPS resulted in increased serum creatinine levels and almost fourfold higher albuminuria in Lyst-mice compared with WT mice after 24 h (Fig. 1A, 0.56±0.14 vs. 0.17±0.08 mg/dl; Fig. 1B, ACR 203.4±24.4 vs. 59.3±9.4 mg/g). Multiplex analysis of serum cytokines revealed increased granulocyte colony-stimulating factor/granulocyte monocyte colony-stimulating factor under basal conditions, and higher inflammatory status 24 h after LPS treatment in Lyst-mice (Fig. 2, Supplementary Fig. 3; Supplementary Data are available online at
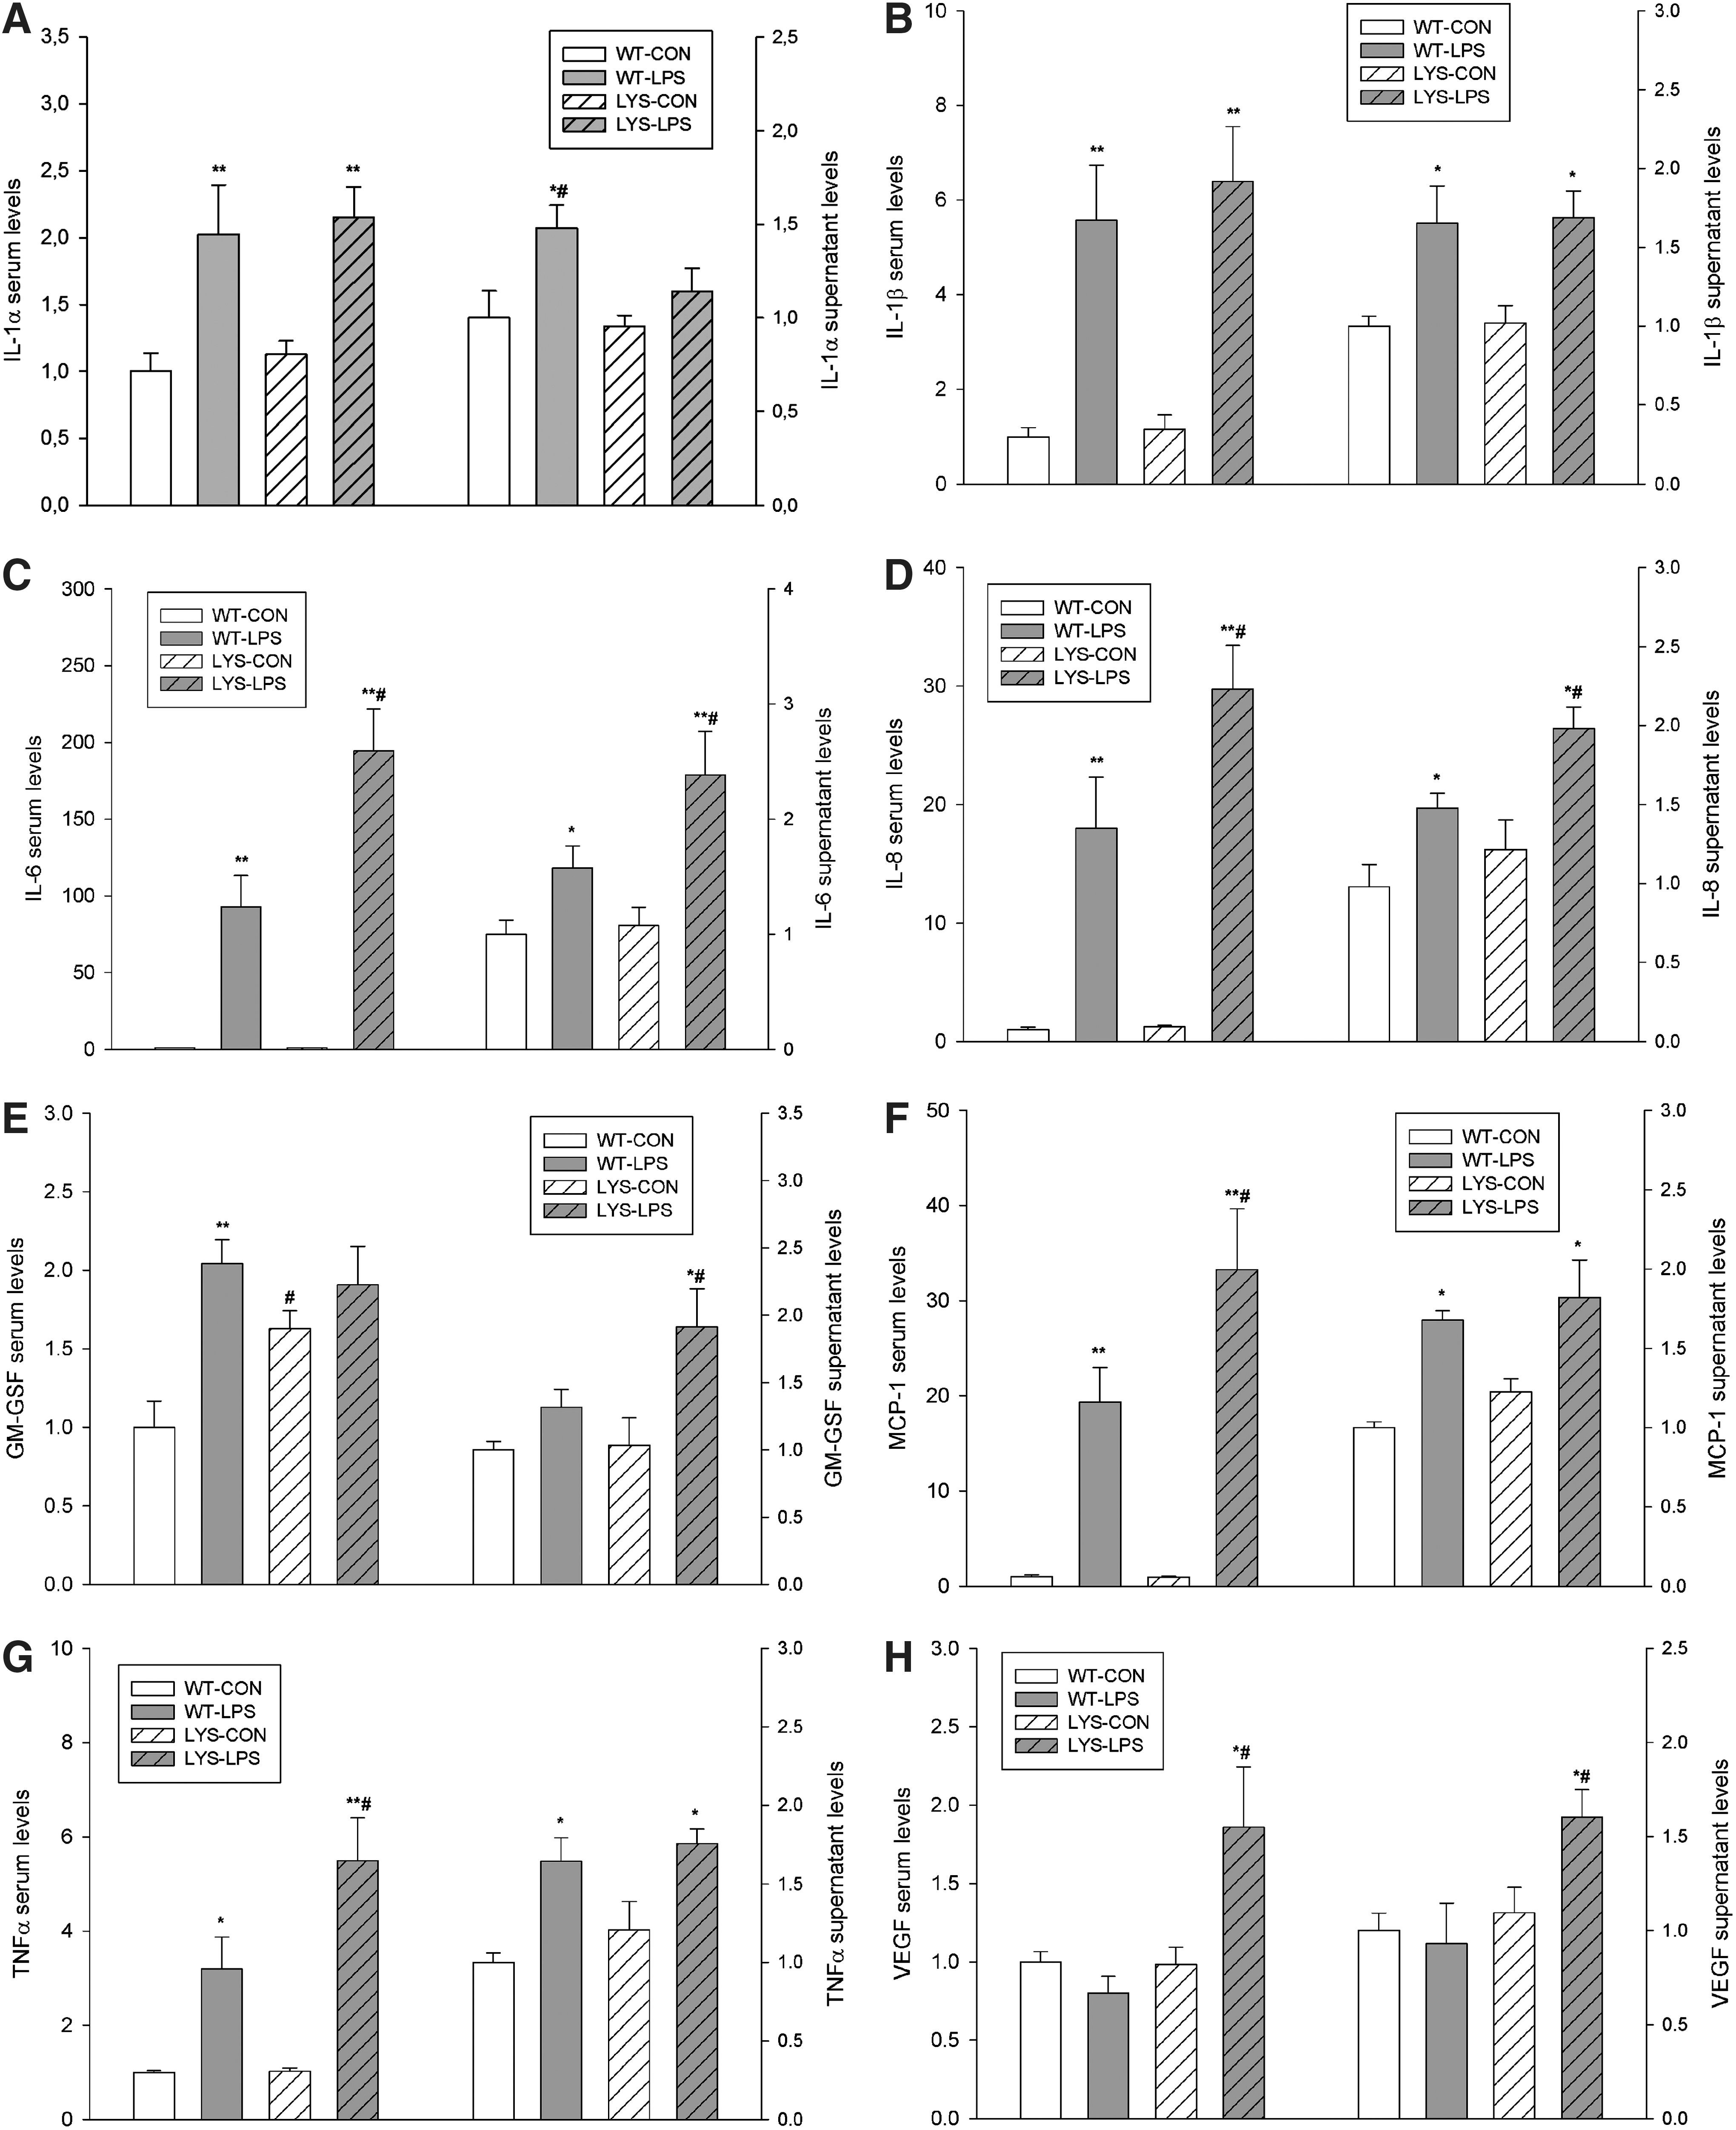
Therefore, we isolated endothelial cells from Lyst- and WT mice (vide infra) and analyzed their secretomes. Cytokine profiling of secretomes from endothelial cells obtained from the sacrificed animals revealed similar patterns as seen in vivo, which is consistent with the proposed preeminent role of the endothelium in LPS-induced cytokine storm (Fig. 2, Supplementary Fig. 3,4).
LPS stimulates proliferation of kidney peroxisomes in WT mice, and showed a blunted response in C57BL/6J-Lystbg-J mice with LYS dysfunction
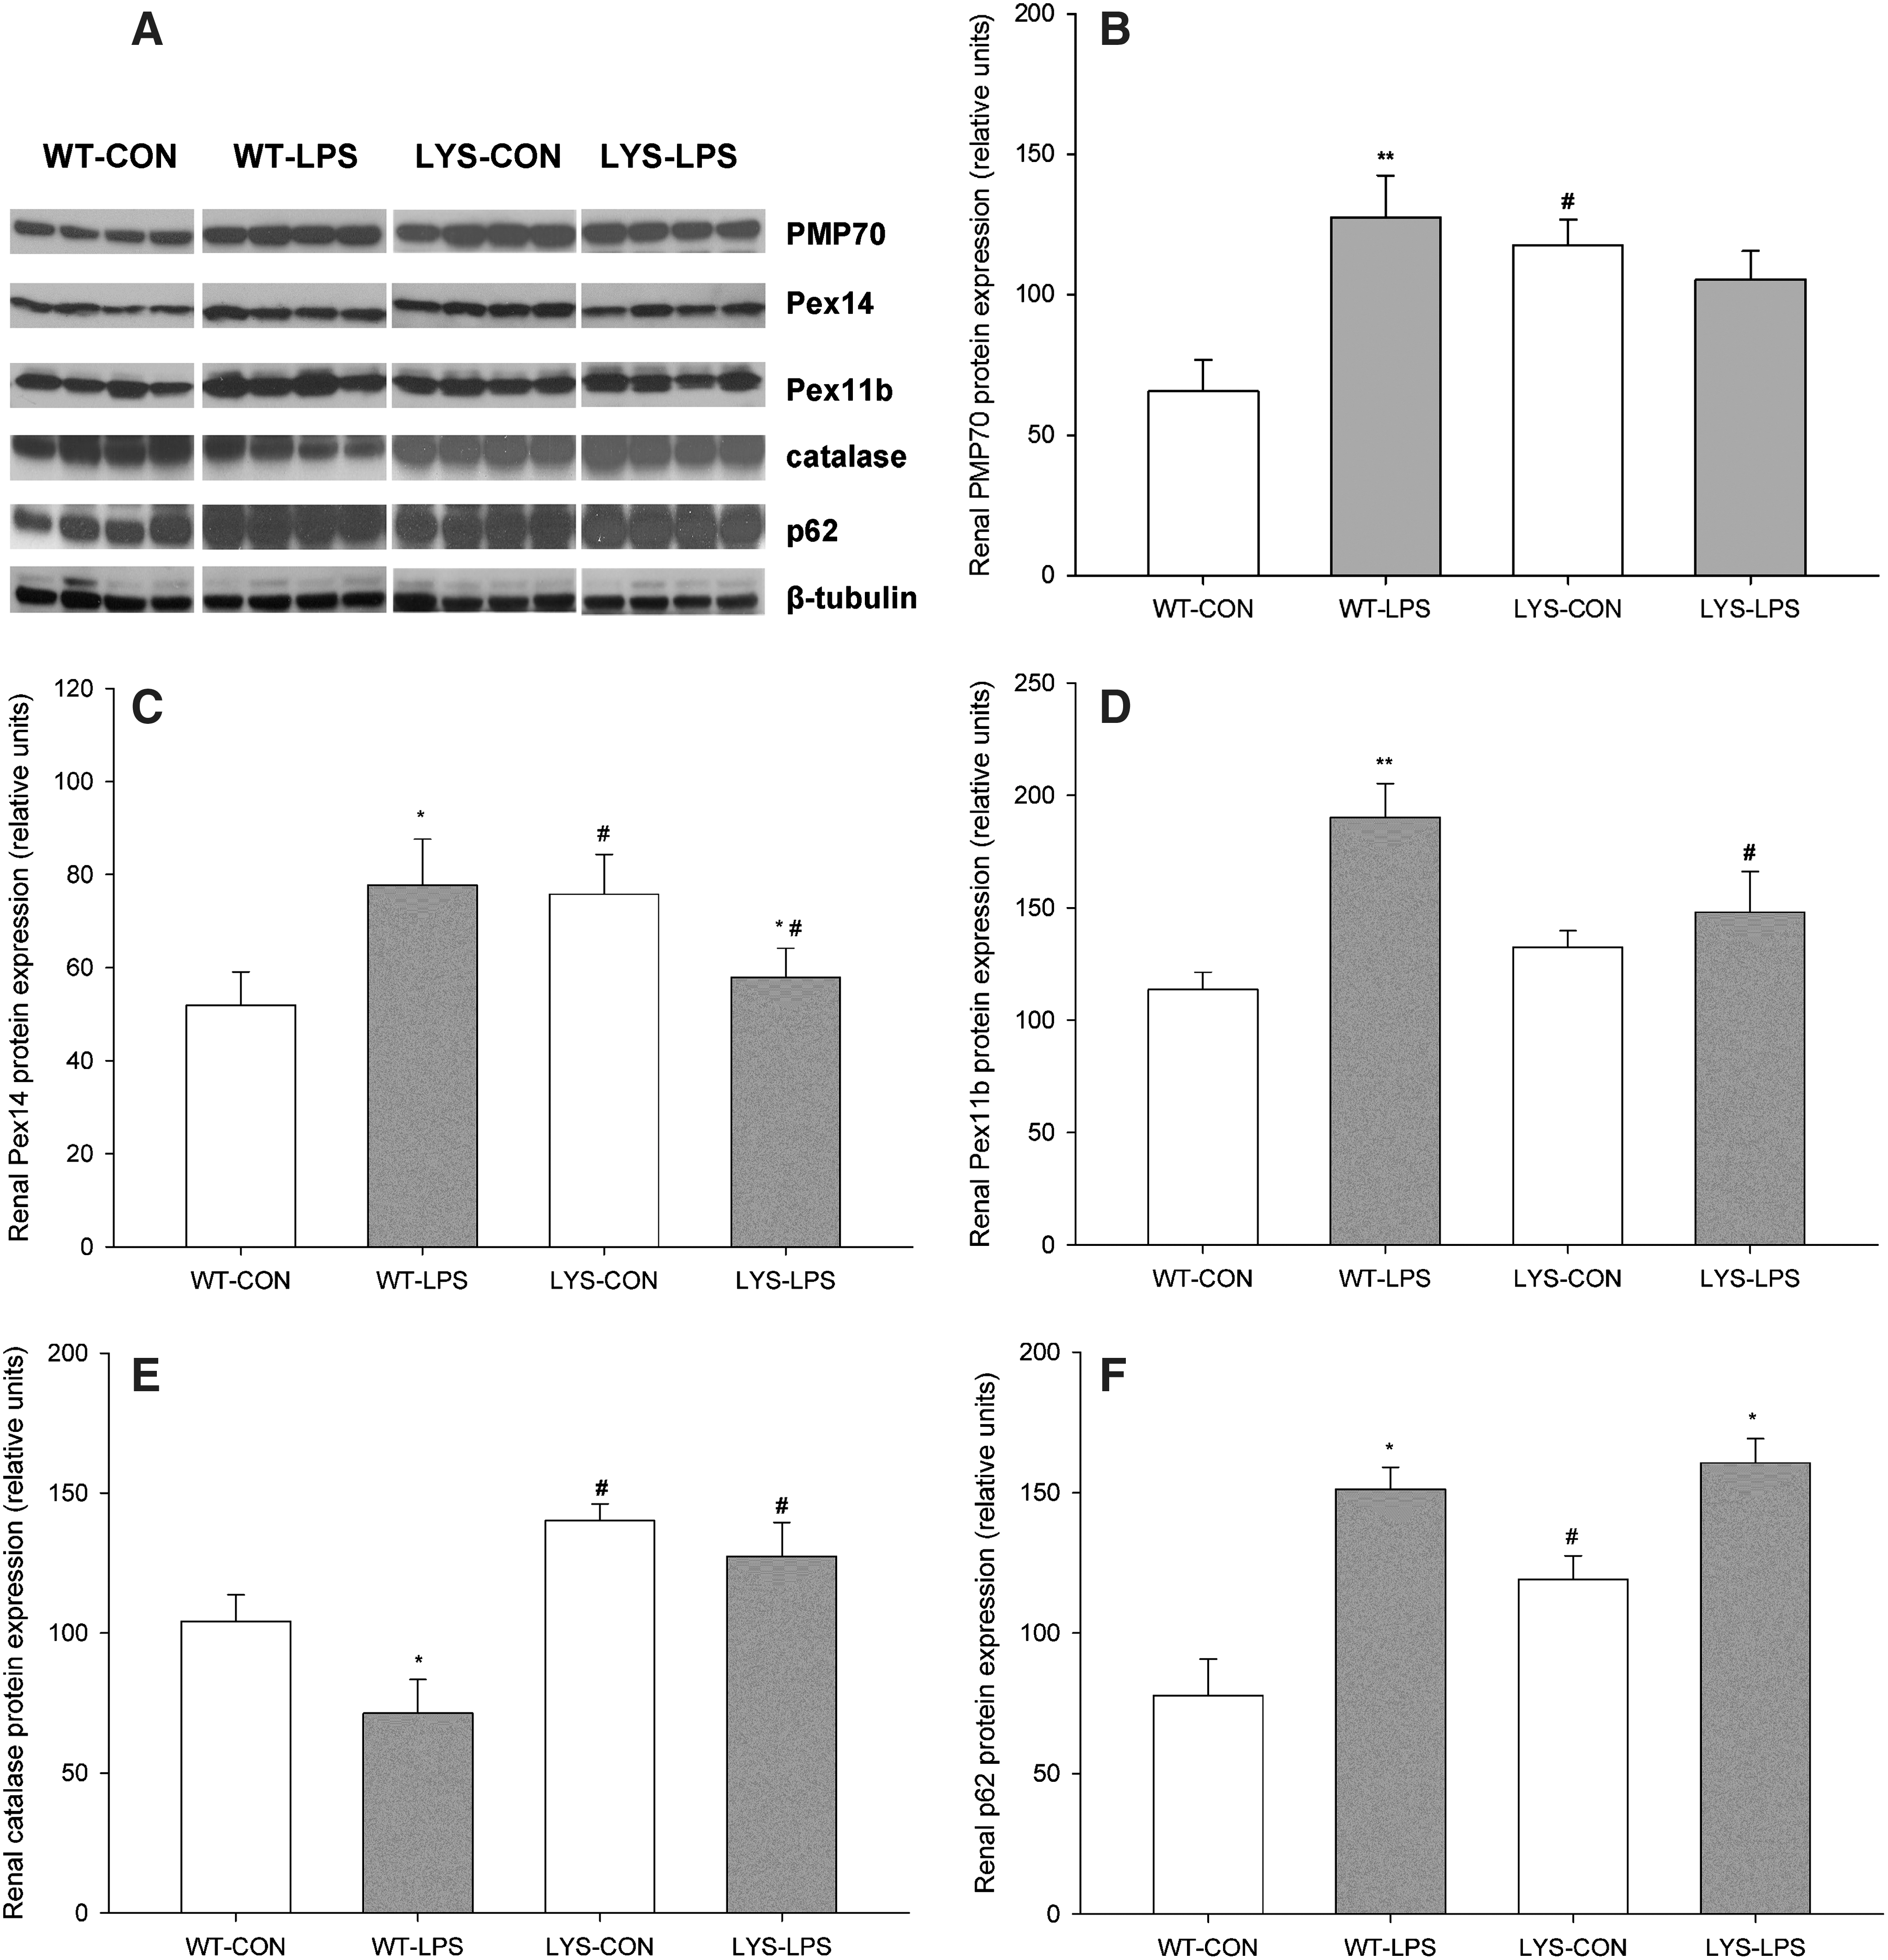
To study the behavior of renal peroxisomes, we examined the expression of a major peroxisomal membrane protein, 70-kDa (PMP70), peroxin 14 (Pex14, central part of peroxisomal protein import machinery), peroxin 11b (Pex11b, regulator of peroxisomal proliferation and division), and catalase in WT and Lyst-mice 24 h after LPS administration. Lyst-mice exhibited higher levels of PMP70 and Pex14 compared with WT mice under basal conditions (Fig. 3B,C, LYS-CON vs. WT-CON, PMP70 198.8%±33.9%, Pex14 152.9%±24.7%). In WT mice, LPS significantly induced PMP70, Pex14, and Pex11b expression (Fig. 3B–D, WT-LPS vs. WT-CON, PMP70 213.1%±39.7%, Pex14 157.0%±27.7%, and Pex11b 167.3%±24.4%). In Lyst-mice, LPS repressed Pex14 (Fig. 3C, LYS-LPS vs. LYS-CON, Pex14 76.3%±8.4%) and did not significantly change PMP70 and Pex11b levels. When comparing the expression of peroxins between both LPS-treated groups, WT mice demonstrated higher levels of Pex14 (Fig. 3C, WT-LPS vs. LYS-LPS, Pex14 139.8%±23.8%), Pex11b (Fig. 3D, WT-LPS vs. LYS-LPS, Pex11b 138.8%±31.0%), and slightly increased PMP70 compared with Lyst-mice. Catalase, the major peroxisomal enzyme (41), was decreased in LPS-treated WT mice (Fig. 3E, WT-LPS vs. WT-CON, 68.1%±16.8%) and did not change in Lyst-animals. Lyst-mice had higher basal levels of p62, due to the impaired autophagy. LPS increased p62 in both groups (Fig. 3F, WT-LPS vs. WT-CON 206.1%±23.6%, LYS-LPS vs. LYS-CON 142.7%±14.9%). Collectively, these data demonstrate that LPS stimulates peroxisomal proliferation in WT mice, and this response is blunted in Lyst-mice. Impaired proliferation of Lyst-peroxisomes is further supported by relative deficiency of Pex11b, implicated in peroxisomal proliferation and fission, and the distinct phenotypic features of the Lyst-peroxisomes (22).
Endothelial cells exhibit a biphasic profile of peroxin expression during LPS stimulation, and lose this expression dynamics after induction of LYS dysfunction
Primary endothelial cells isolated from Lyst-mice differ from cells isolated from WT mice due to their larger volume and course granular appearance (Supplementary Fig. 5A,B). Primary human umbilical vein endothelial cells (HUVEC) treated with lysosomotropic chloroquine developed similar phenotypic features as Lyst-endothelial cells (Supplementary Fig. 5C,D). Immunofluorescence staining of WT endothelial cells demonstrated upregulation of PMP70 and p62 during LPS stimulation, reminiscent of what was seen in vivo in the kidneys of these animals (Fig. 4A–C). LPS-treated Lyst-endothelial cells had a similar number of peroxisomes as untreated cells, though they exhibited distinct morphologic features with prevalence of enlarged and elongated forms, suggestive of a defect in proliferation and fission (photomicrographs, Fig. 4A). Primary endothelial cells from WT mice showed a transient drop of PMP70 and p62, which was abolished in Lyst-mice (Fig. 4D,E).

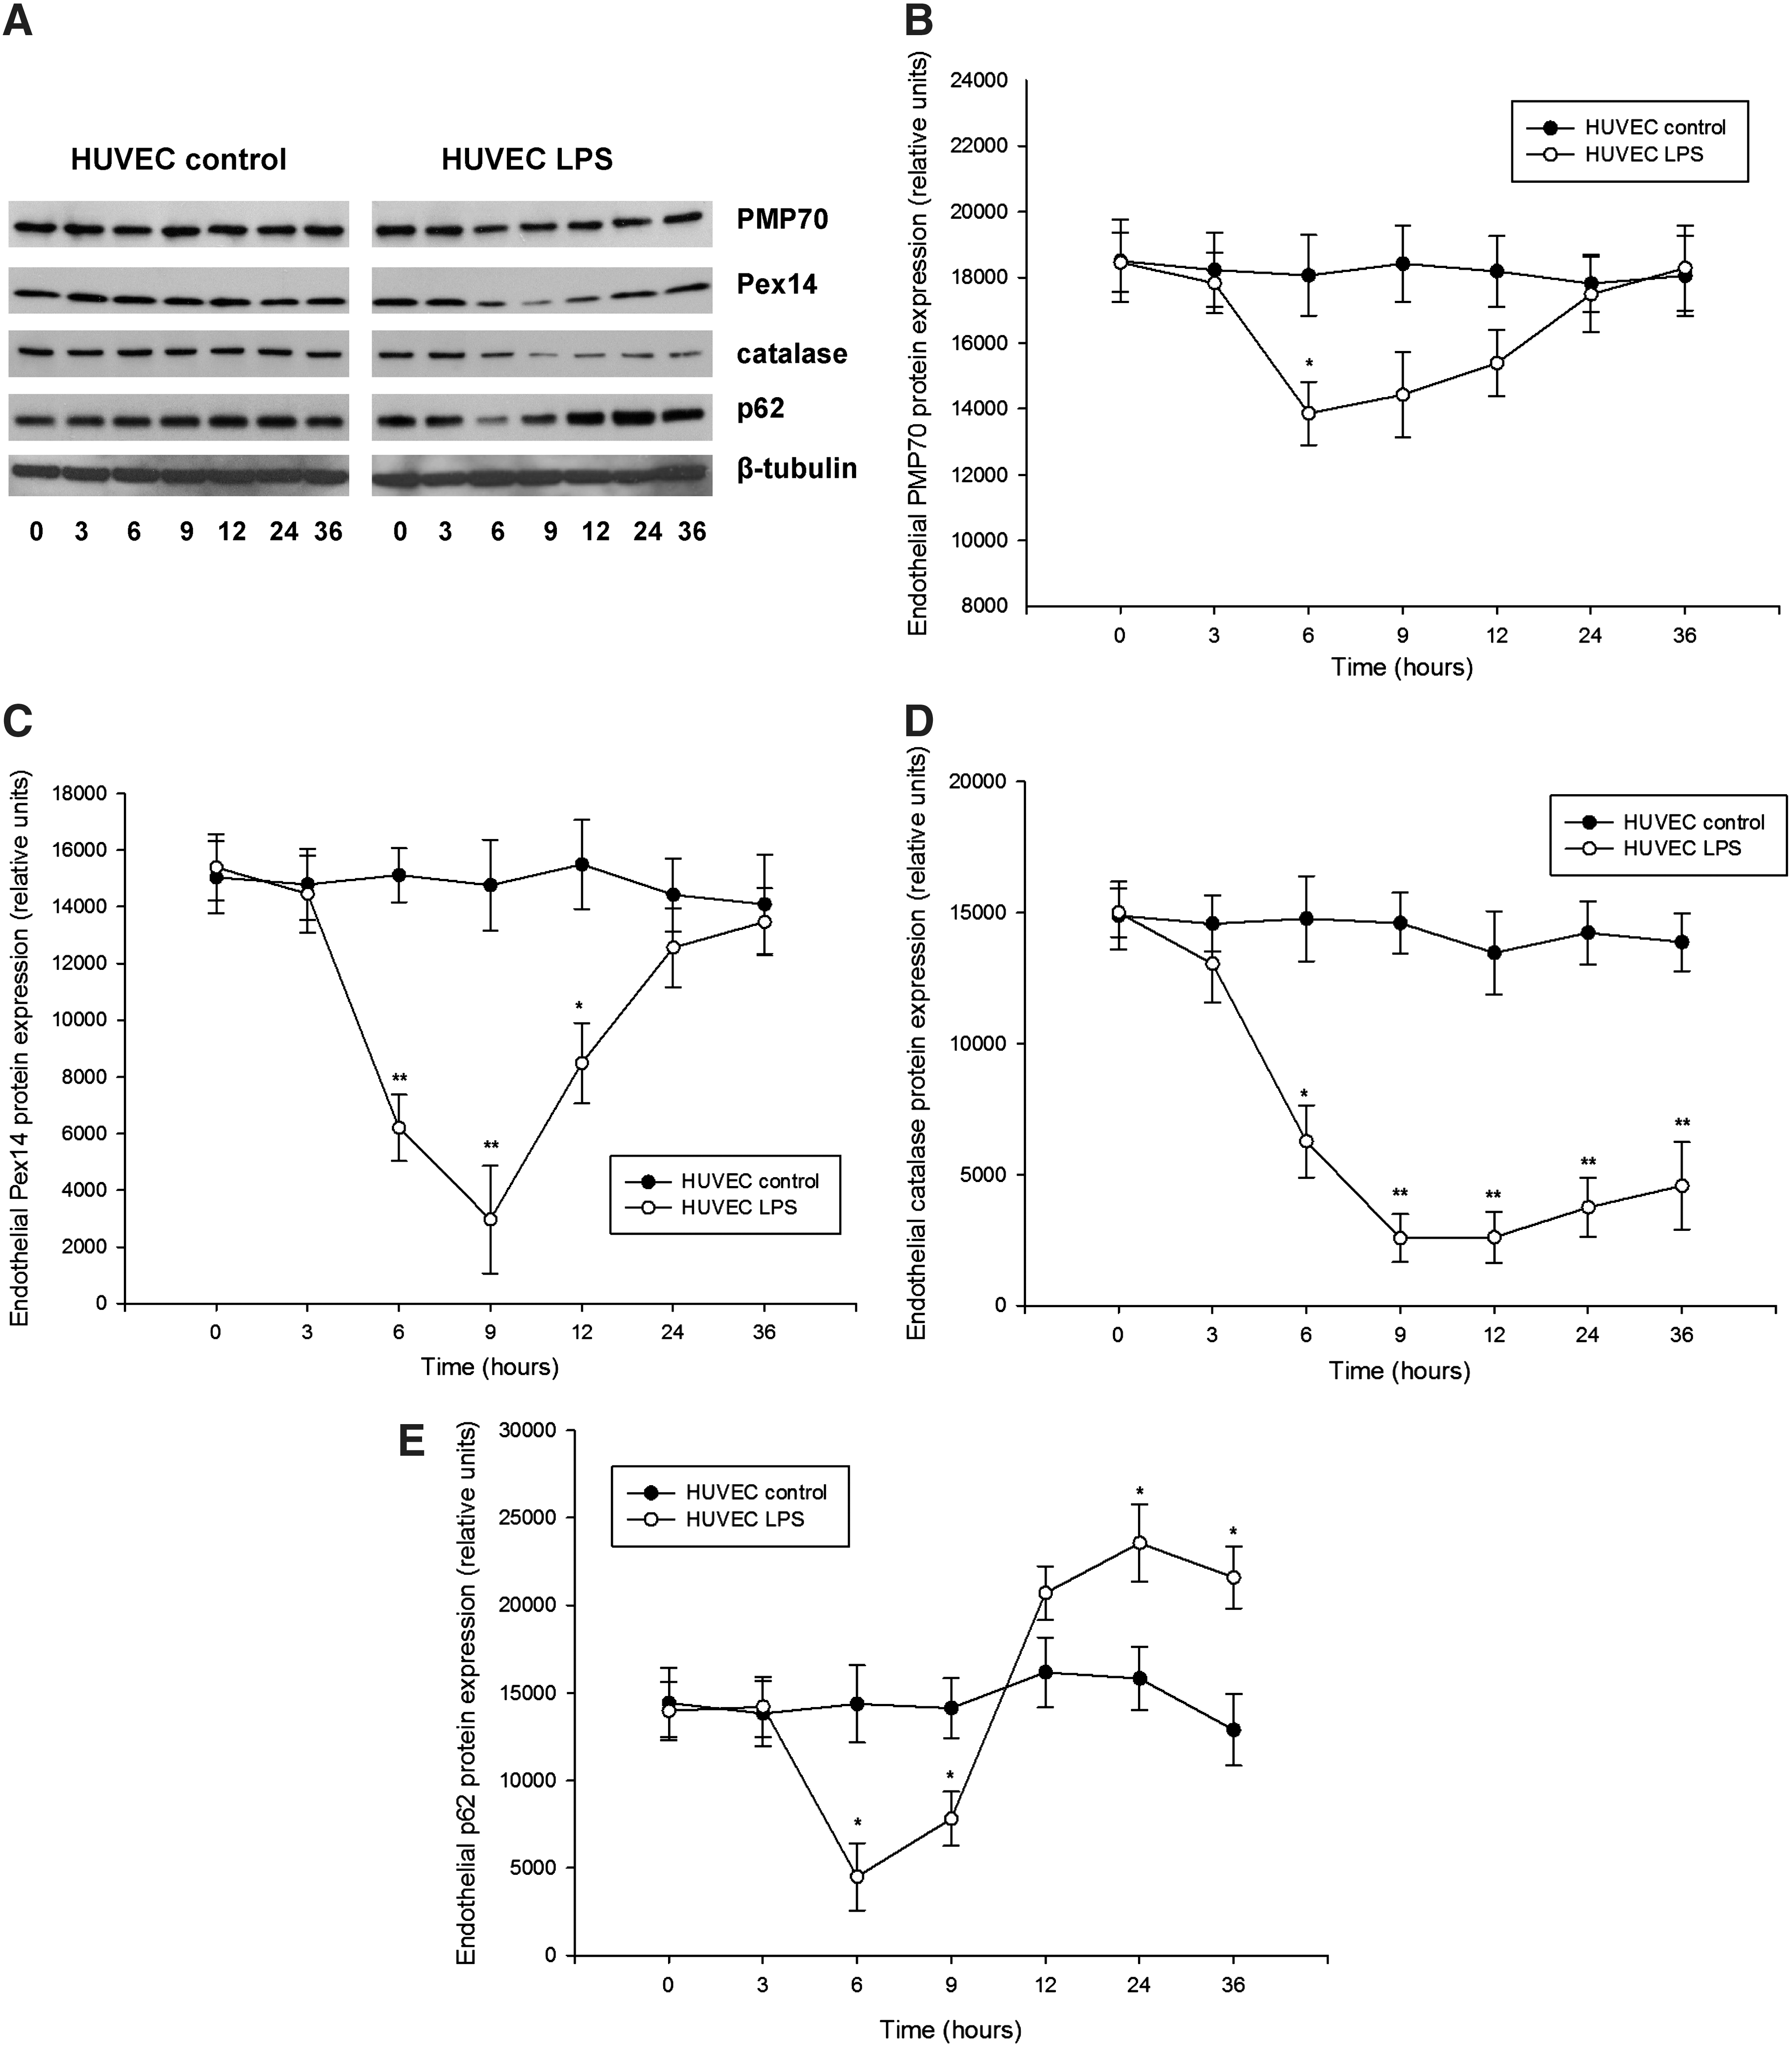
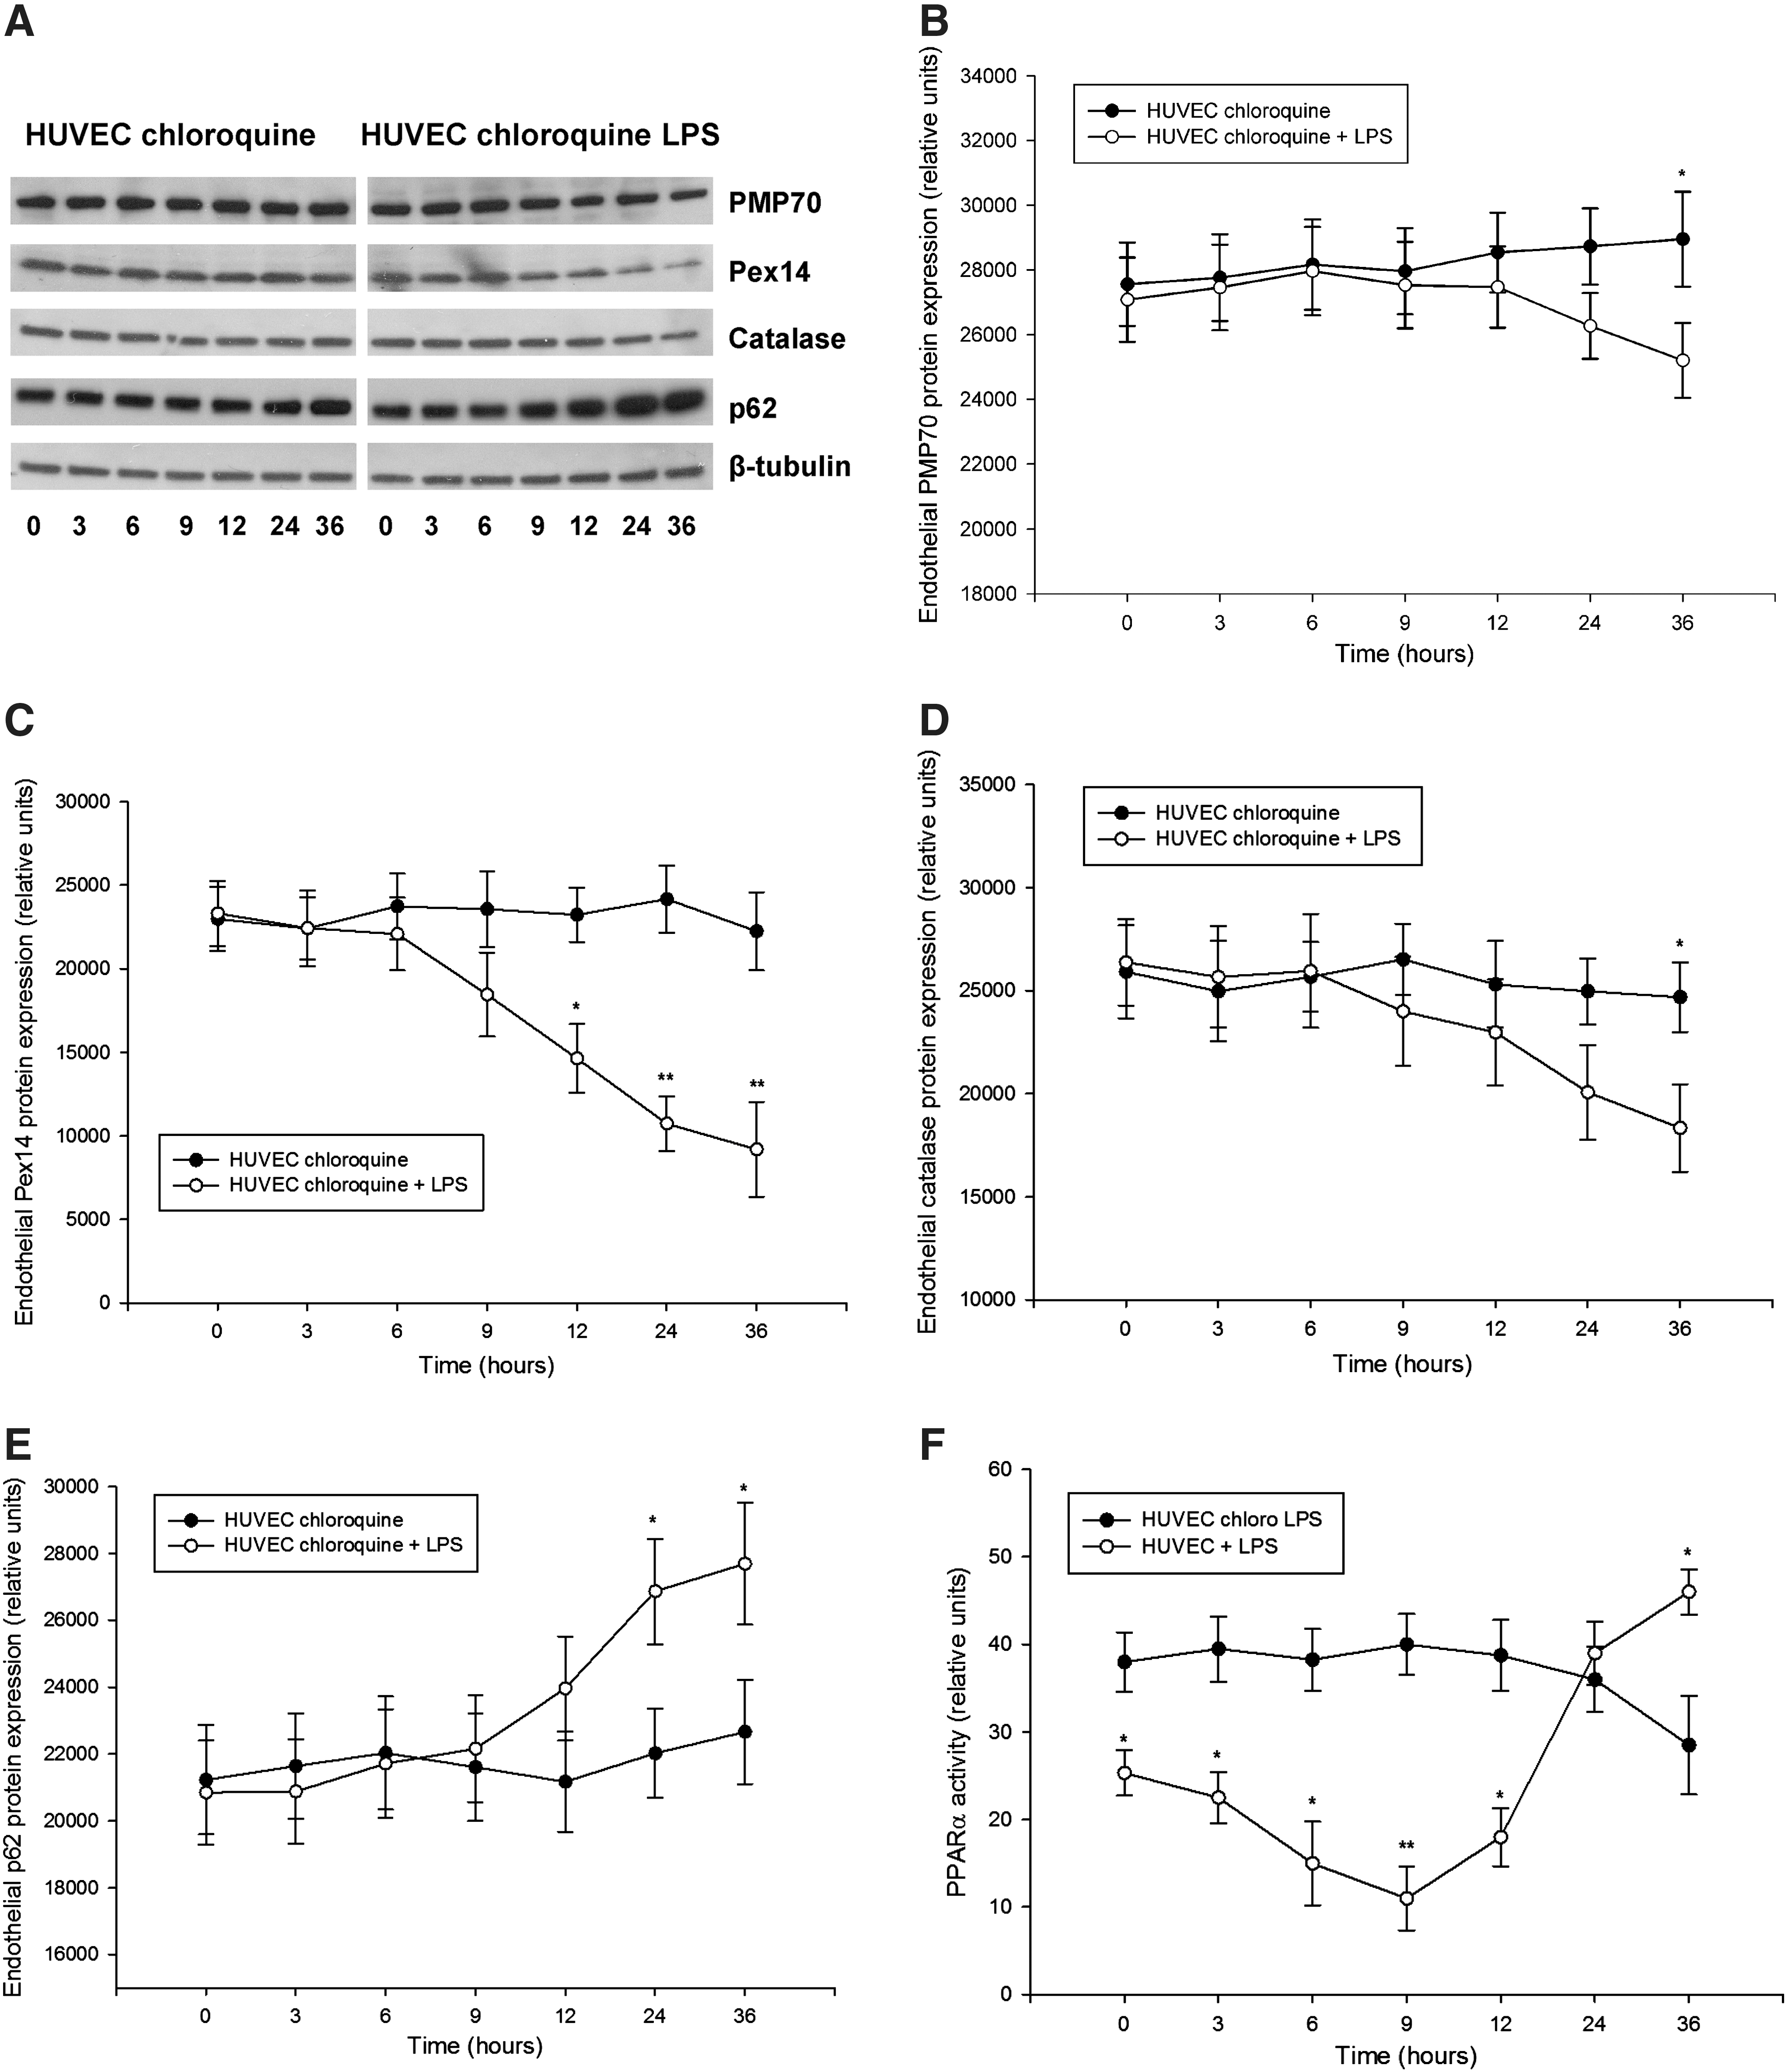
Detailed examination of peroxin expression in LPS-stimulated HUVEC (passages 2–5) demonstrated similarly a biphasic PMP70 and Pex14 expression, with an initial decline followed by a gradual increase (Fig. 5). Catalase levels showed slower recovery than peroxins. Similar as in the kidneys, the impact of LPS was more profound on Pex14 than PMP70. Parallel decrease of p62 is indicative of increased autophagic flux and LYS pexophagy (Fig. 5E). Indeed, immunofluorescence studies revealed a reduced peroxisomal density in the vicinity of lysosomes after LPS exposure (Supplementary Fig. 6). Pretreatment of HUVEC with chloroquine compromised lysosomes and autophagy, leading to accumulation of p62 and loss of the biphasic peroxin expression seen in cells with competent lysosomes after LPS application (Fig. 6). In other words, impairment of LYS function suppressed pexophagy and prevented recycling of peroxisomes during LPS stress. Accelerated accumulation of p62 and slow decline of PMP70/Pex14 levels in lysosome-defective cells at advanced stages of LPS treatment indicate worsening of peroxisomal homeostasis. Immunofluorescence studies confirmed the changes of PMP70, Pex14, and p62 expression described above (Fig. 7 and Supplementary Fig. 7). These in vitro findings in endothelial cells corroborate similar changes in the whole-organ responses to LPS and emphasize the role of autophagy/pexophagy in this process.

LPS impairs protein import into peroxisomes
Peroxisomal matrix proteins are synthesized on cytoplasmic ribosomes, and their destination is tagged by peroxisomal targeting signal type 1 (PTS1), required for docking to membrane-associated Pex14, which enables import into peroxisomes (28). Therefore, LPS-induced depletion of Pex14 could possibly compromise protein import into peroxisomes. To prove it, we transduced primary HUVEC with PTS1–green fluorescent protein (GFP) and examined the effect of LPS on peroxisomal import by colocalization with peroxisomal marker protein PMP70 (Fig. 8A). Under normal culture conditions, the colocalization ratio between PMP70 and PTS1-GFP was 82.4%±6.4%. LPS reduced colocalization to 46.2%±5.3% after 9 h, and to 63.2%±4.3% after 24 h, consistent with the expression profile of Pex14 (Fig. 8B). Interestingly, when examining the proportion of total PTS1-GFP that colocalized with PMP70 (e.g., proportion of imported PTS1-GFP), this increased from 74% under normal conditions to 89% after 9h, and 85% after 24h of LPS treatment (Fig. 8C). Hence, LPS decreases total peroxisome number (as showed above), and from the remaining peroxisomes, a smaller fraction (46%) imports more PTS1 protein (89%) than under basal conditions (74%). In other words, a smaller number of residual peroxisomes imports PTS1 proteins with higher efficiency. However, in toto, the preserved peroxisomal fraction, irrespective of the increased effort, could not adequately substitute for their overall (and import) dysfunction. Repression of Pex14 may impair intraorganellar import of catalase that has an atypical weaker PTS1, and potentiate the adverse effects of total catalase depletion during LPS exposure (37).

LYS dysfunction results in impaired activation of catalase and higher levels of ROS in cultured cells under basal conditions and after LPS treatment
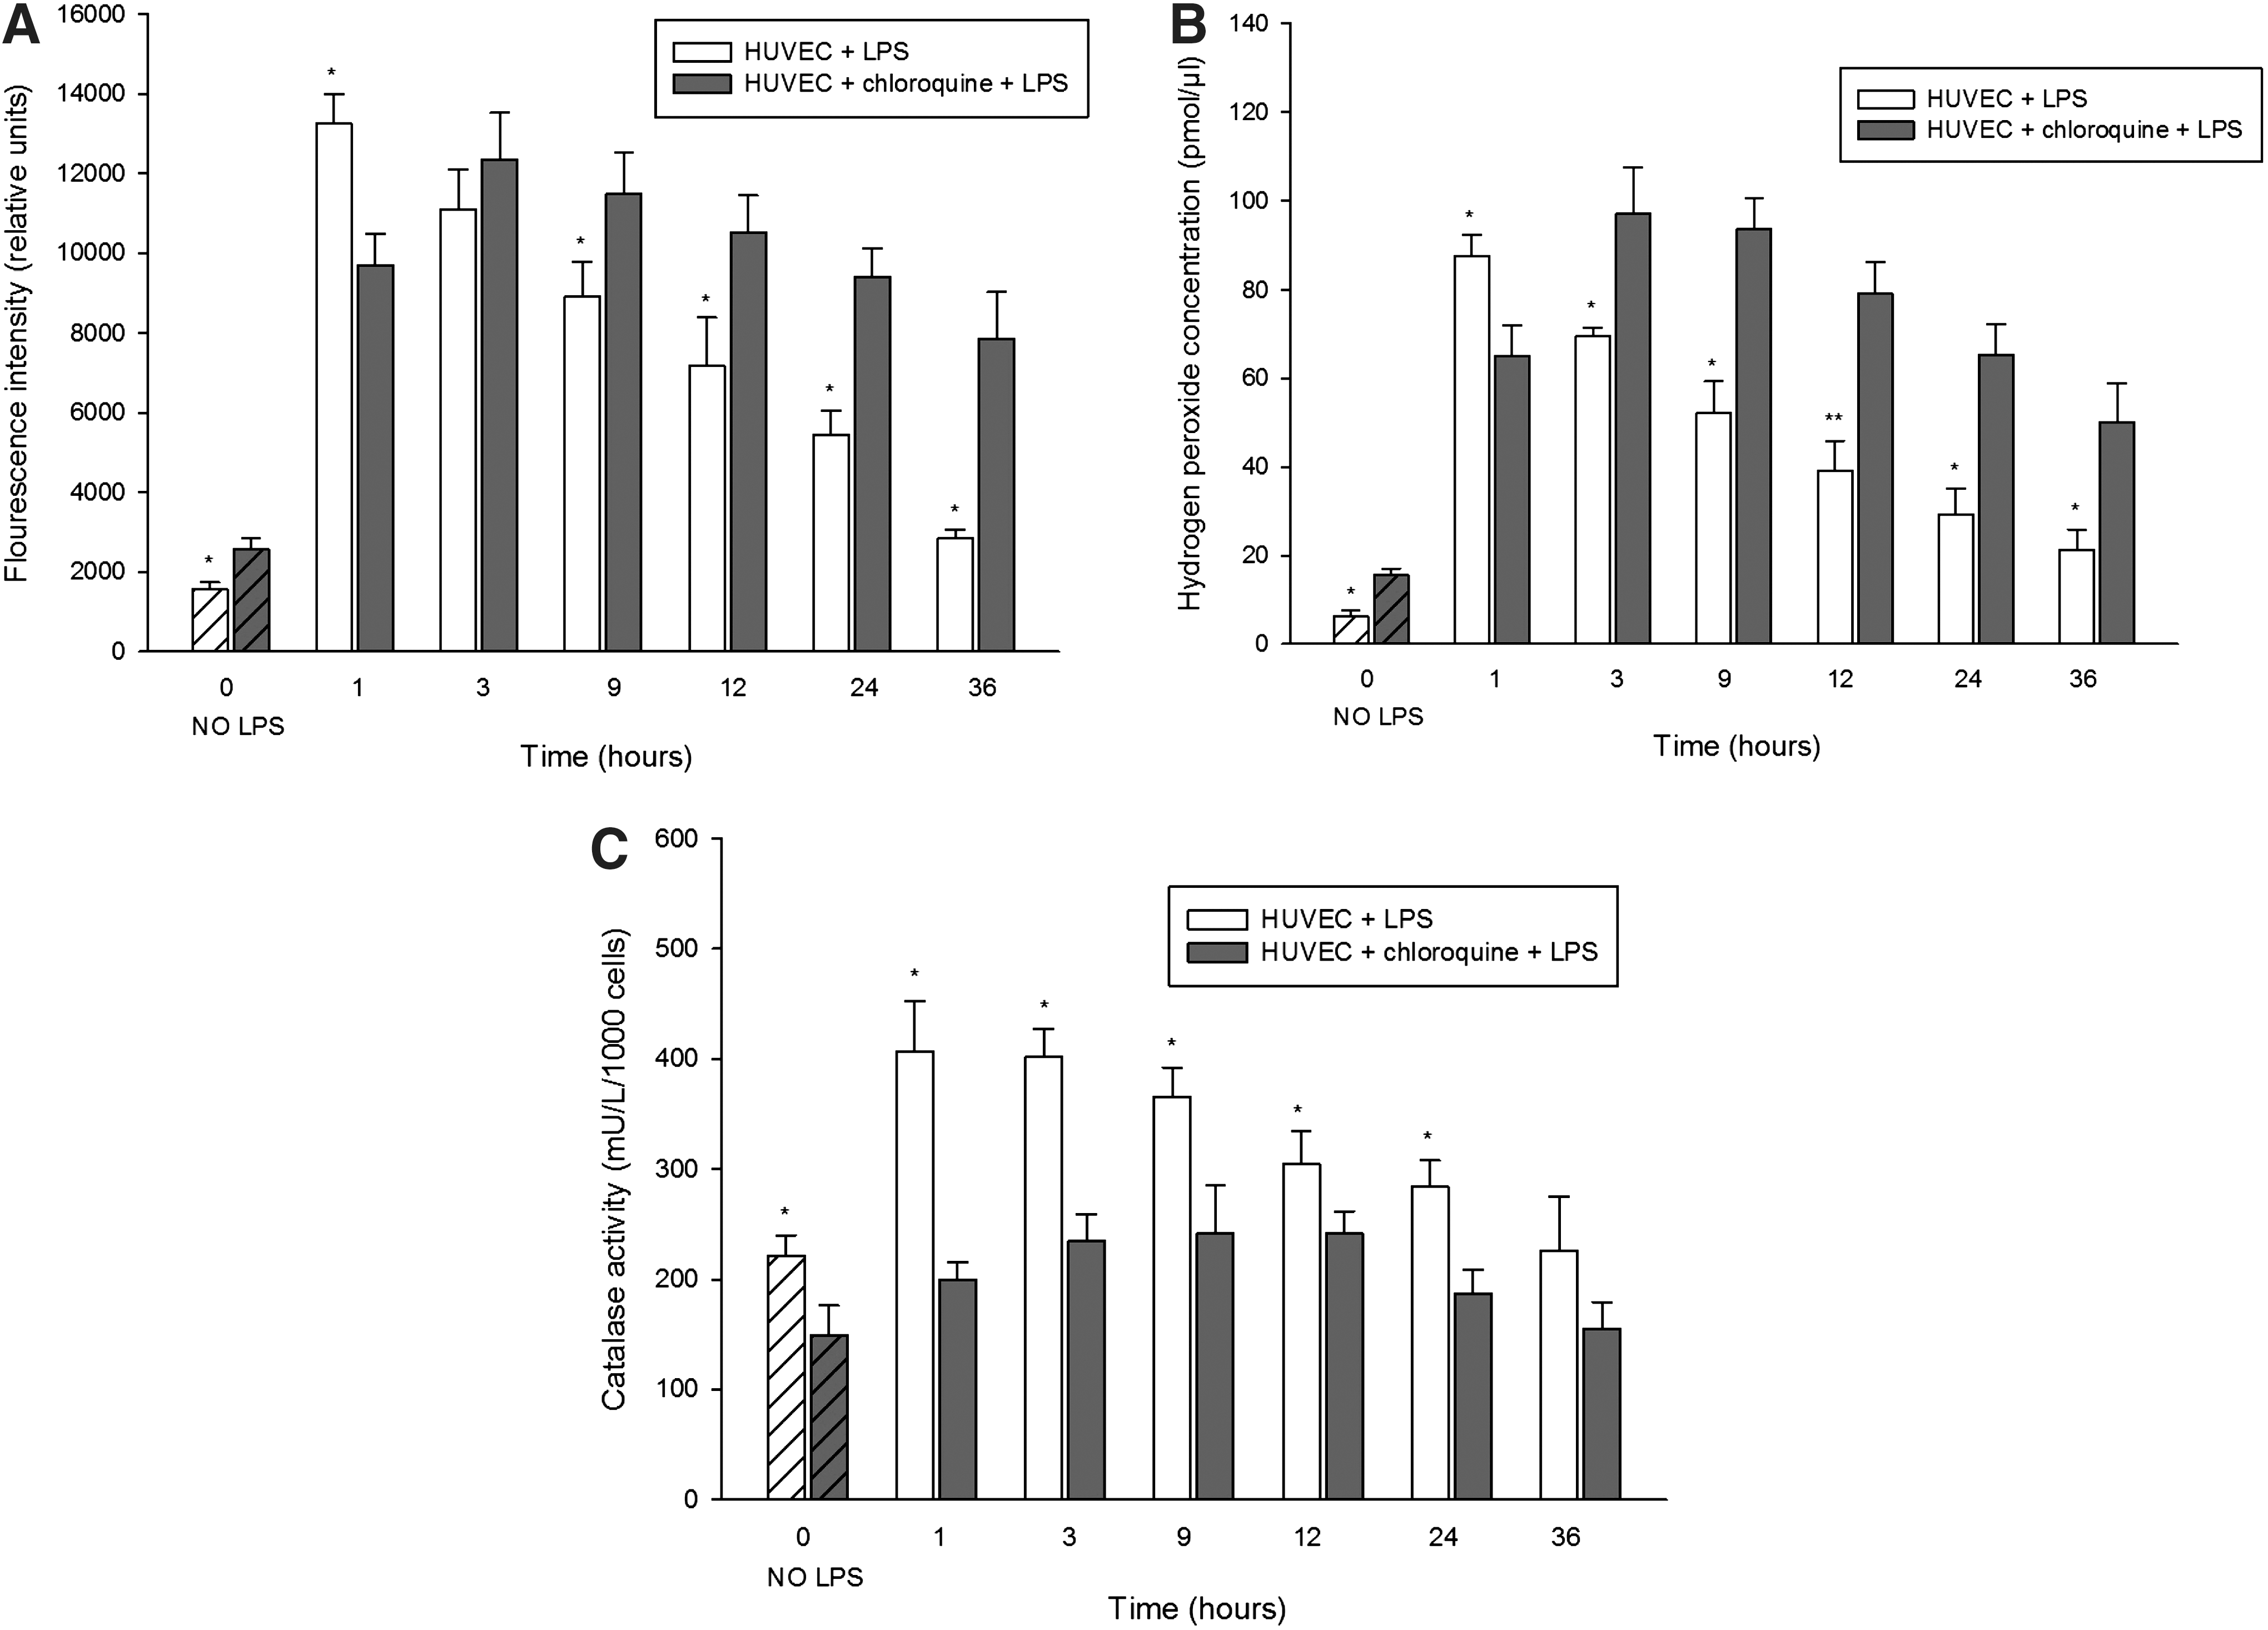
Since we observed higher catalase protein levels in the kidneys from Lyst-mice and in cells with chloroquine-induced LYS dysfunction, we inquired whether the elevated levels are functionally protective against oxidative stress. Toward this end, we first examined overall ROS levels in cells with LYS dysfunction using dichlorodihydrofluorescein diacetate (DCFH-DA) assay (preferentially senses H2O2), and noticed higher levels of ROS than in cells without LYS dysfunction, even under normal conditions (Fig. 9A, 1.27×). LPS stimulation of lysosome-competent cells rapidly increased ROS, peaking after 1 h (Fig. 9A, 8.42-fold increase, HUVEC+LPS vs. HUVEC), followed by a gradual decline. In lysosome-defective cells, LPS induced a delayed peak of ROS (Fig. 9A, 5.80-fold increase, HUVEC+chloroquine+LPS vs. HUVEC+chloroquine), with a slower decrease and protracted elevation, compared to control cells. When looking specifically at H2O2 that is more specific for peroxisomal ROS (and some authors question the specificity of DCFH-DA for H2O2), the differences were even more obvious (Fig. 9B). Next, we examined the enzymatic activity of catalase in cultured living cells. Here, control cells demonstrated constantly higher catalase activity under basal conditions (Fig. 9C, 8.2%±9.7%, HUVEC vs. HUVEC+chloroquine), and during LPS stress, compared with lysosome-defective cells. Considering the higher catalase abundance in lysosome-defective cells, adjustment of catalase activity for total protein would make these differences even more robust (we measured the activity in living cells and adjusted the results for cell number). Finally, LYS dysfunction compromises antioxidative mechanisms and results in longer persistence of higher ROS levels.
LPS treatment results in higher oxidative injury in C57BL/6J-Lystbg-J mice due to the imbalance between the active hydrogen peroxide-generating acyl-CoA oxidase and the functionally impaired catalase
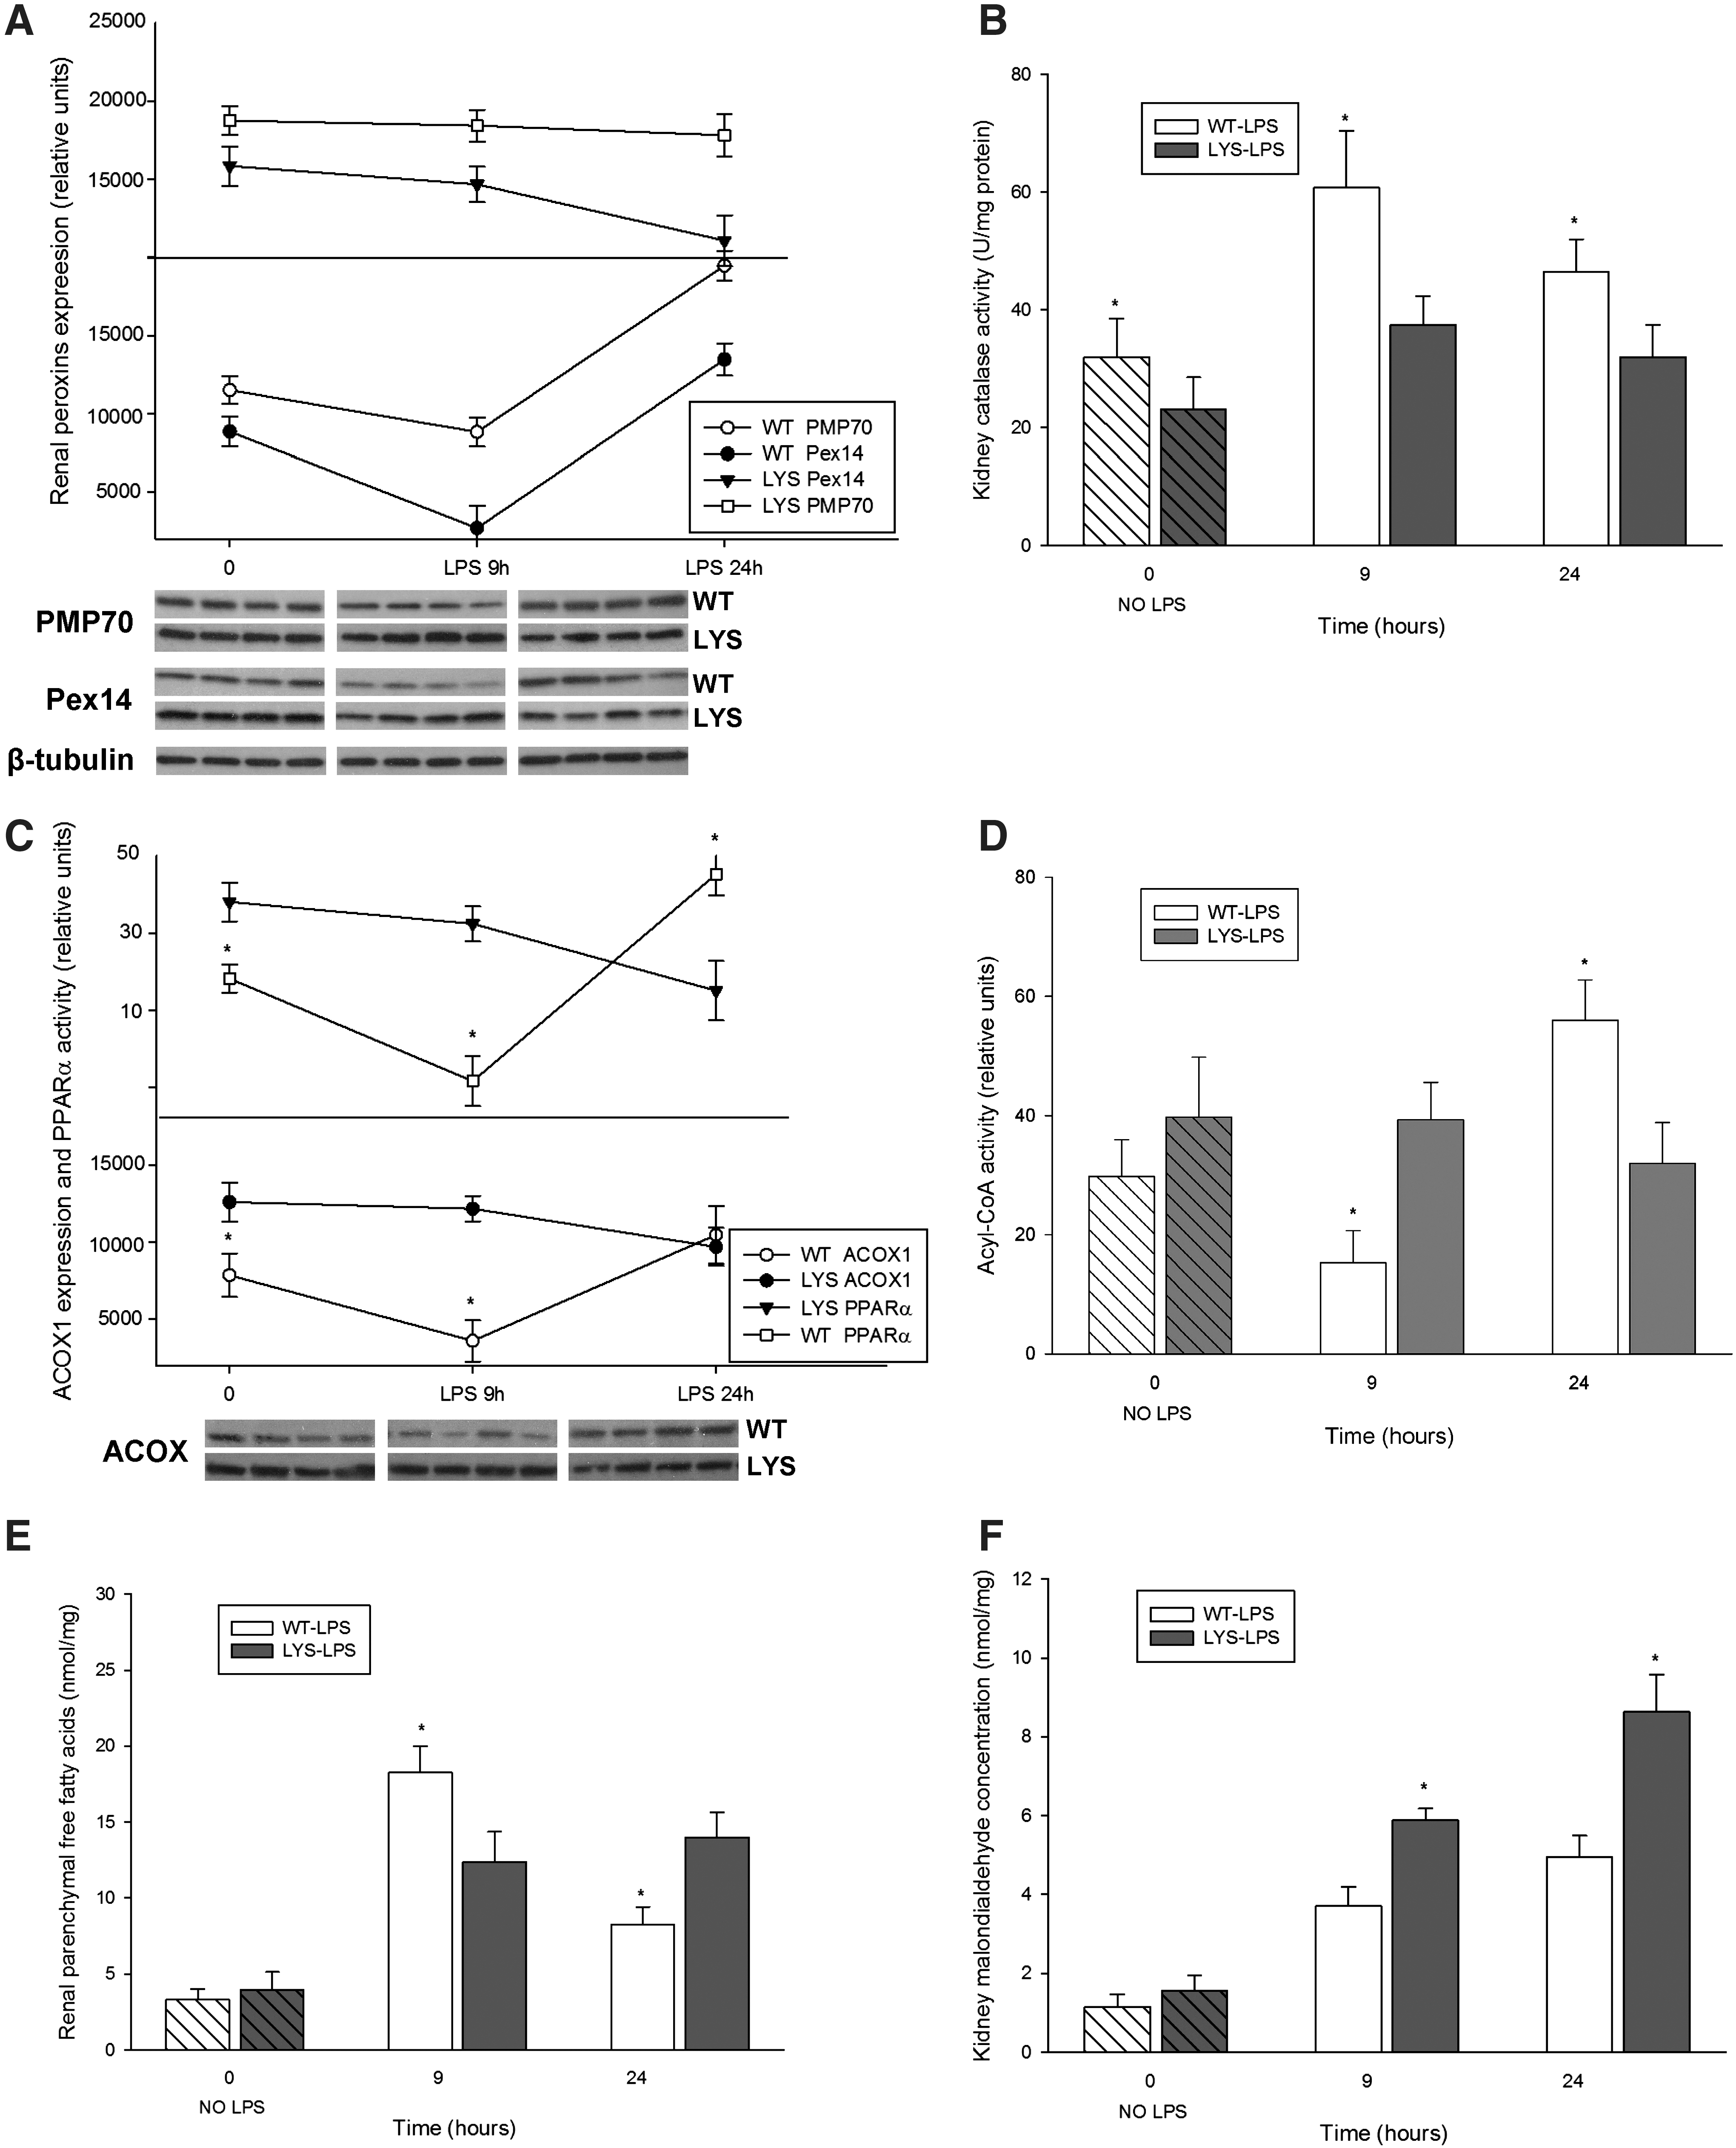
Our in vitro data revealed significant changes in peroxisomes at an earlier time point after LPS application. For this reason, we studied peroxisomes in an additional group of mice treated with LPS for 9 h. At this time point, neither WT nor Lyst-mice presented significant changes in serum creatinine or albuminuria levels compared to untreated mice. Similar, as in vitro, renal PMP70 and Pex14 were reduced early after LPS administration, and increased 24 h later in WT-mice (Fig. 10A). Lyst-mice did not show the initial decline of peroxins, and however exhibited constantly lower kidney catalase activity (Fig. 10B). Since properly functioning catalase is indispensable for neutralization of H2O2 generated by peroxisomal oxidases, we examined the expression of acyl-CoA oxidase (ACOX), the first and rate-limiting enzyme of the peroxisomal FAO. ACOX protein levels were higher in Lyst- than in WT mice, and the expression pattern was similar to peroxins in both groups (Fig. 10C). The expression of ACOX correlated with transcription activity of peroxisome proliferator-activated receptor-alpha (PPARα), the main regulator of peroxisomal FAO enzymes. We could not detect significant differences in PPARα nuclear protein levels (data not shown); thus, the activity differences between WT and Lyst-mice (Fig. 10C) reflect in fact the transcription activity and not a paucity of protein. In our cell culture experiments, PPARα activity started to increase 6 h after adding chloroquine (cells have been pre-treated for 12 h before LPS application), remained elevated, and started to decline at later stages of LPS treatment (Fig. 6F). To evaluate if the increased ACOX protein levels were accompanied by higher activity, we examined ACOX metabolic activity using palmitic acid in a peroxisome-enriched kidney fraction. ACOX activity was higher in Lyst-mice early after LPS; however, after 24 h, the situation was opposite, and activity increased in WT-mice (Fig. 10D). Palmitic acid can be metabolized by peroxisomal and mitochondrial FAO under normal conditions. However, when in excess, only peroxisomal catalase, but not the cytosolic or the mitochondrial superoxide dismutase, provides sufficient protection against its toxicity (11). Reduction or inhibition of FAO enzymes results in accumulation of free fatty acids (FFA). The higher levels of FFA in WT mice 9 h after LPS, with a significant decrease 24 h later, are consistent with activity profile of ACOX (Fig. 10E). Hence, after 9 h of LPS treatment, Lyst-mice showed a preserved FAO and lower FFA levels; however, an impaired catalase indicating a redox imbalance. In fact, the consequence of dysregulation between peroxisomal pro-oxidative ACOX and antioxidative catalase was a higher oxidative damage in Lyst-mice, as demonstrated by increased lipid peroxidation (malondialdehyde [MDA]) in the kidneys and urine of the treated Lyst-animals (Fig. 10F,G).

Discussion
We demonstrated that LPS induces a proliferative response in peroxisomes from WT mice, which was abolished in Lyst-mice. LPS-treated Lyst-mice presented a heightened inflammatory response with increased oxidative stress and aggravated renal injury. Similarly as in vivo, LPS activated LYS pexophagy, and transiently repressed peroxisomes in vitro. Lysosome-defective cells lost the biphasic kinetics and accumulated dysfunctional peroxisomes generating redox imbalance and promoting oxidative injury (see summarizing Fig. 11). To the best of our knowledge, this study is the first to explicitly analyze peroxisomal dysfunction in LPS-induced AKI.

In a recent study, filtered endotoxin caused severe peroxisomal damage in proximal tubules, demonstrated by PMP70 reduction, as early as 4 h after administration (20). We observed, in vivo and in vitro, an initial decrease of PMP70, followed by expansion of kidney peroxisomes in LPS-treated WT mice. PMP70 is a structural marker of peroxisomes, but also functions as a transporter of long-chain fatty acids for peroxisomal FAO (19). Preservation of FAO is necessary to meet the increased energetic demand of stressed kidney. The negative effects of inhibited FAO, with accumulation of unmetabolized FFA, have been described in ischemic and cisplatin-induced AKI (27, 34). Magnetic resonance studies have demonstrated renal parenchymal changes 6 h after septic insult, which emphasizes the pathogenetic relevance of early subclinical alterations in the septic kidney (7, 10). Our short-treated group showed renal alterations, including lipid accumulation and peroxidation, even before urinary markers became significantly elevated. Fatty acids are transported into the peroxisomes via peroxisomal ABC proteins, including PMP70, and oxidized by ACOX, the rate-limiting FAO enzyme. The initially decreased ACOX and the higher renal FFA levels in WT mice contrasted with Lyst-mice, which had higher ACOX and lower FFA early after LPS. In addition to inhibited FAO, lysis of membrane phospholipids by activated phospholipases is another source of FFA in tissue injury (36, 52). Hence, considering the more severe injury in Lyst-mice, the excess of FFA would be even higher, further supporting an active FAO. However, functional uncoupling of pro-oxidative ACOX and impaired catalase in Lyst-mice disrupts H2O2 balance and results in higher oxidative damage already 9 h after LPS. Hwang et al. showed that peroxisomes are able to neutralize H2O2 up to a certain level, and further increase of H2O2 impairs biogenesis and caused dysfunction of peroxisomes (18). They also reported that catalase-deficient mice decrease ACOX levels in long term. It is not clear if this is a consequence of chronic oxidative injury or rather a protective downregulation. Peroxisomes exposed to LPS increase the expression of nitric oxide synthase (45). Elevated nitric oxide can interact with heme group and inactivate catalase, without affecting enzyme protein levels (42). LPS exhibited a more profound effect on Pex14 (catalase import) than PMP70 (FFA import) expression, which may contribute to redox imbalance. It is possible that PMP70 being a large membrane-incorporated protein resists LPS toxicity better than the smaller membrane-associated smaller Pex14. Lastly, the imbalance between ACOX and catalase generates cumulative oxidative stress, and globally deteriorates peroxisomal function (peroxisomal burnout), including FAO that explains the higher FFA later after LPS exposure in Lyst-mice.
PPARα acts also as a lipid metabolic sensor and regulator of FAO enzymes. Stimulation of PPARα has been shown to mitigate cisplatin- and ischemia-induced AKI, although the exact mechanisms are not well understood (26). LPS suppression of renal PPARα and FAO has been documented before, and observed by us in WT-mice. Lyst-mice and lysosome-defective cells showed increased PPARα activity, although the factors activating PPARα in LYS/peroxisomal dysfunction remain elusive. Severe peroxisomal deficiency caused by hepatic deletion of Pex5-activated PPARα, though because of nearly complete absence of ACOX, did not result in increased oxidative stress (9). In contrast, patients with peroxisomal bifunctional protein deficiency have increased PPARα and ACOX, a higher ACOX/catalase ratio, and suffer from consequences of increased oxidative stress (13). We demonstrated that the functional patterns described genetic peroxisomal defects can temporary arise in the endotoxin-stressed kidney. Hence, LPS-activated pexophagy not only refreshes peroxisomal pool, but also helps to prevent intraperoxisomal redox disequilibrium. Simulation of peroxisomal dysfunction by treatment with FFA or catalase inhibitor has been shown to activate dermal LYS hydrolases. Although the authors did not explicitly examined peroxisomes, activation of lysosomes supports their role in the maintenance of peroxisomal fitness (8).
LYS dysfunction has been involved in numerous disorders, for example, Parkinson's disease, but also in nephrotoxicity of cyclophosphamide or aminoglycoside antibiotics, used in treatment of sepsis (1, 24). Therefore, we decided to study the impact of the more common LYS dysfunction of autophagy, and not the consequences of specific deletions of autophagy (Atg) genes. The p62 protein, a marker of autophagic flux, acts as a cargo receptor for autophagic degradation of proteins and organelles in lysosomes, which explains the higher levels of p62 in Lyst-mice (4). LPS treatment moderately increased p62 in control cells, and resulted in a robust accumulation of p62 in lysosome-defective cells. The functional implications of these through different mechanisms increased p62 (synthesis vs. accumulation) are not fully understood. High levels of accumulated p62 in defective autophagy have been shown to activate NF-κB and inflammation (33). However, in most instances, the mechanisms connecting inflammatory and autophagy networks with more than 400 interacting proteins are still unclear (3, 25). Many studies that used H2O2 to increase oxidative stress described destabilization of mitochondrial/LYS membranes; unfortunately, they overlooked the natural manufacturers of H2O2 and peroxisomes. Lysosomes are rich in redox-active iron and therefore sensitive to oxidative stress. H2O2, particularly when in excess, may diffuse into lysosomes, react with iron, and form a toxic hydroxyl radical that can further impair LYS function (23). The bidirectional relationship between oxidative stress and inflammation is well accepted. Lyst-mice developed a heightened inflammatory response to LPS, and the analysis of serum cytokines revealed similarity with secretomes of endothelial cells. Mechanistically, the enormous surface of endothelial cells contributes, however, from the functional aspect, and this is consistent with evidence that endothelium is an active orchestrator of systemic inflammatory response. We studied endothelium and the kidney, to make evident potential connections of these metabolically different compartments, and did not intend just simply adapt the behavior of endothelial to tubular cells. LPS-activated endothelium is a source of cytokine burst and profoundly affects the metabolism of the adjacent tubules. Cellular survival under stress depends on precisely coordinated response of the entire subcellular system, and as we presented here, on properly functioning homeostasis-preserving autophagy–LYS pathways. Peroxisomal behavior in AKI, presented in our study, may represent a mechanism potentially involved in common renal pathogenesis at a lower intensity, however, with long-term implications. Circulating subclinical endotoxemia has been recently reported as a novel factor in long-term systemic inflammation in chronic kidney disease, which emphasizes the need for better understanding of cellular responses to endotoxic stress (30).
It could be argued that our complex model of defective LYS function and subverted autophagy obscures cell-specific responses to LPS. Admittedly, LYS defects have impact on virtually all cellular compartments, and we realize that pexophagy explains only a fraction of the findings, and is a part of the responses to endotoxic stress. Nonetheless, major conclusions obtained here in animal studies were buttressed by the results obtained in cells, thus minimizing over-interpretation of the data.
In conclusion, our data strongly suggest that activated pexophagy, a cellular mechanism per se, fulfills an important role in quality selection of peroxisomes during LPS exposure. We demonstrated that pexophagy is a default response to endotoxic stress in WT mice. However, when LYS dysfunction (a frequent companion of many diseases) is superimposed, impairment of pexophagy results in accumulation of functionally compromised peroxisomes with intraorganellar redox imbalance (peroxisomal burnout) that contributes to increased oxidative stress and aggravated kidney damage. Participation of peroxisomes in mammalian diseases is very scarcely investigated at present. Further research on this underestimated organelle with indispensable role in oxidative metabolism is needed to identify potential targets for therapeutic interventions.
Materials and Methods
Antibodies and chemicals
PMP70 and β-tubulin (Sigma Aldrich), mouse Pex14 (Assay Biotech), human Pex14 (Abgent), Pex11b (Abcam), p62 (Abnova), and catalase (Calbiochem) antibodies were used. LPS (extracted from Escherichia coli, serotype O127:B8) and chloroquine were purchased from Sigma.
Cell culture
HUVEC (ATCC), passages 2–5, were maintained in endothelial basal medium-2 (EBM-2; Lonza) supplemented with 5% fetal bovine serum (FBS) and growth factors (hydrocortisone, hFGF-B, VEGF, hEGF, IGF-1, ascorbic acid, and heparin), under conditions of 37°C and 5% CO2. Primary murine endothelial cells were explant cultures isolated from thoracic aortas of experimental animals, and passages 2–3 were used in experiments. The full length of the thoracic aorta was aseptically removed and placed into an endothelial growth medium-2 (EGM-2) medium (EBM-2 supplemented with FBS and growth factors). After removal of the periaortic fibroadipose tissue, the vessels were placed in fresh EGM-2. The aortas were then cross-sectioned, and 1-mm-thick aortic rings were embedded in Matrigel (BD Biosciences) as previously described (35).
Experimental animals
The animal study protocol was in accordance with the NIH Guide for the Care and Use of Laboratory Animals and was approved by the Institutional Animal Care and Use Committee. Studies were carried out with 14-week-old C57BL/6J (WT) and C57BL/6J-Lyst bg-J mice (Lyst-mice) obtained from Jackson Laboratories. Lyst-mice carry a mutation in the Lyst gene, which encodes LYST-trafficking regulator of protein sorting to and from lysosomes (12, 17). Lyst-mice represent a model with impaired LYS function and autophagy. The animals were housed at 22°C with 12:12-h light–dark cycle and were allowed free access to food and water throughout the study. Both, WT mice and Lyst-mice (n=8–9 per group) were injected with 5 mg/kg of LPS in phosphate-buffered saline (PBS) vehicle, or vehicle only by a single intraperitoneal injection and sacrificed 24 h later. To scrutinize peroxisomal alterations observed in vitro at an earlier time point, we sacrificed WT and Lyst-mice (n=5 per group) 9 h after LPS injection. BP and heart rate were measured using an automated tail-cuff monitor system (Coda 8 NIBP; Kent Scientific) in unanesthetized mice after four morning training sessions. Ten consecutive stable readings taken on the final day were averaged and used for statistical analysis. Mean arterial BP was calculated as 1/3×SBP+2/3×DBP.
Treatment of HUVEC with chloroquine and LPS
HUVEC were cultured in the EGM-2 medium as described above. At 70% confluence, the media were replaced by fresh media, and 25 μM chloroquine was added in experiments studying LYS dysfunction. After 12 h of preincubation (without chloroquine) or pretreatment (with chloroquine), LPS was added (without media replacement) to obtain a final concentration of 1 μg/ml. Since peroxisomes are affected by sudden changes of the nutrient environment, we avoided a starving phase. Cells were harvested after 3, 6, 9, 12, 24, and 36 h and protein lysates isolated as described below. The concentration of LPS and chloroquine used was determined in preliminary experiments, based on toxicity and cell viability data.
Western blotting
Cells were washed with ice-cold PBS and lysed in an RIPA buffer containing 50 mM Tris, pH 7.4; 150 mM NaCl; 1% Triton X-100, 0.5% sodium deoxycholate; Roche complete protease inhibitors cocktail on ice for 30 min. Lysates were clarified by centrifugation, and protein concentration was determined by BCA protein assay (Thermo Scientific). Protein samples were suspended in tris-glycine sodium dodecyl sulfate (SDS) sample buffer containing 2.5% β-mercaptoethanol, boiled for 5 min, and electrophoresis was performed on 4%–20% gradient gels (Bio-Rad Laboratories), followed by transfer to the Immobilon-PSQ membrane (Millipore). The membranes were blocked with 5% milk in PBS/0.1% Tween 20 for 1 h, and then incubated with primary antibodies overnight at 4°C and secondary antibodies (GE Healthcare) for 1 h at room temperature. The bands were visualized using a SuperSignal chemiluminescence kit (Thermo Scientific), and the densitometry was performed with ImageJ software (Version 1.45; NIH).
Immunofluorescence staining for PMP70 and p62
HUVEC were cultured on gelatin-coated eight-well culture slides (Lab-Tek Chamber Slides, Thermo Scientific) and treated with 1 μg/ml LPS for 6, 12, and 24 h. After washing with PBS, cells were fixed with 4% paraformaldehyde (PFA) for 15 min, permeabilized with 0.1% Triton X-100 for 10 min, and blocked with PBS/1% bovine serum albumin (BSA) for 1 h. Cells were then incubated with primary anti-PMP70 (1:600) and anti-p62 (1:750) antibodies for 1 h. After washing with PBS, cells were reacted with secondary Alexa-Fluor 488 and Alexa-Fluor 594 antibodies (Invitrogen) for 1 h. Slides were mounted with a Vectashield medium (Vector Laboratories), and the images taken sequentially using a Nikon TE-2000U microscope. Image analysis was performed with ImageJ software.
Transduction with PTS1-GFP
HUVEC were cultured on 35-mm gelatin-coated glass-bottom dishes (MatTek). Cells were grown to 60% confluence and transduced using baculovirus-mediated transgene delivery. The vector contains enhanced CMV promoter, C-terminal PTS1 fused to emerald GFP (Invitrogen) (49). Null-construct without promoter was used to control the background fluorescence. Transduction efficiency, assed 16 h later, was 80%–85%. Twenty-four hour after transduction, cells were treated with 1 μg/ml LPS for 6 h. For the last 45 min, 50 nM LysoTracker Red (Invitrogen) was added. The media were then replaced by fresh warm Krebs-Ringer HEPES buffer (119 mM NaCl, 4.75 mM KCl, 2.5 mM CaCl2, 1.2 mM MgCl2, 1.2 mM KH2PO4, 10 mM HEPES, pH 7.4, and 5 mM glucose), and images taken with a Nikon TE-2000U microscope. In PMP70/PTS1-GFP colocalization studies, cells were washed with PBS, fixed with 3% PFA (pH 7.4) for 10 min, permeabilized with 0.1% Triton X-100 for 5 min, and blocked with PBS/1% BSA for 1 h. Cells were then incubated with primary anti-PMP70 (1:600) and secondary Alexa-Fluor 594 antibodies, each step for 1 h. Imaging was performed with a TE-2000U Nikon microscope and analysis with ImageJ software.
Albumin and creatinine measurement
Morning spot-urine samples were collected for detection of albumin excretion. Albuminuria and urinary creatinine concentration were determined in the same urine sample using Creatinine Companion and Albuwell M assays, respectively (Exocell).
Kidney pathology
The kidneys were perfused in situ with cold PBS, removed, and mid-coronal sections were fixed in 4% PFA for 16 h. Paraffin sections (4-μm thick) were stained with hematoxylin and eosin and examined by a nephropathologist blinded to the origin of preparations. An average of 3 sections per animal was examined. Tubular injury score was determined using a scoring system, where 0=none, 0.5=minimal, 1=mild, 1.5=moderate, and 2=marked, as described by Kelleher (21).
Cytokine measurement
Cytokines and chemokines were analyzed in sera obtained from WT and Lyst-mice, or in supernatants of endothelial cells from these animals, treated with LPS for 24 h. The concentration of cyto- and chemokines was measured with a Luminex IS100 automated system (Luminex Corp.), and the data were analyzed using Luminex 100IS curve-fitting software (version 2.3).
Catalase activity
HUVEC were seeded in 96-well plate in an EGM-2 medium until 70% confluent. Then, culture media were replaced by fresh media, and in experiments with LYS inhibition, chloroquine was added. After 12 h of preincubation (without chloroquine) or pretreatment (with chloroquine), 1 μg/ml LPS was added. Catalase activity was measured using an ultrasensitive catalase assay (Amplex Red, Molecular Probes), with slightly modified manufacturer's instructions. Briefly, culture media were removed, and cells washed with PBS. After 30 min of incubation with 40 μM hydrogen peroxide, Amplex Red reagent containing horseradish peroxidase was added. Cells were then incubated for 30 min at 37°C in the dark, and the absorbance was measured at 560 nm using Spectramax Plus 384 reader (Molecular Devices). Catalase activity was calculated with SoftMax Pro software (Molecular Devices, Version 5.0,) and corrected for cell number.
Measurement of cellular oxidative stress
The production of ROS was measured using oxidative conversion of DCFH-DA, (Sigma), preferentially sensing hydrogen peroxide. Cells were cultured in a 96-well plate as described above, and incubated with PBS containing 25 μM DCFH-DA for 15 min at 37°C, protected from light. The fluorescence was measured with excitation at 485 nm and emission at 530 nm using Mithras LB 940 reader, and analyzed with MikroWin 2000 software (Berthold Technologies). Hydrogen peroxide levels were specifically assessed using Amplex Red hydrogen peroxide assay (Molecular Probes). Briefly, a reaction mixture containing 50 μM Amplex Red reagent, 0.1 U/ml horseradish peroxidase in Krebs–Ringer phosphate buffer (145 mM NaCl, 5.7 mM sodium phosphate, 4.86 mM KCl, 0.54 mM CaCl2, 1.22 mM MgSO4, 5 mM glucose, pH 7.4), and 0.05% Triton X-100 was freshly prepared and prewarmed to 37°C. Cells were washed once with warm Krebs–Ringer phosphate buffer, and 100 μl of the reaction mixture was added to each well. After 10-min incubation at 37°C, absorbance was measured at 545 nm using a microplate reader.
Determination of PPAR transcription factor activity
The PPARα transcription activity was examined in nuclear extracts isolated from cells and kidney tissue, as previously described (38). We used a nonradioactive, PPARα-specific assay utilizing a 96-well plate with an immobilized specific dsDNA oligonucleotide sequence containing the peroxisome proliferator-response element (PPRE; Cayman Chemical). Briefly, nuclear extracts (10 μl) were added to the 96-well plate with immobilized PPRE, and incubated overnight at 4°C. Next, the wells were incubated with specific PPARα primary and horseradish peroxidase-conjugated secondary antibodies, each for 1 h at room temperature. After washing, color developer was added into the wells, and incubated for 25 min. The absorbance was measured at 450 nm, and results were adjusted for protein concentration.
FFA quantification
Tissue lipids were extracted from the harvested kidney as previously described (6). Briefly, 15 mg of tissue was homogenized in 300 μl chloroform/1% Triton X-100 and centrifuged at 10000 rpm for 10 min. After centrifugation, the lower clear organic phase was collected, and extracted lipids were lyophilized. The concentration of long-chain FFA was measured enzymatically by conversion to acyl-CoA esters catalyzed by acyl-CoA synthetase, followed by oxidation with production of hydrogen peroxide that was assessed colorimetrically using a commercial available assay (FFA Quantification kit) according to the manufacturer's instructions. Lyophilized lipids were solubilized in 250 μl of assay buffer, and 30 μl of the solubilized sample was used in the assay. The final concentration of FFA was calculated from the absorbance values measured at 570 nm. Peroxisomal acyl-CoA enzymatic activity was measured in the peroxisome-enriched fraction as described earlier (43).
MDA measurement
Kidney concentration of MDA was analyzed using the Lipid Peroxidation assay (Abcam), based on an improved thiobarbituric acid method. Briefly, 10 mg of kidney tissue was homogenized on ice in 300 μl MDA lysis buffer, and centrifuged at 14000 rpm for 10 min. Next, 200 μl of the supernatant was mixed with 600 μl of thiobarbituric acid and heated at 95°C for 45 min. After cooling to room temperature, 200 μl of the solution was transferred into a 96-well microplate, and the absorbance was read at 530 nm with a microplate reader. Since MDA assays based on thiobarbituric acid are not reliable when analyzing urine samples (presence of chromogens), urinary MDA concentration was examined using a modified method described by Yalçın (51). Briefly, the reaction mixture was prepared by dissolving 1 ml phosphoric acid, 1 g sodium metabisulfite, and 0.5 g basic fuchsin (all from Sigma) in 100 ml of water. After 2 h of incubation, protected from light, 3 g of activated carbon was added. Five microliters of filtered reaction mixture was mixed with diluted urine sample (15 μl urine+480 μl water). Finally, 150 μl of the mixture was transferred to a 96-well plate (Costar EIA Plate; Fisher Scientific), and absorbance was measured at 545 nm with a microplate reader.
Statistical analyses
All experiments were repeated at least three times, and results are presented as mean values±SE. Data sets were tested for normal distribution, and the differences between groups were analyzed with t-test or Mann–Whitney test, as appropriate, using SPSS statistical package (SPSS 17). p values<0.05 were considered significant.
Footnotes
Acknowledgments
This work was supported by a grant from Dr. Werner Jackstaedt Foundation (RV) and grants DK54602, DK052783, and DK45462 from the National Institutes of Health and Westchester Artificial Kidney Foundation (MSG).
Author Disclosure Statement
No competing financial interests exist.
Abbreviations Used
References
Supplementary Material
Please find the following supplemental material available below.
For Open Access articles published under a Creative Commons License, all supplemental material carries the same license as the article it is associated with.
For non-Open Access articles published, all supplemental material carries a non-exclusive license, and permission requests for re-use of supplemental material or any part of supplemental material shall be sent directly to the copyright owner as specified in the copyright notice associated with the article.