
Abstract
Introduction
E
We provide evidence and molecular explanation for the existence of a critical window of effectiveness of estrogen replacement therapy (ERT) after ovariectomy in animals. This applies not only to the well-known antioxidant effect of estrogens, but also to whole body metabolism and even to glucose transport into the brain as measured in vivo. These results may have clinical relevance and underpin the importance of starting ERT soon after menopause.
Some serious studies in women (Women's Health Initiative Memory Study [WHIMS], Women's Health Initiative Study of Cognitive Aging [WHISCA]) reject hormone replacement therapy with estrogen in humans, and thus, the clinical use of ERT is controversial and even nonrecommended (34, 38, 44)
A critical time period was postulated as a possibility to explain this controversy (33). When therapy does not start immediately after menopause, many favorable clinical effects disappear (33, 43, 50).
The mechanism of the favorable effects of estrogen has not yet been investigated in depth. We have used experimental ovariectomy as a model to study the effects of estrogen deprivation (which occurs in menopause) because age-associated abrupt estrogen deprivation in rats or mice, does not take place, as it does in humans.
The main aim of this work was to provide molecular basis to explain the Critical Time ERT Hypothesis by measuring oxidative stress, metabolomic profiles, and in vivo brain glucose uptake in Wistar rats, starting ERT at different periods after ovariectomy. Our results show that estrogen deprivation causes oxidative stress that may be prevented by ERT only if started immediately after ovariectomy. When three or more weeks elapsed between ovariectomy and ERT, the protective effect is lost. We think that this is because there is a change in the proportion of estrogens receptors, as the ERα/ERβ increases after ovariectomy and this is only prevented when ERT starts immediately after ovariectomy. The metabolomic profile and in vivo brain glucose uptake show a similar pattern, that is, only early onset of ERT prevents the undesirable effects of estrogen deprivation caused by ovariectomy.
Results
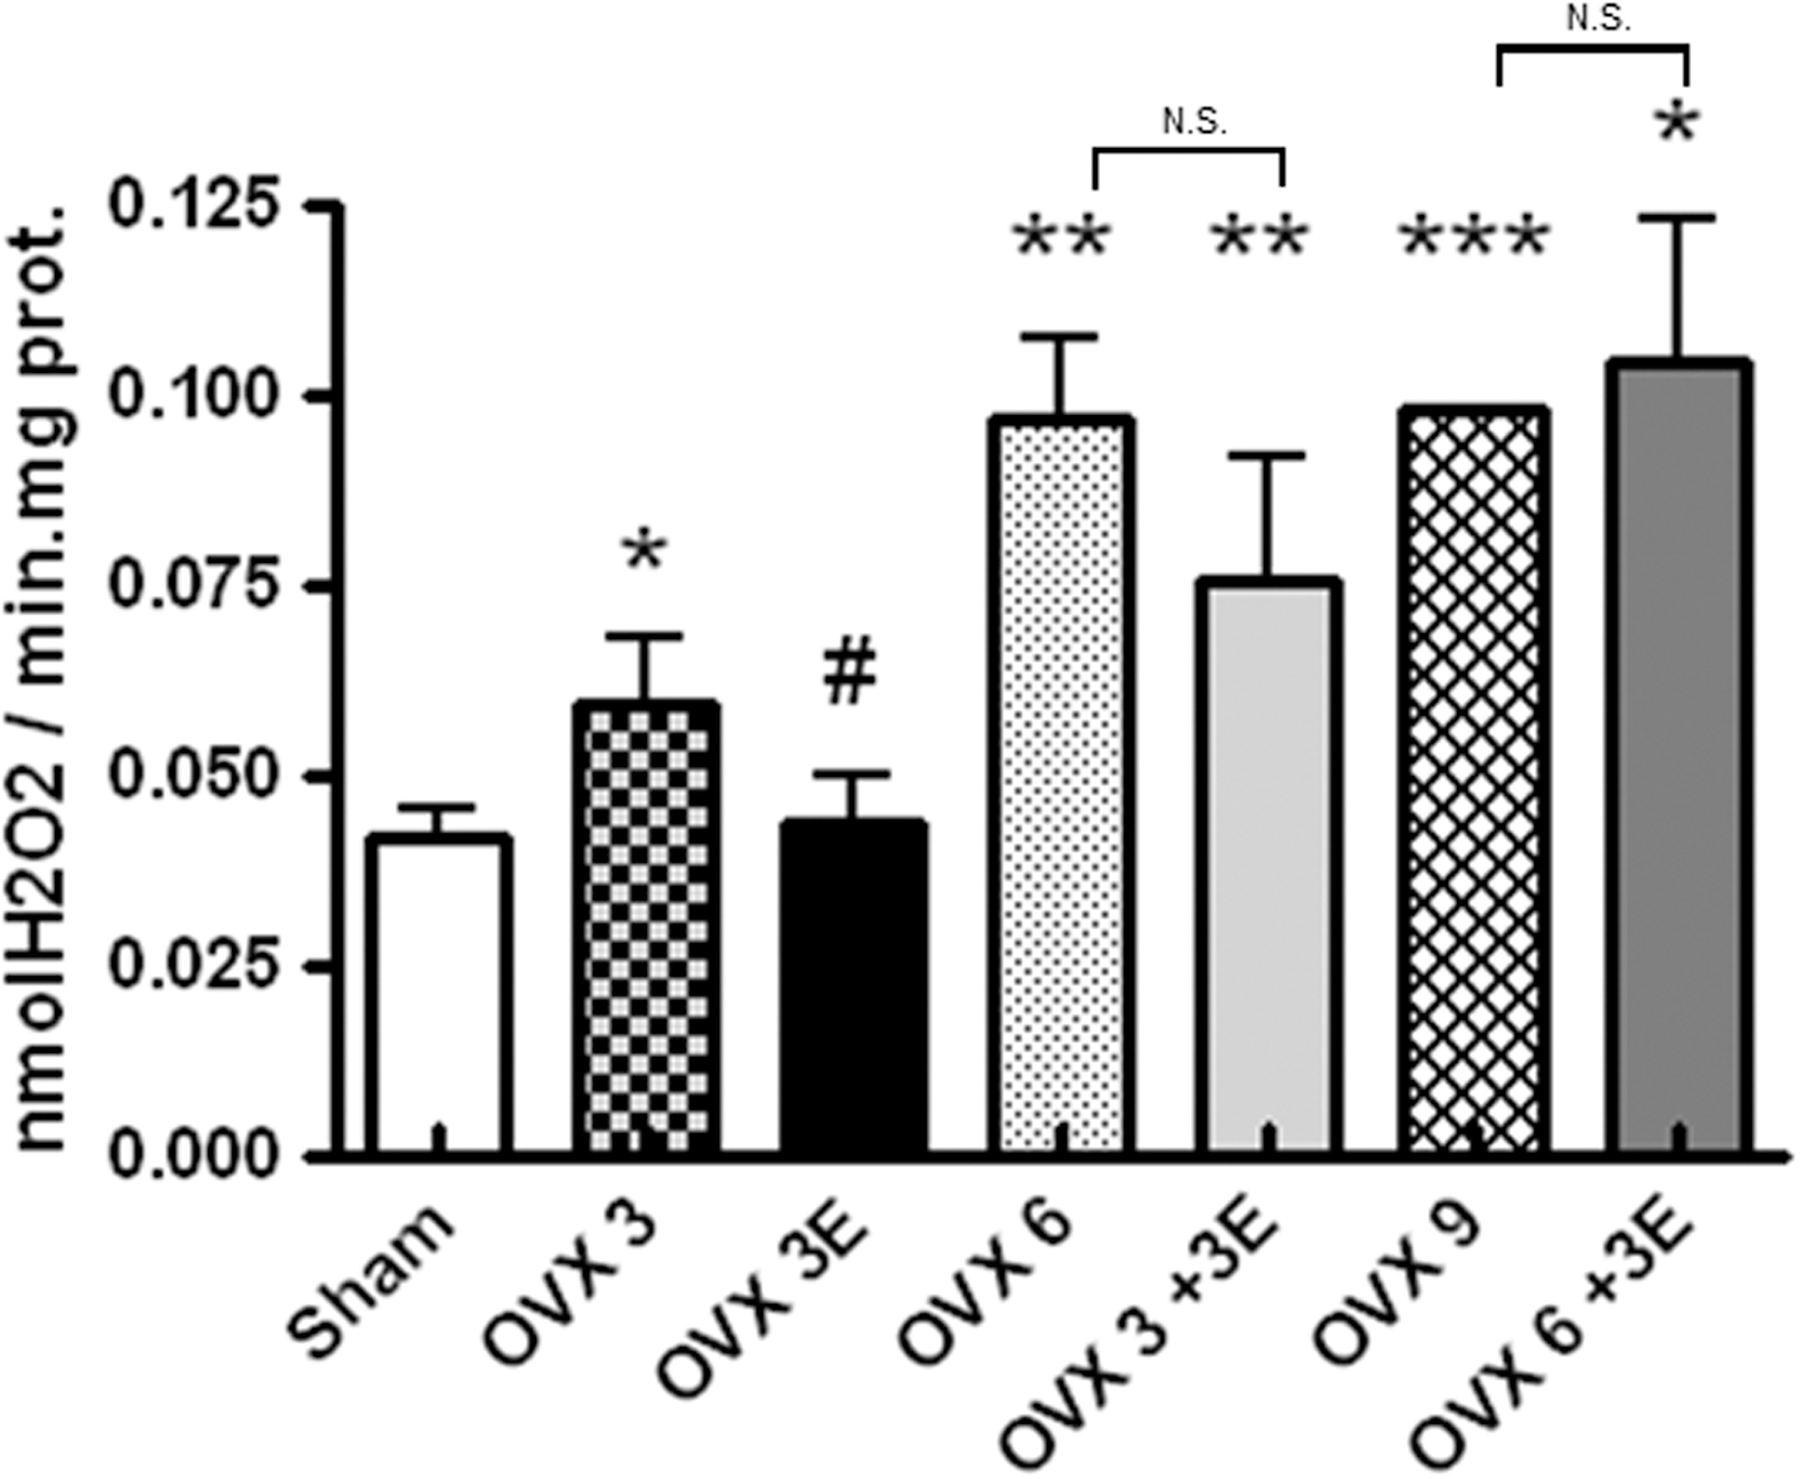
Ovariectomy increases peroxide production: prevention by early onset ERT
We evaluated the rate of peroxide production by hepatic mitochondria of ovariectomized rats treated with ERT at different times (Fig. 1). In all cases, mitochondria from ovariectomized rats produced significantly more peroxides than those from sham operated rats (controls). The effect seemed to increase with time after ovariectomy, but plateaued after 6 weeks. ERT when applied immediately after ovariectomy (OVX 3E) significantly protected against the increase in peroxides caused by ovariectomy. The protective effects of estradiol did not occur when ERT was started 3 or 6 weeks after ovariectomy. Thus, there is a window of opportunity for ERT to occur only immediately after ovariectomy. If, however, a significant amount of time passed before the onset of ERT, its beneficial effects disappeared.
Ovariectomy causes oxidative damage to lipids and to proteins, which is prevented by early, but not late, ERT
Ovariectomy caused a significant increase in lipid peroxidation as determined by malondialdehyde (MDA) formation in hepatic mitochondria that was already evident 3 weeks after ovariectomy (Fig. 2A). This was prevented by ERT when started immediately after ovariectomy. In contrast ERT, when started 3 or 6 weeks after ovariectomy, did not show any protective effect (Fig. 2A). Protein oxidation followed the same pattern as lipid oxidation (Fig. 2B).

Ovariectomy decreases cellular antioxidant defenses: prevention by early onset ERT
Figure 3 shows that ovariectomy causes a decrease in the activity of two critical peroxide-catabolizing enzymes, namely, glutathione peroxidase (located in mitochondria) and catalase (located in the cytosol).

Ovariectomy results in a significant decrease in the activity of hepatic glutathione peroxidase (Fig. 3A) or catalase (Fig. 3B). This decrease persists for 3, 6, or even 9 weeks. ERT prevents this effect only when administered immediately after ovariectomy. When we waited for three or more weeks to start this therapy, its protective effects were lost.
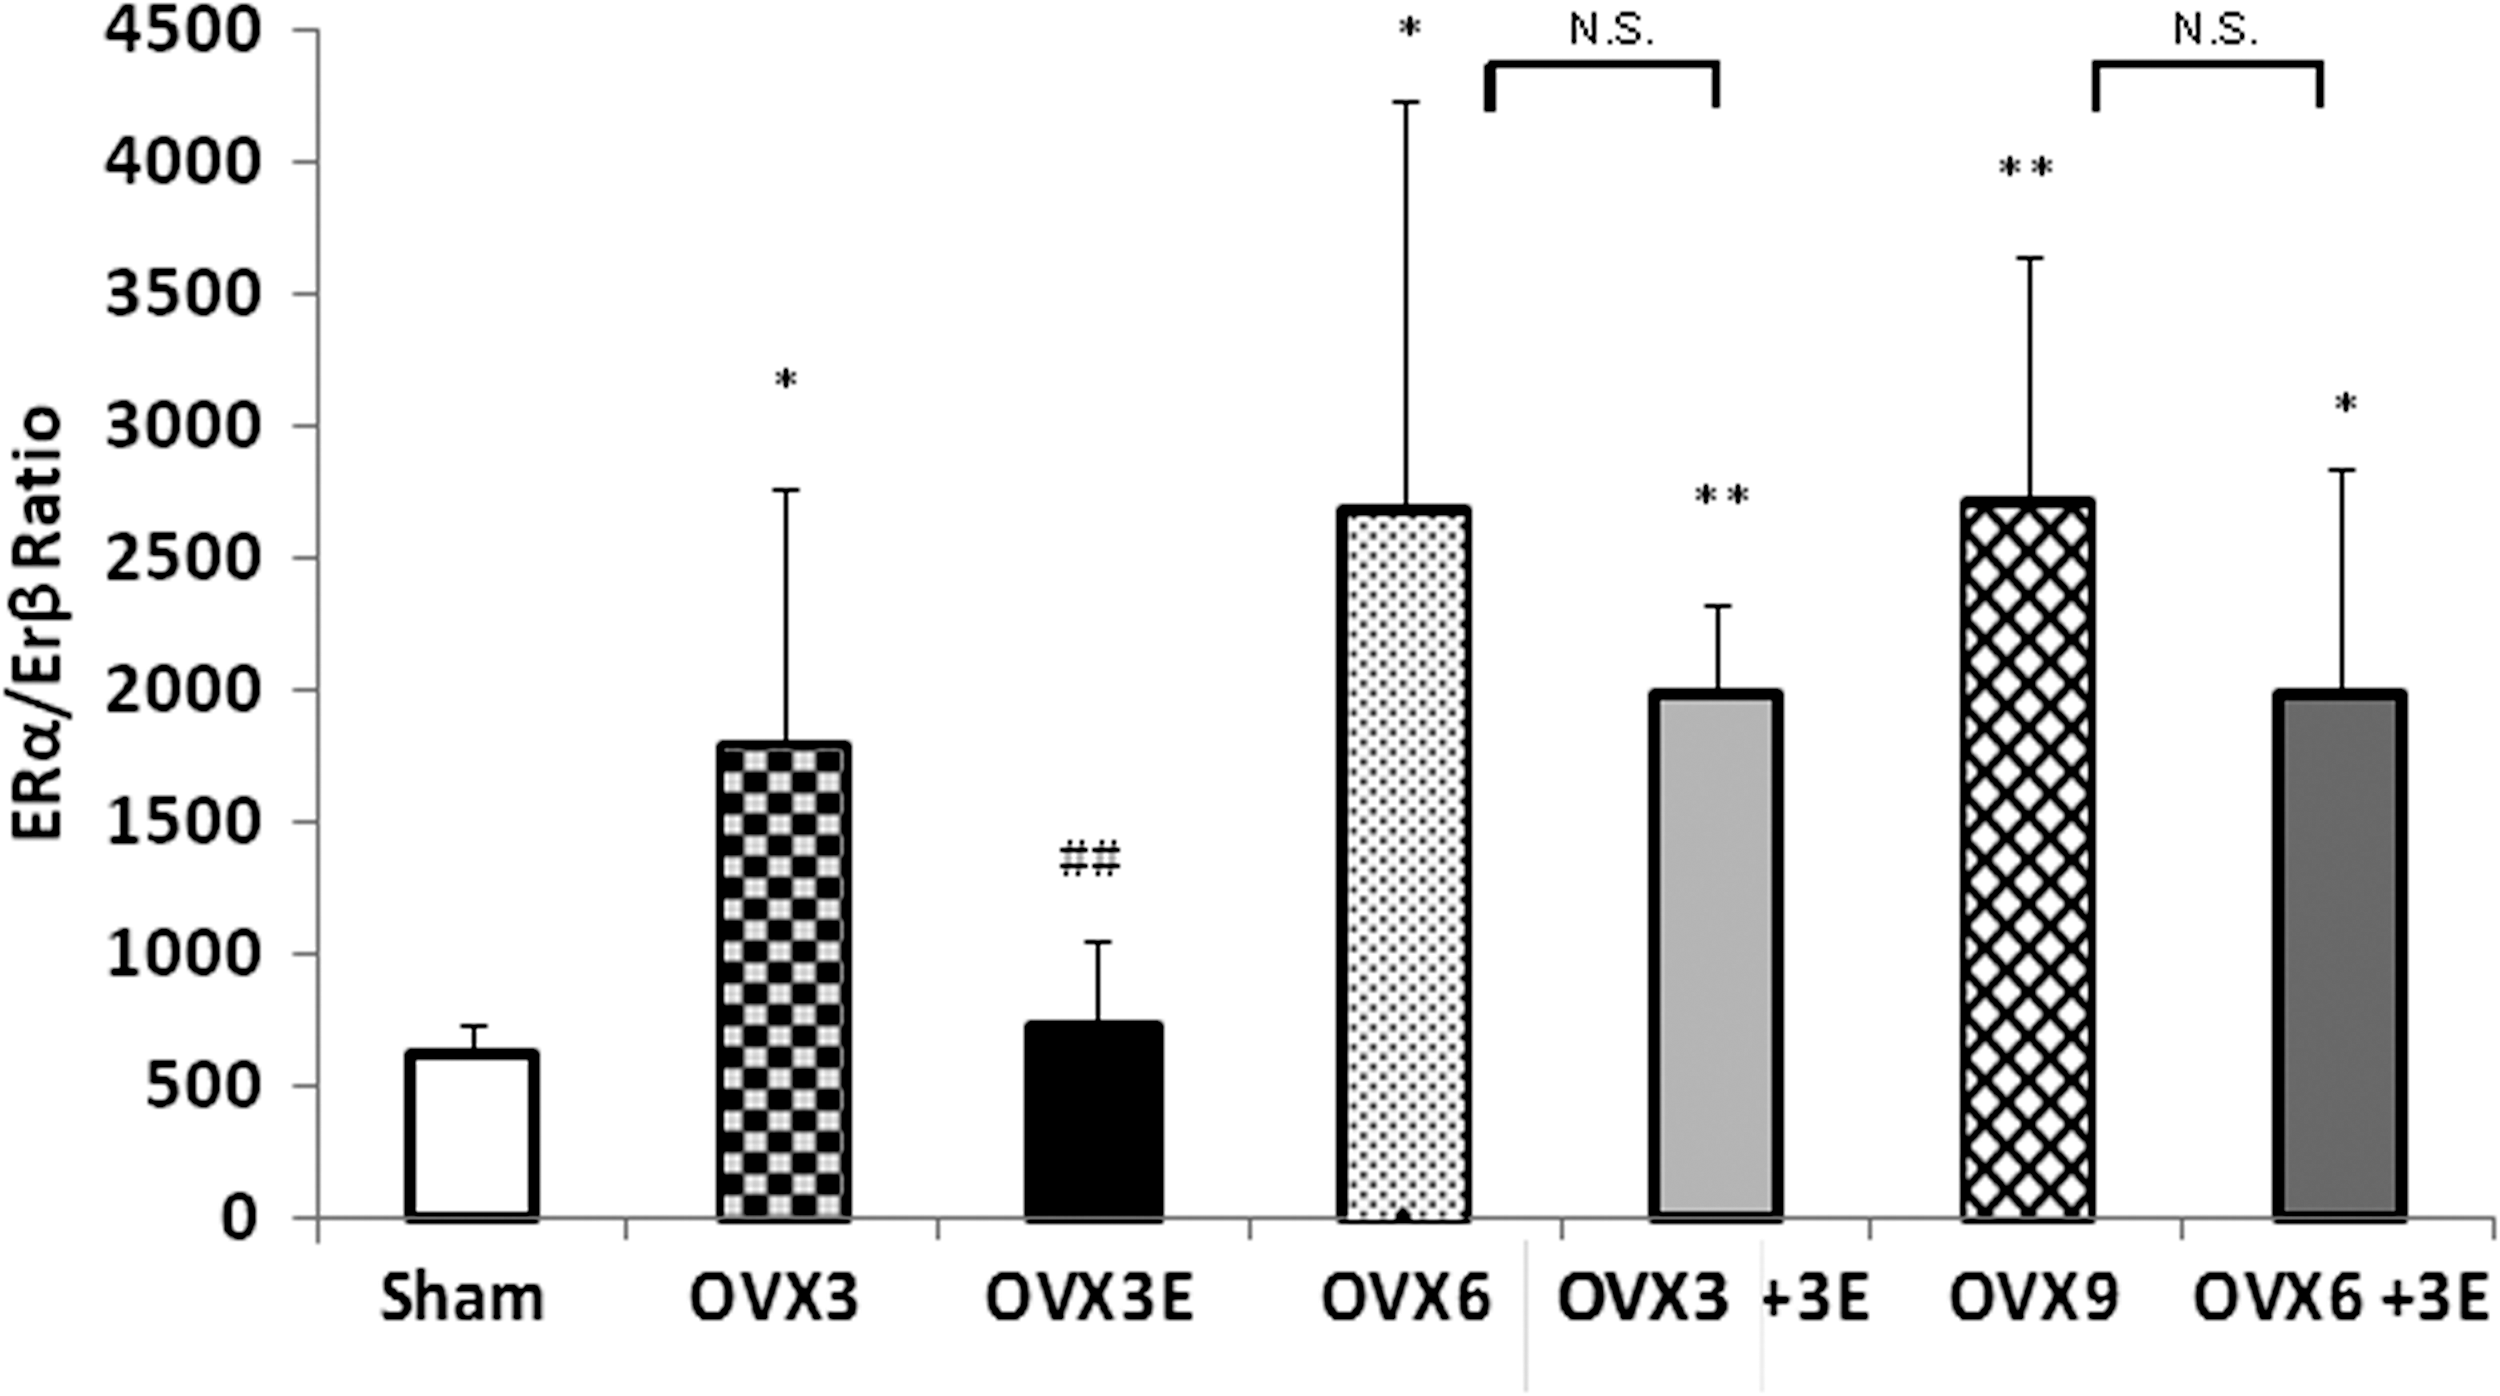
Ovariectomy affects the expression of estrogen receptors: prevention by early onset ERT
The estrogen receptor (ER) α/β ratio appears important to explain the observed differences in the response to ERT (9). It is higher in ovariectomized than in sham operated rats. This is reversed by immediate replacement therapy, but not when estrogens are administered 3 or 6 weeks after ovariectomy. The effect of receptors is mainly on ERα (and not so much in ERβ i.e., those involved in antioxidant protection). Our new experiments thus suggest that the window of opportunity for the favorable effects of ERT depends on its differential effects on each isoform of ERs. The proportion of them changes with ovariectomy and only ERT immediately after ovariectomy can prevent this alteration. These results are shown in Figure 4.
Ovariectomy decreases glucose uptake by the brain in vivo: prevention by early onset ERT
Figure 5A shows that brains from old animals take up significantly less glucose in vivo than those from young ones. Ovariectomy also causes a significant decrease in glucose uptake. In fact, glucose uptake by the brain of ovariectomized young animals is similar to that of old ones and significantly lower than the corresponding controls.
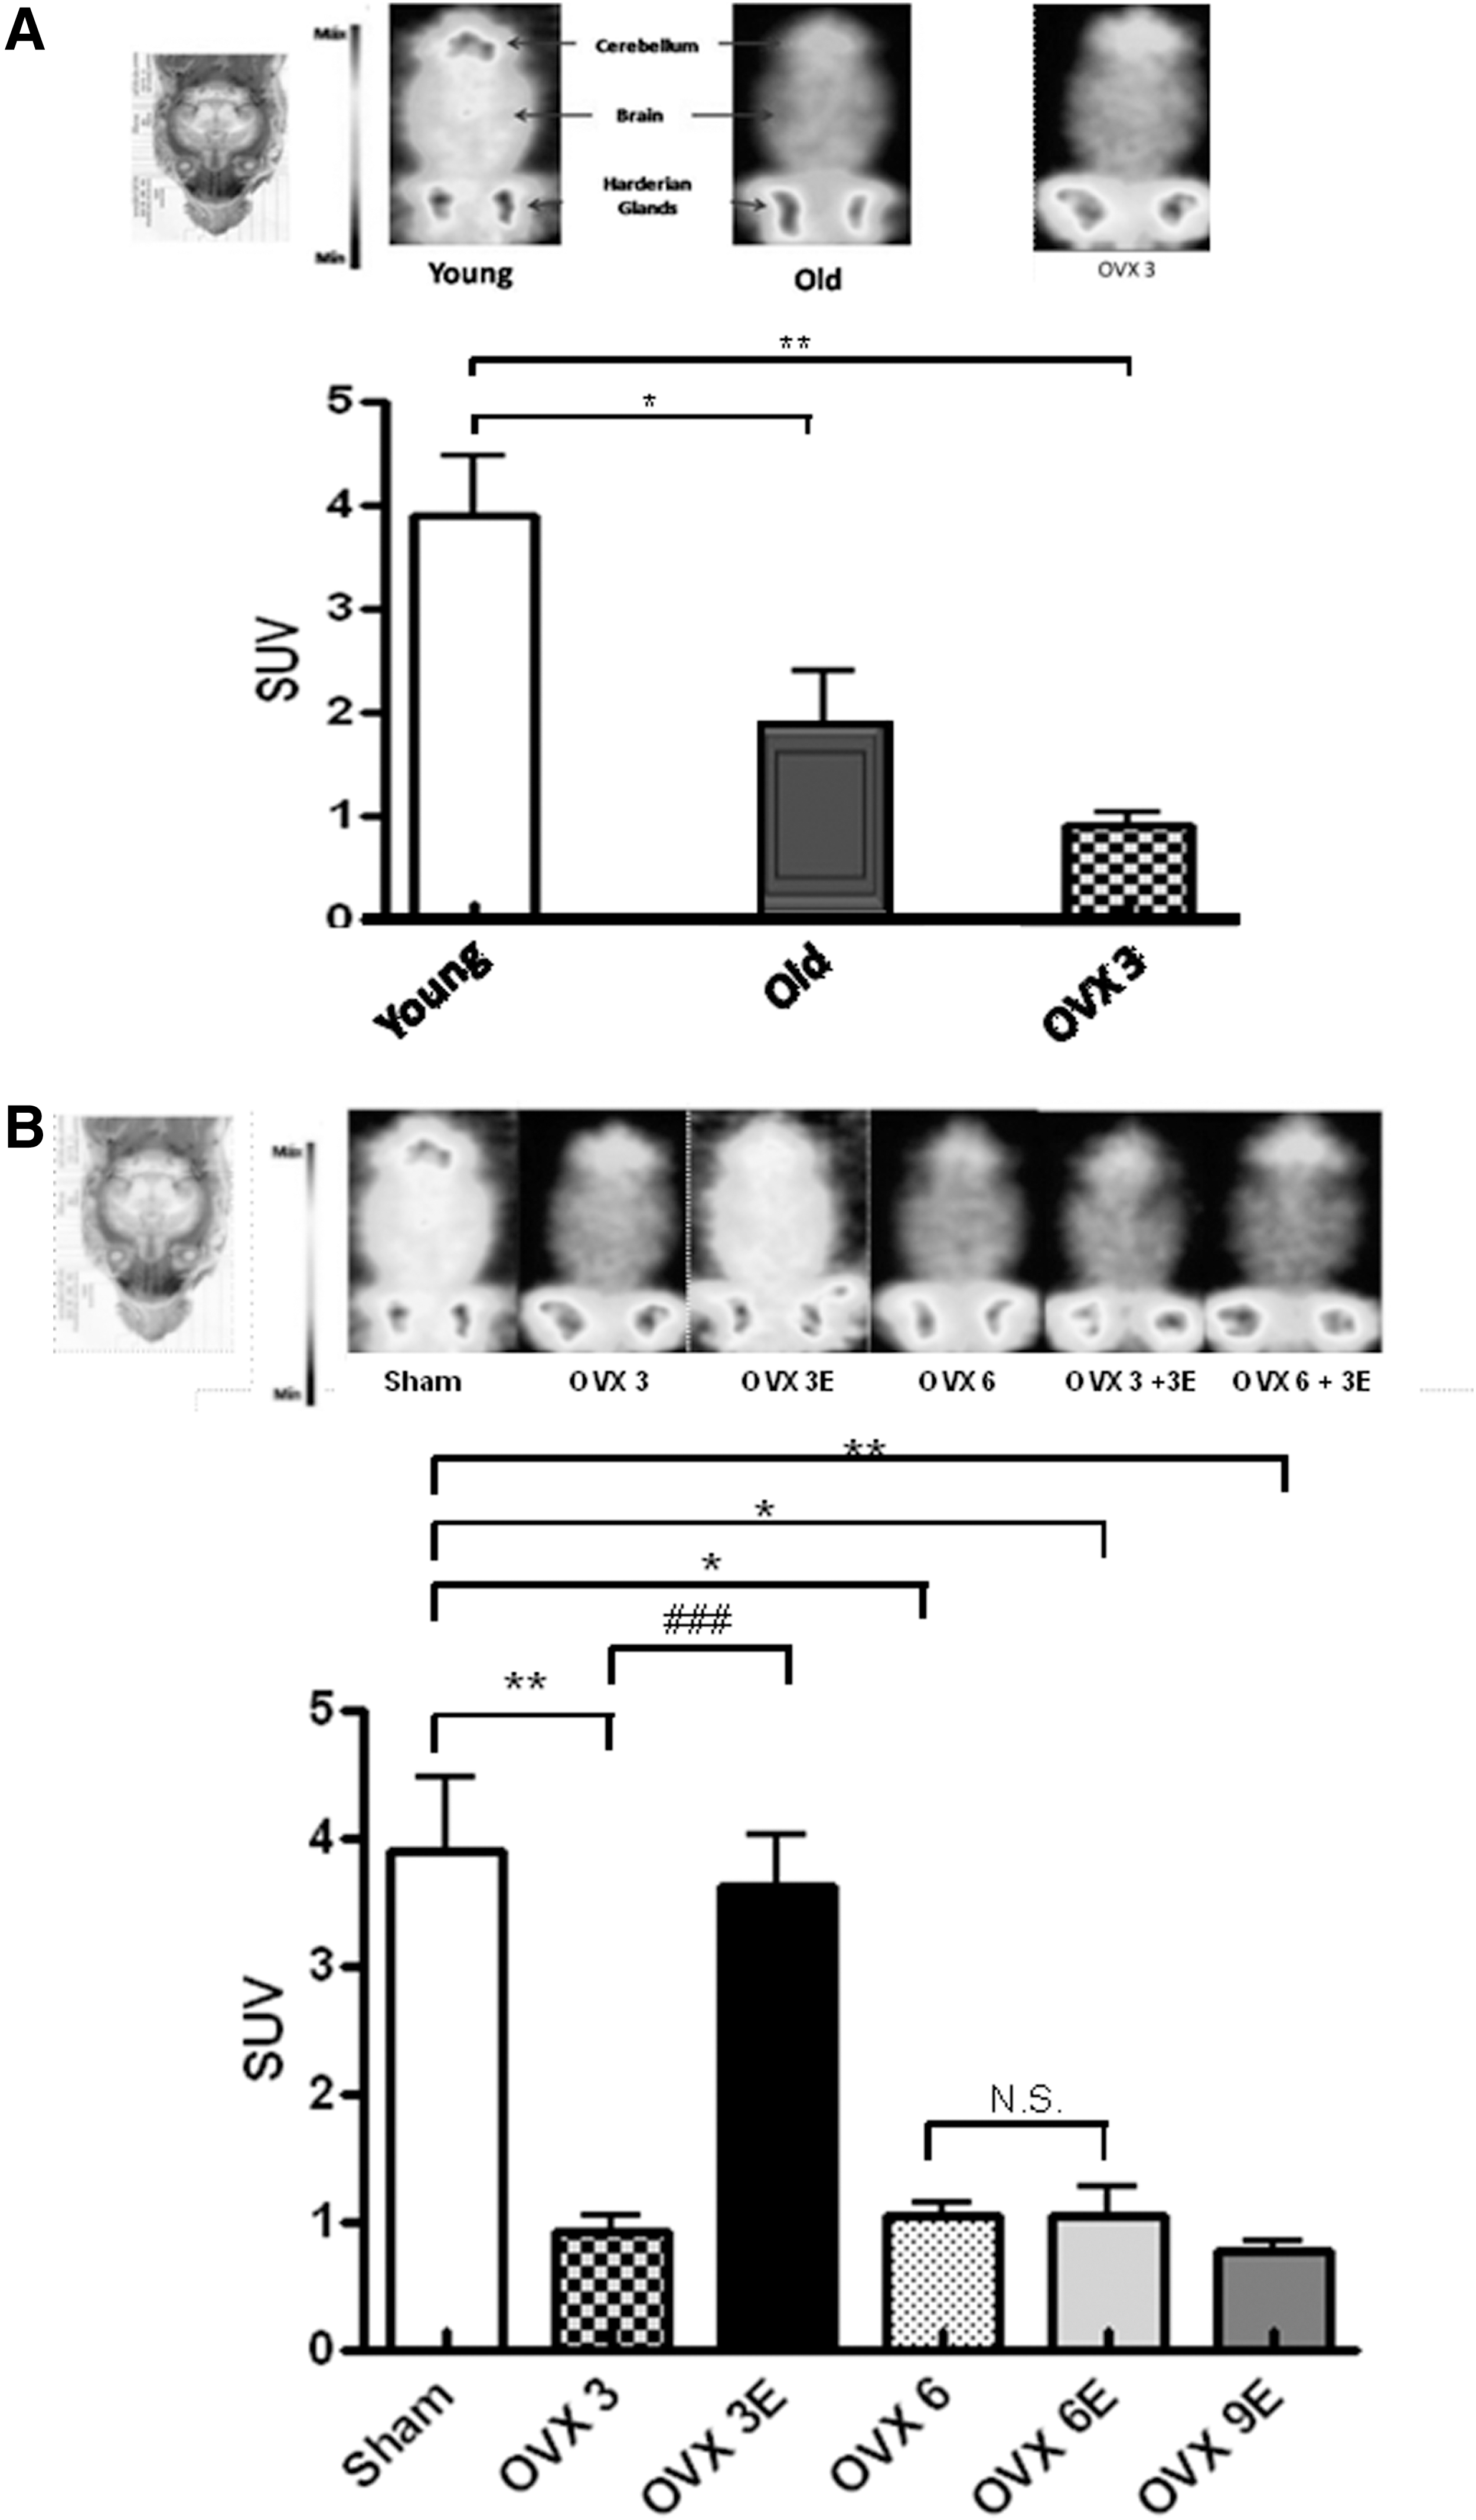
Figure 5B shows that early onset ERT causes an almost complete protection against the pronounced lowering of glucose uptake by the brain caused by ovariectomy. This is in keeping with the findings that we report here regarding oxidative stress and again indicates that it is critically important to start ERT immediately after estrogen deprivation.
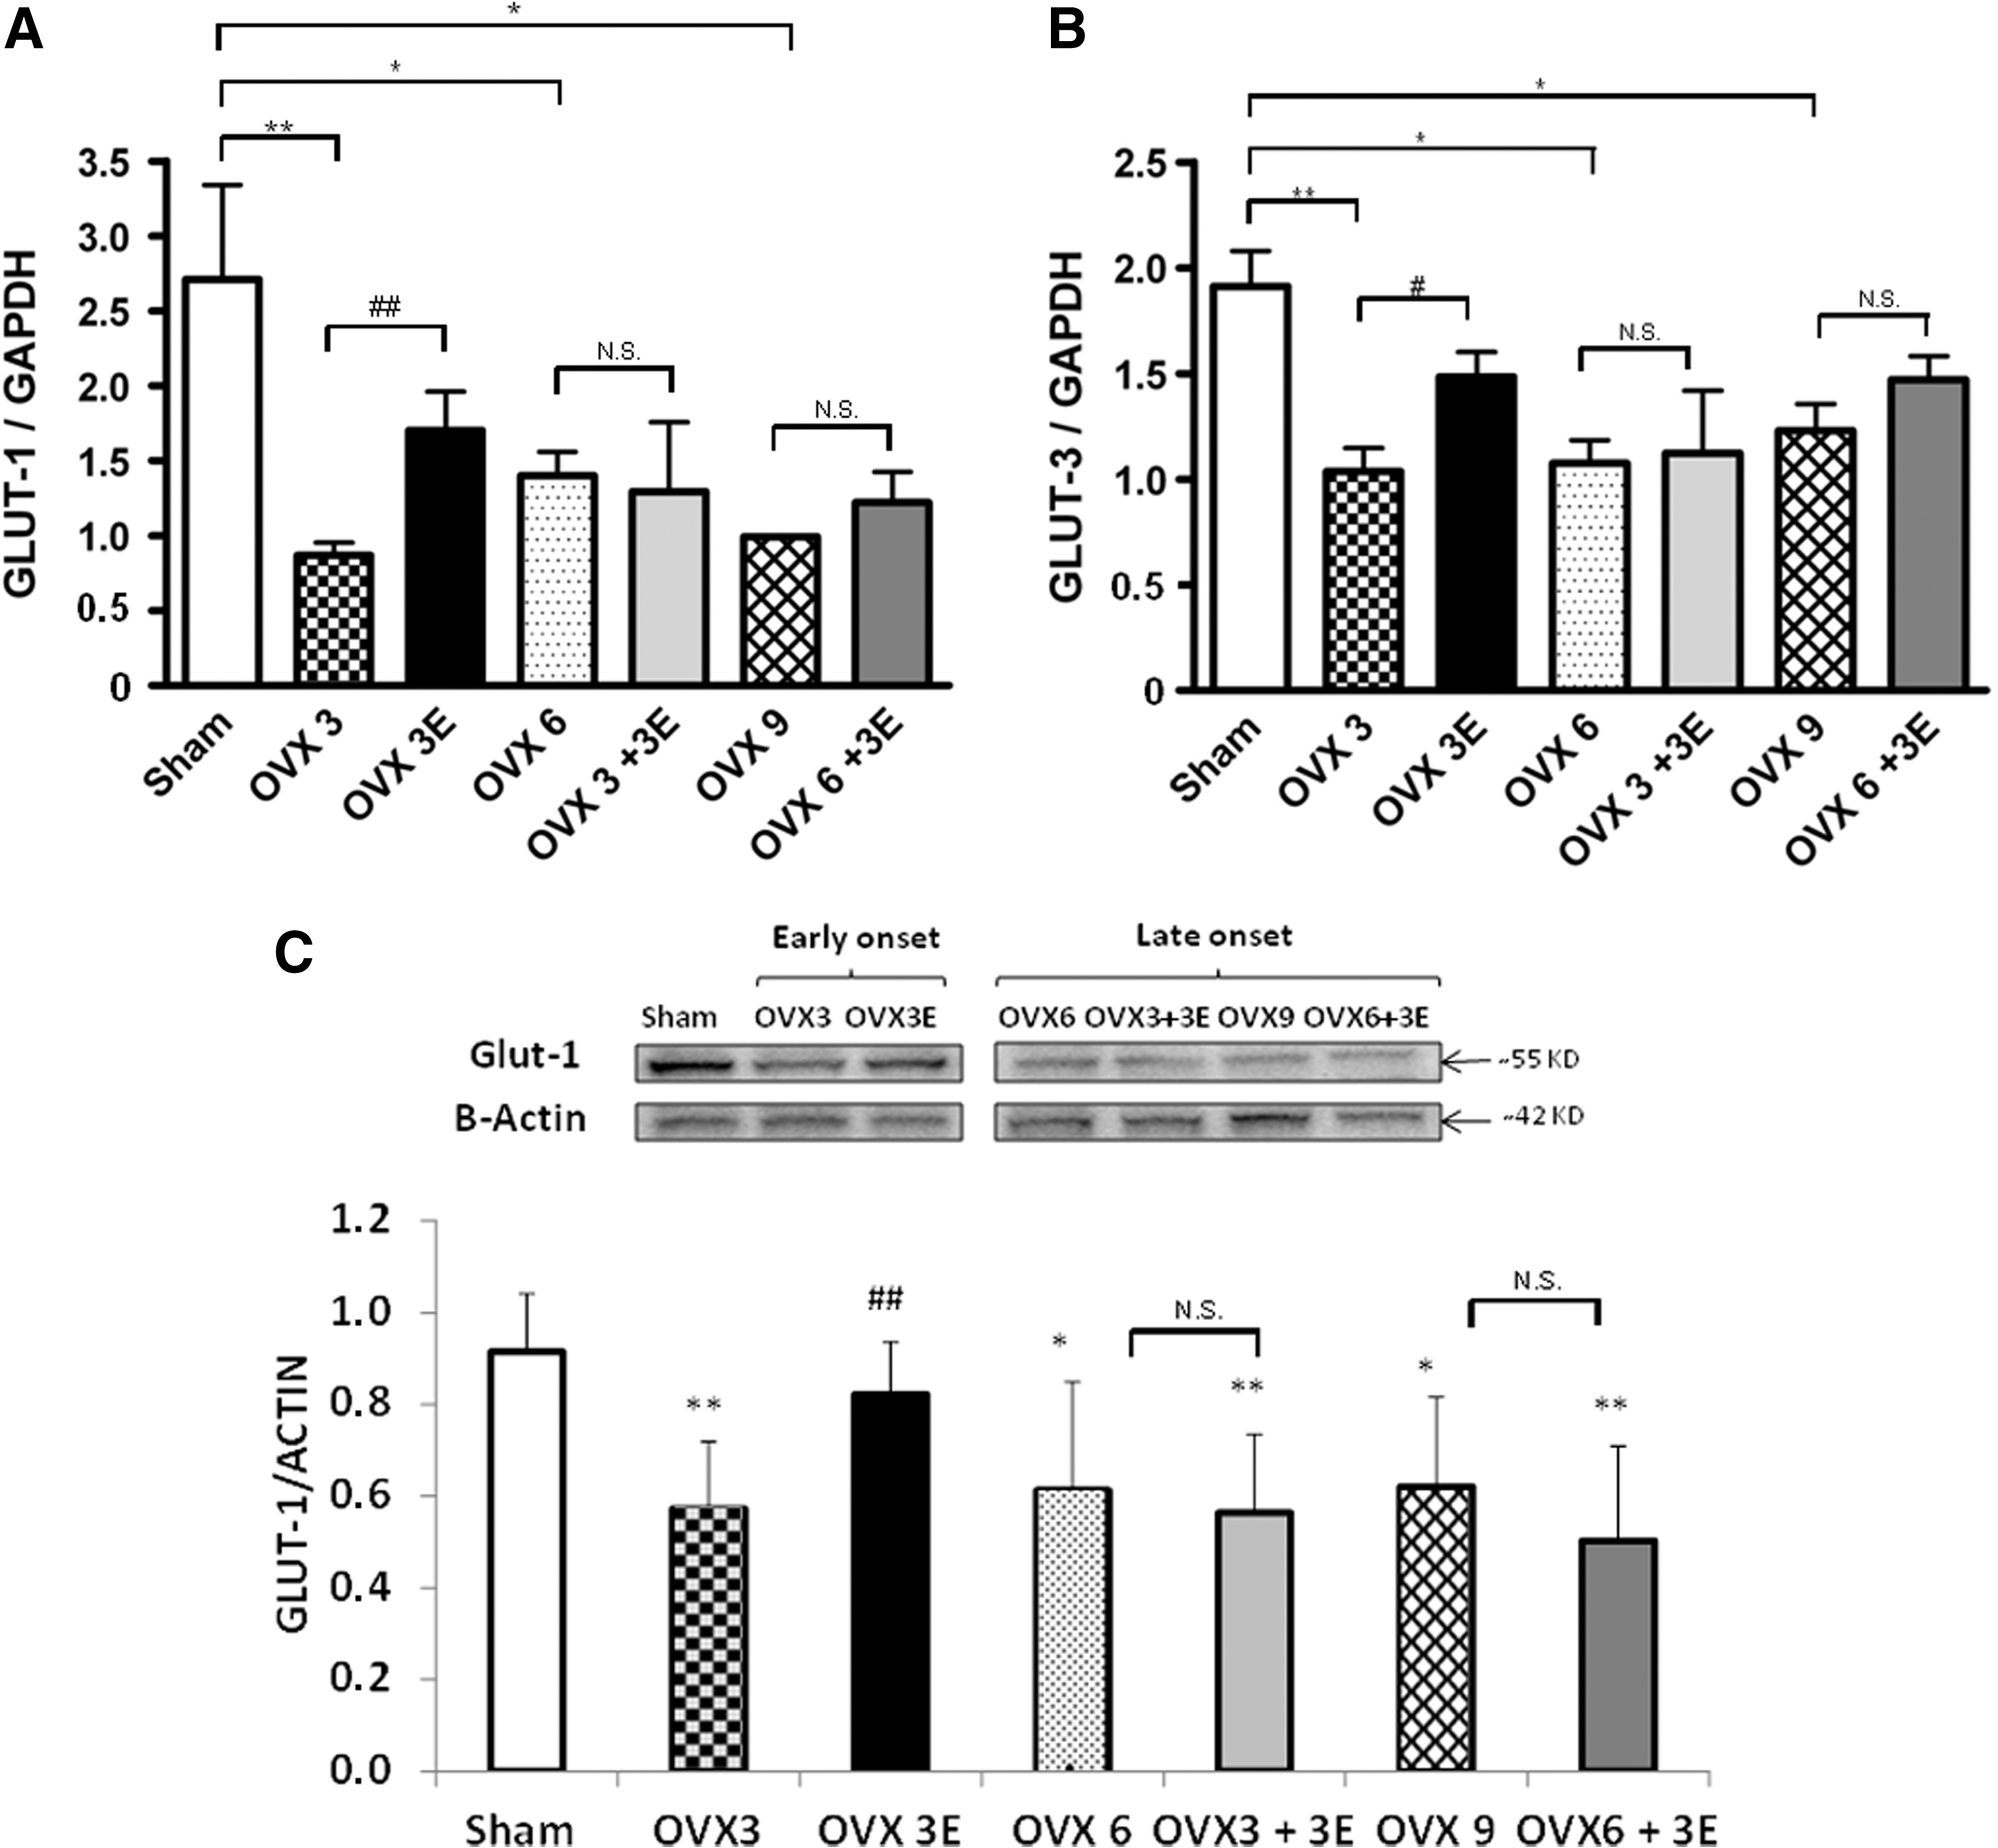
Ovariectomy decreases the expression of glucose transporters in brain: prevention by early onset ERT
Glucose is transported into brain cells using glucose transporters such as GLUT-1 and GLUT-3.
Figure 6A shows the effect of ovariectomy and ERT on the mRNA expression of GLUT-1. A decrease in the expression of this glucose transporter occurred 3, 6, or 9 weeks after ovariectomy. When ERT was started immediately after ovariectomy, the lowering of GLUT-1 in the brain was partially prevented. This protective effect did not occur when we began ERT 3 or 6 weeks after ovariectomy. Figure 6B shows the effect of ovariectomy and ERT on GLUT-3 mRNA expression in the brain. We observed exactly the same pattern as with GLUT-1, that is, ovariectomy lowered the expression of GLUT-3 and ERT, when started immediately after ovariectomy, partially prevented it. The protective effect of estrogen replacement disappeared when we waited 3 or 6 weeks before the onset of this therapy. Figure 6C shows protein expression of GLUT-1, where we can observe the same pattern as in the mRNA levels.
We also determined the effect of ovariectomy and ERT on the expression of endothelial nitric oxide synthase (eNOS) in the brain. The idea behind the experiment was that it could be possible that the observed effects of ovariectomy and ERT could be mediated by changes in blood flow (31). Since these are mediated to a great extent by the production of nitric oxide by eNOS, we determined the expression of this enzyme in the brain. We did not observe any change in the expression of eNOS with ovariectomy, although we found an eNOS upregulation with immediate ERT as other authors have shown before (31) (see Supplementary Fig. S3; Supplementary Data are available online at
Metabolic characterization of ovariectomized rats
Metabolomics offers a unique opportunity to study global metabolic profiles in animals (or persons) in different physiological and pathophysiological situations.
The principal components analysis (PCA) shown in Figure 7 scores plot of our plasma metabolomic data. The distance between samples in the PCA space represents differences in global metabolic profiles. Samples from rats treated with early onset ERT (enclosed in the dashed line ellipsoid) are close in the PCA space to those of controls rats, that is, sham operated rats (white circles), representing a similar global metabolic profile. On the contrary, samples from ovariectomized rats as well as from rats treated with late onset ERT (enclosed in the continuous line ellipsoid) are clustered together and farther in the PCA space, representing a different metabolic profile, to those from control rats.

Discussion
The critical window of effectiveness of ERT
The main findings reported in this article are that early ERT prevents the rise in mitochondrial peroxide production, in markers of oxidative damage, adaptations in antioxidant defenses, and metabolic alterations caused by ovariectomy. However, these protective effects do not take place when estrogen replacement starts late after ovariectomy. This may be explained, at least in part, because the proportion of ERs (α and β) change in ovariectomy and these changes may be prevented by early, but not late, ERT.
We have used ovariectomy in an attempt to use a murine model of menopause. Unlike women, estrogen concentrations do not fall with age; thus, ovariectomy is probably the best model of estrogen deprivation in rats.
The indication of ERT for menopause is controversial with some studies showing beneficial and some adverse results. The WHI study (38) was interrupted prematurely because researchers could not find the expected beneficial cardiovascular effects and furthermore, an increase in the incidence of cancer was observed. Similar results were obtained in the Heart and Estrogen/Progestin Replacement Study (HERS study) (18, 23). Importantly, in both studies, the age of the women given ERT was 65 years or more. The PEPI study (Postmenopausal Estrogen/Progestin Interventions prospective trial) was conducted on healthy postmenopausal women between 45 and 64 years of age; it showed that ERT lowers cardiovascular events after estrogen deprivation (1). These results were confirmed by other studies (4, 14, 22, 26, 45).
Recent studies confirm that the time elapsed after menopause is a relevant factor when taking the decision to recommend hormone replacement therapy (33, 37, 50). Indeed, a very recent study, showed that “After 10 years of randomised treatment, women receiving hormone replacement therapy early after menopause had a significantly reduced risk of mortality, heart failure, or myocardial infarction, without any apparent increase in risk of cancer, venous thromboembolism, or stroke,” thus suggesting that the therapy is beneficial (42).
The antioxidant effects of estrogens
In the past, we attributed the higher longevity of female rats to the antioxidant effect of estrogens (11, 40, 46, 47). This effect is not dependent on the chemical structure of the estrogens themselves (due to the phenolic A ring in the structure of estrogens, as originally thought (39), but rather to the hormonal effects. However, estrogens can also prevent oxidative stress and the cytochrome c-related release directly in isolated mitochondria (10).
Within the cell, estrogens bind to membrane-bound ERs, activate the MAP kinase–NFκB pathway and increase transcription of antioxidant enzymes, especially glutathione peroxidase and superoxide dismutase 2 (i.e., the mitochondrial isoform) (9). Thus, the antioxidant effect of estrogens is indirect: they mediate the upregulation of the expression of powerful antioxidant enzymes. In this study, we have found that the antioxidant effect of estrogens is lost when ERT starts three or more weeks after ovariectomy (See Figs. 1 and 2).
Figure 3 shows that glutathione peroxidase and catalase activities are lowered in ovariectomized rats and they are upregulated when these rats are treated immediately after ovariectomy, but not when three or more weeks pass by between the ovariectomy and the commencement of ERT.
To find a mechanism that could explain the differential effect of ERT depending on when the therapy starts, we studied the expression of ERs, because as we have mentioned before, ERs are involved in the antioxidant effect of estrogens (9). We found that indeed, there is a change in the proportion of ERα and β subtypes. Ovariectomy increases the ERα/ERβ ratio, and this is only prevented when ERT is started immediately after ovariectomy. It is well known that ER subtypes have different functions among the body, as well as different distributions in the different tissues (19). A change in the physiological ERα/ERβ ratio can alter the function of estrogens, and this could explain, at least in part, that an early ERT- associated protective effect is lost when some time elapses from ovariectomy.
The free radical theory of aging has still many supporters (7, 8, 25, 27, 41), but has recently received serious criticisms (3, 21, 36). We have proposed (48) that the free radical theory of aging may explain some facts associated with aging, although it is not a comprehensive one and a more defined or extended theory should be proposed. In any case, our experiments on differential longevity between genders indicate that upregulation of antioxidant enzymes, in our case by early onset ERT, may be an important factor to promote longevity.
Metabolic effects of ovariectomy and ERT
The results that we have discussed so far have dealt mainly with the antioxidant effects of estrogens. However, the concept of the critical window for ERT extends to the full body metabolism and not only to the antioxidant effects of estrogens. We have studied glucose uptake in vivo (because it can be studied using experimental positron emission tomography [PET]) and metabolomic characterization of the animal (because plasma metabolomic profiles reflect systemic changes in whole body metabolism).
Figure 5 indicates that aging leads to a low brain glucose uptake in vivo (Fig. 5A) and that ovariectomy causes a severe decrease in glucose uptake by brain and that this is completely prevented when early, but not late, onset ERT takes place (Fig. 5B).
To explain the low glucose uptake as determined by PET, we tested whether glucose transported to the brain via the blood–brain barrier was affected by ovariectomy and replacement therapy. Moran et al. recently published that ovariectomy can alter the expression of glucose transporters and that estrogen replacement can prevent this decrease (30). Ovariectomy results in a depression of the expression of glucose transporters 1 and 3, that is, those present in the blood–brain barrier. This was partially prevented by ERT when started immediately after ovariectomy, but as with other parameters determined in this study, the protective effects were lost when 3 weeks elapsed between ovariectomy and the commencement of estrogen replacement (see Fig. 6). Therefore, the increase in glucose uptake by the brain as determined by PET is mainly due to the activation of transport into brain cells (neurons and astrocytes). In any case, the changes in glucose uptake by the brain are completely reversed when estrogen replacement takes place immediately after ovariectomy. Metabolomics offers a unique opportunity to study global metabolic profiles in animals (or persons) in different physiological and pathophysiological situations. The effects we have observed on both the metabolism of reactive oxygen species (see Figs. 1 –3) as well as on glucose uptake in vivo (see Fig. 5) prompted us to determine the metabolic profiles of these animals using the PCA of NMR spectra in plasma.
Figure 7 shows that the metabolic profile of control animals and those that have undergone ovariectomy are very different. In animals treated with ERT starting immediately after ovariectomy, the metabolomic profile of these animals is very similar to that of controls. The PCA of the metabolomic profiles in the plasma of the animals is a good indication of whole body metabolism and shows that the protective effects of estrogens not only refer to the antioxidant state of the animal, but also to profound changes in the whole body metabolism. Thus, ovariectomy does indeed causes a change in the metabolic profile of animals that is prevented by early, but not late, ERT.
The general conclusion of this article is that starting ERT as soon as possible after estrogen deprivation is important to obtain the beneficial effects of this therapy.
Materials and Methods
Experimental animals
Four- and 7-month-old female Wistar rats were used. In some experiments (reported in Fig. 5), 22–24-month-old female Wistar rats were used. Rats were stored at the animal house of the Faculty of Medicine of the University of Valencia. Handling, supervision, and experimentation with rats were done in accordance to the recommendations of the Federation of European Laboratory Animal Science Associations. All the work complies with both the national and EU legislation—Spanish Royal Decree RD 1201/2005 and EU Directive 86/609/CEE as modified by 2003/65/CE—for the protection of animals used for research experimentation and other scientific purposes. All protocols were previously subjected and approved by the Ethics Committee of the University of Valencia.
Animals were housed at constant temperature and humidity and with a 12-h light/12-h dark cycle. They were fed on a standard laboratory diet (containing 590 g carbohydrates, 30 g lipids, and 160 g protein per kilogram of diet) and tap water ad libitum.
Ovariectomy was performed as follows: rats were anesthetized with ketamine (100 mg/Kg) and acepromazine (2.5 mg/kg). Abdominal skin was cut, the peritoneum was opened, both ovarian arteries were ligated, and both ovaries were removed. Sham operated rats underwent the same procedure, but ovarian arteries were not ligated and ovaries were not removed. Animals were allowed to recover for at least 3 weeks before experiments were performed. Estrogen levels after ovariectomy fell to about 10% of the controls (13). Where indicated, an ERT of 17ß-estradiol was given subcutaneously at a daily dose of 1 μg/kg body weight for 3 weeks. This results in an estrogen level similar to controls. This dose was chosen because it was shown that this estrogen dose does not cause changes in the liver weight or increases in the DNA content (32).
Female rats we divided into seven groups: sham operated (Sham), ovariectomized for 3 weeks (OVX 3), ovariectomized for 6 weeks (OVX 6), ovariectomized for 9 weeks (OVX 9), OVX 3 and immediately replaced with estradiol (OVX 3E), OVX 3 and replaced with estradiol 3 weeks after ovariectomy (OVX 3+3E), ovariectomized for 6 weeks, and replaced with estradiol 6 weeks after ovariectomy (OVX 6+3E). We also included the replaced groups with vehicle instead of estradiol and we did not find any difference with the respective controls. Experimental design is shown in Supplementary Figure S4.
We have used different tissues in our studies. We measured the radical production and antioxidants in the liver because we have previously done so in basic experiments trying to understand why females live longer than males and why they produce lower oxidant production and we did this in the liver because mitochondria are much more uniform than those in the brain (12). This is the reason for our studies in antioxidant production in the liver. However, when trying to measure the glucose uptake, the brain is a much better tissue. The liver is characterized (classical as well as PET studies confirm this) by changing the glucose output dramatically from one situation to another. For instance, the liver can take up glucose or release it, depending on the particular metabolic moment of the animal. Thus, the liver (together with the kidney cortex) is the only tissue that can either release glucose or take it up. Glucose uptake by the liver is low and the PET signal is very low. This contrasts sharply with the case of brain. Therefore, the brain was the better choice to measure glucose uptake.
Finally, metabolomics is usually performed in serum/plasma. The reason for using plasma is twofold: first, this is the milieu used for human studies for obvious ethics reasons and secondly, plasma gives a general view of the metabolic situation of the animal.
Isolation of mitochondria
After the animals were sacrificed by cervical dislocation, their livers and brains were quickly removed. Liver mitochondria were obtained by differential centrifugation, as described by Rickwood et al. (35). We tested our isolated mitochondria to detect contamination and found no contamination (see Supplementary Figures S1 and S2).
Peroxide production
The rate of peroxide production was determined in isolated mitochondria using a modification of the method described by Barja (6). Briefly, mitochondria were incubated at 37°C with 10 mM succinate in 2 ml of the phosphate buffer, pH 7.4, containing 0.1 mM EGTA, 5 mM KH2PO4, 3 mM MgCl2, 145 mM KCL, 30 mM Hepes, 0.1 mM homovanilic acid, and 6 U/ml horseradish peroxidase. The incubation was stopped at 5, 10, and 15 min with 1 ml of cold 2 M glycine buffer containing 50 mM EDTA and 2.2 M NaOH. The fluorescence of supernatants was measured using 312 nm as excitation wavelength and 420 nm as emission wavelength. The rate of peroxide production was calculated using a standard curve of H2O2.
Measurement of oxidative stress parameters
Lipid peroxidation was determined as accumulation of MDA, which was detected by HPLC as an MDA-thiobarbituric acid adduct (49). Oxidative modification of total proteins was assessed by immunoblot detection of protein carbonyl groups using the OxyBlot protein oxidation kit (Intergen) following the manufacturer's instructions. The procedure to quantify total protein carbonyls with the OxyBlot kit was densitometry of the oxyblot and of the Ponceau staining, followed by finding the ratio between the total density in the oxyblot and the total density in the Ponceau.
Assays for enzyme activities
The glutathione peroxidase activity was measured as described in (16). Catalase was measured as in (2).
Quantitative real-time RT-PCR
Total RNA from tissues was extracted with Trizol (Life Technologies). Messenger RNA levels were measured by quantitative real-time polymerase chain reaction using the Tth DNA polymerase kit (Roche Diagnostics), as described by the manufacturer. Real-time quantitation of mRNAs for GLUT-1 and GLUT-3 relative to GAPDH mRNA was performed using the iCycler (Bio-Rad) with SYBR Green I detection. Target cDNAs were amplified in separate tubes: 10 min at 95°C, then 40 cycles of denaturation (95°C for 30 s) and annealing and extension (at 62°C for 1 min per cycle). The increase in fluorescence was measured during the extension step. The threshold cycle (Ct) was determined, and the relative gene expression was expressed as fold change=2(–ΔΔCt). Specific primers used were GLUT-1 5′-CCTGAGAGCCCCCGCTTCCT-3′ and 5′-TGCAGCACCACGGCGATGAG-3′, GLUT-3 5′-TGCACGGGCTTTGTGCCGAT-3′ and 5′- TCGGGGCAAAACGGAAGGGC-3′ and GAPDH, 5′-CCTGGAGAAACC TGCCAA GTA TG-3′ and 5′-GGTCCTCAGTGTAGCCCAAGATG-3′. The error bars correspond to the relative error of the 2(–ΔΔCt) values.
Immunoblot analysis
Protein extracts from hepatic isolated mitochondria or the brain from rats were mixed with equal volumes of the SDS buffer (0.125 M Tris–HCl, pH6.8, 2% SDS, 0.5% (v/v) 2-mercaptoethanol, 1% bromophenol blue, and 19% glycerol) and then boiled for 5 min. The protein concentration was determined using a modified Lowry method (12). Proteins were separated by SDS-PAGE gels and transferred to nitrocellulose membranes using standard techniques. Membranes were blocked with 5% dried milk in a Tris-buffer solution containing 0.05%Tween-20, and then incubated overnight at 4°C with the corresponding antibodies: β-actin (SIGMA-ALDRICH), PMP 70 (SIGMA-ALDRICH), and GLUT-1 (SIGMA-ALDRICH). The blots were washed three times with a washing buffer (phosphate-buffered saline, 0.2% Tween 20) for 15 min each time, and then incubated for 1 h with a secondary horseradish peroxidase-linked anti-rabbit IgG antibody (Cell Signaling Technologies). As above, the blots were washed three times and developed using the enhanced chemiluminescence procedure as specified by the manufactures (Amersham). Autoradiographic signals were assessed using a Bio-Rad scanning densitometer.
Determination of brain glucose uptake in vivo
Rats were deprived of food for 8–14 h before 18F-2-fluor-2-deoxiglucose (18F-FDG) injection. 18F-FDG (5.8–11.1 MBq) was injected intraperitoneally after anesthesia with isoflurane (1.5%–2% in 100% oxygen, IsoFlo; Abbott Laboratories). PET was started 60 min after 18F-FDG injection as described in (17). 18F-FDG was synthesized as previously described (20). The administered dose (FDG activity) was indeed corrected for body weight. We acquired 20-min static images 60 min after injection of 18F-FDG. The biodistribution of 18F-FDG by the heart was compared between all the studied groups. The PET images were obtained with the Albira small animal PET (ONCOVISION, GEM-Imaging). Regions of interest were manually drawn over the brain with PMOD software. Tracer uptake by the heart was quantified as the standardized uptake value (Total Sum).
Storage, preparation, and 1H NMR spectroscopic analysis of blood plasma
Rats' blood plasma were stored at −80C and thawed before use. For NMR analysis, 20 μl of plasma was mixed with 2 μl of D2O (as a field lock). A total of 20 μl of the mixture of each sample was then transferred into a 1-mm high-quality NMR capillary individually. All 1H NMR spectra were acquired using a standard one-dimensional pulse sequence with water suppression (Bruker Avance 600 spectrometer operating at 600.13 MHz with a 1 mm 1H/13C/15N TXI probe). A total of 256 FIDs (free induction decay) were collected into 64 k data points with a spectral width of 14 ppm and the recycle delay (RD) of 1 s. The water signal was saturated with a weak irradiation during the RD. Before Fourier transformation, the free induction decay was multiplied by a 0.3 Hz exponential line broadening. Spectral chemical shift referencing on the Alanine CH3 doublet signal at 1.475 ppm was performed in all spectra. Spectral regions between 0.5 and 4.5 ppm and between 5.5 and 9.5 ppm were binned in segments of 0.01 ppm width (6 Hz) for multivariate analysis. We normalized the binned data to the total spectral area. We used available spectral databases and 2D NMR experiments to aid structural identification of relevant metabolites. All spectra were processed using MNova (MestreLab) and transferred to MATLAB® (MathWorks, Inc., 2006) using in-house scripts for data analysis.
Multivariate analysis of NMR spectra
In multivariate data, the representation of any two variables against each other is not sufficient to obtain global correlations. PCA is a method for low-dimensional representation of multivariate data, in a way that optimally preserves the structure of the data. The PCA technique transforms variables in a data set into a smaller number of new latent variables called principal components (PCs), which are uncorrelated to each other and account for decreasing proportions of the total variance of the original variables. Based on the assumption that larger variances represent more information, each new PC is a linear combination of the original variation such that a compact description of the variation within the data set is generated. Samples are assigned scores according to the variation measured by the PC with those having similar scores clustering together. The scores plot of the PCs allows the observation of most variations in the data set using a low number of variables and the detection of internal relationships within the data. The loadings of the different PCs provide information on which variables contain more information. We used PLS_Toolbox 6.7 (Eigenvector Research) for MATLAB to build the PCAmodels. The PCA model was cross validated by the leave-on-out method providing a cross-validation RMS of 0.17. Hotelling's T2 for 95% interval of confidence was 12.15.
Statistical analysis
Results are expressed as mean±SD. Normality of distribution was checked with the Shapiro–Wilk test, and homogeneity of variance was tested by Levene's statistics. For real-time RT-PCR, differences between means were analyzed using a one-way ANOVA. The Tukey multiple comparisons test for all pairs of columns was applied as a post-test and p<0.05 taken as an indication of significance. A commercial software package (Kaleida Graph 3.6 Software) was used to perform the statistical analyses.
For the Western blot analysis, we used a one-factor analysis of variance and post hoc Bonferroni's comparisons to evaluate statistical differences. The level of statistical significance was set at p<0.05. We used SPSS software (version 13.0.1; SPSS, Inc.) for the statistical analyses.
Footnotes
Acknowledgments
This work was supported by grants SAF2010-19498 to J.V. and SAF2011-23029 to D.M., from the Spanish Ministry of Education and Science (MEC); ISCIII2006-RED13-027 and ISCIII2012-RED-43-029 from the “Red Tematica de investigacion cooperativa en envejecimiento y fragilidad” (RETICEF) to J.V., PROMETEO2010/074 from “Conselleria de Sanitat de la Generalitat Valenciana” to J.V., 35NEURO GentxGent from “Fundacio Gent Per Gent de la Comunitat Valenciana” to J.V., and EU Funded CM1001 and FRAILOMIC-HEALTH.2012.2.1.1-2 to J.V. This study has been cofinanced by FEDER funds from the European Union.
Author Disclosure Statement
No competing financial interests exist.
Abbreviations Used
References
Supplementary Material
Please find the following supplemental material available below.
For Open Access articles published under a Creative Commons License, all supplemental material carries the same license as the article it is associated with.
For non-Open Access articles published, all supplemental material carries a non-exclusive license, and permission requests for re-use of supplemental material or any part of supplemental material shall be sent directly to the copyright owner as specified in the copyright notice associated with the article.