
Abstract
Introduction
Innovation
Inducible nitric oxide synthase (iNOS) induction in steatotic livers, caused by high cholesterol diet, protects against lipopolysaccharide-induces fatal hypoglycemia. This effect of iNOS on glucose metabolism involves, at least, in part, the activation of hypoxia-inducible factor-1 pathway.
Bacterial infections influence glucose metabolism. Endotoxin administration results in hyperglycemia, followed by manifest hypoglycemia (11, 39). Severe hypoglycemia defined as blood glucose levels <40 mg/dl (10). Spontaneous admission hypoglycemia was shown to be independently associated with increased risk of death, cardiovascular related death, and death due to infectious disease (5, 10, 20). In critically ill patients, including septic patients, even a single episode of severe hypoglycemia is independently associated with increased risk of mortality (20). Importantly, the mortality rate increases with severity of hypoglycemia (5, 10).
NASH is associated with the induction of inducible nitric oxide synthase (iNOS). iNOS was proposed to be an important candidate factor associated with the development and progression of liver disease (32). The role of iNOS during sepsis liver is currently a matter of debate. Previous studies revealed contradictory results suggesting a protective or detrimental role for iNOS under these circumstances (8, 13). Concerning glucose metabolism, iNOS may profoundly and diversely modulate glucose production and/or utilization; thus, promoting hyperglycemia or hypoglycemia (2, 22, 33). iNOS can participate in glucose metabolism by stabilizing, and thus, activating, the transcription factor (TF) hypoxia-inducible factor-1 (HIF1) (26). HIF1 mediates cell survival through alterations in cellular energy metabolism. HIF1 particularly involves in glucose homeostasis by mediating glucose utilization and/or production (15, 34). Currently, whether iNOS/HIF1 axis is involved in glucose homeostasis in steatotic livers during endotoxemia is yet to be determined.
The role of dietary cholesterol in the physiopathology of NAFLD has not been receiving adequate attention. Recent observations indicate that dietary cholesterol is an important risk factor for the progression to NASH. In rodent, high-cholesterol diet (HCD) is a model of steatohepatitis and it very much resembles to human NASH, including a phenotype of insulin resistance (IR) (29). HCD further exacerbated the sensitivity to LPS and tumor necrosis factor-α (TNFα) (18, 23). However, neither the impact of HCD on glucose metabolism under these circumstances nor the involvement of iNOS and HIF1 in this process was determined. The present study aims to answer these questions.
Results
Effect of HCD with and without exposure to LPS on hepatic lipid accumulation, liver damage and iNOS activation
Consumption of HCD by mice promoted hepatic lipid accumulation in comparison to regular diet. Conversely, hepatic lipid contents were not significantly altered by LPS administration (Fig. 1A, B). There was a significant increase in alanine aminotransferase (ALT) and aspartate aminotransferase (AST) levels in the plasma of cholesterol-fed mice compared to control mice. Six hours after LPS injection, serum ALT and AST levels increased mainly in HCD-fed mice (Fig. 1C, D). These results indicate that HCD potentiate LPS-induced liver injury. As shown in Figure 1E and F, iNOS protein and mRNA levels were significantly upregulated by HCD, which indicates HCD-induced inflammatory response in the liver. After exposure to LPS, iNOS mRNA and protein levels were found to be considerably higher in the HCD group compared with the control-diet fed group.

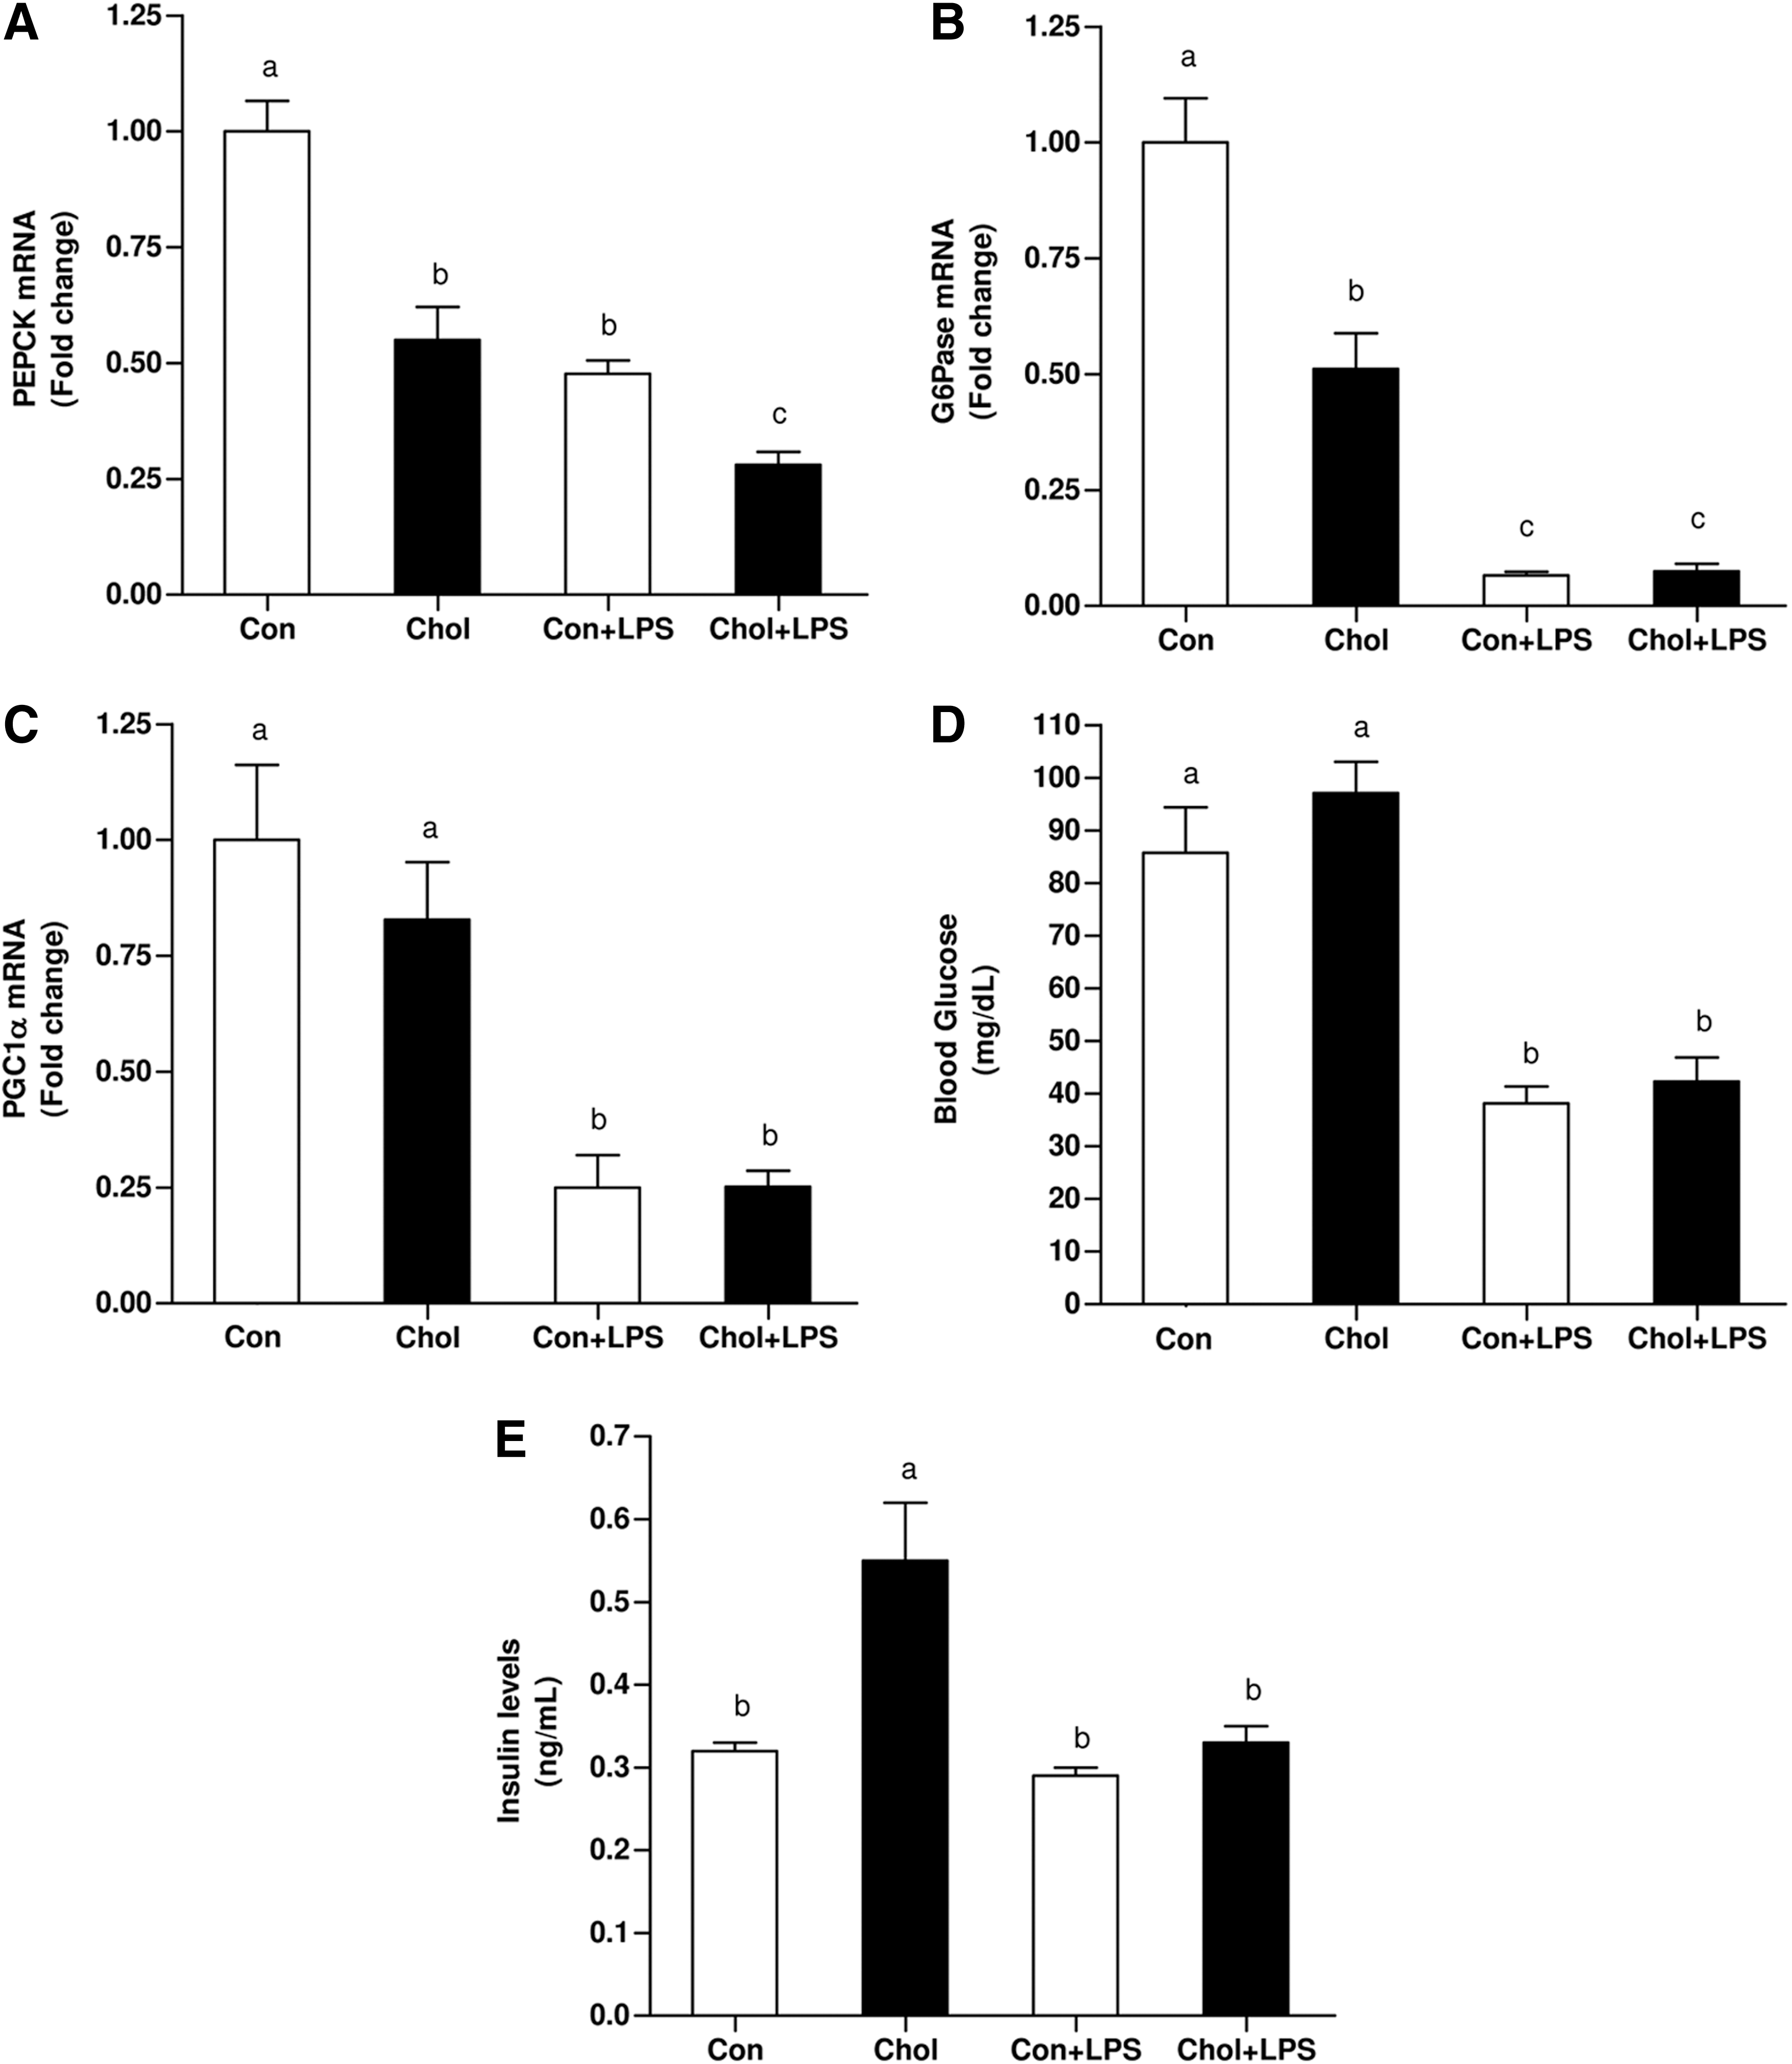
Effect of HCD with and without exposure to LPS on hepatic glucose metabolism
It has been suggested that NO-biosynthesis may contribute to the development of hepatic dysfunction during sepsis by inhibiting the capacity of the liver to generate glucose (2, 35). Accordingly, the association between the above results and alterations in hepatic gluconeogenesis was evaluated. Surprisingly, although the phenotype of the HCD-fed animals is known to reduce insulin-sensitivity (IS), both phosphoenol-pyruvate carboxykinase (PEPCK) and glucose-6-phosphatase (G6Pase) mRNA levels were significantly lower at baseline in HCD-fed mice. LPS administration significantly further downregulated PEPCK and G6Pase mRNA levels by half in both, control diet and HCD groups (Fig. 2A, B). Consistent with the abovementioned alterations, peroxisome proliferator–activated receptor-γ-coactivator-1α (PGC1α) mRNA levels were also significantly, but equally, suppressed in both LPS treated groups (Fig. 2C). Given these alternations, blood glucose levels were assessed. Without LPS, blood glucose levels were comparable between control and HCD-fed mice. LPS treatment lowered blood glucose levels markedly but equally in control and HCD-fed mice (Fig. 2D). LPS administration resulted in a significant decrease in blood insulin levels. Although consumption of HCD induced an increase in plasma insulin levels, insulin levels were significantly reduced after LPS administration (Fig. 2E). These findings indicate that the observed LPS-induced hypoglycemia was not due to an increase in insulin levels.
HIF1 activation after cholesterol loading with and without LPS administration
To determine the association between iNOS and HIF1 induction subsequent to HCD and/or LPS administration, HIF1α protein and mRNA levels were evaluated. Surprisingly, HCD profoundly increased HIF1α protein levels in the liver. In the control group, LPS treatment only slightly amplified HIF1α protein level, whereas their levels were considerably more abundant the livers of HCD-fed mice. However, LPS treatment per se did not induce additional increase in HIF1α levels in HCD-fed mice (Fig. 3A). A comparable level of HIF1α mRNA was observed in these, liver of control and HCD-fed mice. LPS treatment induced a significant increase in HIF1α gene expression. Yet, HIF1α mRNA levels were more potently upregulated by LPS in the HCD-fed group (Fig. 3B). The induction of HIF1α target genes was also estimated. In the control group, pyruvate-dehydrogenase kinase-1 (PDK1) expression was suppressed by LPS treatment, whereas its level remained unchanged in the HCD group. Glucose transporter-1 (Glut-1) mRNA levels did not differ between control and steatotic livers at baseline. In contrast, while the levels of Glut-1 mRNA were almost unaffected by LPS in the control group, their levels were profoundly augmented in cholesterol-fed animals after LPS treatment. Finally, vascular endothelial growth factor (VEGF) mRNA were also more abundant in cholesterol-fed mice after LPS administration (Fig. 3C–E).
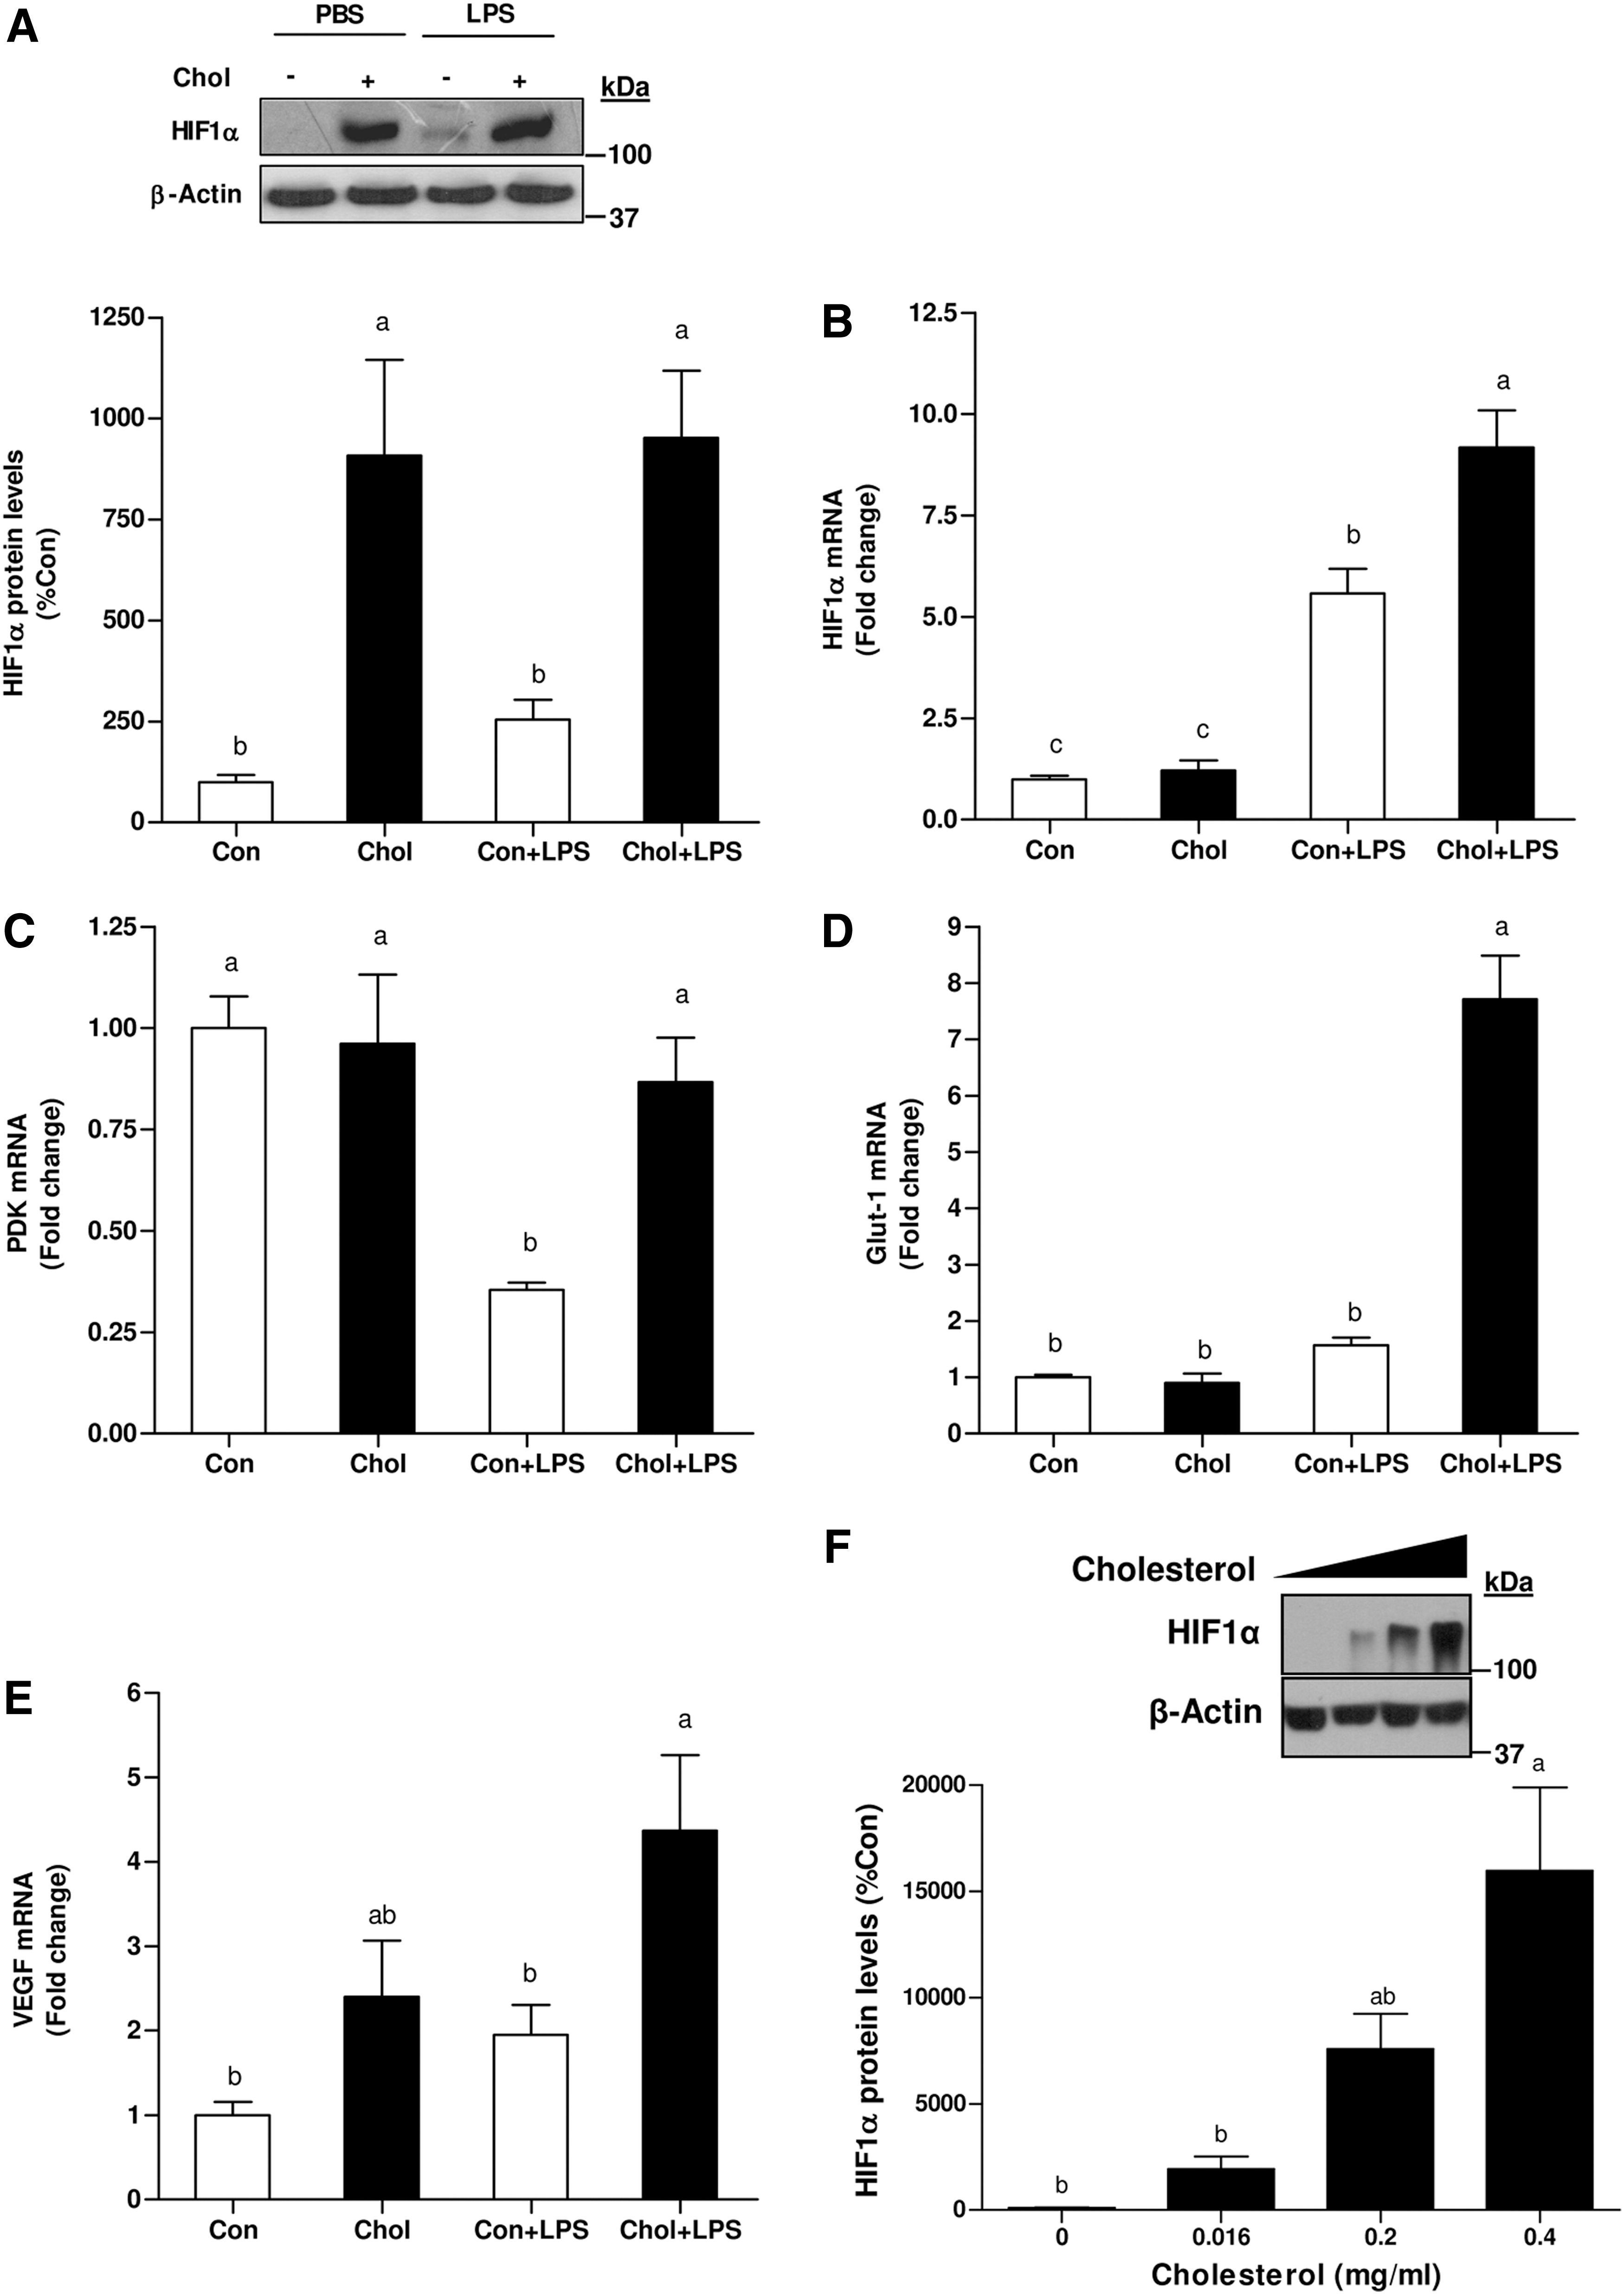
The foregoing observations imply a connection between cholesterol and HIF1α accumulation. Hence, to examine the consequences of elevated cholesterol levels on HIF1α accumulation, primary hepatocytes were incubated with increasing concentrations of free cholesterol. As shown in Figure 3F, cells incubated with cholesterol exhibited increased HIF1α protein levels under normoxic conditions. The ability of cholesterol to stimulate HIF1α induction was further validated in diverse cells. Indeed, similar results were obtained by using AML-12 hepatocytes, HeLa and HEK293 cells (data not shown). The association between cellular cholesterol-load and iNOS induction was assessed. Consist with HIF1α accumulation, cholesterol-load also increased iNOS expression (Supplementary Fig. S1; Supplementary Data are available online at
Attenuated HIF1 activation in iNOS-deficient mice after consumption of HCD and LPS-challenge
The role of iNOS in glucose metabolism in steatotic livers after LPS administration was evaluated by using a genetic model of iNOS deficient mice. Wild-type (WT) and iNOS−/− mice displayed liver steatosis after chronic intake of HCD and LPS administration (Fig. 4A–C). However, after exposure to the same dose of LPS, HCD-fed iNOS−/− mice showed higher plasma ALT and AST levels than HCD-fed WT (Fig. 4D, E). Consist with this finding, higher AST levels were also observed in HCD-fed mice treated with PBIT, a specific iNOS inhibitor, during LPS administration (Supplementary Fig. S2).

Lack of iNOS significantly inhibited HIF1α accumulation concomitantly with reduced PDK1 and Glut-1 expression (Fig. 5A–D). However, no change was observed in the expression of VEGF (Fig. 5E). This finding is in agreement with the notion that other TF are involved in the regulation of this gene during endotoxemia (16). Since HIF1 signaling was suppressed in iNOS−/− mice under normoxic-inflammatory conditions, HIF1α (mutHIF1)-overexpression plasmid was introduced into iNOS−/− mice livers by hydrodynamic injection. The injury to liver tissues after HCD and LPS treatment, as determined by blood liver enzymes levels, was significantly ameliorated in HIF1mut-treated iNOS−/− mice (Fig. 5F, G).

Antihypoglycemic role of iNOS: protection against LPS-induced fatal hypoglycemia in HCD fed animals
In agreement with our previous report (37), after LPS-challenge, blood glucose levels were significantly lower in iNOS−/− mice compared with WT mice, and fatal hypoglycemia was noted (Fig. 6A).

Pharmacological inhibition of iNOS in WT mice by PBIT during LPS injection also resulted in lower blood glucose levels (Supplementary Fig. S3).
No difference was observed between WT and iNOS−/− mice in the expression of key gluconeogenesic enzymes (Fig. 6B–D). However, after LPS administration, liver glycogen contents were significantly higher in iNOS−/− group in comparison to mice in the WT group suggesting that decrease glycogen decomposition as a reason for the observed fatal hypoglycemia (Fig. 6E). AMP-activated protein kinase (AMPK) is another factor postulated to be involved in glycogen homeostasis (3, 28). In accord with the above results, AMPK activity was profoundly lower in iNOS−/− mice, as manifested by its lower phosphorylation (Fig. 6F, G).
iNOS promotes hepatic glucose output
The impact of HIF1-iNOS axis on blood glucose levels was further established in HIF1mut-treated mice. In WT mice LPS-administration in HIF1mut-treated mice resulted in higher blood glucose levels compared with mice treated only with LPS (Fig. 7A). Glut-1 and iNOS mRNA levels and glycogen contents were further evaluated. Under basal conditions (without LPS), the expression of glut1 was significantly enhanced in HIF1mut-treated mice, whereas only minor increase in iNOS expression was observed. Liver glycogen contents also tend to be higher in HIF1mut-treated mice. However, after LPS administration, while glut1 expression level was equal in both groups, and was lower than in HIF1mut-treated mice, iNOS expression was significantly augmented in HIF1mut-treated mice compared to animal injected with empty vector. These alterations were coincident with lower glycogen contents in this group (Fig. 7B–D). In iNOS−/− mice the ability of HIF1 to promote glyconenolysis, and thus, to protect blood glucose levels under inflamed conditions was lost (Fig. 7E, F), demonstrating antihypoglycemic role for HIF1 only in the presence of activation of iNOS.
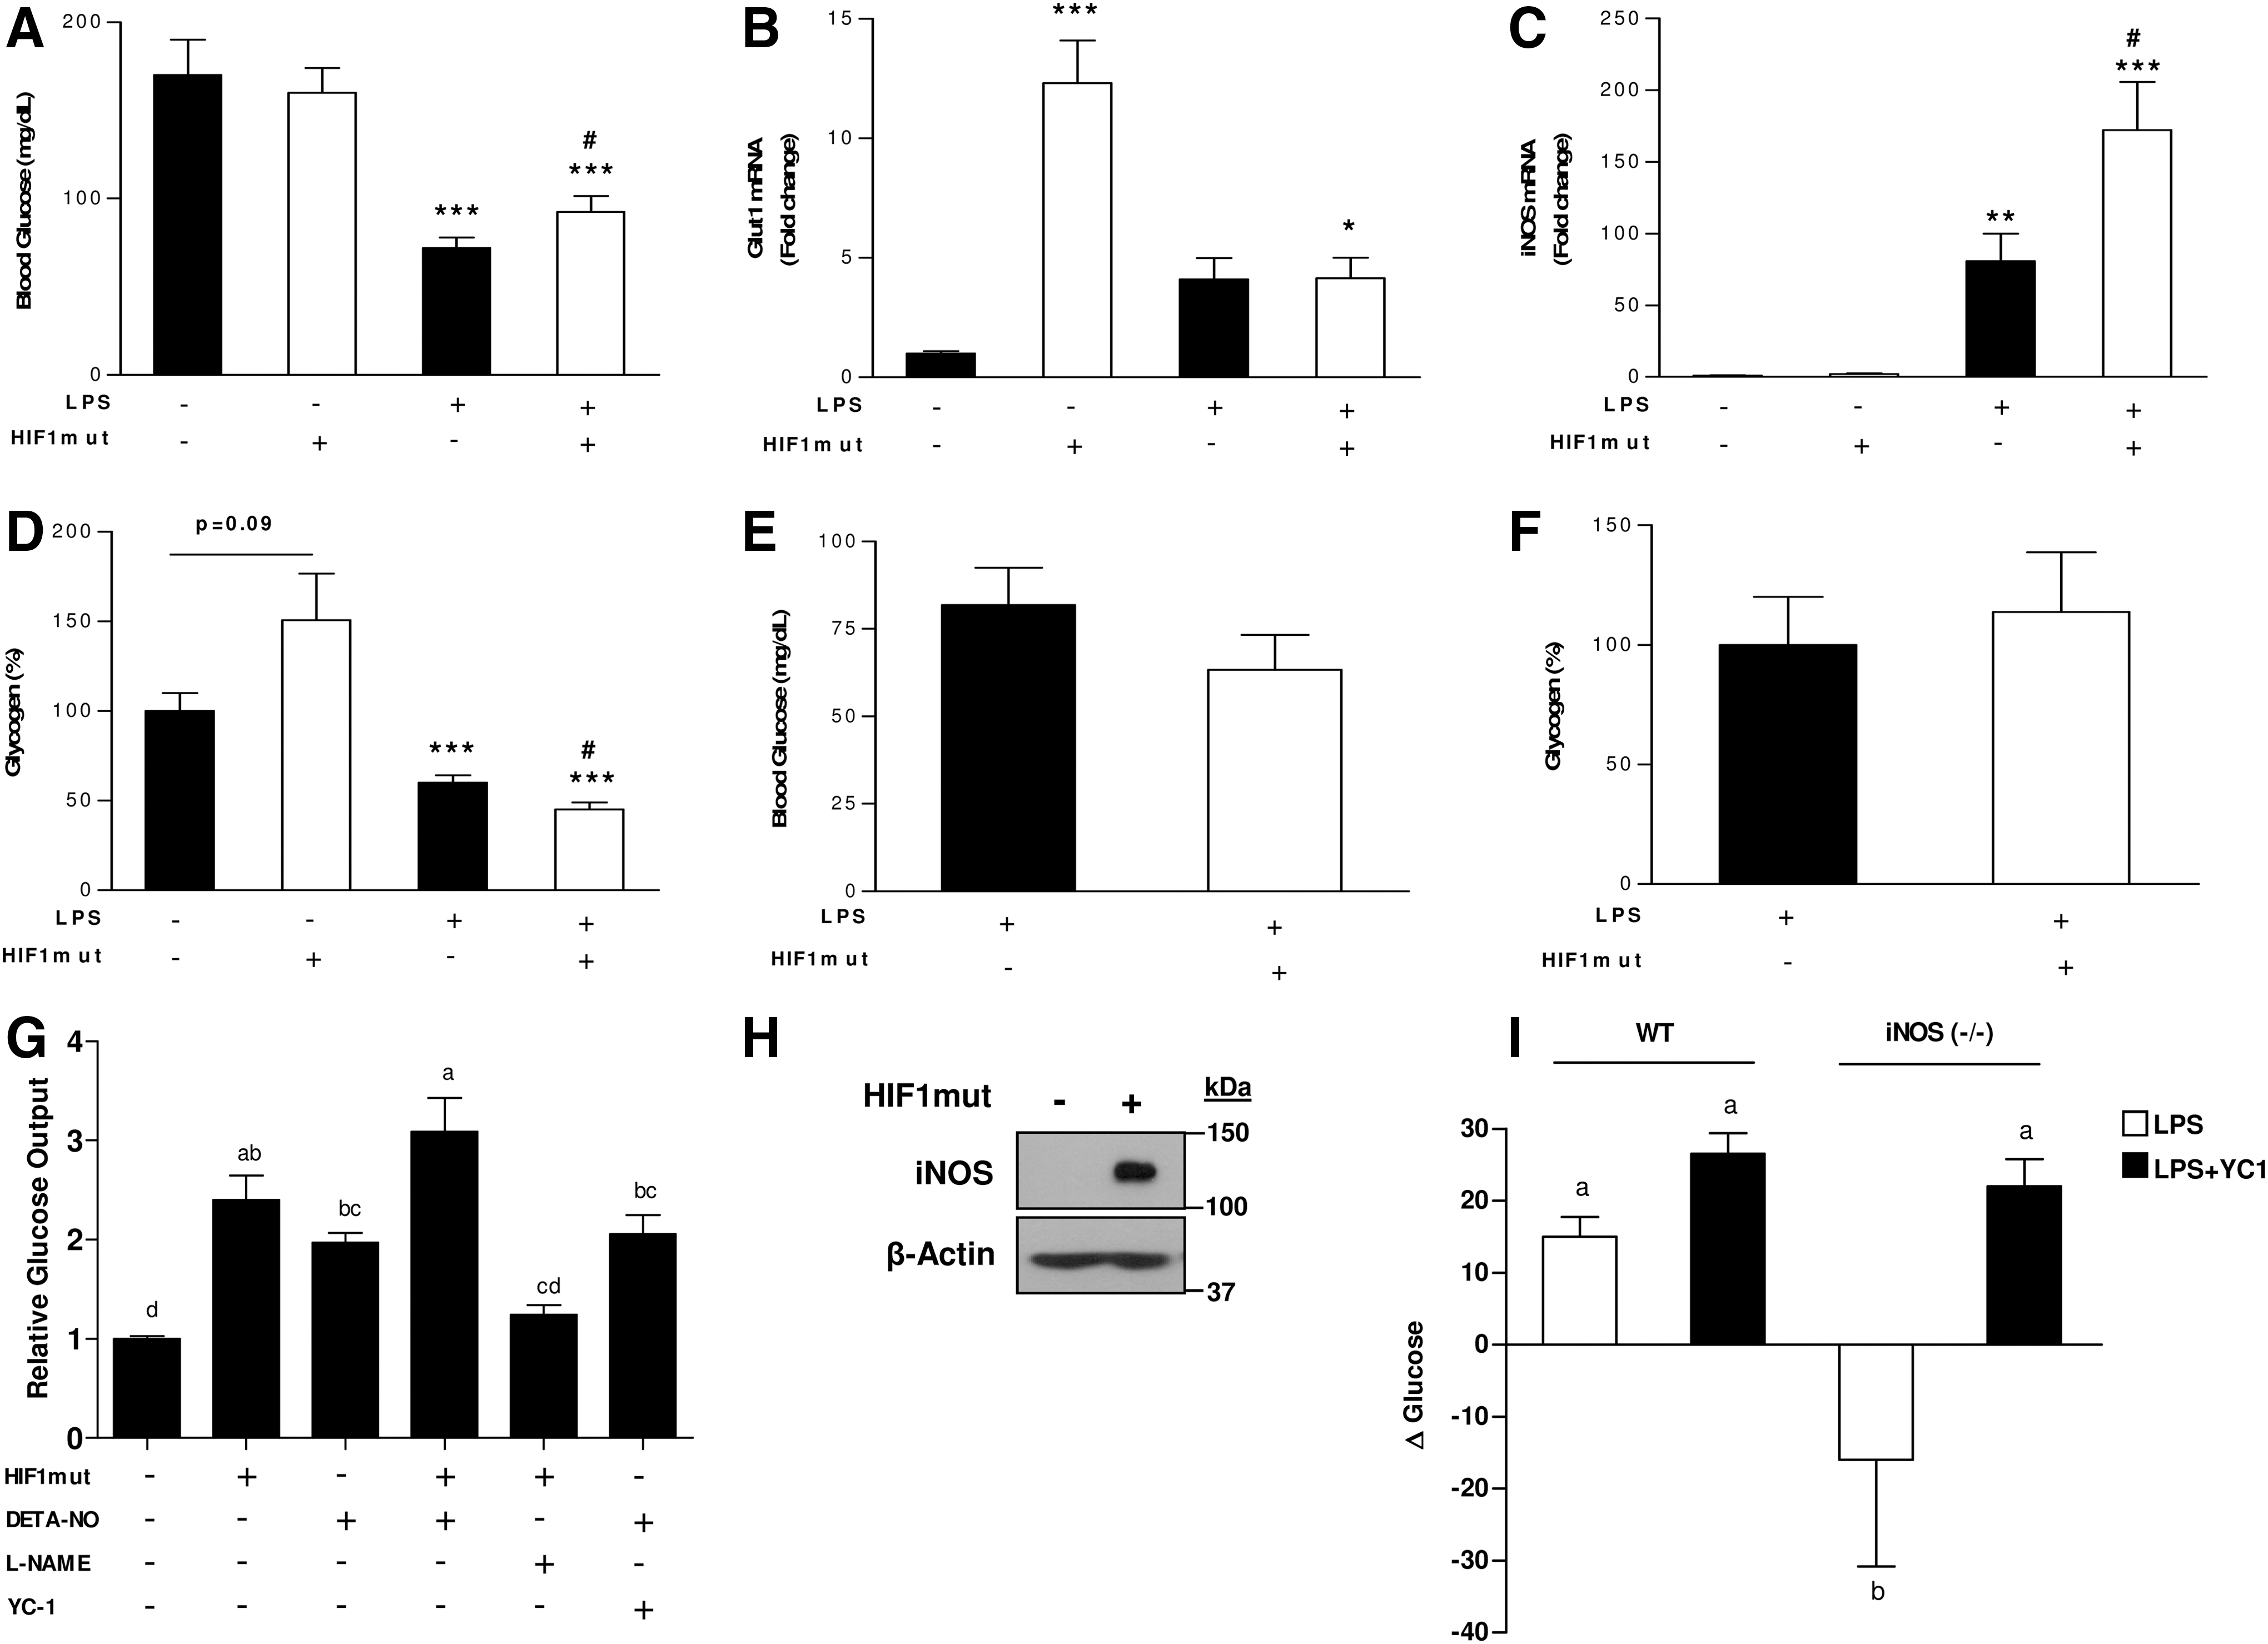
The role of iNOS and HIF1 in hepatic glucose output was further validated in vitro by the use of NO-donor, HIF1 over expressing cells, YC-1 (soluble guanylate cyclase [sGC] activator and HIF1 inhibitor) and L-NAME (iNOS inhibitor). As shown in Figure 7G, treating cells with the NO-donor resulted in increased hepatic glucose output. Hepatic glucose output was also induced in cells tranfected with constitutively active HIF1α. Cotreating cells with NO-donor and YC-1 stimulated glucose output. Conversely, hepatic glucose output was abolished by treatment of HIF1-overexpressing cells with L-NAME. This result, consist with the above in vivo findings, shows that the effect of HIF1-derived glucose output may depend only on NO production. Indeed, western blot analysis revealed high iNOS levels in HIF1-overexpressing cells (Fig. 7H), confirming that HIF1 upregulates iNOS expression to facilitate the glucose production response mediated by NO.
Finally, to demonstrate the ability of iNOS to promote hepatic glucose output independently of HIF1 in vivo, WT and iNOS−/− mice were treated with LPS or combination of LPS with YC-1. Two hours after LPS administration, blood glucose levels were slightly, but significantly increased in WT mice, while their levels were actually decreased in iNOS−/− mice. Treating iNOS-deficient mice with YC-1 prevented this decline, and increased blood glucose levels was observed (Fig. 7I). Collectively, these in vitro and in vivo findings indicate iNOS induces hepatic glucose output by activating sGC downstream to HIF1.
iNOS protective effect against LPS cytotoxic effects in steatotic livers
Increased iNOS levels in steatotic livers were in association with enhanced expression of the protective enzyme heme oxygenase-1 (HO-1) (Fig. 8A, B). Conversely, although HCD significantly augmented LPS-induced IL-6 and TNFα expression, these alterations were not associated with iNOS activation (Fig. 8C–F). In fact, TNFα mRNA levels were higher in iNOS-deficient mice than in WT mice. Plasma TNFα concentrations were substantially more elevated in iNOS-deficient mice (Fig. 8H). Finally, liver lipid-peroxydation levels were also higher in iNOS-deficient mice (Fig. 8I). All together, these findings suggest a cytoprotective properties of iNOS.

Discussion
The present work highlights the essential role of iNOS in the glycemic response in fatty livers during endotoxemia. Moreover, the results also argue for the beneficial effects of iNOS during acute inflammatory response of the liver.
Admission blood glucose abnormalities are associated with poor prognosis and may lead to increased in hospital mortality. As such, hypoglycemia was found to be an independent risk factor for hospital mortality from severe sepsis and in critically ill patients (5, 10, 20). Fatal hypoglycemia might carry out deleterious biological effects, such as increasing the systemic inflammatory response, inducing neuroglycopenia, inhibiting corticosteroid response to stress, impairing sympathetic system responsiveness, promoting cerebral vasodilatation and/or by other yet unidentified mechanisms (5, 10). Previously, we have demonstrated using cholin-deficiency ethionine-supplemented diet (CDE), that iNOS prevents fatal hypoglycemia after LPS-challenge. However, CDE is not a model for primary NAFLD since it has no IR phenotype. Interestingly, in CDE treated mice or in cholin and methionine deficient mice there is no expression of liver iNOS (37). In the current study, a model of HCD was used. This model mimics more accurately the conditions of human NASH (29). In HCD-treated animals without LPS, and more prominently after LPS treatment, a significant activation of iNOS was observed. This activation of iNOS ameliorated the hypoglycemia induced by acute LPS-induced inflammation. Indeed, in iNOS−/− mice fatal hypoglycemia was developed by HCD and LPS. Hence, by inhibiting the onset of life-threaten hypoglycemia, iNOS seems to play vital role in steatotic livers. However, it should be taken under consideration that LPS-induced hypoglycemia in rodents does not fully mimic sepsis in humans.
Severe hypoglycemia induced after infection is probably the results of excessive consumption of glucose by macrophages using noninsulin dependent glucose utilization pathways (21). Therefore, the severe hypoglycemia observed during endotoxemia in the absence of iNOS, can be explained by impairment in hepatic glucose production concurrently to increased glucose demand by the immune system and is probably not related to changes in peripheral IS. Indeed, glycogen contents were significantly higher in the livers of LPS-treated iNOS-deficient mice, consistent with a marked hypoglycemia in these animals. Both in vivo as well as in vitro findings support the role of iNOS in enhancing glycogenolysis and hepatic glucose output. This notion is in agreement with various lines of investigation, which also suggested a crucial role for iNOS in these processes and demonstrated its participation in the acceleration of glycogenolysis and/or the inhibition of glycogen synthesis/glucose uptake (3, 12, 31).
Currently, the exact mechanism/s by which iNOS provokes these effects have not been well elucidated. iNOS-induced glycogenolysis under different circumstances, including sepsis, was shown to be associated mainly with elevated glycogen phosphorylase (GP) activity (30, 31, 33). However, the exact mechanisms by which NO activates GP is still largely unknown. iNOS can also regulate glycogen contents by activating AMPK (24). Several works have shown that AMPK activation during hypoglycemia can prevent the onset of fatal hypoglycemia by promoting hepatic glucose output and/or inhibiting hepatic glucose uptake (3, 28). Thus, increased AMPK activation in WT but not in iNOS−/− mice is expected to mediate iNOS antihypoglycemic effect.
Hypoglycemia in the later phase may also be due to subsequent suppression of gluconeogenesis. Currently, the role of iNOS in LPS-associated depression of gluconeogenesis is still controversial (2, 35). However, in some of these studies conclusions were based upon the evaluation of PEPCK mRNA levels or its activity in vitro. Recent studies, conducted in several mouse models with impaired PEPCK gene expression, imply that changes in PEPCK alone may be insufficient to modulate gluconeogenesis (7). Indeed, a variety of works demonstrated modulations in hepatic glucose metabolism even in the absence of altered PEPCK expression or altered PEPCK expression without significant effect on gluconeogenesis. These findings indicate other factors, such as substrate availability, can also project substantial control over the rate of gluconeogenesis (7). In this regard, after LPS administration, PDK1 mRNA levels were significantly higher in livers of HCD-treated animals, compared to control livers. Conversely, PDK1 expression was also reduced in fatty livers of iNOS-deficient mice, which may inhibit gluconeogenesis rate. Therefore, is seems likely that iNOS-mediated higher PDK1 expression in fatty livers under septic condition represents a compensatory mechanism for the reduced expression of key gluconeogenic enzymes by increasing the supply/availability of gluconeogenesis substrates.
In iNOS−/− mice fed with HCD, LPS injection failed to induce HIF1α protein accumulation in the liver. Thus, the present work revealed a dominant role for iNOS in HIF1α accumulation in steatotic livers. The interplay between NO and HIF1 has been receiving much of attention. One of the host-defense mechanisms of HIF1 may be attributed to the activation of iNOS, which in turn further stabilize HIF1α and rapidly amplify the innate defense pathway (9, 16). Indeed, in vitro studies have shown that high concentration of NO, as encounted during inflammation, are capable of stabilizing HIF1α under normoxia (26). Currently, the importance of iNOS in HIF1 activation in vivo has not been firmly established (17, 26). Thus, finding presented here corroborate the significance of iNOS on HIF1α accumulation in vivo. HIF1 also participates in hepatic glucose homeostasis under different circumstances (15, 34). Evidences favoring a critical role for HIF1 in the correction or prevention of hypoglycemia came from a study conducted in liver-specific HIF1 mutant mice (34). Data presented here coincide with these findings and further suggest that in the absence of high iNOS levels, HIF1 promotes hepatic glucose uptake and possibly glycogenogenesis, while concurrently induction of HIF1 and iNOS, under inflammatory conditions, supports glycogenolysis and glucose release into the circulation.
In the current study, beside its role in glucose metabolism, results further imply iNOS imparts defensive effects in fatty liver. After LPS administration, iNOS-deficient mice were associated with greater liver damage, as detected by the enlarged presence of liver enzymes in the plasma, augmented oxidative stress and reduced mRNA levels of the cytoprotective enzyme HO-1. Moreover, in iNOS−/− mice, LPS injection after HCD elicits a substantially increase in serum TNFα concentrations, as well as liver TNFα mRNA levels. TNFα is suggested to play a fundamental role in fatty livers-related vulnerability to endotoxin (18). Notably, iNOS is also a potent inhibitor of TNFα-mediated toxicity and apoptosis in hepatocytes, through the upregulation of protective proteins and by the inhibition of caspase-dependant events via S-nitrosylation of caspases (19). Taken together, these findings stand in line with more recent data and clearly demonstrate enhanced NO production during endotoxemia plays hepatoprotective role in steatotic livers. This protective may be ascribed to its antiapoptotic or antioxidative properties.
In summary, in the present study, the robust induction of iNOS in stestotic livers appeared to play a protective role during the early phase of endotoxemia. Data presented here suggests iNOS regulates carbohydrate metabolism by mediating hepatic glucose output; thus, preventing LPS-induced fatal hypoglycemia. Findings further accentuate the importance of iNOS in the essential activation of HIF1 pathway during inflammation and demonstrate the involvement of this interaction in glucose homeostasis. Finally, results also demonstrate a cytoprotective role of iNOS in these livers in part by modulating the levels of TNFα. These observations highlight the critical necessity for iNOS in NASH under acute inflammatory (endotoxemic) conditions.
Materials and Methods
Animal experiments
Adult male WT C57BL/6J mice and C57BL/6J iNOS-knockout (iNOS−/− ) mice were purchased from Harlan Laboratories and Jackson Laboratories, respectively. Mice were maintained in a temperature and light-controlled facility, and permitted ad libitum consumption of water and chow. Mice were fed with standard low fat diet (16% calories from corn oil fat) (control diet) or with the same diet supplemented with 1% cholesterol and 0.5% cholic acid (HCD) for 6 weeks (food consumption of diets: WT mice, control diet, 1.14±0.01 g/g BW/week; iNOS−/− mice control diet 1.042±0.03 g/g BW/week; WT mice, HCD 1.4±0.02 g/g BW/week; iNOS−/− mice, HCD 1.41±0.08 g/g BW/week). For endotoxic treatment, mice were injected intraperitoneally with LPS (5 mg/kg) or LPS+YC-1 (15 mg/kg). Also, mice were treated with the highly selective iNOS inhibitor PBIT (100 ppm in diet or 10 mg/kg i.p. injection). Control mice were injected with vehicle phosphate-buffered saline (PBS). iNOS-deficient mice were subjected to both, HCD and LPS-challenge. Animals were sacrificed 6 h after LPS-challenge to obtain plasma and liver tissue. All animals received humane care, and all study protocols were approved by the institutional animal care and use committee.
Blood parameters
Analysis of serum ALT and AST levels were performed by American Laboratories, Ltd. Blood glucose levels were determined using glucometer (Medisense). Serum insulin levels were determined using a specific commercial ELISA kit (LINCO Research). Cytokines were measured with a Milliplex MAP Assay Kit (Millipore) according to the manufacturer's instructions.
Biochemical analysis
Total lipid was extracted from the livers using Folch's method (14). For glycogen measurements, liver tissue samples were boiled with 33% KOH and participated with ethanol as previously described (4). The lipid peroxidation level in liver homogenate was measured as MDA, which is the end product of lipid peroxidation, and reacts with thiobarbituric acid (TBA) as a TBA reactive substance to produce a red coloured complex, which has peak absorbance at 532 nm as reported previously (25).
Liver histology
Livers were fixed in 4% formaldehyde (Bio-Lab), and microtome (Leica Microsystems) sections (5 μm) were collected. Hematoxylin&eosin staining was used for tissue-section visualization.
Quantitative real-time polymerase chain reaction
Total RNA was isolated using the Tri-Reagent (Sigma-Aldrich) method, according to the manufacturer's protocol. Complementary DNA was prepared using the high-capacity cDNA Reverse Transcription kit (Applied Biosystems). Real-time polymerase chain reaction (PCR) was performed by using the 7300 real-time PCR System (Applied Biosystems) using specific primers. Primer sequences available on request. Fold change in gene expression was determined by normalizing to 18S mRNA.
Protein extraction and western blot analyses
Whole-cell lysates were prepared in RIPA buffer. Aliquots of protein (50–100 μg) were then transferred to a nylon membrane and subjected to western blotting as previously described. Primary antibodies used were: iNOS and β-actin (BD Biosciences), HIF1α (R&D Biosciences), AMPK and phospho-AMPK (Thr-172) (Cell Signaling Technology). Secondary antibodies were obtained from Jackson ImmunoResearch.
Cell culture and treatments
Mouse hepatocyte AML-12 cells were maintained at 37°C in 5% CO2 in Dulbecco's modified Eagle's medium (DMEM) supplemented with 10% fetal calf serum, 1×glutamine, penicillin (100 U/ml), and streptomycin (100 mg/ml). Primary hepatocytes were isolated from male Sprague-Dawley rats and cultured as describe (6). Transient transfection with P564A N803A HIF1α mutant in pEF-bos plasmid (HIF1mut) (a kind gift from Eli Zelzer; Weizmann Institute of Science) was performed using jetPEI (PolyPlus Transfection) according to the manufacturer's instructions. Glucose output assay was conducted for 1 h in HIF1α overexpressed cells or in cells exposed to 1 mM DETA-NONOate in glucose-free DMEM without phenol red (Sigma-Aldrich). HIF1 was inhibited using YC-1 (100 μM; Sigma-Aldrich), whereas iNOS was inhibited using L-NAME (2 mM; Sigma-Aldrich). Glucose concentrations in culture media were measured using colorimetric glucose assay and the readings were normalized with whole-cell protein amount. For cholesterol overload studies, cells were incubated with increased concentrations of water-soluble cholesterol (Sigma-Aldrich) for 24 h.
Hydrodynamic injection
Fifty micrograms of plasmid containing either HIF1α mutant or empty control vector were delivered into WT and iNOS
Statistical analysis
Data were expressed as mean±SEM. Comparisons between two groups were performed with Student's t-test. For multiple groups, data were analyzed by analysis of variance (ANOVA). Differences were considered significant at probability levels of p<0.05 with the Tukey-Kramer HSD method. Statistical analysis was performed using the statistical computer program, JUMP version 7 (SAS Institute).
Footnotes
Acknowledgment
This study was supported by grant no. 371/12 from the Israel Science Foundation to O.T. and Z.M.
Author Disclosure Statement
No competing financial interests exist.
Abbreviations Used
References
Supplementary Material
Please find the following supplemental material available below.
For Open Access articles published under a Creative Commons License, all supplemental material carries the same license as the article it is associated with.
For non-Open Access articles published, all supplemental material carries a non-exclusive license, and permission requests for re-use of supplemental material or any part of supplemental material shall be sent directly to the copyright owner as specified in the copyright notice associated with the article.