
Abstract
Introduction
D
Impairment of pancreatic β-cell function, in particular reduced glucose-stimulated insulin secretion (GSIS), is a critical event in the pathophysiology of type 2 diabetes (T2D). We found that β-cell-specific silencing of nuclear factor-erythroid 2-related factor 1 (Nrf1) led to a β-cell phenotype reminiscent of the early stage of T2D with disrupted β-cell glucose metabolism, marked elevation of basal insulin release, reduced GSIS, fasting hyperinsulinemia, and glucose intolerance. The impaired glucose sensing and insulin secretion of Nrf1 deficient β-cells are associated with aberrant expression of a group of glucose metabolic enzymes, leading to altered glucose metabolism in the cells. Our study suggests that Nrf1 may be a novel target to improve β-cell function.
Nuclear factor-erythroid 2-related factor 1 (Nrf1, also known as NFE2L1/LCRF1/TCF11) belongs to the CNC-bZIP family of transcription factors (TFs), which also includes Nrf2, a canonical TF mediating the antioxidant response (6). Nrf1 is ubiquitously expressed in a wide range of tissues and it serves as an important regulator of antioxidant response, proteasome homeostasis, mitochondrial respiration, apoptosis, inflammation, lipid metabolism, and cell differentiation (6, 19, 20, 37, 40). As with the human analog, the mouse Nrf1 gene is transcribed in multiple alternatively spliced forms, resulting in at least six protein isoforms containing 313, 453, 572, 583, 741, and 742 amino acids (aa), respectively. In addition, post-translational modifications, including glycosylation and proteolytic processing, play important roles in the transactivation and stabilization of various isoforms of Nrf1 (47, 48). Global Nrf1 knockout (KO), which deletes all isoforms of Nrf1, results in embryonic lethality at mid-gestation in mice (8). Neuron-specific deletion of all-isoform Nrf1 results in oxidative stress, UPS dysfunction, and neurodegeneration (21, 25). Hepatocyte-specific all-isoform Nrf1-KO mice develop severe hepatic steatosis and liver carcinoma (19, 44). Conditional KO of Nrf1 in the bone leads to reduced bone size in mice (20). These findings suggest that some, if not all, isoforms of Nrf1 play important physiological role(s) in a variety of cells. However, the expression and function of Nrf1 in pancreatic β-cells have not yet been reported.
In this study, we found that silencing of all isoforms of Nrf1 in MIN6 β-cells and mouse islets led to marked elevation of basal insulin release with reduced GSIS, a β-cell phenotype reminiscent of the early stage of T2D. The impaired glucose sensing and insulin secretion of Nrf1 deficient β-cells are associated with altered glucose metabolism, oxidative stress, and impaired ATP production in the cells. Clearly, Nrf1 plays critical roles in regulating glucose metabolism, mitochondrial function, and insulin secretion.
Results
Stable silencing of Nrf1 impairs insulin secretion in MIN6 β-cells
To determine the function of Nrf1 in pancreatic β-cells, we developed a line of MIN6 β-cells with stable knockdown of nearly all isoforms of Nrf1 (termed as Nrf1-KD) by using an shRNA primarily against the isoform-313, −453, −572, −583, −741, and −742 (Supplementary Fig. S1; Supplementary Data are available online at
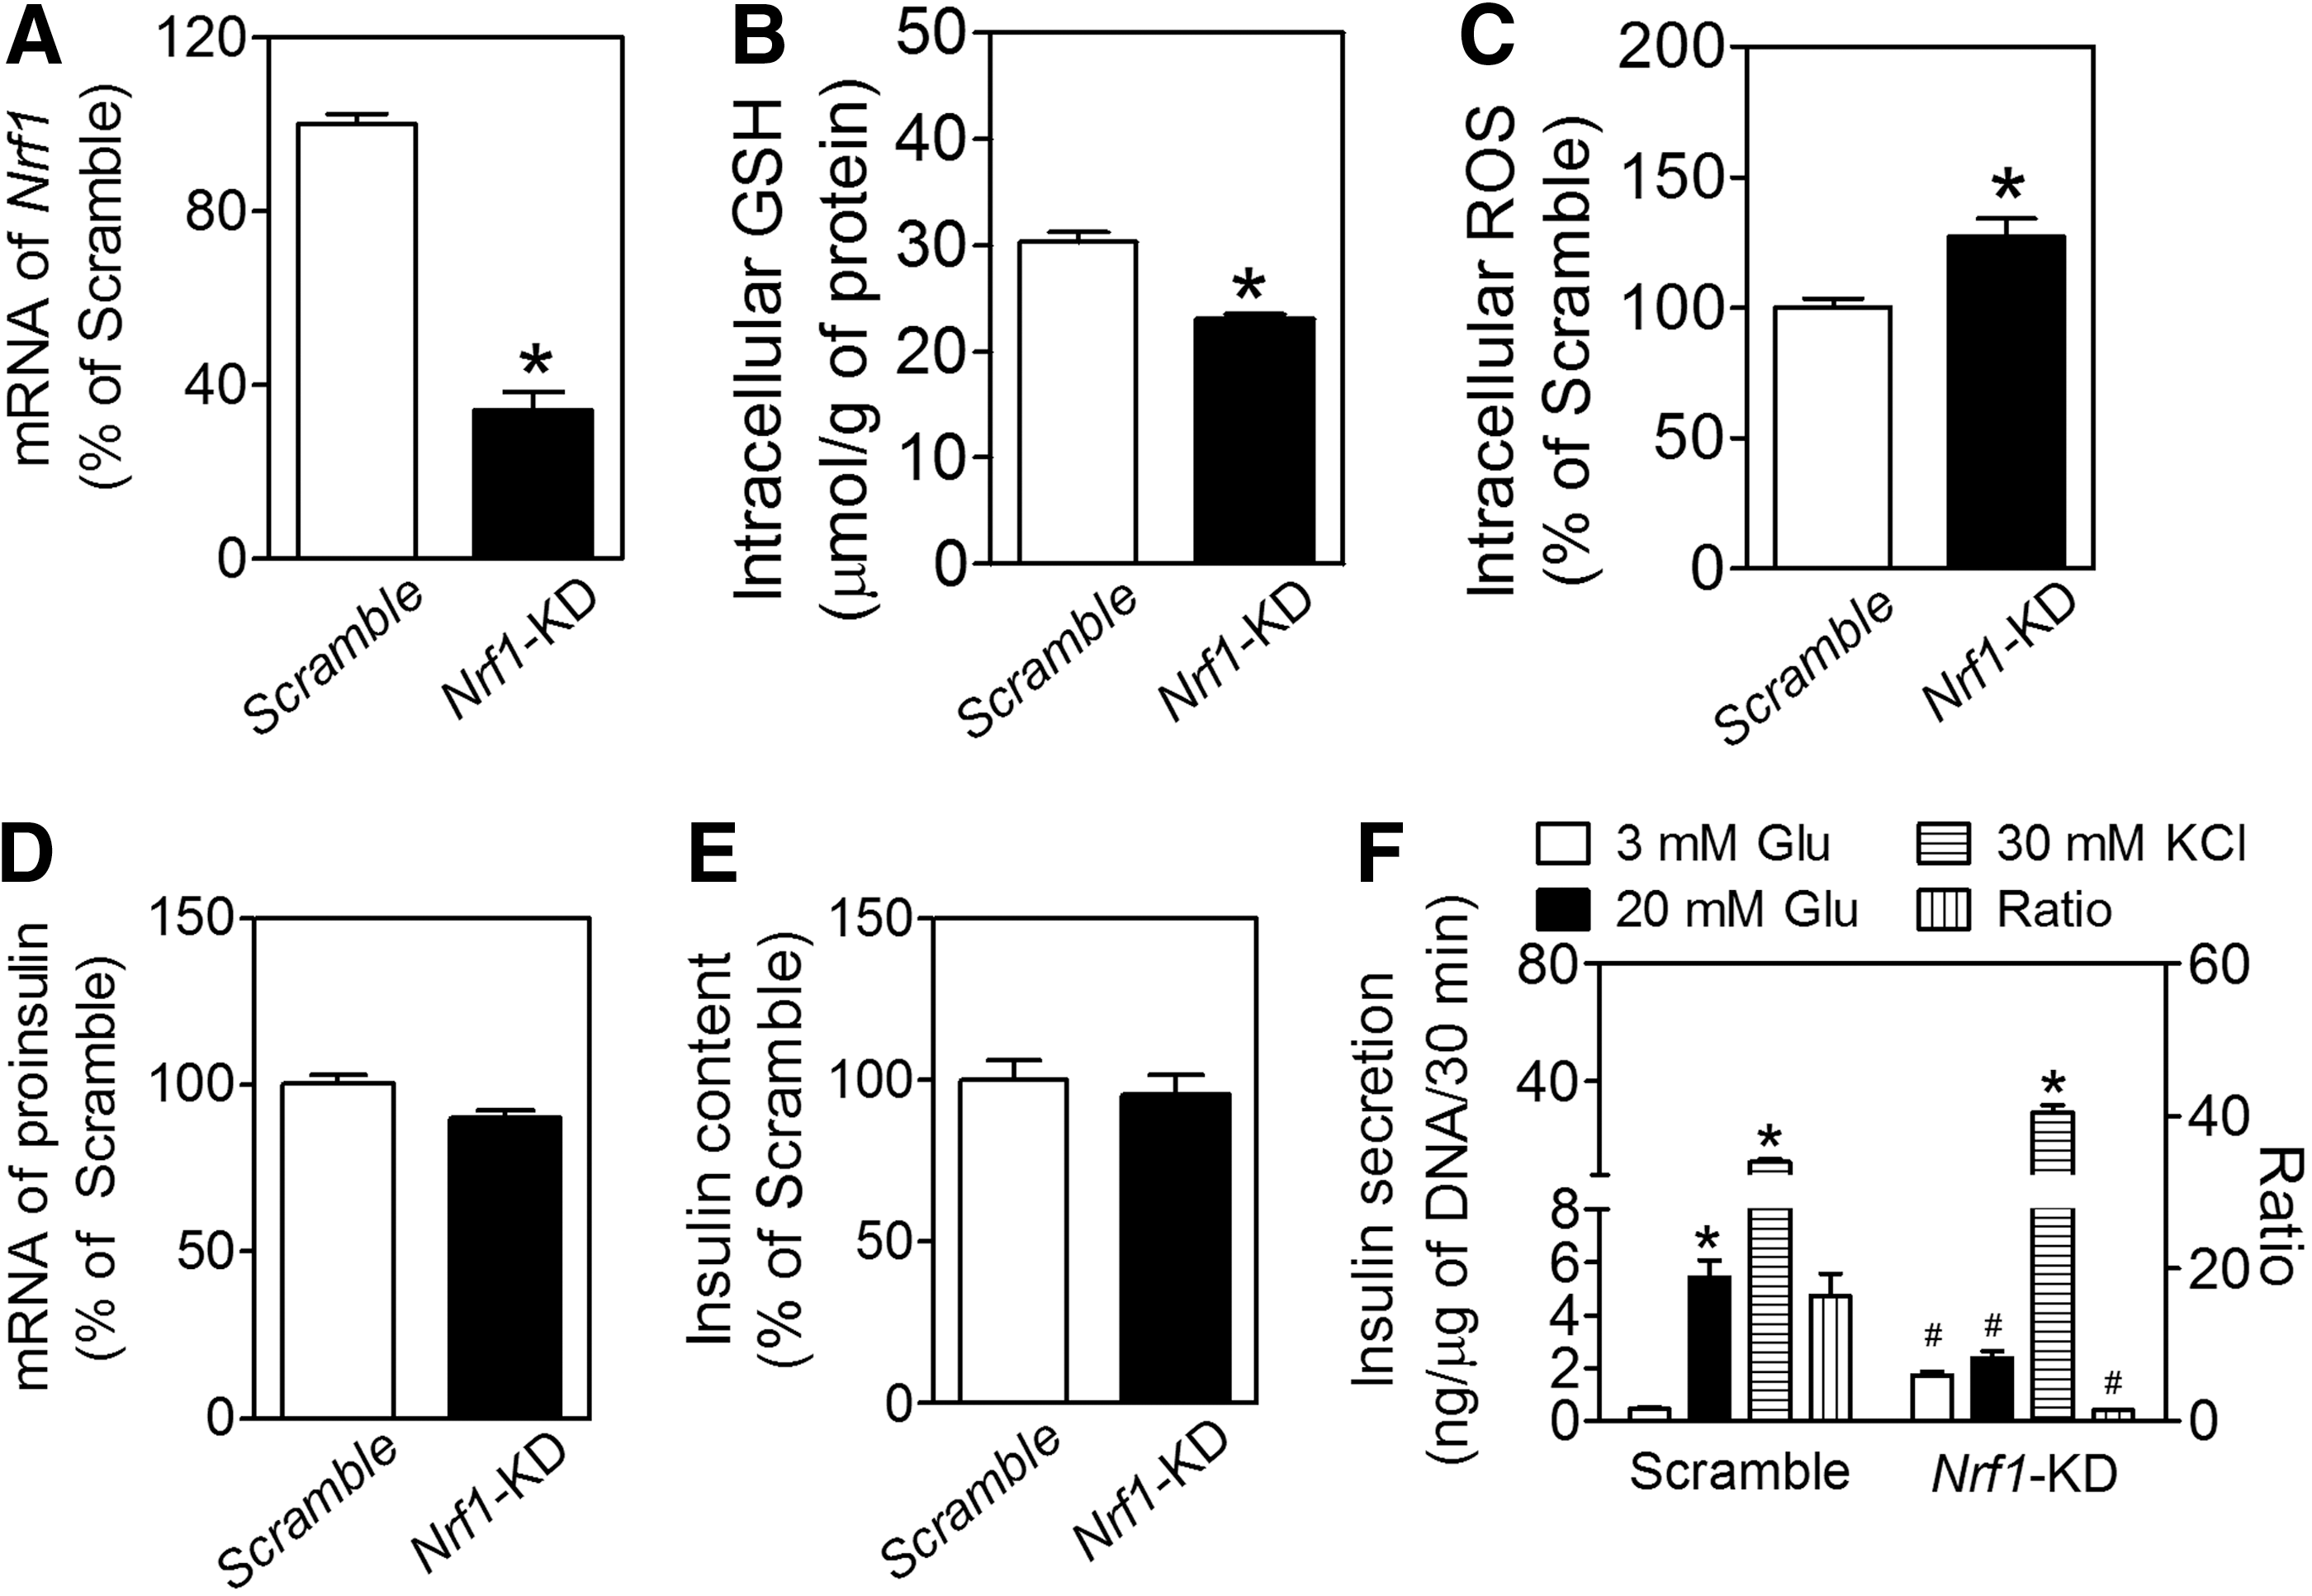
Although deficiency of all isoforms of Nrf1 did not significantly affect the basal expression of insulin at the mRNA (Fig. 1D) or protein (Fig. 1E) level, Nrf1-KD MIN6 cells had higher basal insulin release, with lower GSIS (Fig. 1F). The ratio of insulin secretion under high glucose (20 mM) to that under basal condition (3 mM glucose) was 11.7 times lower in Nrf1-KD cells than that of Scramble cells. Nonetheless, the insulin release in response to 30 mM KCl was comparable between Nrf1-KD and Scramble-treated cells (Fig. 1F). In addition, Nrf1-KD MIN6 cells released much more insulin than Scramble cells did under 3 mM of fructose or 3 mM of mannose condition. In contrast, insulin secretion under 3 mM of galactose showed no significant difference between Nrf1-KD and Scramble MIN6 cells (Supplementary Fig. S3).
Pancreatic β-cell-specific Nrf1-knockout mice have severe hyperinsulinemia
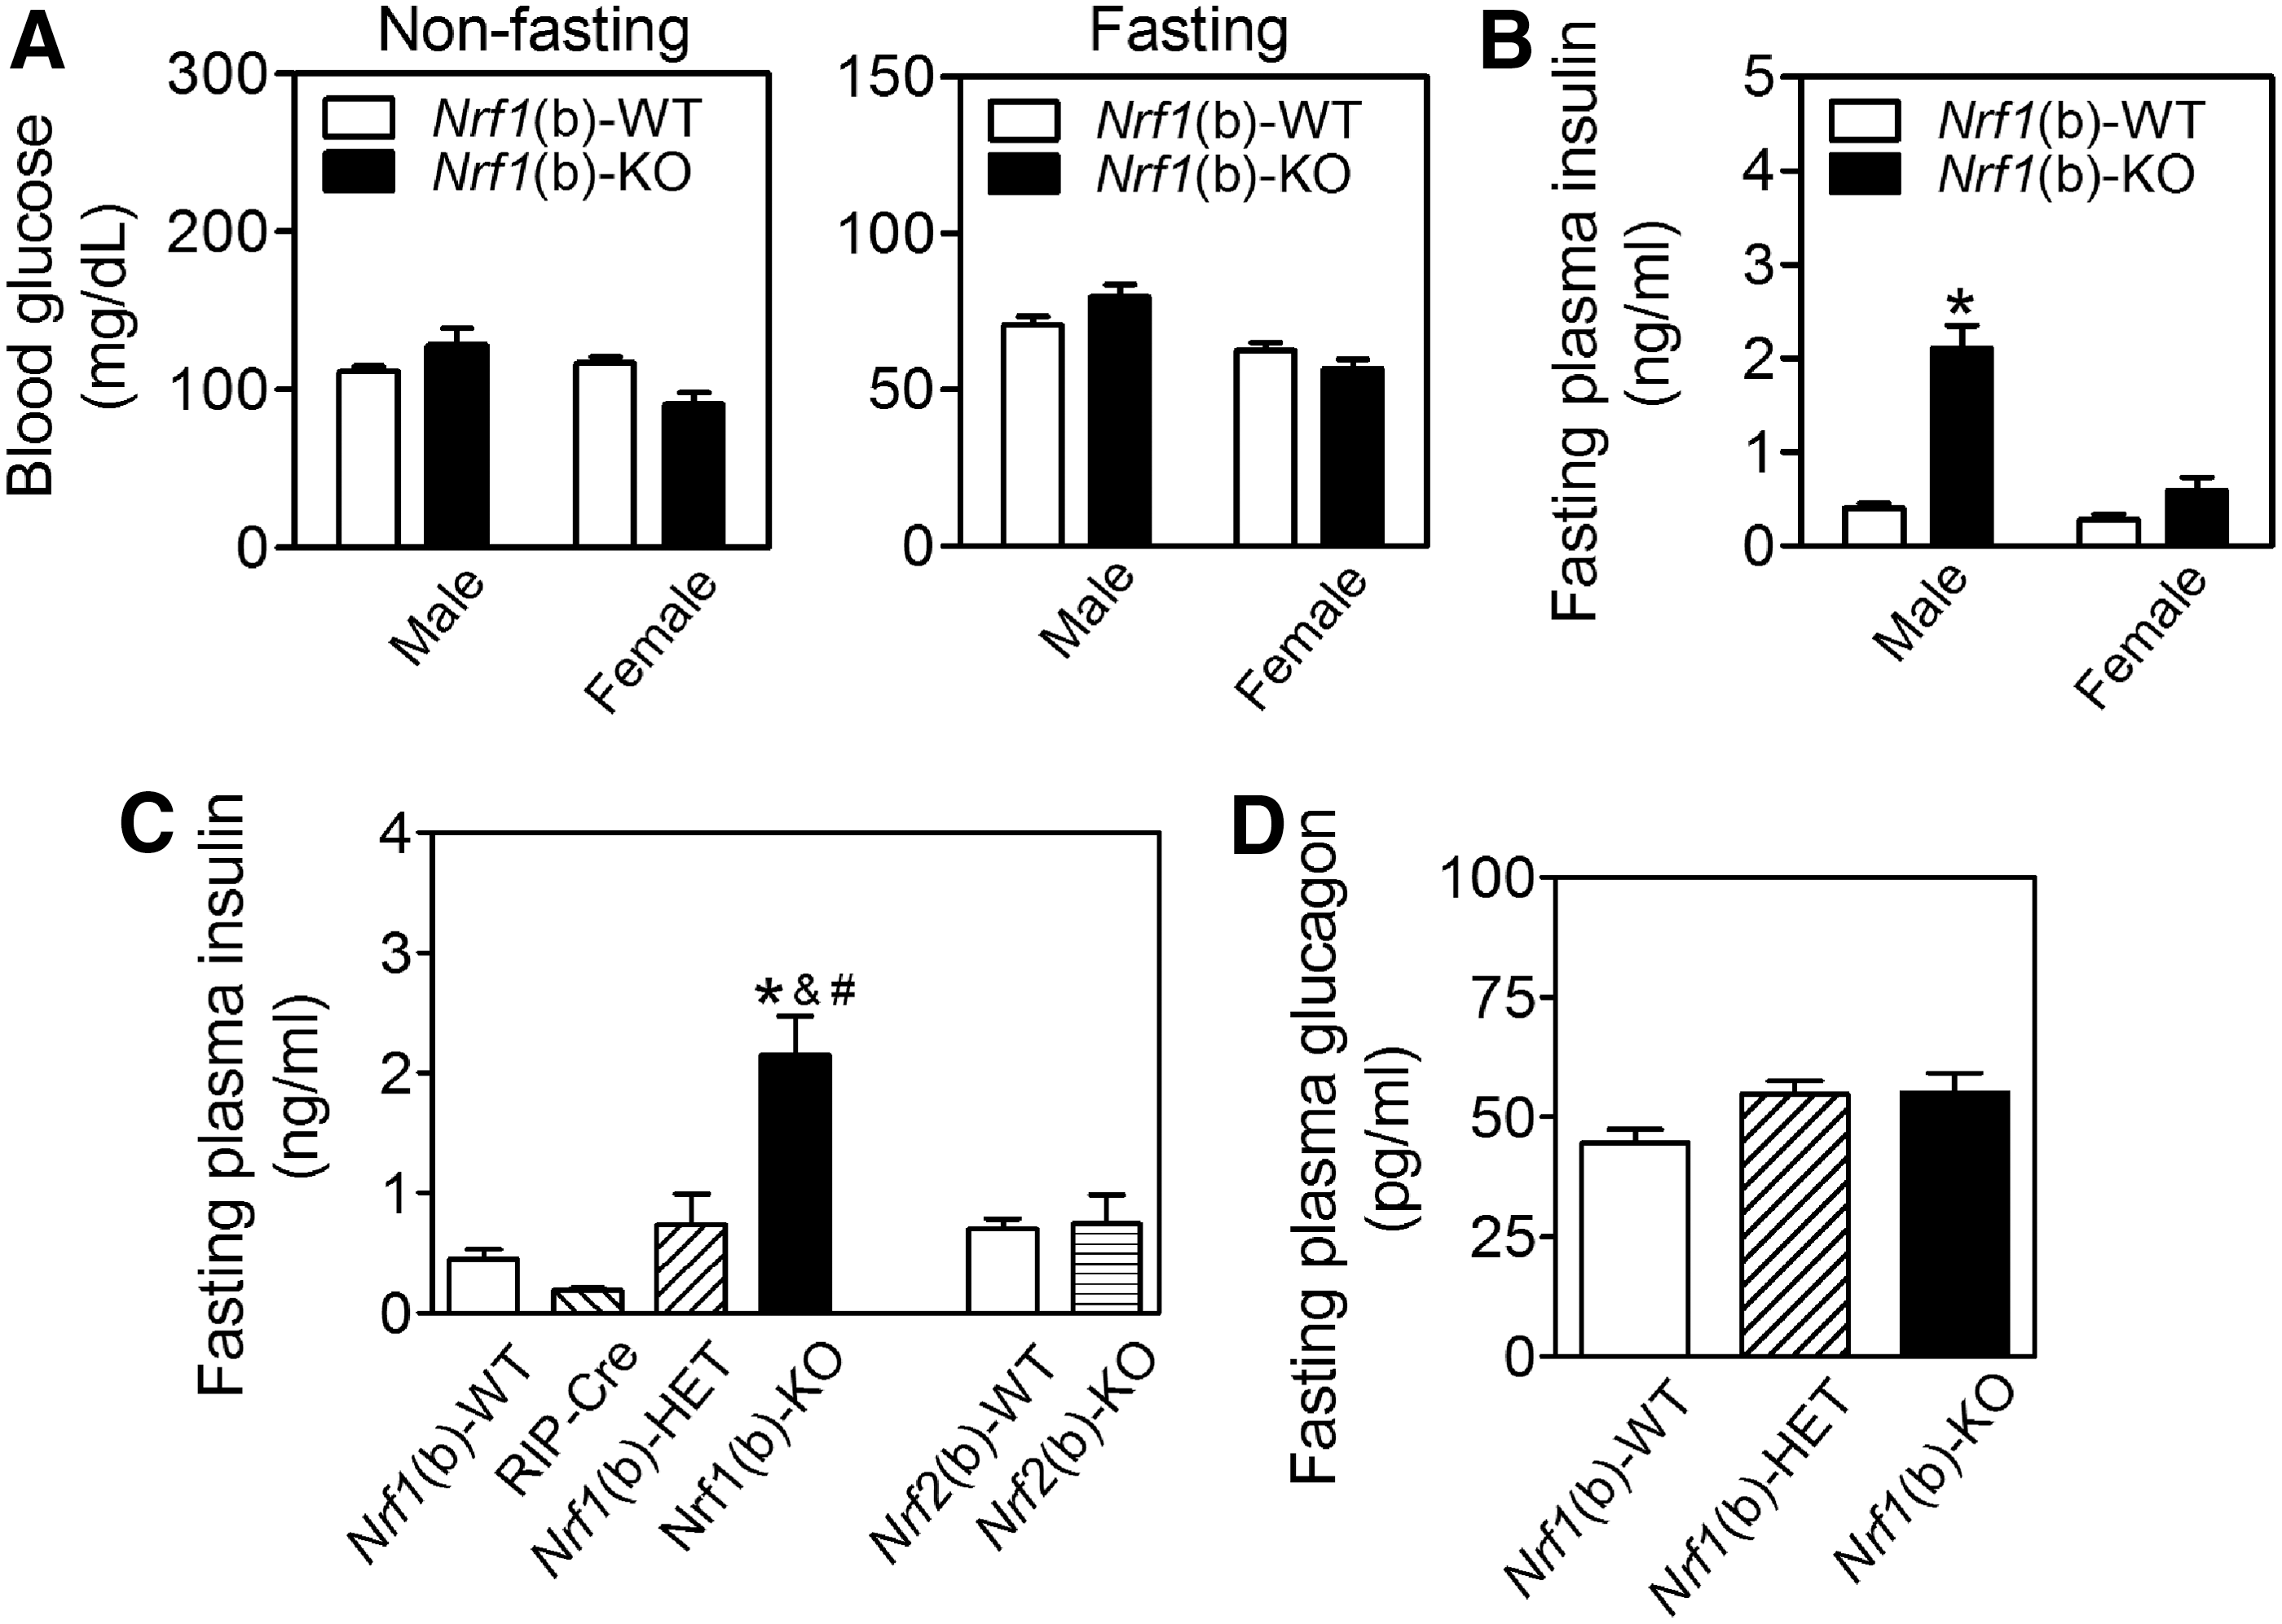
To further study the role of Nrf1 in β-cell function, we generated a line of mice with specific deletion of Nrf1 in pancreatic β-cells. Compared with wild-type littermates [Nrf1(b)-WT], the only tissue with reduced Nrf1 mRNA in the β-cell-specific Nrf1-knockout [Nrf1(b)-KO] mice was the islets. No changes were seen in mRNA for this variant in heart, liver, skeletal muscle, or spleen (Supplementary Fig. S4). In the brain, the mRNA expression of Nrf1 slightly decreased in the hypothalamus, but not in cerebrum and cerebellum, an observation consistent with the expression pattern of Cre combinase of RIP-Cre mice (43). On a normal chow diet, Nrf1(b)-KO mice had similar food intake to their littermates. However, both male and female Nrf1(b)-KO mice gained weight at a slightly higher rate (Supplementary Fig. S5A) and by week 13–17, they had a marginally higher average body weight than Nrf1(b)-WT mice (Supplementary Fig. S5B). Consistent with the changes in body weight, male Nrf1(b)-KO mice showed larger retroperitoneal and epididymal visceral white adipose tissue pads compared with their wild-type littermates (Supplementary Fig. S5C).
The deficiency of Nrf1 in β-cells did not significantly affect fasting or nonfasting blood glucose levels (Fig. 2A). However, Nrf1(b)-KO mice, in particular males, developed severe hyperinsulinemia (Fig. 2B, C) with glucose intolerance (Supplementary Fig. S6). The average fasting plasma insulin level in male Nrf1(b)-KO mice was about 6.0 times higher than that of Nrf1(b)-WT mice (Fig. 2B). In addition, fasting plasma insulin levels of age-matched male Nrf1(b)-KO mice were also significantly higher than those in either RIP-Cre control or Nrf1(b)-HET mice (Fig. 2C). The plasma levels of glucagon showed no significant difference among Nrf1(b)-KO, Nrf1(b)-HET, and Nrf1(b)-WT mice (Fig. 2D). As a comparison, fasting plasma insulin showed no significant difference between Nrf2(b)-WT and Nrf2(b)-KO male mice, which were developed by using the same RIP-Cre system as for Nrf1(b)-KO mice (Fig. 2C). These findings clearly demonstrated that the hyperinsulinemia observed in Nrf1(b)-KO mice is attributable to Nrf1 deficiency, rather than a result of the confounding effect of RIP-Cre integration. Homeostatic model assessment for insulin resistance (HOMA-IR) in male Nrf1(b)-KO mice was significantly higher than that in Nrf1(b)-WT mice (Supplementary Fig. S7). Nrf1(b)-KO female mice also tended to display a higher HOMA-IR level than Nrf1(b)-WT female mice (Supplementary Fig. S7). Intraperitoneal insulin tolerance test performed in three pairs age-matched female mice showed a trend that Nrf1(b)-KO mice are more insulin resistant (Supplementary Fig. S8).
Nrf1(b)-KO islets exhibited elevated basal insulin release but reduced GSIS
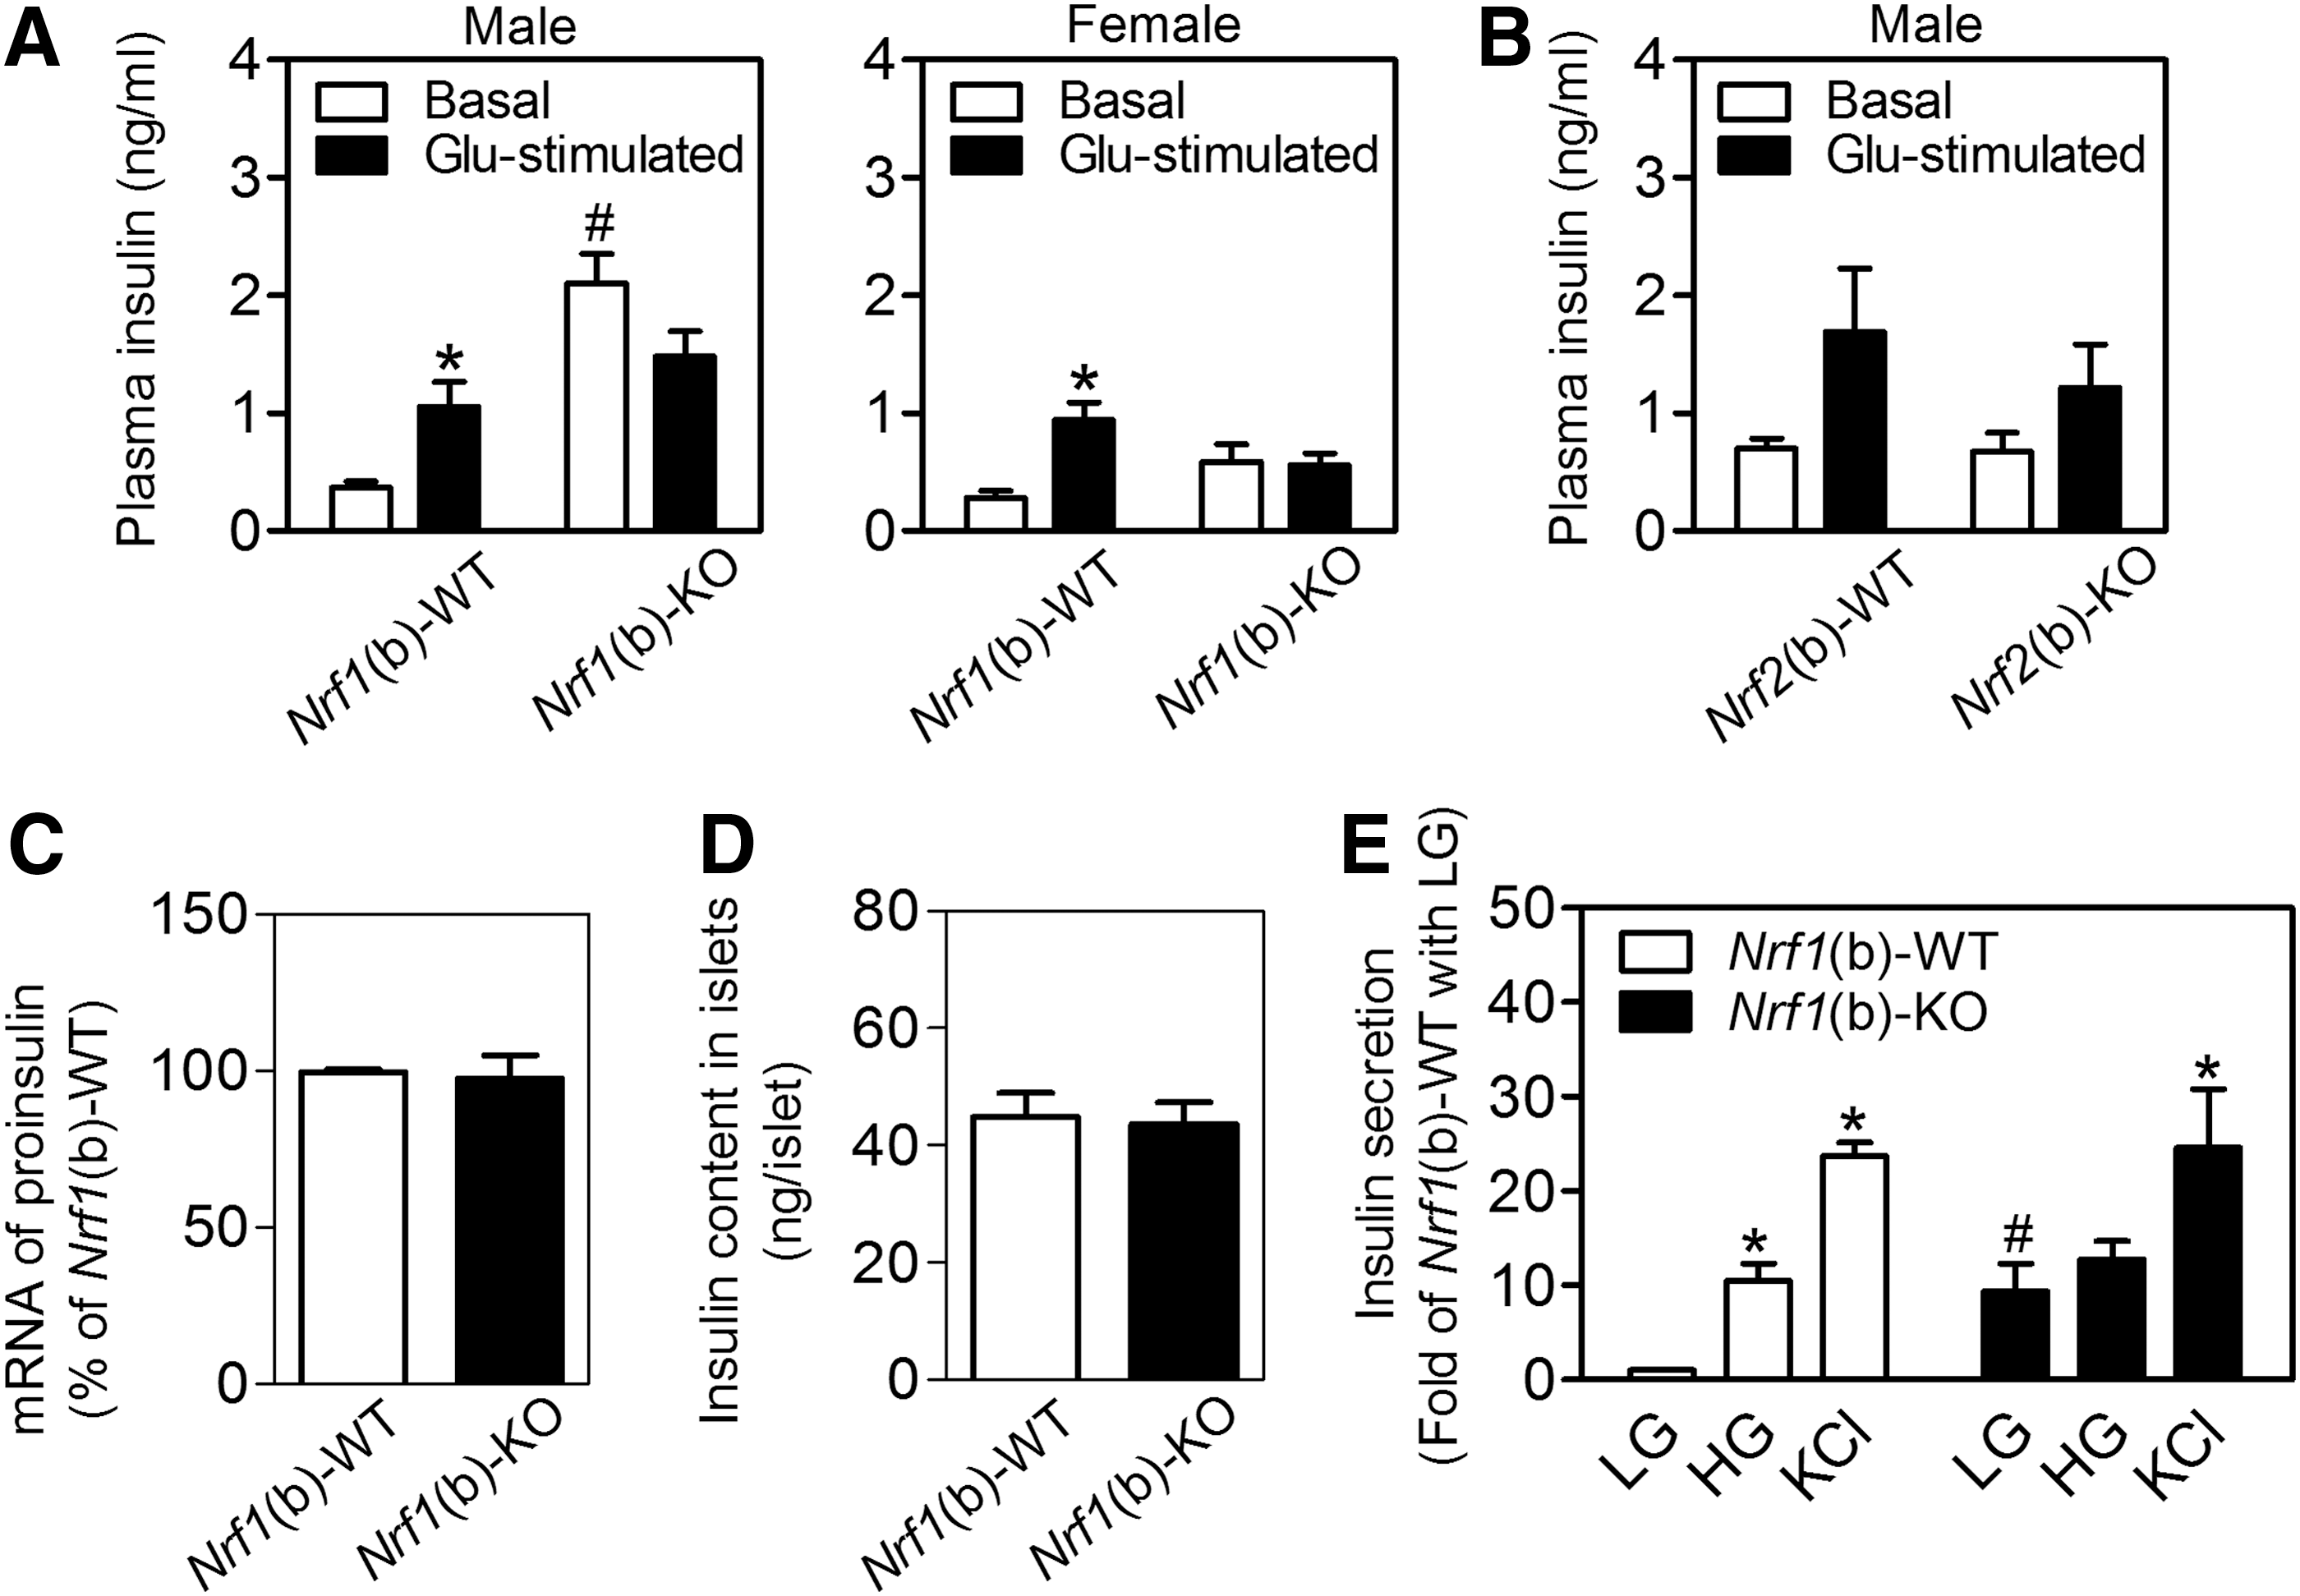
Protein expression of insulin and glucagon in pancreatic islets measured by immunostaining (Supplementary Fig. S9A) and relative protein content of insulin in whole pancreas (Supplementary Fig. S9B) were similar between the genotypes. The plasma insulin levels of Nrf1(b)-WT mice exhibited a robust response to acute glucose stimulation by showing a significant increase post glucose intraperitoneal injection (Fig. 3A). Interestingly, Nrf1(b)-KO mice that had elevated basal (fasting) plasma insulin levels essentially lost the responsiveness to glucose stimulation (Fig. 3A). This insulin response profile closely resembles pre-T2D conditions. In contrast, neither basal insulin release nor GSIS showed a significant difference between Nrf2(b)-WT and Nrf2(b)-KO mice generated by using the same RIP-Cre mice as in Nrf1(b)-KO mice (Fig. 3B). In agreement with the in vivo measurements, the mRNA (Fig. 3C) and protein (Fig. 3D) expression of insulin in isolated islets showed no significant difference between Nrf1(b)-KO and Nrf1(b)-WT mice. Although insulin secretion from cultured Nrf1(b)-KO islets under low-glucose (3 mM) condition was dramatically higher than that of Nrf1(b)-WT mice, the insulin secretion response of Nrf1(b)-KO islets to high glucose (16.7 mM) was very small. In contrast, there was no difference of KCl-triggered insulin release between genotypes (Fig. 3E). These in vitro results are similar to those found with MIN6 cells with all-isoform Nrf1 knockdown (Fig. 1F).
Impaired insulin secretion induced by Nrf1 silencing is associated with altered glucose metabolism
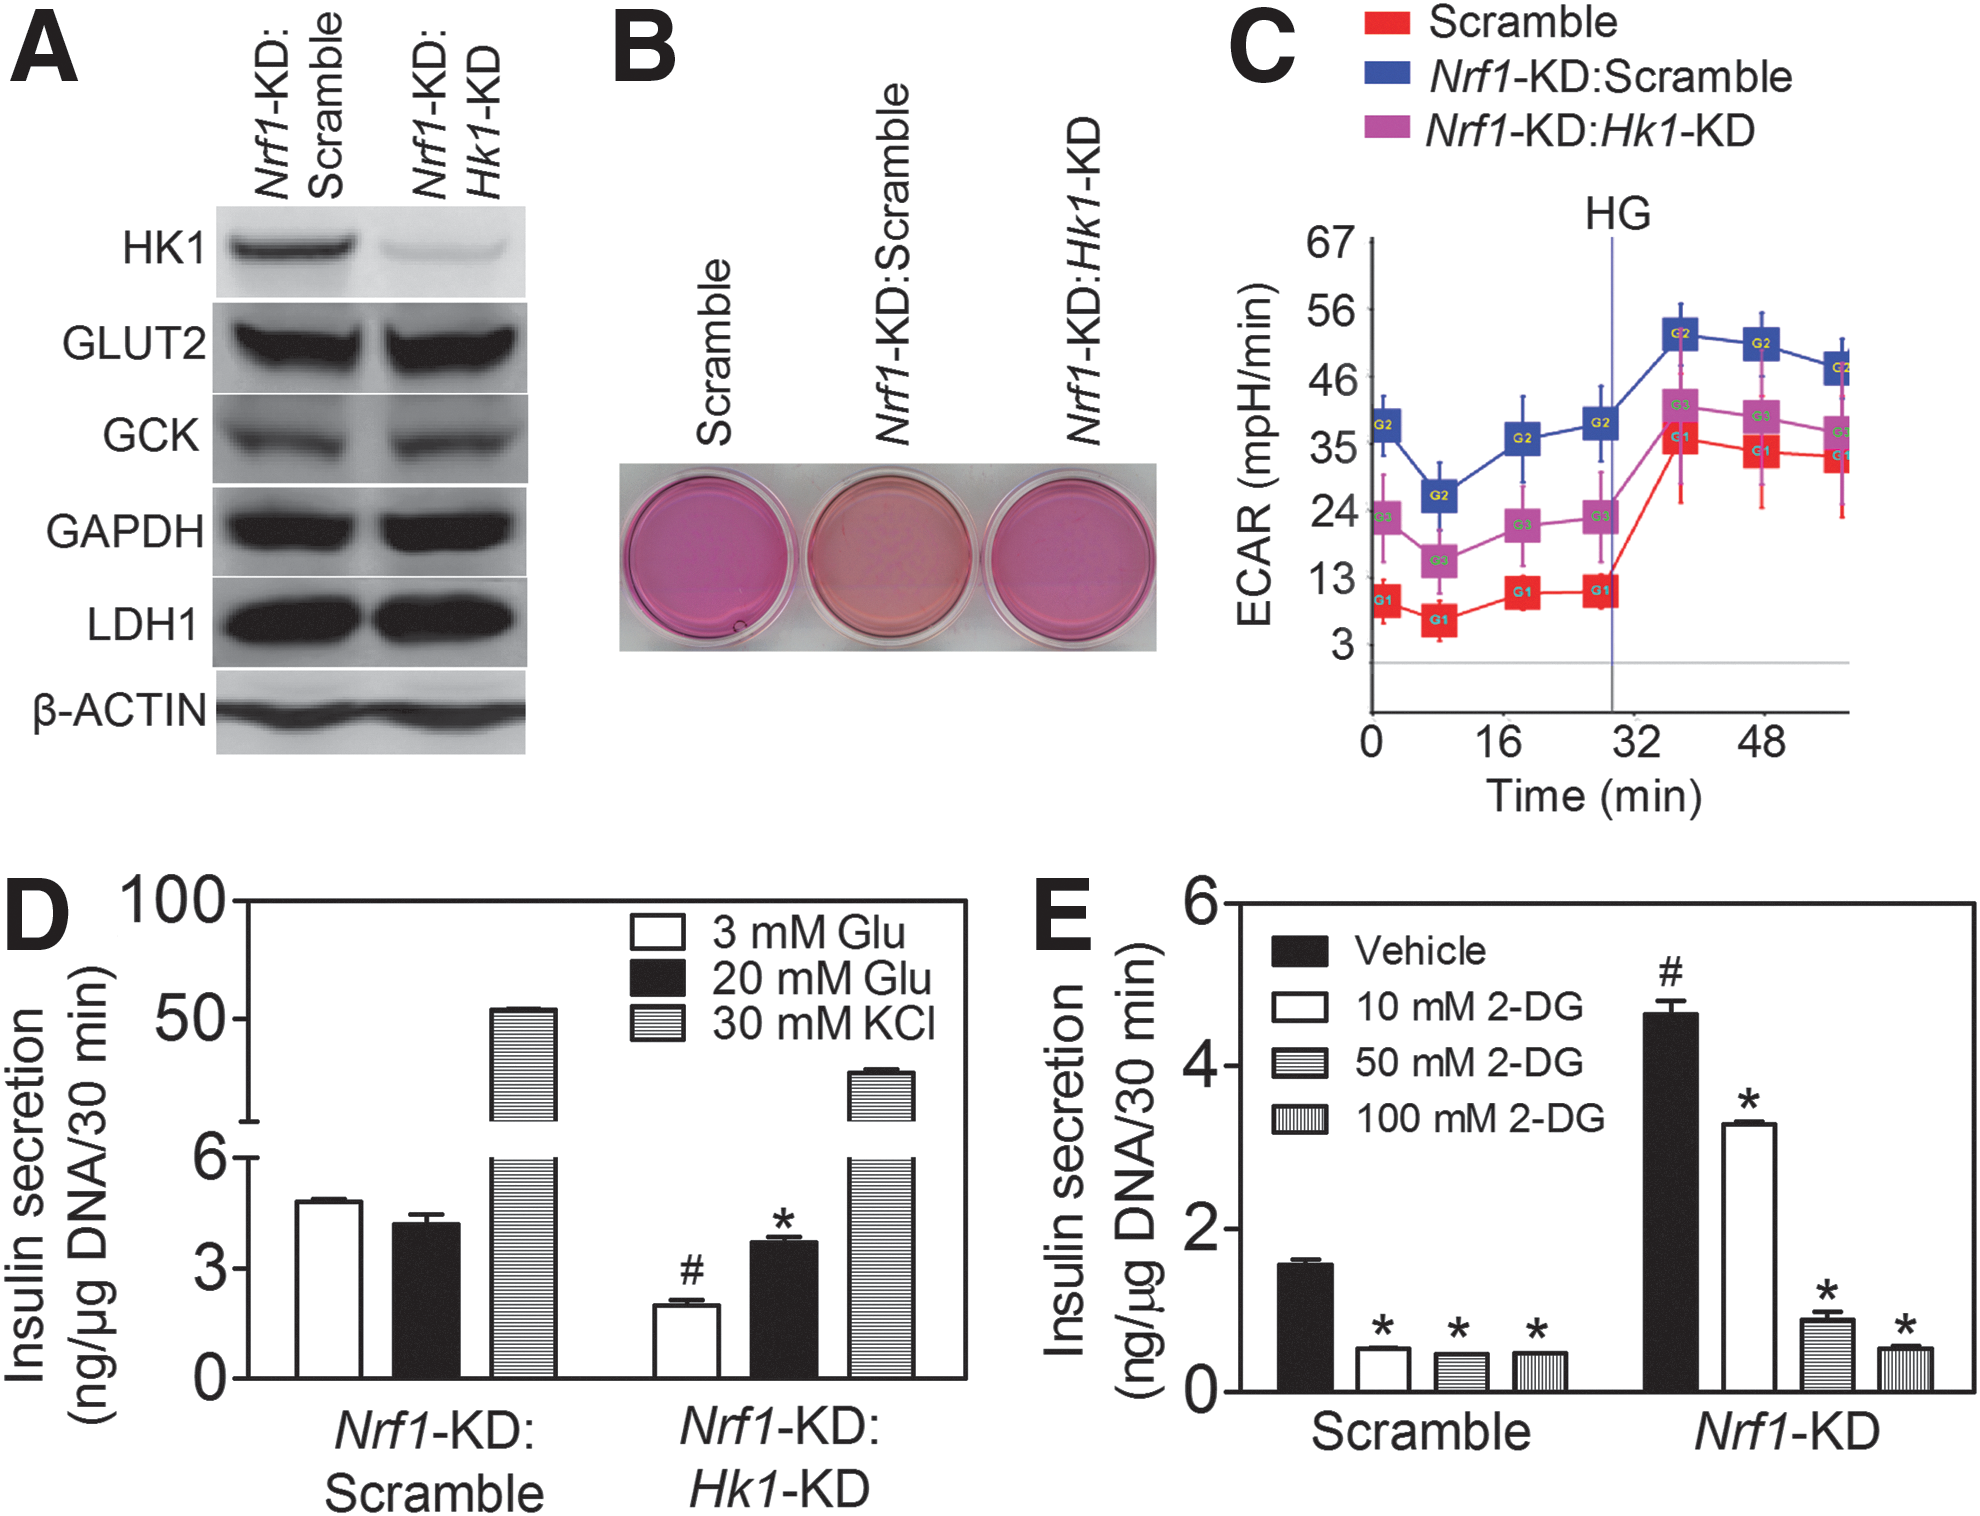
Glycolysis and mitochondrial metabolism leading to accelerated ATP generation and increased ATP/ADP ratio are key signaling events in GSIS (16). To investigate the mechanism(s) by which Nrf1 deficiency in β-cells leads to impaired insulin secretion, we first examined the metabolic profiles of Nrf1-KD MIN6 cells and Nrf1(b)-KO mouse islets. As shown in Figure 4A–C, Nrf1-KD MIN6 cells and/or Nrf1(b)-KO islets displayed substantially increased NADPH/NADP ratio and ATP/ADP ratio under basal (low glucose) conditions. In addition, intracellular calcium levels in Nrf1-KD MIN6 cells in response to glucose stimulation displayed a pattern similar to the ATP/ADP ratio, showing elevated basal level and reduced response to glucose stimulation (Fig. 4D). These findings may particularly explain the elevated basal insulin secretion observed in Nrf1 deficiency MIN6 cells and islets (Figs. 1F and 3E). Compared with Scramble cells, the ATP production of Nrf1-KD MIN6 cells had almost no response to high glucose challenge (Fig. 4E). When mitochondrial oxidation was blocked with various agents, there was less reduction in ATP content in Nrf1-KD MIN6 cells than that in Scramble cells (Fig. 4E). Thus, mitochondrial oxidative phosphorylation may not contribute as much to total ATP when Nrf1 is deleted. Interestingly, glycolysis may be a more significant source of ATP production in Nrf1-KD cells, because inhibition of glycolysis with 2-deoxy-

Aberrant expression of glycolytic proteins in Nrf1-KD MIN6 cells
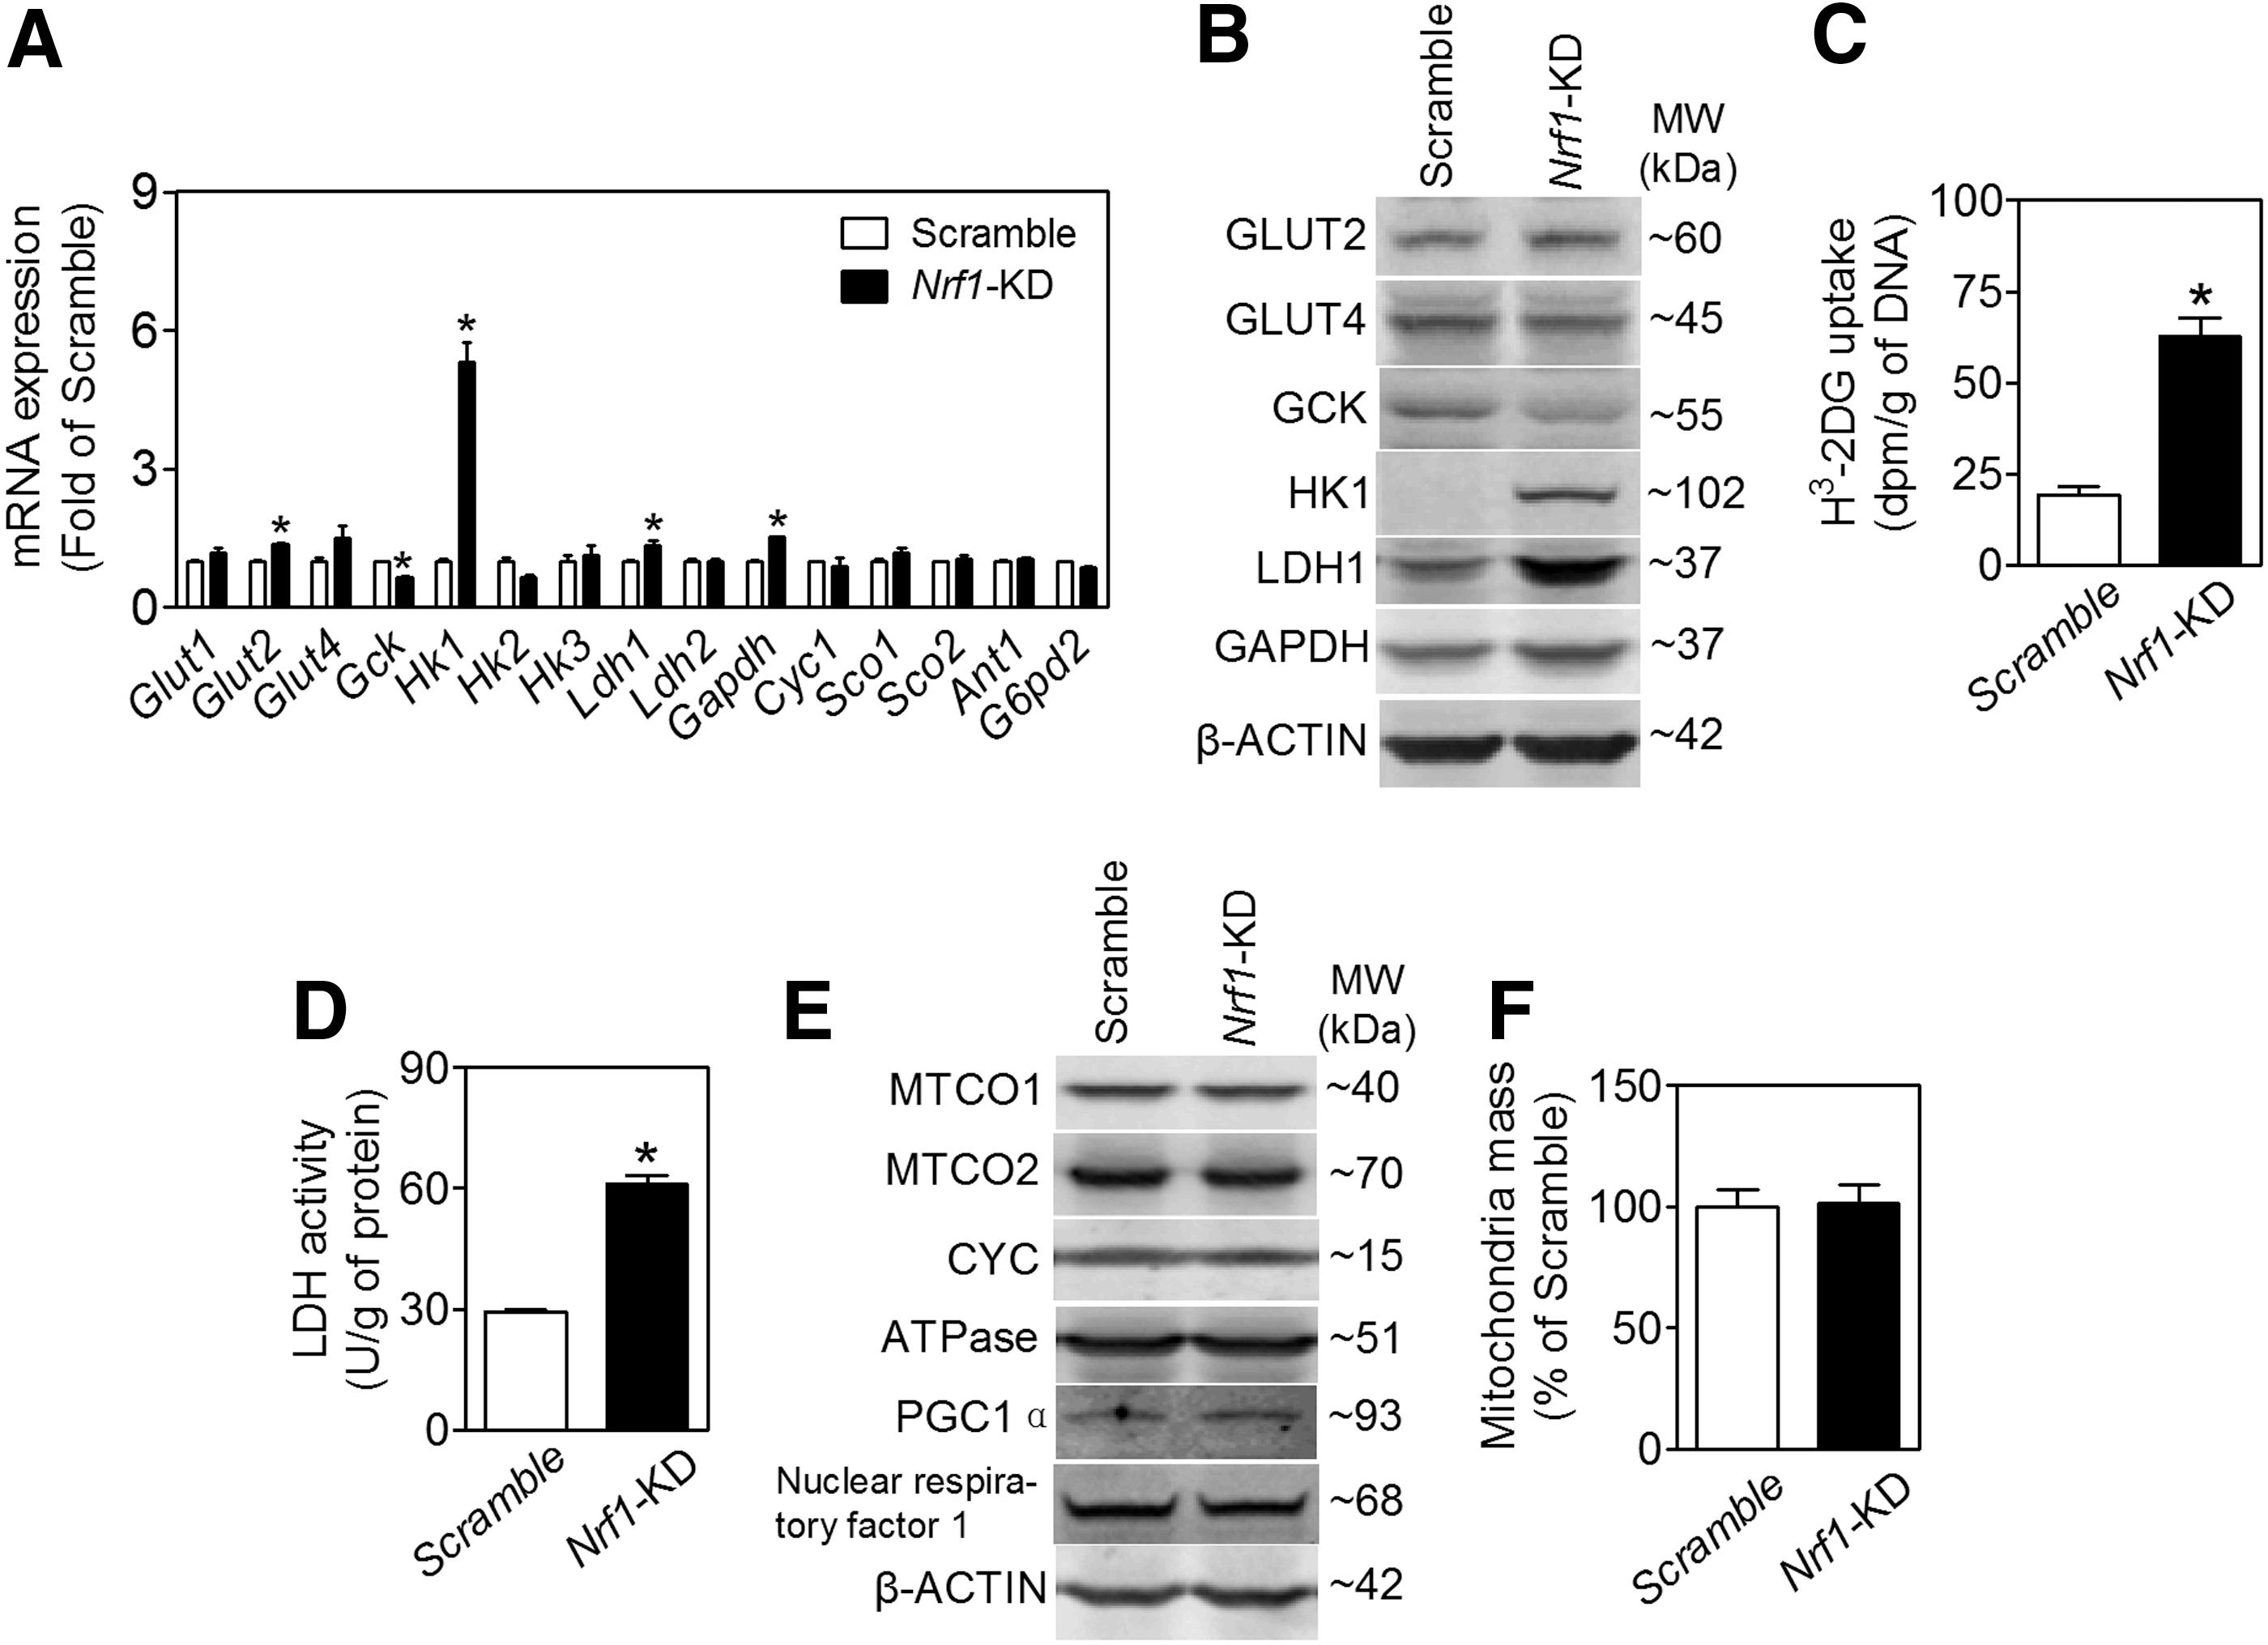
GSIS is closely coupled to glucose uptake, metabolism, and ATP production in pancreatic β-cells (15). Consistent with the glucose metabolic and insulin secretion profile described earlier, Nrf1-KD MIN6 cells expressed enhanced levels of glucose transporter 2 (GLUT2), lactate dehydrogenase 1 (LDH1), glyceraldehyde 3-phosphate dehydrogenase (GAPDH), and hexokinase 1 (HK1) (Fig. 5A, B). In contrast, glucokinase (GCK, also known as HK4) is decreased (Fig. 5A, B). As seen with the Nrf1-KD MIN6 cells, expression of HK1 in Nrf1(b)-KO islets also tended to increase compared with Nrf1(b)-WT islets (Supplementary Fig. S11). Other factors related to cellular metabolism, including expression of p53 and phosphorylation of AKT and AMP-activated protein kinase α (AMPKα), appeared to be upregulated (Supplementary Fig. S12) in Nrf1-KD MIN6 cells. As expected with elevated protein expression of GLUT2 and LDH1, Nrf1-KD cells also had significantly increased glucose uptake (Fig. 5C) and LDH activity (Fig. 5D). Silencing of Nrf1 did not affect mitochondrial proteins, including complex I (MTCO1), complex II (MTCO2), cytochrome c (CYC), gamma subunit of ATP synthase F1 complex (ATPase), and mitochondrial biogenesis-related factors, for example, peroxisome proliferator-activated receptor gamma coactivator 1α (PGC1α), PGC1β, and nuclear respiratory factor 1 (Fig. 5E and Supplementary Fig. S13). Knockdown of Nrf1 also did not alter mitochondrial mass (Fig. 5F).
In agreement with the findings in MIN6 cells, stable knockdown of Nrf1 in another β-cell line, β-TC6 insulinoma cells, also resulted in significant increases in Hk1 mRNA expression, ECAR, and basal insulin release (Supplementary Fig. S14). Of note, the basal expression of Hk1 in β-TC6 cells is much higher than that in MIN6 cells, which may be associated with the reduced GSIS in β-TC6 cells.
Silencing of HK1 rescues the impaired glycolysis and GSIS in Nrf1-KD MIN6 cells
Mannose and fructose, but not galactose, are, similar to glucose, substrates of HK and may enter the glycolysis pathway directly as fructose-6-phosphate. The insulin secretion profile of Nrf1-KD cells in response to glucose, mannose, fructose, and galactose (Fig. 1F and Supplementary Fig. S3) suggests that induction of Hk1 by Nrf1 silencing may be a key event underlying the phenotype. To further test the hypothesis that Nrf1 deficiency-induced expression of Hk1 is responsible for the altered glucose metabolism and insulin secretion in pancreatic β-cells, we determined the effect of silencing Hk1 in Nrf1-KD MIN6 cells on glycolysis and GSIS. One of the five lentiviral shRNAs against mouse Hk1 markedly attenuated the protein expression of HK1 in Nrf1-KD cells, but did not affect GLUT2, GCK, and LDH (Fig. 6A). Importantly, the impairment of ECAR and insulin secretion of Nrf1-KD cells was substantially reversed by Hk1 silencing (Fig. 6B–D). In addition, glycolysis appears to be a primary contributor to the enhanced basal insulin release in these cells because glycolytic inhibitor 2-DG caused a dose-dependent suppression on basal insulin release in Nrf1-KD MIN6 cells (Fig. 6E). Our results here indicate that increased HK1 resulting from silencing of Nrf1 is one of the critical downstream events affecting glucose metabolism and GSIS in MIN6 cells.
Discussion
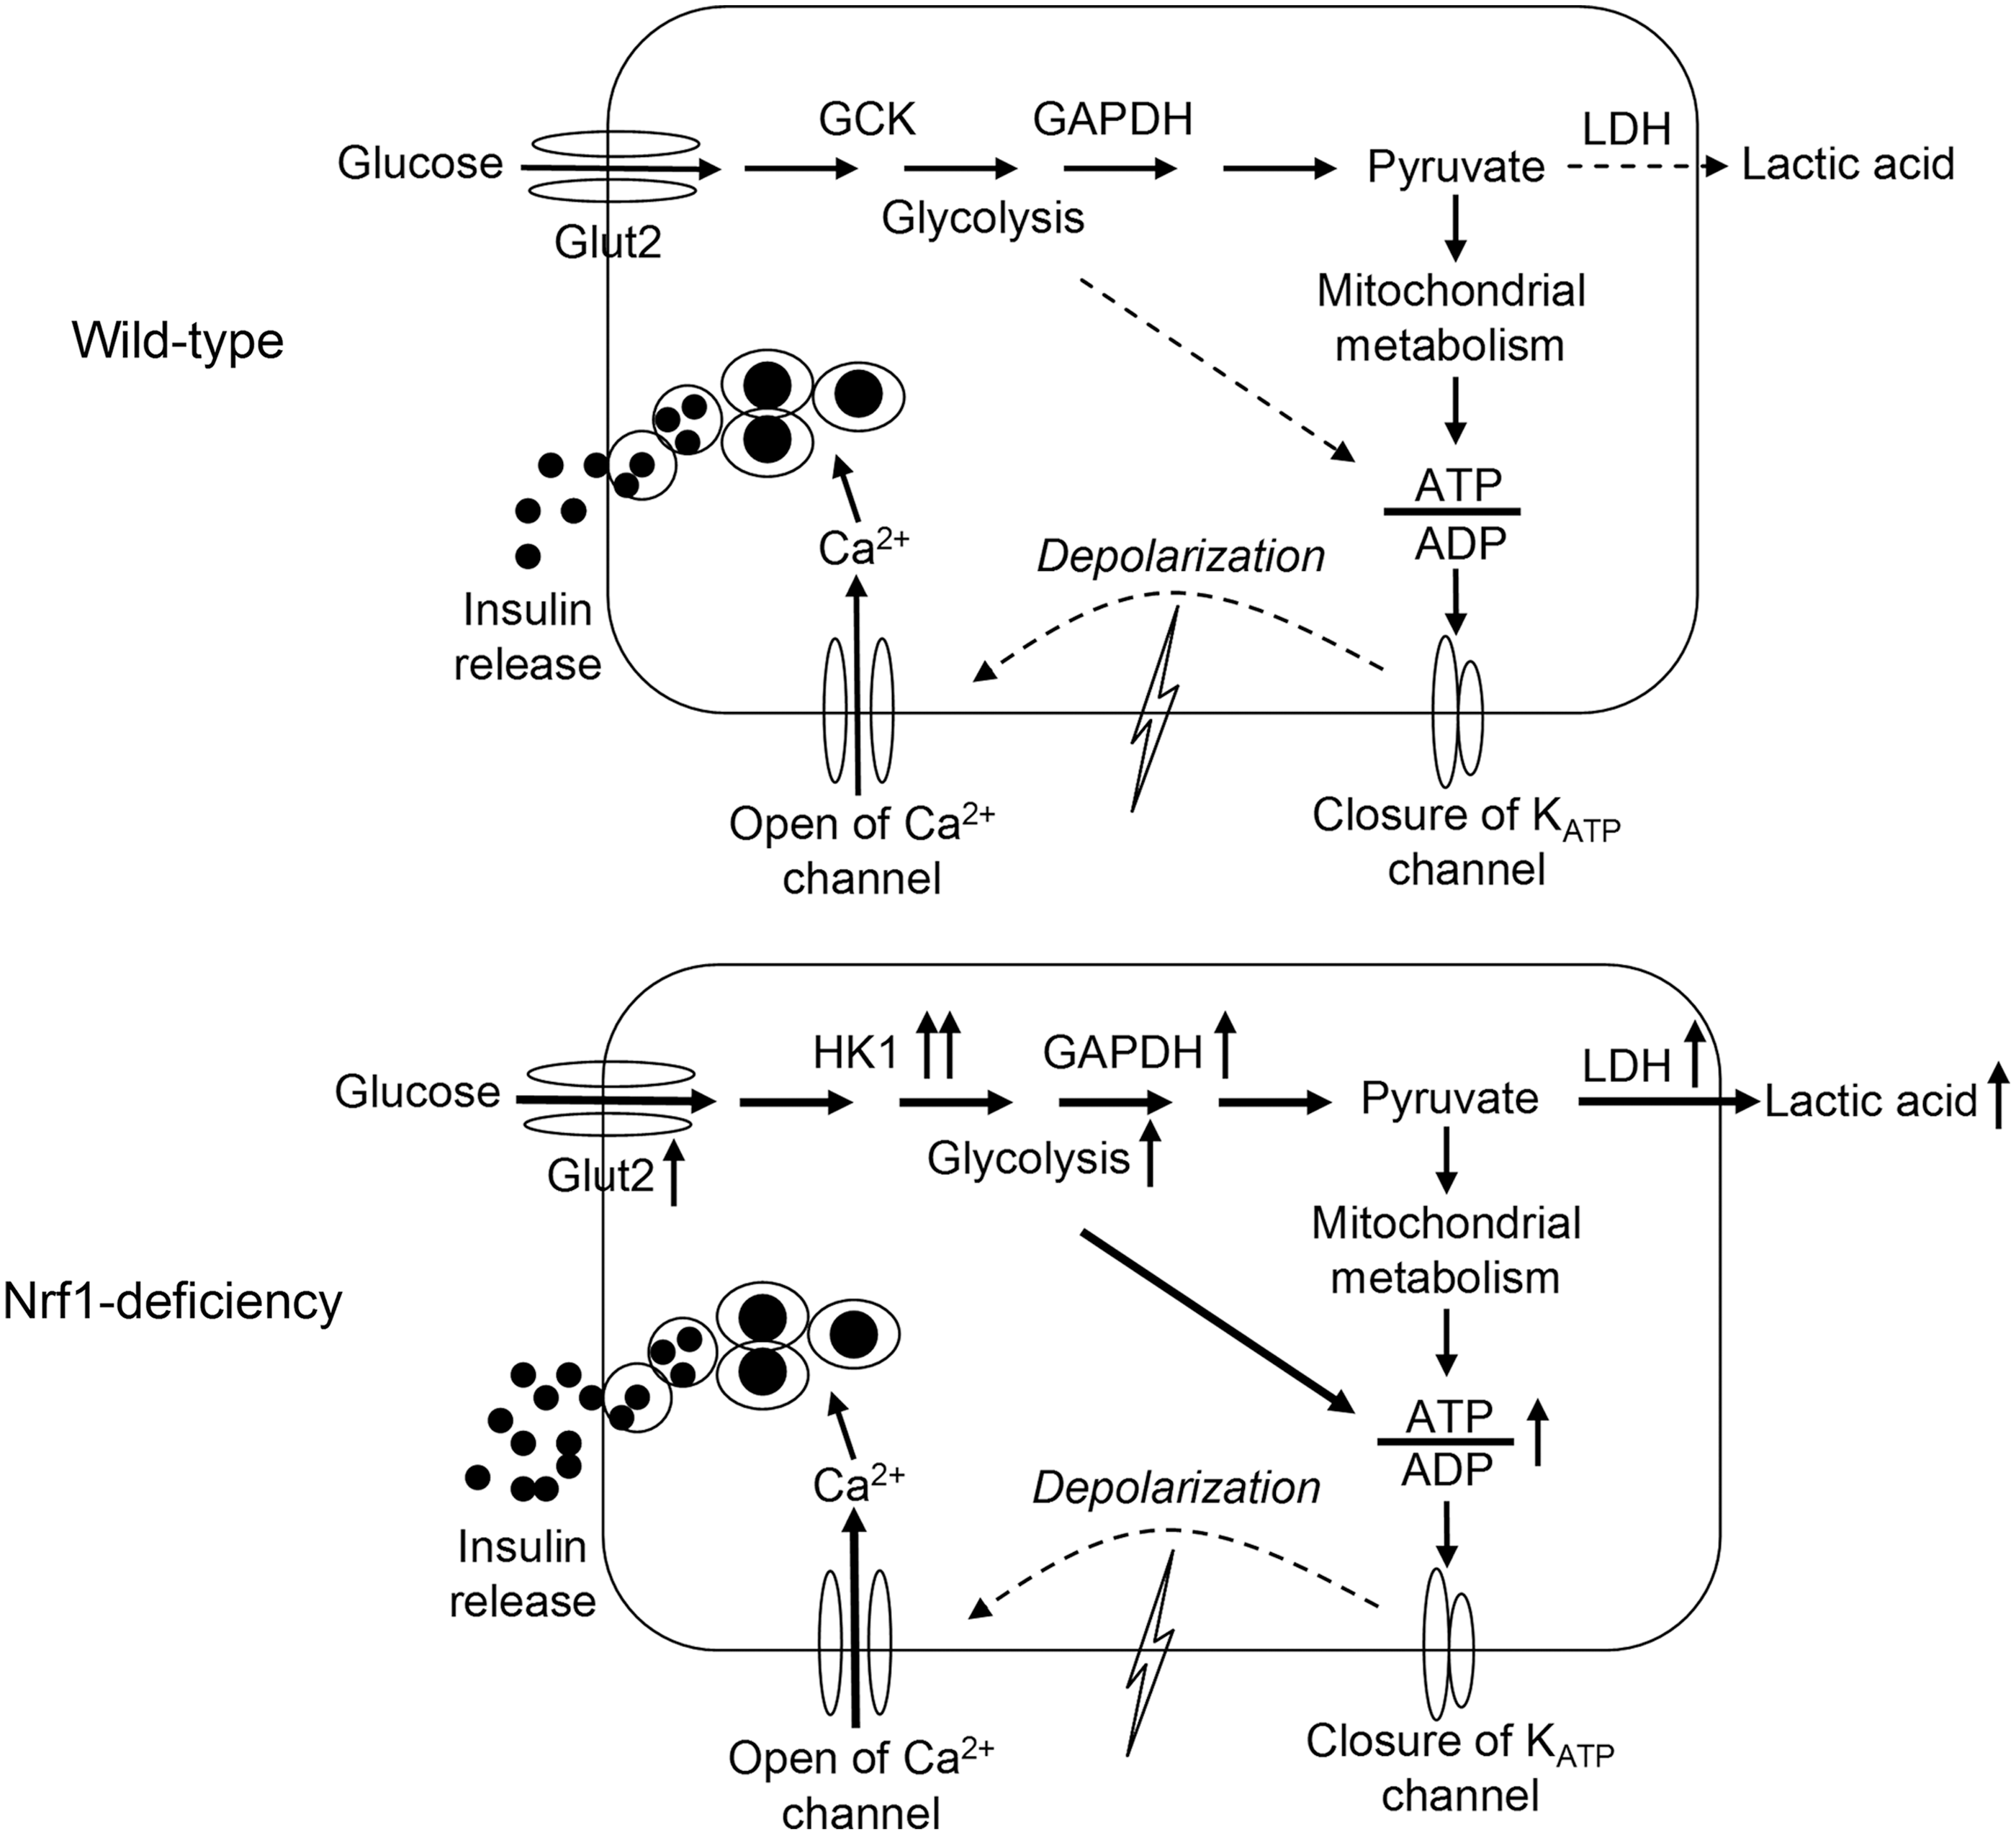
We found that deficiency of Nrf1 in pancreatic β-cells disrupts glucose metabolism and ATP production in the cells and impairs insulin secretion leading to pre-T2D-like metabolic disorders. Specifically, Nrf1-KD β-cells displayed elevated basal insulin release, decreased GSIS, and altered glucose metabolism. The alteration included enhanced glucose uptake and aerobic glycolysis, with upregulation of relevant metabolic enzymes, including GLUT2, HK1, and LDH1. In contrast, the GCK, the predominant form of HKs that phosphorylate glucose in β-cells (17, 39), was significantly downregulated. In agreement with the findings in MIN6 cells, Nrf1(b)-KO islets also showed enhanced basal insulin release and reduced GSIS. Nrf1(b)-KO mice exhibited severe fasting hyperinsulinemia and glucose intolerance. These findings strongly suggest that loss of functional Nrf1 in β-cells may be a risk factor in the development of T2D.
Insulin secretion from β-cells is primarily controlled by glucose, with some contributions from metabolic, neural, hormonal, and pharmacological factors. Proper GSIS requires coordinating glucose uptake, glycolysis, mitochondrial metabolism, cell membrane depolarization, calcium influx, and insulin exocytosis (16). This coordination is subject to a very tight control by many signaling pathways (18): glycolysis and mitochondrial oxidative phosphorylation leading to accelerated ATP generation are two of the most important (16, 28). Glycolysis involves high-affinity HKs and low-affinity GCK in most mammalian cells (30). Because the expression levels of high-affinity HKs are very low in islet β-cells, the low-affinity GCK serves as the primary kinase controlling the rate-limiting step of glycolysis in β-cells (4, 15, 16, 39). In addition, LDH, the enzyme that catalyzes the interconversion of pyruvate and lactate and their co-substrates NADH and NAD+ is also expressed at low levels in β-cells (39). In this manner, high fractions of pyruvate, generated through glycolysis in the cells, go to the mitochondria for oxidation through the tricarboxylic acid cycle (1). Tight coupling between glycolysis and mitochondrial oxidation of pyruvate is required for robust insulin secretion (1, 31). This coupling is the reason that forced overexpression of HK1 in β-cells perturbs glycolysis and mitochondrial metabolism, leading to impaired basal insulin release and GSIS (4, 5). Acute overexpression of LDH1 also impairs β-cell mitochondrial metabolism and insulin secretion (1). Nonetheless, not all the factor(s) that coordinate glycolysis and mitochondrial oxidative phosphorylation in β-cells are completely defined. This study demonstrates that loss of Nrf1 results in a dramatically enhanced glycolysis and impaired insulin secretion. In these cells ATP production is largely dependent on the augmented glycolysis rather than mitochondrial oxidation. ATP production in Nrf1-KD MIN6 cells was less sensitive to mitochondrial complex blockers but more sensitive to glycolytic inhibition. Since silencing of Hk1 normalized most of the phenotypes of Nrf1-KD MIN6 cells, the aberrant expression of HKs (e.g., dramatic induction of high-affinity HK1 and repression of low-affinity GCK) is likely responsible for the elevated glycolysis and reduced responsiveness to glucose (Fig. 7). Uncovering the detailed mechanisms of how Nrf1 modulates the expression of HKs will require further study. With regard to the enhanced OCR in Nrf1-KD cells, our measurements revealed that OCR, but not EACR, can be significantly reduced by inhibition of AMPK or β-oxidation (Supplementary Fig. S15), suggesting that β-oxidation and AMPK activity may be upregulated in the cells and partially responsible for their enhanced OCR. However, the mechanistic details behind the phenotype still need further investigation.
Due to alternative RNA splicing, translation, and/or proteolysis, Nrf1 exists as peptides of varying size. At this juncture, we do not understand the expression, function, and tissue distribution of various isoforms of Nrf1. Long isoforms of Nrf1 (L-Nrf1s, 742, 761, and 772 aa in human; 741 and 742 aa in mouse) are modified in the ER and in coordination with Nrf2 regulate cellular adaptive antioxidant response via ARE (6, 24, 49, 50). In addition, L-Nrf1s play a crucial role in proteasome homeostasis by regulating ARE-dependent proteasomal genes (37, 40). More recently, Kwong et al. found that Nrf1b (584 aa in human; 583 or 572 aa in mouse) is targeted to the nucleus where it activates ARE-genes (23). In contrast, Nrf1-p65 (447 aa in human; 453 aa in mouse) is a dominant negative regulator of ARE-mediated transcription (42). Since L-Nrf1s regulate the transcription of multiple antioxidant enzymes involved in GSH synthesis and ROS detoxification (6, 24, 49, 50), reduction of intracellular GSH and elevated accumulation of ROS in Nrf1-KD cells may be attributed to the absence of L-Nrf1s. In addition, Nrf1 silencing-induced alteration in mitochondrial metabolism may also affect cellular redox homeostasis. Importantly, silencing of all isoforms, but not long isoforms-specific knockdown (Supplementary Fig. S16), resulted in impaired β-cell function. One or more of the multiple short isoform(s) of Nrf1 may play fundamental roles in regulating glucose metabolism and glucose sensing in β-cells. However, isoform(s) of Nrf1 that regulates these processes is not known.
The RIP-Cre mice, where a short fragment of the rat insulin II gene promoter controls Cre recombinase, have been widely used to generate β-cell-specific KO mice (29, 43), and more recently, brain-specific silencing (22). While most of the studies using pancreatic β-cell-specific KO mice derived from RIP-Cre line demonstrated pronounced glucose metabolism phenotypes, the RIP-Cre mice alone display glucose intolerance and impaired insulin secretion (26). Thus, integration or expression of Cre recombinase itself may be responsible for some of the phenotypes initially thought to be caused by gene targeting. This concern is particularly worrisome in the studies without RIP-Cre mice as controls. Since RIP-Cre is also expressed in some neurons (22), caution should be taken regarding the systemic parameters that could be influenced not just by the operation of islets but also of central nervous system.
In this study, we found that Nrf1(b)-KO, but not Nrf1-flox knock-in (KI), RIP-Cre alone or even Nrf1(b)-HET mice, developed severe hyperinsulinemia. In contrast, Nrf2(b)-KO mice, which were developed by using the same RIP-Cre mice as in Nrf1(b)-KO line, showed no increased levels of fasting plasma insulin. Thus, the hyperinsulinemia observed in Nrf1(b)-KO mice is due to disruption of Nrf1 in pancreatic β-cells, even though the potential contribution of hypothalamus to the phenotype cannot be fully excluded. Of note, hyperinsulinemia is widely considered a compensatory response to insulin resistance, and prolonged hyperinsulinemia per se can induce insulin resistance and obesity (7, 9, 32). The hyperinsulinemia observed in Nrf1(b)-KO mice may, at least in part, account for their glucose intolerance.
In contrast to normal differentiated cells, most cancer cells rely on aerobic glycolysis to generate ATP (27). This shift from oxidative phosphorylation to glycolysis for energy by cancer cells is called the Warburg effect. Multiple TFs, including p53, AKT, mammalian target of rapamycin, hypoxia-induced factor 1α (HIF1α), and AMPK, may contribute to the altered glucose metabolism in cancer cells (27). Interestingly, because the expression of phosphorylated AKT, p53, and phosphorylated AMPKα trended higher in Nrf1-KD MIN6 cells, these proteins may be involved in Nrf1 deficiency-induced alteration of glucose metabolism in β-cells. In light of the importance of the Warburg effect in cancer biology, studies on the regulatory role of Nrf1 in β-cell metabolism and glucose sensing are likely to enhance our understanding of cancer cell proliferation control.
The biochemical mechanism underlying insulin secretion and β-cell toxicity has been extensively studied with the aim of identifying therapeutic targets for diabetes for decades. Although several concepts have been developed and targets have been identified, the progress to improve β-cell function and/or survival made so far clearly does not meet the clinical demands in the face of the rapidly increasing prevalence of diabetes. This study shows the critical roles of Nrf1 in regulating the coupling of glycolytic and mitochondrial metabolism and of controlling insulin secretion in pancreatic β-cells. These findings suggest that Nrf1 and its regulated pathways may be novel pharmacological targets to improve the function of insulin-secreting β-cells.
Materials and Methods
Cell culture and reagents
MIN6 cells were kindly provided by Dr. Marcia Haigis (Harvard University, Boston, MA) and maintained in Dulbecco's modified Eagle's medium (DMEM) containing 25 mM glucose, with 15% fetal bovine serum (FBS), 100 U/ml penicillin, 100 μg/ml streptomycin, 2 mM
Lentiviral-based shRNA transduction
MISSION shRNA lentiviral vectors were obtained from Sigma and lentiviral particles were prepared by using the manufacturer's protocol. Lentiviral transduction of MIN6 cells with particles for shRNAs targeting mouse Nrf1 (SHVRSNM_008686) or Scrambled nontarget negative control (SHC002V) was performed as previously described (49).
Measurements of intracellular GSH, ROS, and calcium
Intracellular levels of GSH and GSSG were measured immediately after cell collection using a BIOXYTECH GSH/GSSG-412 kit (OxisResearch, Portland, OR) according to the manufacturer's protocol (34). ROS levels were measured by flow cytometry using the fluorescent probe 5-(and-6)-chloromethyl-2′,7′-dichlorodihydrofluorescein diacetate, acetyl ester (CM-H2DCFDA; Life Technologies) as previously described (35). Intracellular calcium in MIN6 cells were measured using a calcium indicator Fluo-4 AM (Life Technologies) in a 96-well plate. After a 30 min incubation with 4 μM of Fluo-4 in Kreb's buffer with 3 mM or 20 mM glucose, the fluorescence intensity of cells was determined by a FlexStation 3 Multi-Mode Microplate reader (Ex: 494 nm, Em: 516 nm; Molecular Devices, Sunnyvale, CA).
Mice
Nrf1(b)-KO mice were developed by crossing the mice bearing an Nrf1 flox allele (33) and Ins2-Cre:B6.Cg-Tg(Ins2-cre)25Mgn/J (RIP-Cre) mice (#003573; Jackson Laboratories, Bar Harbor, ME), which specifically express Cre recombinase in pancreatic β-cells. To generate Nrf1(b)-KO mice, Nrf1 flox/flox KI males were crossed with RIP-Cre-positive females. Resulted Nrf1 flox/−:RIP-Cre-positive mice were crossed with Nrf1 flox/flox KI to generate breeders with a genotype of Nrf1 flox/flox:RIP-Cre-positive mice. Approximately five pairs of Nrf1 flox/flox KI:RIP-Cre-positive breeders were kept to the end of the project. Resulting Nrf1(b)-KO mice with a genotype of Nrf1 flox/flox KI:RIP-Cre-positive and their wild-type littermates (Nrf1 flox/flox KI:RIP-Cre-negative), and RIP-Cre-positive were used in this study. Similarly, pancreatic β-cell-specific Nrf2 knockout [Nrf2(b)-KO] mice were generated by using the RIP-Cre mice and Nrf2 loxP/loxP KI mice previously developed (45). Genotyping was performed by PCR (primer sequences in Supplementary Table S1) using genomic DNA that was isolated from tail snips as previously detailed (33, 45). The mice were housed four per cage in virus-free facilities on a 12-h light/12-h dark cycle, fed an NIH07 chow diet (Zeigler Brothers, Gardners, PA), and provided reverse osmosis water ad libitum. Food intake, water consumption, and body weight were measured weekly. Feed efficiency (grams gained per kilocalorie consumed) was determined per individual mouse. All protocols for animal use were approved by the Institutional Animal Care and Use Committees of The Hamner Institutes and China Medical University, and they were in accordance with the National Institutes of Health guidelines.
Measurements of blood glucose and plasma insulin
Nonfasting and fasting (16 h) blood samples collected from tail bleeds were immediately analyzed for glucose by using the FreeStyle Blood Glucose Monitoring System (TheraSense, Inc., Alameda, CA). For plasma isolation and tissue collection, animals were euthanized by CO2 exposure. Plasma insulin was measured by using the Sensitive Rat Insulin radioimmunoassay (RIA) kit as previously described (34).
Measurements of GSIS in vivo and in vitro
Plasma insulin levels were measured under basal and glucose-stimulated conditions. After a 16-h overnight fasting, mice were given either
Intraperitoneal glucose tolerance test
Intraperitoneal glucose tolerance test (IPGTT) was performed as previously described (45). Briefly, after 16-h fasting, animals received
Immunohistochemistry
Pancreas were fixed, embedded in paraffin, sectioned, and stained as previously described (45). The following primary antibodies against insulin (#15848-1-AP, 1:10,000; Proteintech Group, Inc., Chicago, IL), glucagon (#15954-1-AP, 1:20,000; Proteintech Group, Inc.), and HK1 (#2024, 1:800; Cell Signaling Technology, Inc., Danvers, MA) were used for the staining.
Reverse transcription–polymerase chain reaction
RNA isolation and quantitative real-time PCR (qPCR) were performed as previously described (45). A SensiFAST SYBR Hi-ROX kit (Bioline USA, Inc., Taunton, MA) and an AccuPower HotStart PCR PreMix system (Bioneer, Alameda, CA) were used for qPCR and regular PCR, respectively. The primers were designed by using Primer Express 4 (Applied Biosystems, Waltham, MA) and synthesized by Bioneer, Inc. (Alameda, CA). The primer sequences for qPCR and PCR for diverse isoforms of Nrf1 are listed in Supplementary Tables S2 and S3, respectively. Real-time fluorescence detection was performed by using an ABI PRISM 7900HT Fast Real-time PCR System (Applied Biosystems). The cycling conditions of regular PCR for diverse isoforms of Nrf1 were 94°C for 5 min followed by 35 cycles of 94°C for 30 s, 55°C or 65°C for 30 s, and 72°C for 30 s with a final extension of 72°C for 10 min. Expression levels of 18S were used as loading controls. The PCR products stained with the SYBR Safe (Life Technologies) were separated by a gel electrophoresis with a 2.0% agarose gel.
Immunoblot analysis
Isolation of cell fractions and Western blotting were performed as previously described (45). Antibodies for GLUT4 (#2213, 1:1000), HK-1 (#9711, 1:1000), LDHA (#2012, 1:1000), PGC1α (#2178, 1:500), p-AKT(T308) (#4056, 1:1000), p-AKT(S473) (#9271, 1:1000), Total AKT (#4685, 1:1000), p-PTEN(S380) (#9551, 1:1000), p-AMPK (Thr172) (#2531, 1:1000), AMPK (#2532, 1:1000), p-PDK1 (#3438, 1:1000), and p-PKC (#9371, 1:1000) were purchased from Cell Signaling Technology, Inc. Antibodies against GLUT2 (sc-9117, 1:500), GCK (sc-7908, 1:500), GAPDH (sc-20357, 1:500), ATPase (sc-33618, 1:500), NRF1 (sc-33771, 1:500), P53 (sc-6243, 1:250), and INSULIN (sc-9168, 1:500) were purchased from Santa Cruz, Inc. (Santa Cruz, CA). Antibody for β-Actin (A1978, 1:2000) and HIF1α (H6536, 1:1000) were purchased from Sigma. Antibodies for MTCO1 (459100, 1:1000) and MTCO2 (459200, 1:1000) were from Invitrogen (Life Technologies). Antibody for CYC (556433, 1:1000) was purchased from BD (Becton Dickinson, San Jose, CA). The MW of each protein shown on the immunoblot was estimated based on the MagicMark™ XP Western Protein Standard (Invitrogen) on 12% Tris-Glycine gels (Invitrogen). Quantification of the results was performed with Bio-Rad Quantity One 1-D analysis software (Bio-Rad Laboratories, Hercules, CA).
Measurements of ATP level and ATP/ADP ratio
Cells or islets were washed thrice with ice-cold Kreb's buffer containing the same concentrations of glucose as various treatments and lysed in 1% trichloroacetic acid followed by centrifugation at 12,000 g for 5 min. Resulting supernatants were used immediately for measurement of ATP and ATP/ADP ratio by using the ATP Bioluminescent Assay Kit (Sigma) and ATP/ADP Ratio-Glo™ Assay kit (Promega, Madison, WI), respectively, as per the manufacturer's protocols.
Measurement of ECAR and OCR in MIN6 cells
ECAR and OCR were measured by using the XF24 Extracellular Flux Analyzer (Seahorse Bioscience, Billerica, MA) as previously described (13). MIN6 cells were seeded in XF24-well microplates (Seahorse Bioscience) at 1.0×10⁵ cells per well in 200 μl medium and cultured at 37°C/5% CO2 overnight. Assays were initiated by replacing the growth medium from each well with 600 μl prewarmed Kreb's buffer (3 mM glucose) followed by additions of various reagents as detailed in the legends of Figures 4H, 6C and Supplementary Figure S10A. ECAR and OCR were calculated by using Extracellular Flux Analyzer software based on pH changes and oxygen tension, respectively. At least three independent experiments were performed, and data showed in figures are representative results.
Lactate measurement
Lactate levels in medium were determined by using a commercial lactate assay kit (BioVision, Mountain View, CA) based on an enzymatic reaction catalyzed by lactate oxidase and interaction of the product with a probe to produce fluorescence (at excitation/emission=535/590 nm). The concentration of each sample was calculated by using a standard curve.
LDH activity
Cells were washed twice with ice-cold PBS and lysed in cold PBS by sonication, followed by centrifugation at 12,000 g for 5 min. The resulting supernatants were used immediately for measurement of LDH activity by using a CytoTox 96® Non-Radioactive Cytotoxicity Assay kit (Promega). Briefly, 5 μl of cell lysates (1 μg protein/μl) or LDH standards were incubated with 45 μl PBS (containing 0.5% bovine serum albumin [BSA]) and 50 μl LDH Assay buffer for 30 min in a 96-well plate. After an 1-h incubation with stop solution, the absorbance was determined at 590 nm. Protein concentrations were determined by a Bicinchoninic acid (BCA) protein assay kit (Thermo Scientific Pierce, Rockford, IL) by using BSA as a standard.
Glucose uptake assay
Glucose uptake in MIN6 cells was measured in Kreb's buffer containing 3 mM glucose as previously described (46). Briefly, MIN6 cells plated in a 12-well plate were preincubated in Kreb's buffer for 30 min. Subsequently, the cells were incubated with 0.15 μCi [3H]-2-deoxy-
Statistical analysis
All statistical analysis was performed by using Graphpad Prism 4 (GraphPad Software, San Diego, CA), with p<0.05 considered significant. More specific indices of statistical significance are indicated in individual figure legends (Figs. 1 –6 and Supplementary Figs. S3, S4, S5, S6, S7, S10, S14, S15, S16). Data are expressed as mean±standard error of the mean. For comparisons between two groups, a Student's t-test was performed. For comparisons among multiple groups, one-way or two-way ANOVA with Bonferroni post hoc testing was performed.
Footnotes
Acknowledgments
This work was supported in part by National Institutes of Health Grant ES016005 (J.P.), Startup Funding of China Medical University (J.P.), Liaoning Pandeng Scholar Program (J.P.), Chinese Nature Science Foundation 81102156 (R.Z.) and 81372943 (R.Z.), and the Key Laboratory of Public Health Safety (Fudan Univeristy), Ministry of Education, China GW2014-1 (J.F.). The authors thank Lisa H. Webb (The Hamner Institutes), Carol Bobbitt (The Hamner Institutes), Yongyong Hou (China Medical University), and Yuanyuan Xu (China Medical University) for their careful management of animal care and breeding.
Author Disclosure Statement
No competing financial interests exist.
Abbreviations Used
References
Supplementary Material
Please find the following supplemental material available below.
For Open Access articles published under a Creative Commons License, all supplemental material carries the same license as the article it is associated with.
For non-Open Access articles published, all supplemental material carries a non-exclusive license, and permission requests for re-use of supplemental material or any part of supplemental material shall be sent directly to the copyright owner as specified in the copyright notice associated with the article.