
Abstract
Introduction
G
The regulation of glutathione biosynthesis is of critical importance for cellular redox homeostasis. γ-Glutamyl-cysteine ligase (GCL) is the enzyme in charge of the rate-limiting step in this process. So far, very little information is available on the post-transcriptional regulation of GCL. Here, we describe miR-433 as the first microRNA that directly targets both subunits of GCL, also resulting in reduced GSH biosynthesis, thus adding a new regulatory mode for GCL expression. Functionally, downregulation of GCL by miR-433 is relevant for endothelial homeostasis and hormetic responses involved in fibrogenesis, as observed in two different models of organ fibrosis.
It has been proposed that these regulations are ruled mainly by the binding of transcription factors to antioxidant response element (ARE) boxes within the GCLc promoter (27, 36, 53, 71). Several transcription factors, including nuclear factor (erythroid-derived 2)-like 2 (Nrf2), the activator protein 1 (AP-1) family, and nuclear factor κB (NFκB), are involved in this interaction (54, 72).
Nrf2, as the essential transcription factor binding to ARE (20), takes central stage in the regulation of GCL expression. The activity of GCLc is also regulated by phosphorylation at the post-translational level (37, 62). The light subunit (GCLm) does not exhibit catalytic activity by itself, but contributes to the function of the heavy subunit, critically affecting interactions of the substrate at the active site (22, 42). Oxidative stress can orchestrate the induction of both GCLc and GCLm and this induction, like that promoted by certain xenobiotics, is linked to the Nrf2-ARE pathway. However, other pro-oxidants such as ethanol and TGF-β1 do not affect GCLm expression (17). Interestingly, hepatic toxicity induced by either litocholic acid (72) or bile duct ligation (BDL) (45, 63) triggers a biphasic response in the expression of both subunits, causing an initial upregulation and further repression of the enzymes (72).
MicroRNAs (miRNAs) are short (20–24 nt) noncoding RNAs involved in post-transcriptional regulation of gene expression by affecting both stability and translation of mRNA. More than half of all mRNAs are estimated to be targets of miRNAs, and each miRNA is predicted to regulate approximately hundreds of targets [for review, see Refs. (5, 26)]. Consistent with this special capacity, miRNAs regulate a broad range of biological processes, including cell proliferation, apoptosis, differentiation, and tissue repair (2, 4, 24, 31, 68, 70). There is now strong evidence that aberrant miRNA expression or function can lead to the development and progression of multiple human pathophysiological processes, including diabetes, cancer, and cardiovascular diseases (39, 58). There are still huge gaps in our understanding of redox homeostasis particularly with regard to its regulation via miRNAs, even though the term “redoximiR” has been recently coined. This set of miRNAs is mostly related to the regulation of the Nrf2 pathway, although increasing examples of specific targeting by miRNAs of cytosolic or mitochondrial genes are appearing [see Ref. (11) for review]. In the particular case of GCL subunits (here termed globally GCLs), there are very few reports about the potential involvement of miRNAs in their post-transcriptional regulation but with limited functional data (1). Hence, we sought to identify miRNAs that could directly target GCLs and interfere with their expression, in the belief that the final regulation of GSH balance could represent a major consequence of their action. We found that miR-433 targets both GCLc and GCLm and significantly affects their expression. Furthermore, we provide data supporting that this effect has a profound impact on redox-related pathophysiological processes such as endothelial dysfunction and organ fibrosis.
Results
Identification and confirmation of miR-433 as a candidate miRNA targeting GCLc and GCLm
“In silico” analysis of the 3′-untranslated region (UTR) of GCLc and GCLm genes with the
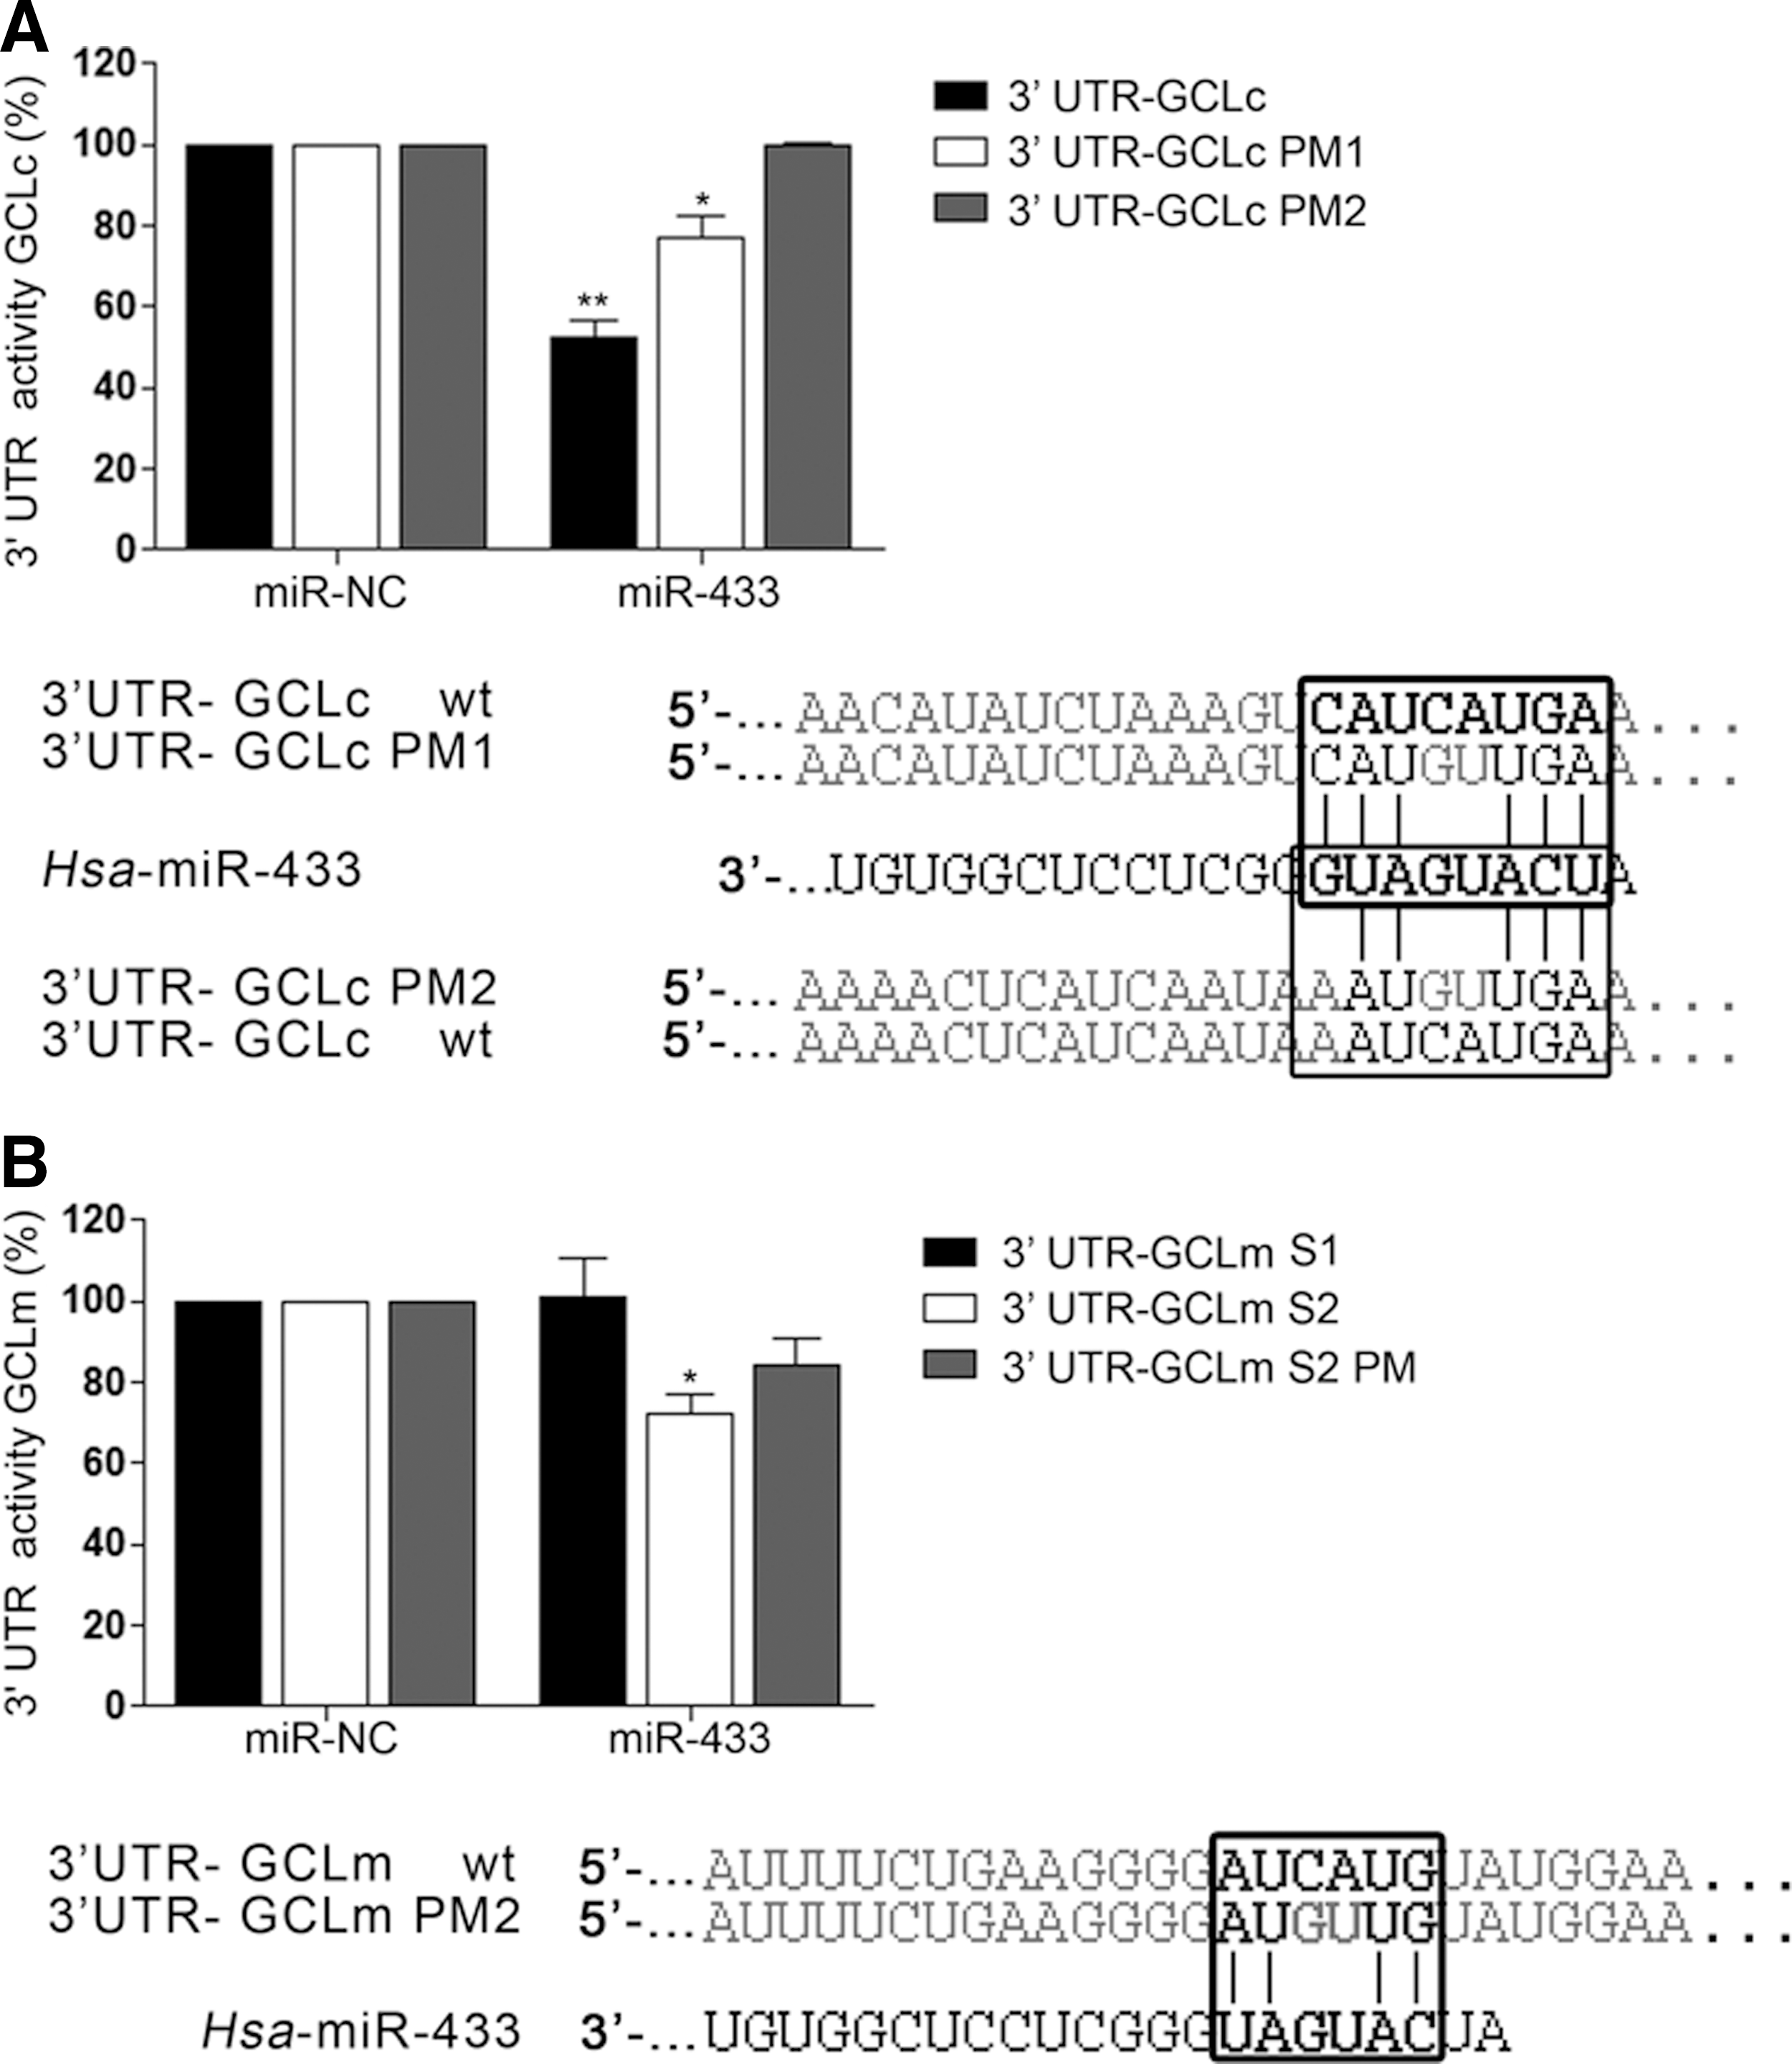
The human GCLc 3′-UTR is 1414 bp long. The two seed target sites for miR-433 are situated in the extremes of the region (Fig. 1A). The first site is an 8-mer only present in Homo sapiens. The second site is a 7-mer conserved among several mammalian species (Fig. 1A). The human GCLm 3′-UTR is almost twice as long and also bears two targeting sites for miR-433 in its 3′-UTR (Fig. 1B). The first site is a poorly conserved 7-mer-1A seed sequence and the second site, which corresponds to the only functional site, is a 6-mer present in the human 3′-UTR. To verify the functional behavior of this targeting, the 3′-UTR's were cloned in a luciferase reporter vector. For GCLc, one intact and two mutated constructs, point mutation 1 (PM1) (C240G and A241U) and PM2 (including PM1 +C1204G and A1205U) were used. For GCLm, three different constructs named GCLmS1 (180–186), GCLmS2 (2417–2422), and GCLm S2 PM (C2419G and A2420U) were used. miR-433 was capable of decreasing luciferase activity by ∼50% in the case of GCLc 3′-UTR (Fig. 2A) and 35% in the case of GCLm. This downregulation was partially absent in the case of GCLc PM1 and completely abrogated for GCLc PM2. Mutation of the functional site in the GCLm seed sequence (GCLm S2 PM) resulted in only a 20% reduction in luciferase activity (Fig. 2B).

miR-433 decreases GCLs protein expression, GSH levels, and 2GSH/GSSG ratio while it promotes S-glutathionylation in endothelial cells
To evaluate the effect of miR-433 in endothelial cells, we transfected human umbilical vein endothelial cells (HUVEC) with the synthetic mature miRNA forms corresponding to a negative control (miR-NC), miR-433, or miR-144. miR-433 overexpression induced a significant downregulation of both GCLc and GCLm protein levels, an effect that was not detectable with miR-144 transfection (Fig. 3A). Consistently, expression levels of GCLc and GCLm mRNAs were downregulated in miR-433 transfected cells (Fig. 3B). To test whether the downregulation of GCLs was also detectable in the presence of oxidative stimuli, we treated HUVEC with hydrogen peroxide (H2O2) for different periods of time in the presence and absence of exogenous miR-433. As shown in Figure 3C, exposure to miR-433 was associated with an inhibitory response in the expected upregulation of GCLc and GCLm.

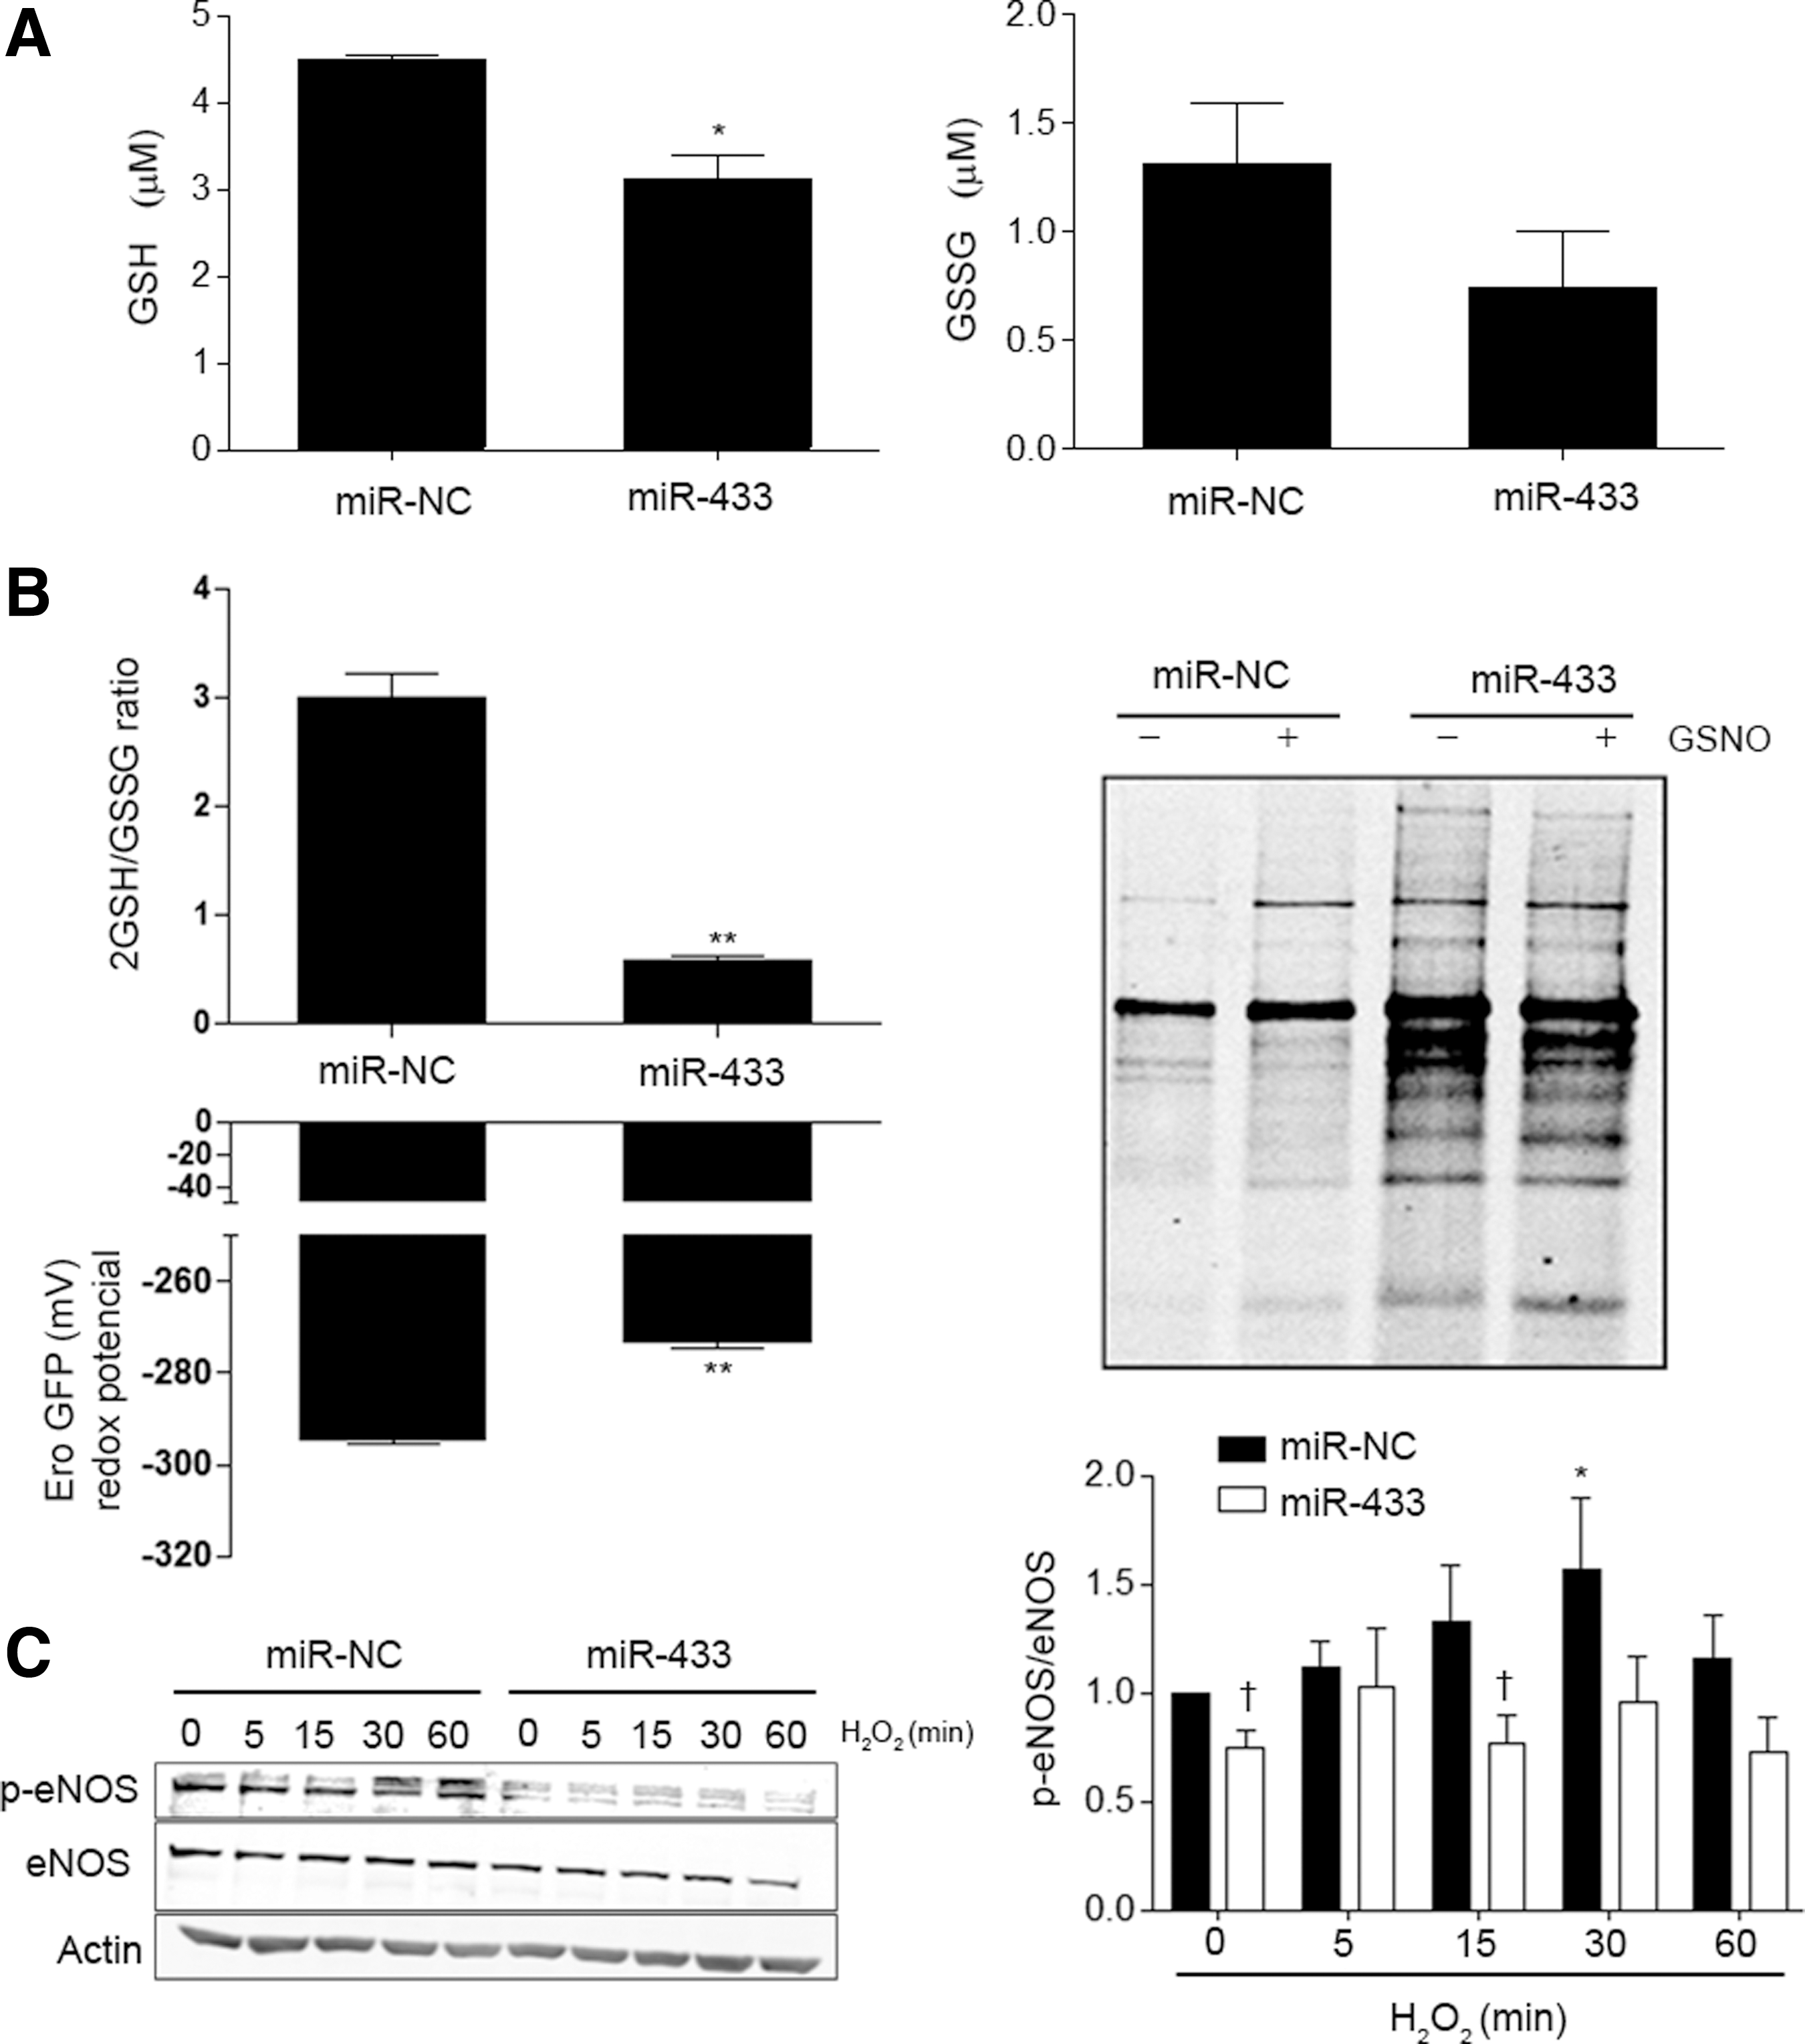
To test the repercussion of GCLs downregulation induced by miR-433 on the final product of the biosynthetic pathway, we measured GSH levels in HUVEC, and evaluated the possible consequences of the formation of GSSG. As shown in Figure 4A, miR-433-treated cells showed a 50% reduction in GSH levels, with no significant effect on the oxidized form. In keeping with this result, the 2GSH/GSSG ratio, as determined with the fluorescent probe roGFP, markedly decreased (Fig. 4B). In addition, the redox potential determined according to the Nernst equation (41) was clearly affected (Fig. 4B, left panel). Decreased 2GSH/GSSG ratio is associated with potentially increased S-glutathionylation (48, 56). To verify this, HUVEC were labeled with biotinylated glutathione ethyl ester (BIOGEE) in the presence or absence of S-nitrosoglutathione (GSNO), an inductor of S-thiolation (23). Treatment with miR-433 resulted in a conspicuous increase in the number of S-glutathionylated proteins (Fig. 4B, right panel) and specific endothelial nitric oxide synthase (eNOS)-S-glutathionylation (Supplementary Fig. S2A); see Supplementary Methods. This effect was observed both in basal conditions and after exposure to GSNO. Taken together, these results strongly support that miR-433 has profound consequences for GSH synthesis, altering the balance toward the formation of GSSG and mixed disulfides. We also evaluated whether the functional effects associated with miR-433-related GSH depletion could cause endothelial dysfunction. In HUVEC transfected with miR-433, we observed a significant reduction in eNOS activating phosphorylation in response to short treatments with H2O2 (Fig. 4C), which suggests that miR-433 has a deleterious effect on vascular function caused by GSH depletion (10, 30).
miR-433 induces nitroxidative stress
To analyze whether miR-433 also generated an increase in reactive oxygen species (ROS) production and therefore an imbalance in redox state, we measured ROS production with a probe for general ROS detection, 2′,7′-dichlorofluorescein; see Supplementary Methods. As shown in Figure 5A, miR-433 increased cellular oxidative stress, in both the presence and absence of H2O2.
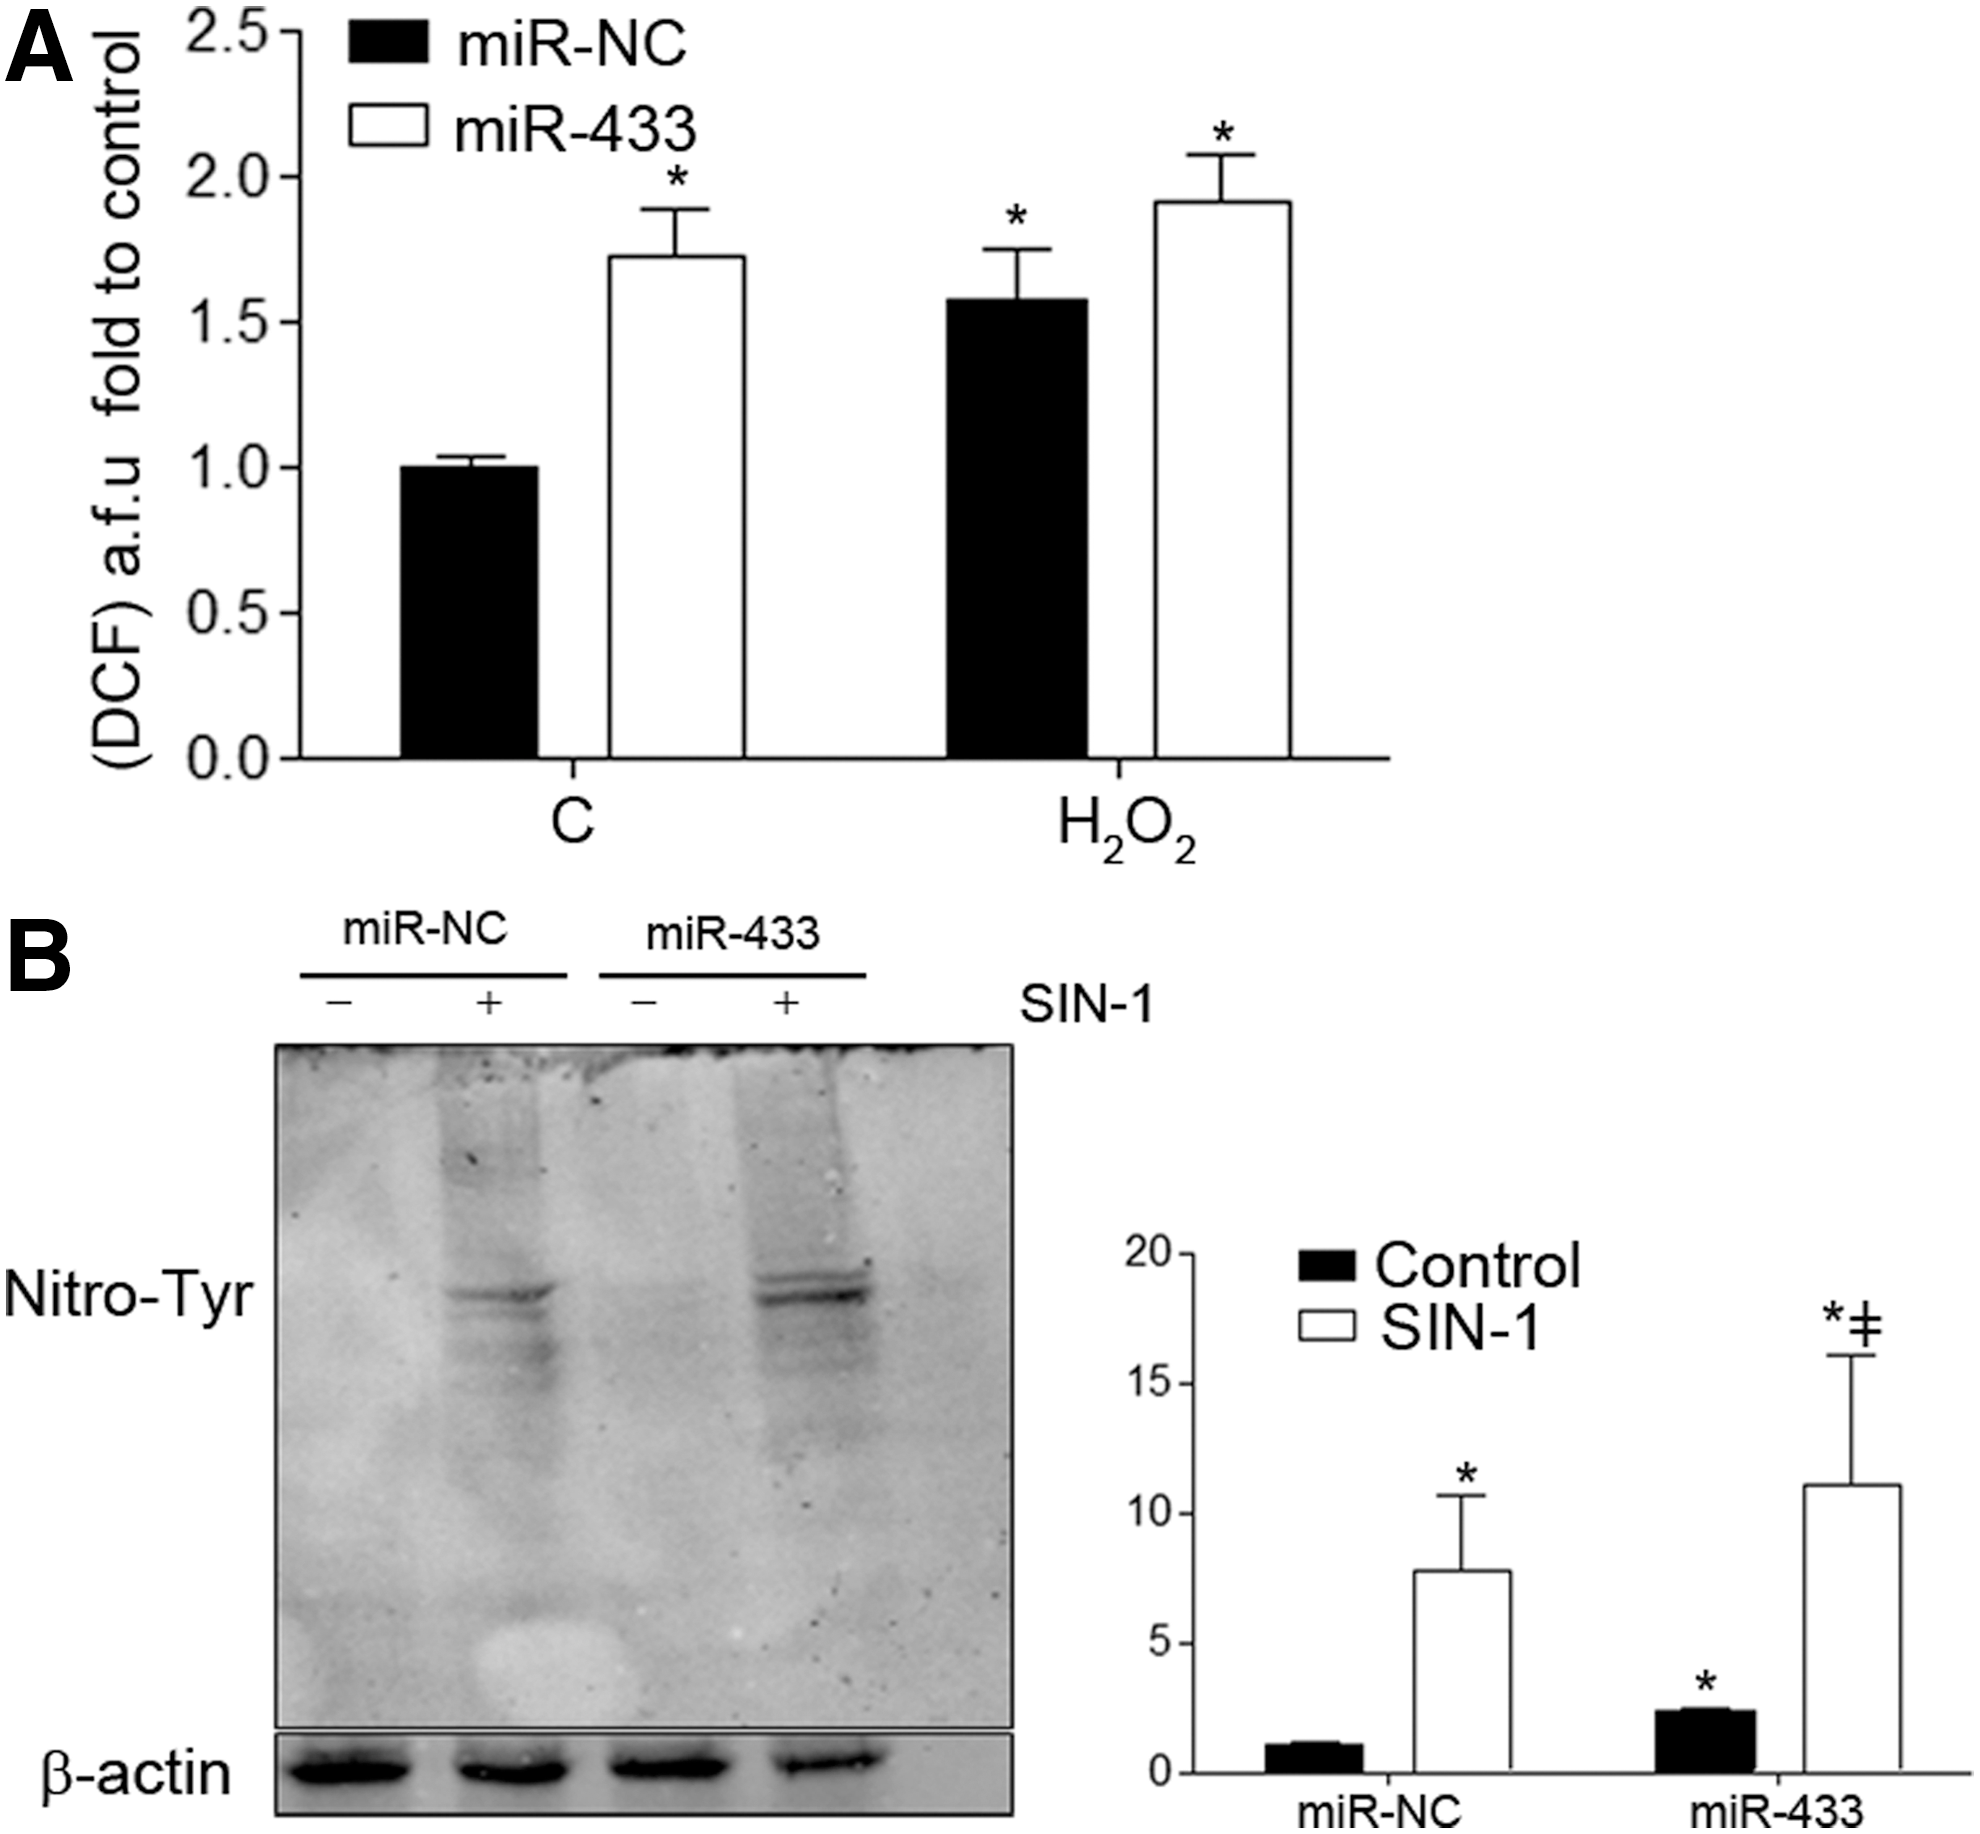
To further confirm the pro-oxidative action of miR-433, we studied its potential effect on tyrosine nitration in human endothelial cells. In basal conditions, overexpression of miR-433 was associated with a visible increase in global protein nitration, which was enhanced with SIN-1 treatment (Fig. 5B). Taken together, these data support that miR-433 is able to promote an increase in nitroxidative stress by itself.
Opposite regulation of GCLs and miR-433 expression by pro-oxidative stimuli
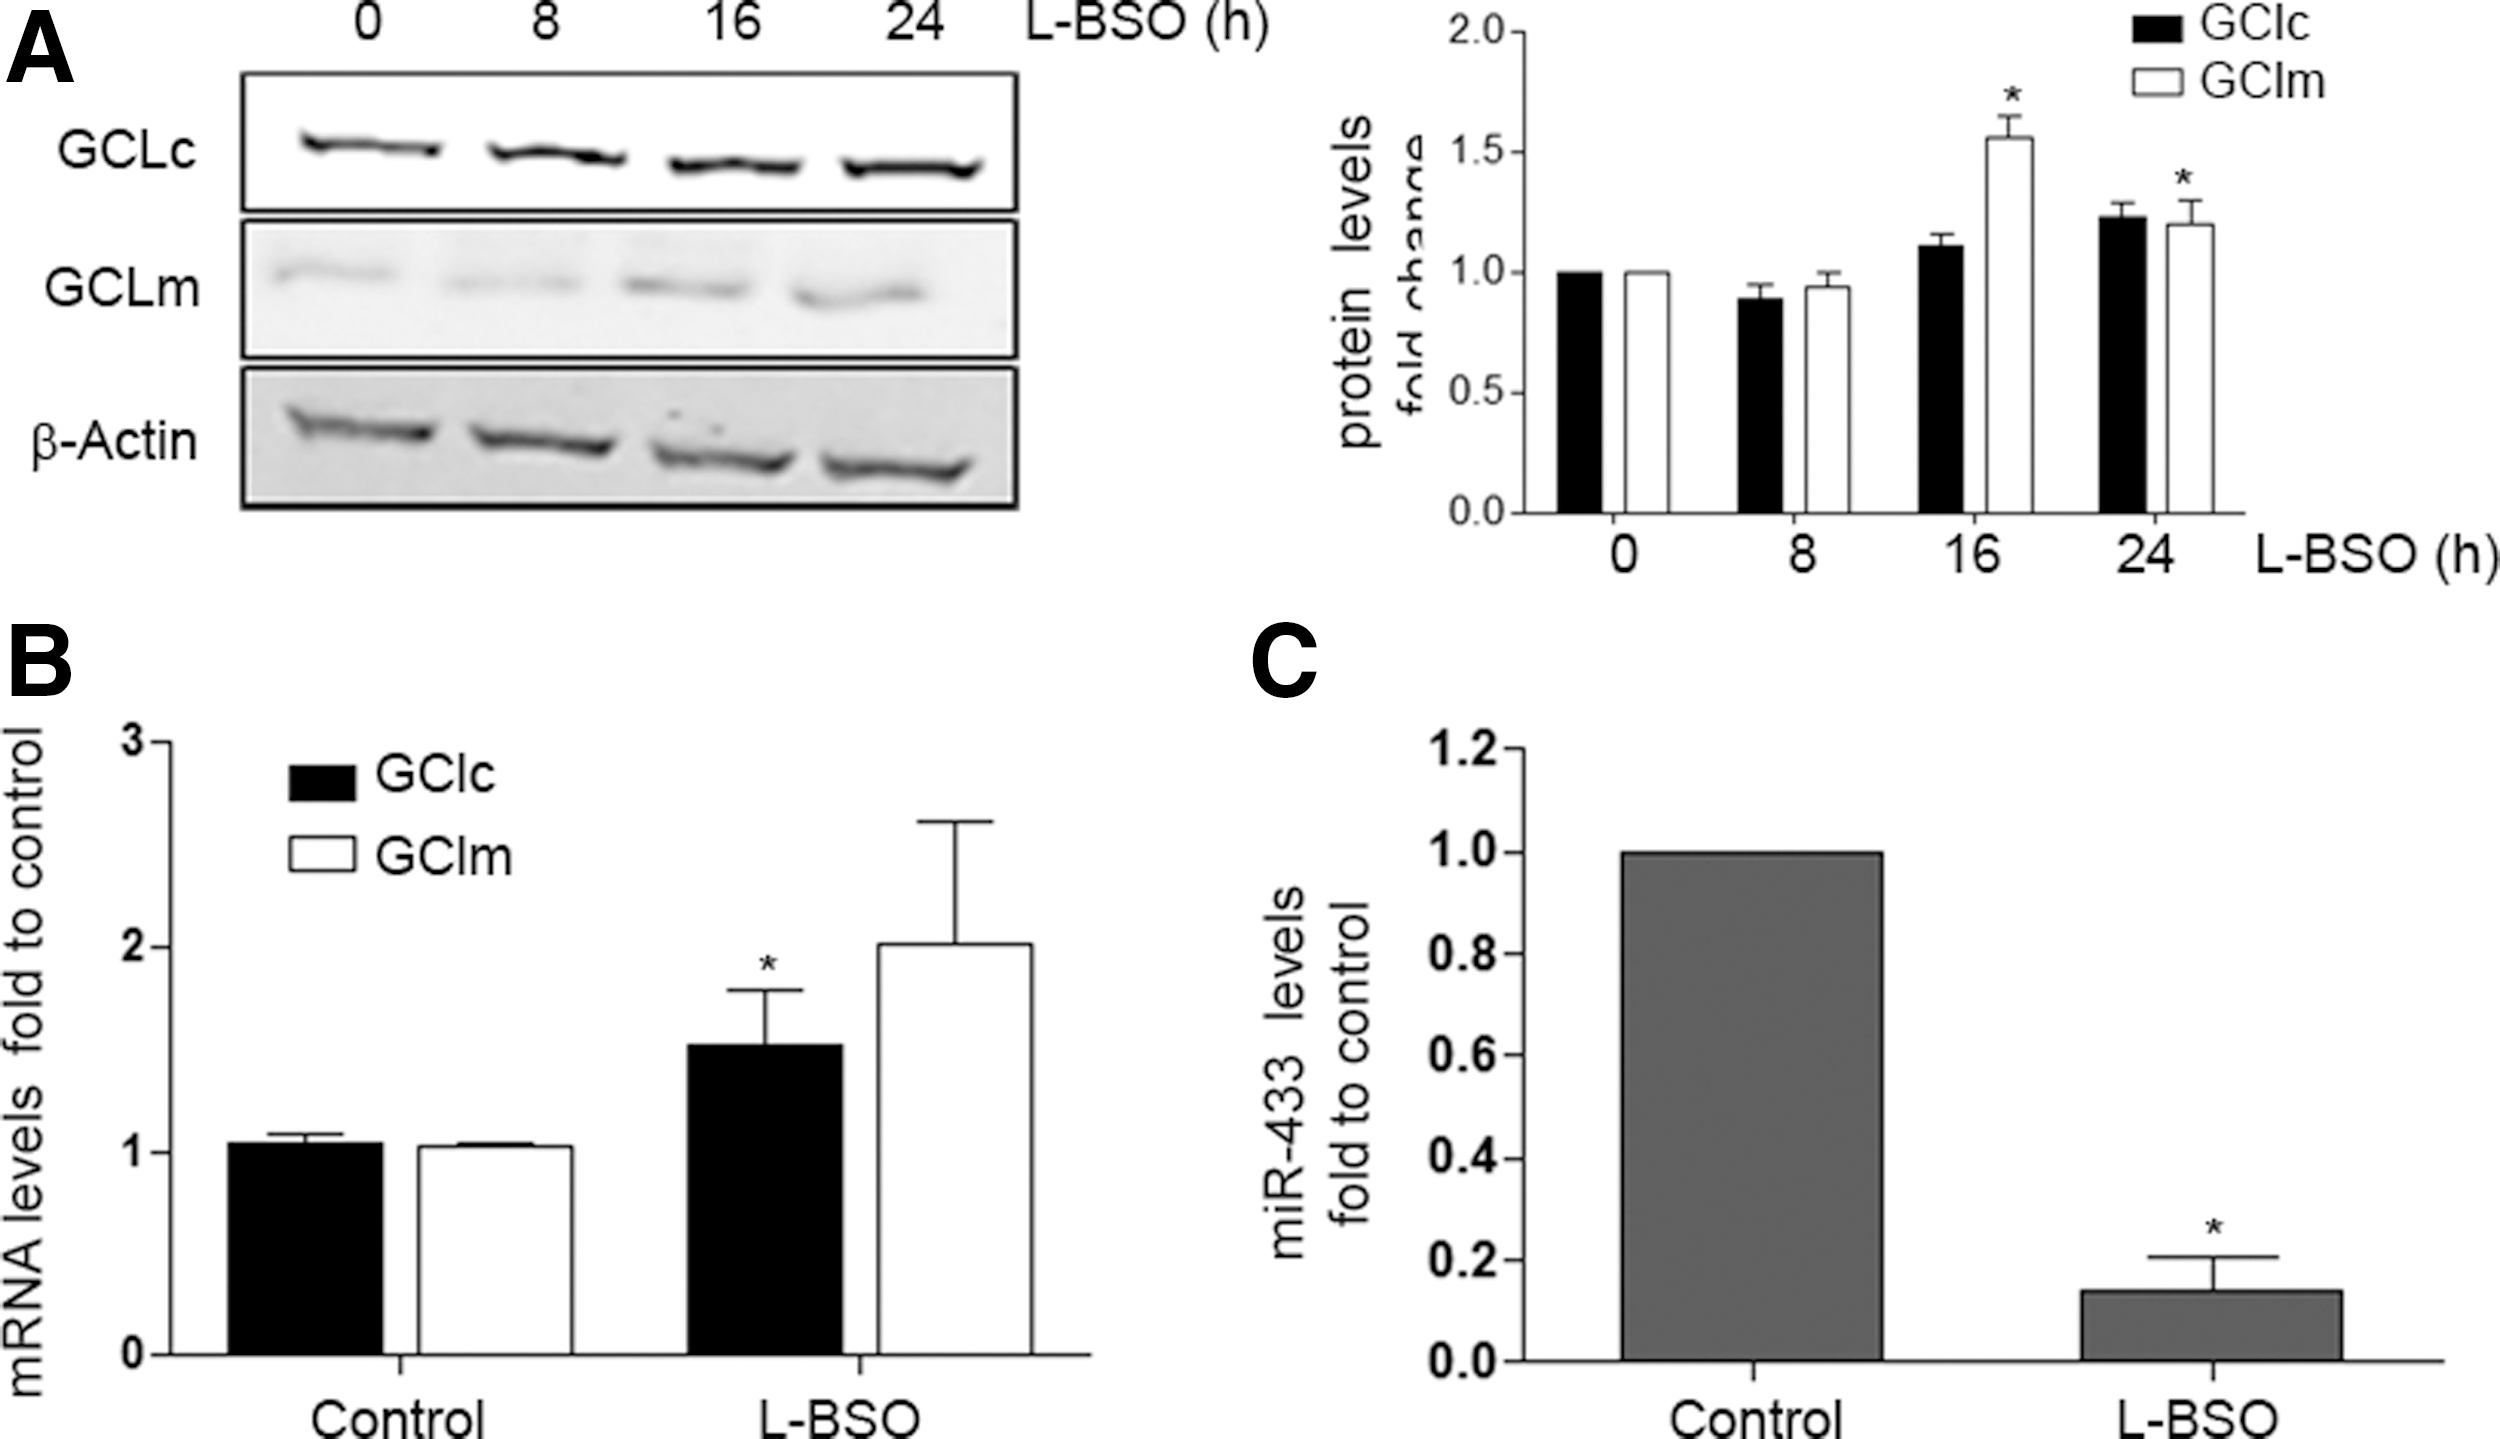
To evaluate the effect of oxidative stress on the expression of GCLs and miR-433, we tested the effect of GSH depletion in HUVEC by using the chemical inhibitor of GSH synthesis, L-buthionine-sulfoximine (L-BSO), that was effective in significantly depleting reduced GSH levels by 80% (data not shown) and, as expected, increased protein levels of GCLm significantly (Fig. 6A). The mRNA levels of GCLc experimented similar changes (Fig. 6B). This has been attributed to the regulatory feedback between the expression of GCLs and the final product of the reaction, GSH (15, 37). Of interest, L-BSO drastically reduced miR-433 levels (Fig. 6C), suggesting that depletion of GSH levels may also trigger responses directed toward the suppression of molecules inhibiting GCLs expression. Liver injury has also been related to redox damage and GSH depletion (53, 73). To explore the role of miR-433 in this context, we exposed HepG2, a hepatic cell line, to oxidative stress promoted by increasing concentrations of H2O2. As shown in Supplementary Figure S3, H2O2 significantly induced the expression of GCLc and GCLm to 8 h with progressive decrease after this time point (Supplementary Fig. S3A). In concordance with these observations, H2O2 also significantly decreased miR-433 expression in a time-dependent fashion to 8 h (Supplementary Fig. S3B), consistently supporting an inverse regulation of GCLs and miR-433 by oxidative stimuli.
miR-433 decreases the expression of both GCLs by an Nrf2-independent mechanism
Nrf2 is a transcription factor that plays a fundamental role in antioxidant responses (20). Several miRNAs have been shown to interfere with the Nrf2-Keap1-Bach-ARE pathways (7, 11, 20). Among them, miR-144 has been described to downregulate GCLs expression by an Nrf2-dependent mechanism in neuronal (44) and erythroid cells (57). Thus, we asked whether Nrf2 may also mediate the inhibitory effect of miR-433 on GCLs expression in endothelial cells. To confirm or refute whether the effect of miR-433 on GCLs levels was independent from Nrf2, we determined mRNA and protein levels of this transcription factor after overexpression with miR-433 in HUVEC and compared its potential effects with those of miR-144. As shown in Figure 7A, miR-433 had no effect on the protein or mRNA levels of Nrf2. miR-144 has been described to modify Nrf2 levels (44, 57). In our hands, we detected a tendency in this direction at both the mRNA and protein levels that did not reach statistical significance. These data suggest that the downregulation of GCLc and GCLm induced by miR-433 is independent from Nrf2. However, it is important to emphasize that Nrf2 remains a key element controlling the expression of GCLs, as its knockdown was associated with a clear decrement in the basal levels of both GCLs, more evident in the case of GCLm (Fig. 7B upper panels). In addition, Nrf2 appears to play a role in governing the expression of miR-433, as its absence results in reduced miRNA levels (Fig. 7B lower panel). This is also consistent with the observation that L-BSO treatment was able to abrogate the expression of miR-433 (Fig. 6C) as an absence of antioxidant pathways such as Nrf2 should also promote the reduction of inhibitory molecules resulting in reduced GSH levels, such as miR-433.

miR-433 regulates redox responses associated to injury and fibrogenesis
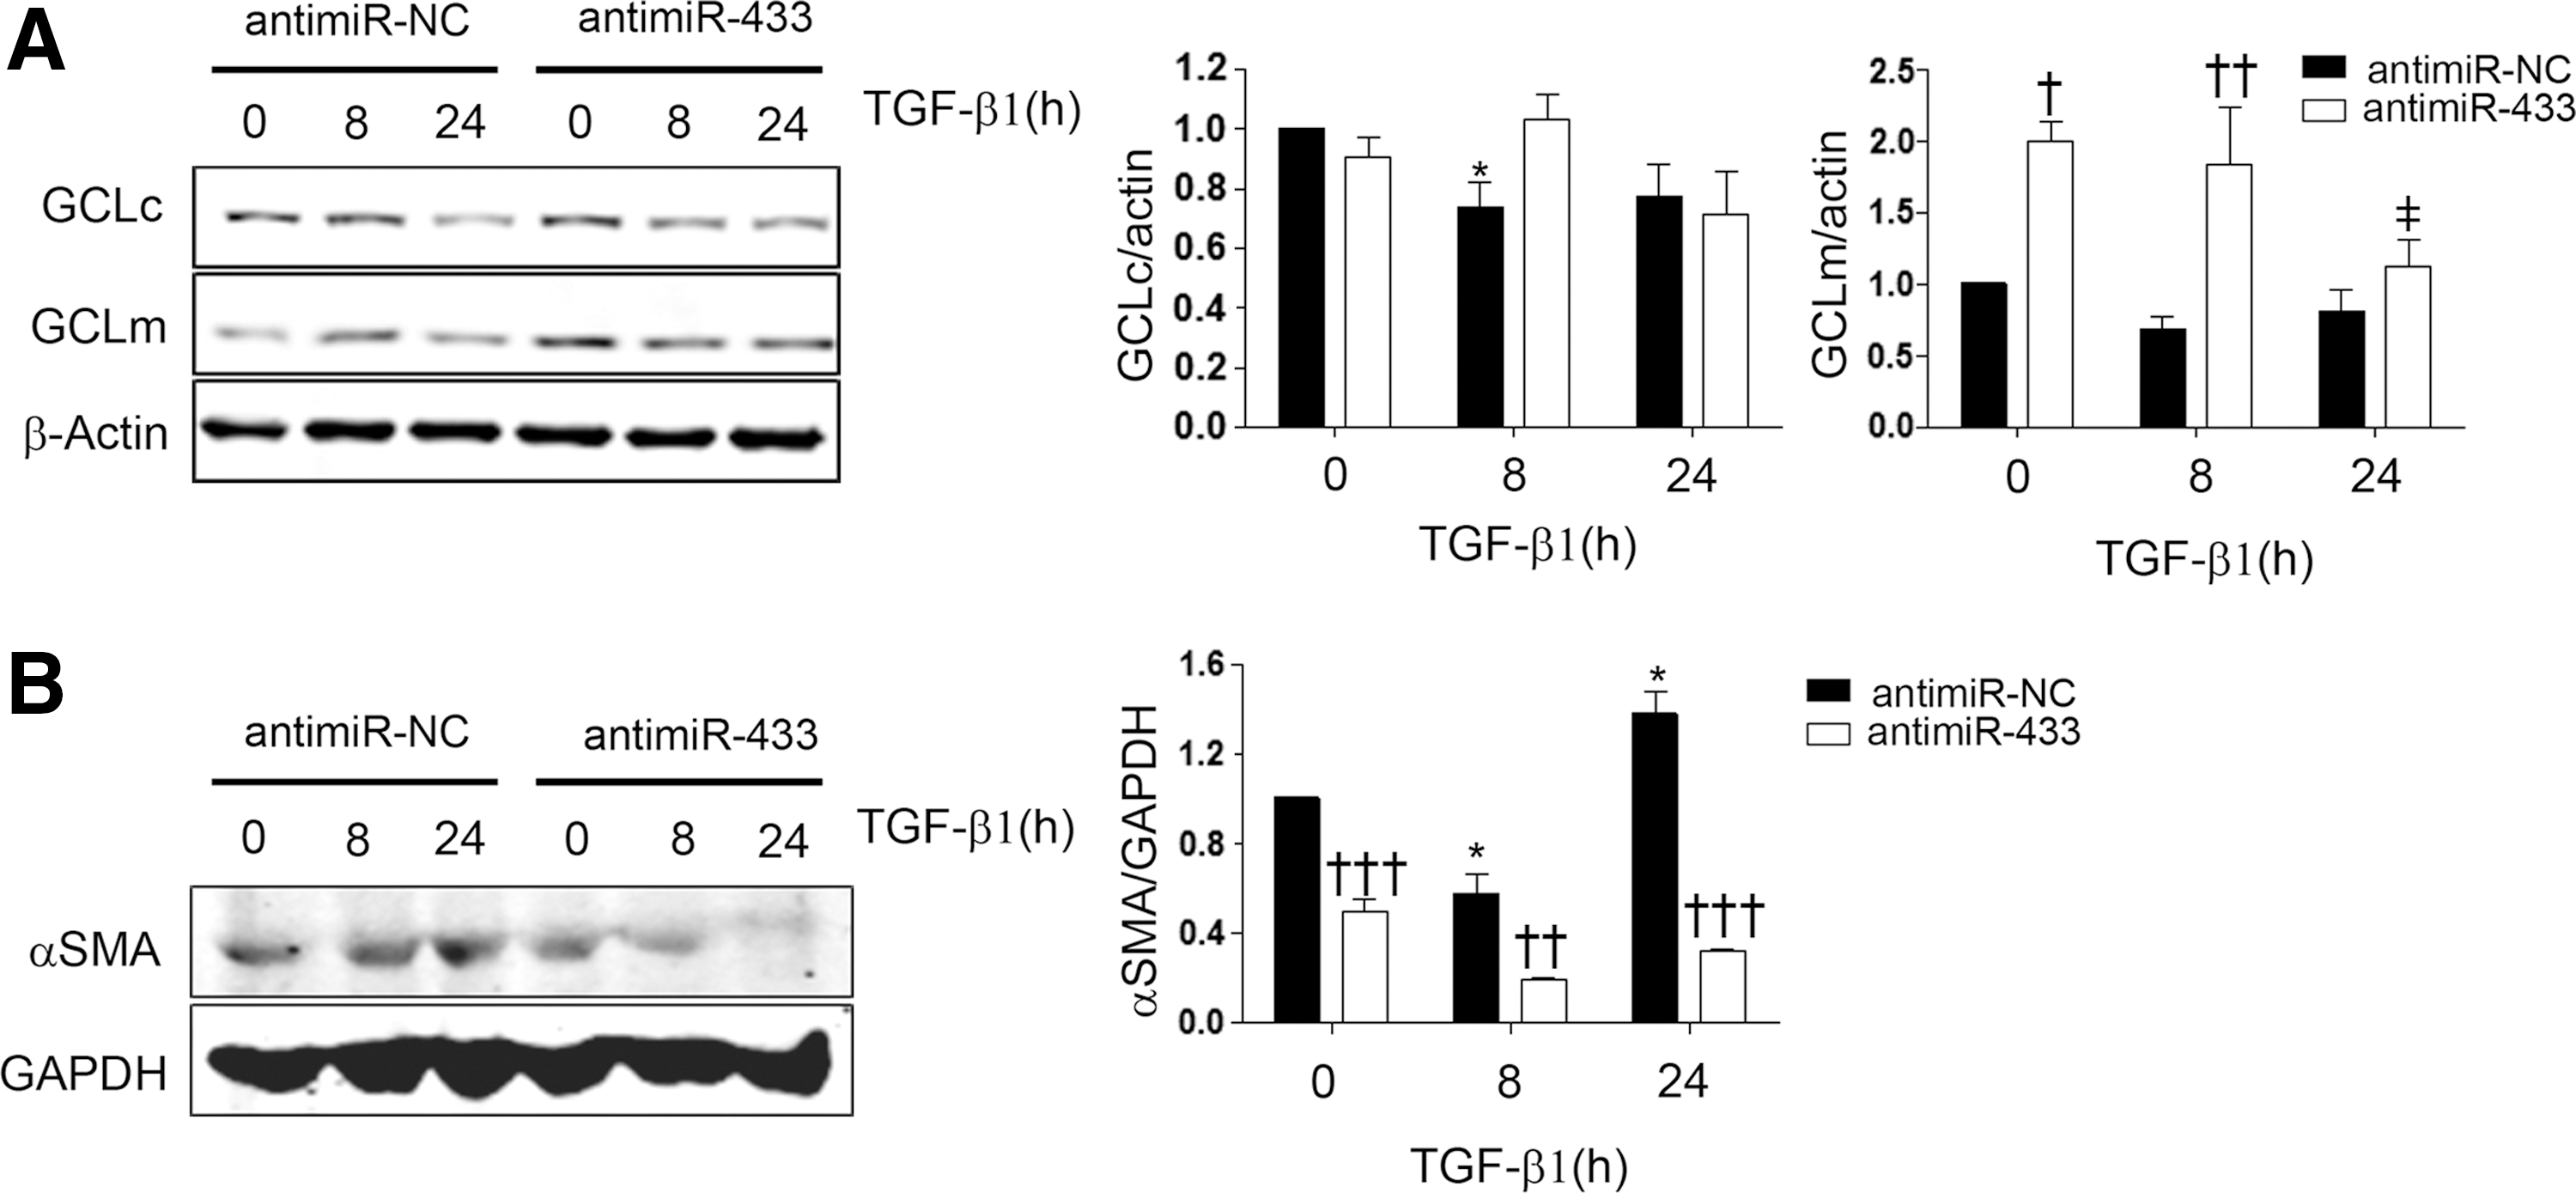
In order to investigate the potential role of miR-433 in pathophysiological contexts, we addressed its function in two different models of injury. The first one consisted of inducing liver injury by BDL, a procedure which triggers cholestasis, liver dysfunction, and, eventually, fibrosis that courses with GSH depletion (53, 72). The drop in the levels of GCLc and GCLm was visible after 1 day and reflected in lesser quantified protein abundance and mRNA levels (GCLm) at 21 and 7–14 days after the surgical procedure, respectively (Fig. 8A, B). The levels of miR-433 were significantly increased at 14 and 21 days after BDL (Fig. 8C), thus supporting a relationship between the decrement of GCLs and upregulation of the miRNA. To evaluate the cellular responses that could underlie the effects described earlier, we employed the hepatic cell line Huh7 and exposed it to TGF-β1, the quintessential profibrotic cytokine. Treatment of Huh7 hepatoma cells with TGF-β1 induced a reduction in the expression of GCLs and also diminished GSH levels at 48 h (Supplementary Fig. S4A, B). In addition, TGF-β1 treatment at 48 h dramatically increased miR-433 levels (Supplementary Fig. S4C). Pretreatment with the inhibitory antagomir (antimiR-433) for miR-433 rescued TGF-β1-induced inhibition of GCLs expression (Fig. 9A). As could be expected, TGF-β1 was capable of inducing the expression of the fibrotic marker αSMA and interestingly, transfection with the antagomir prevented α-SMA TGF-β1-dependent increase (Fig. 9B).

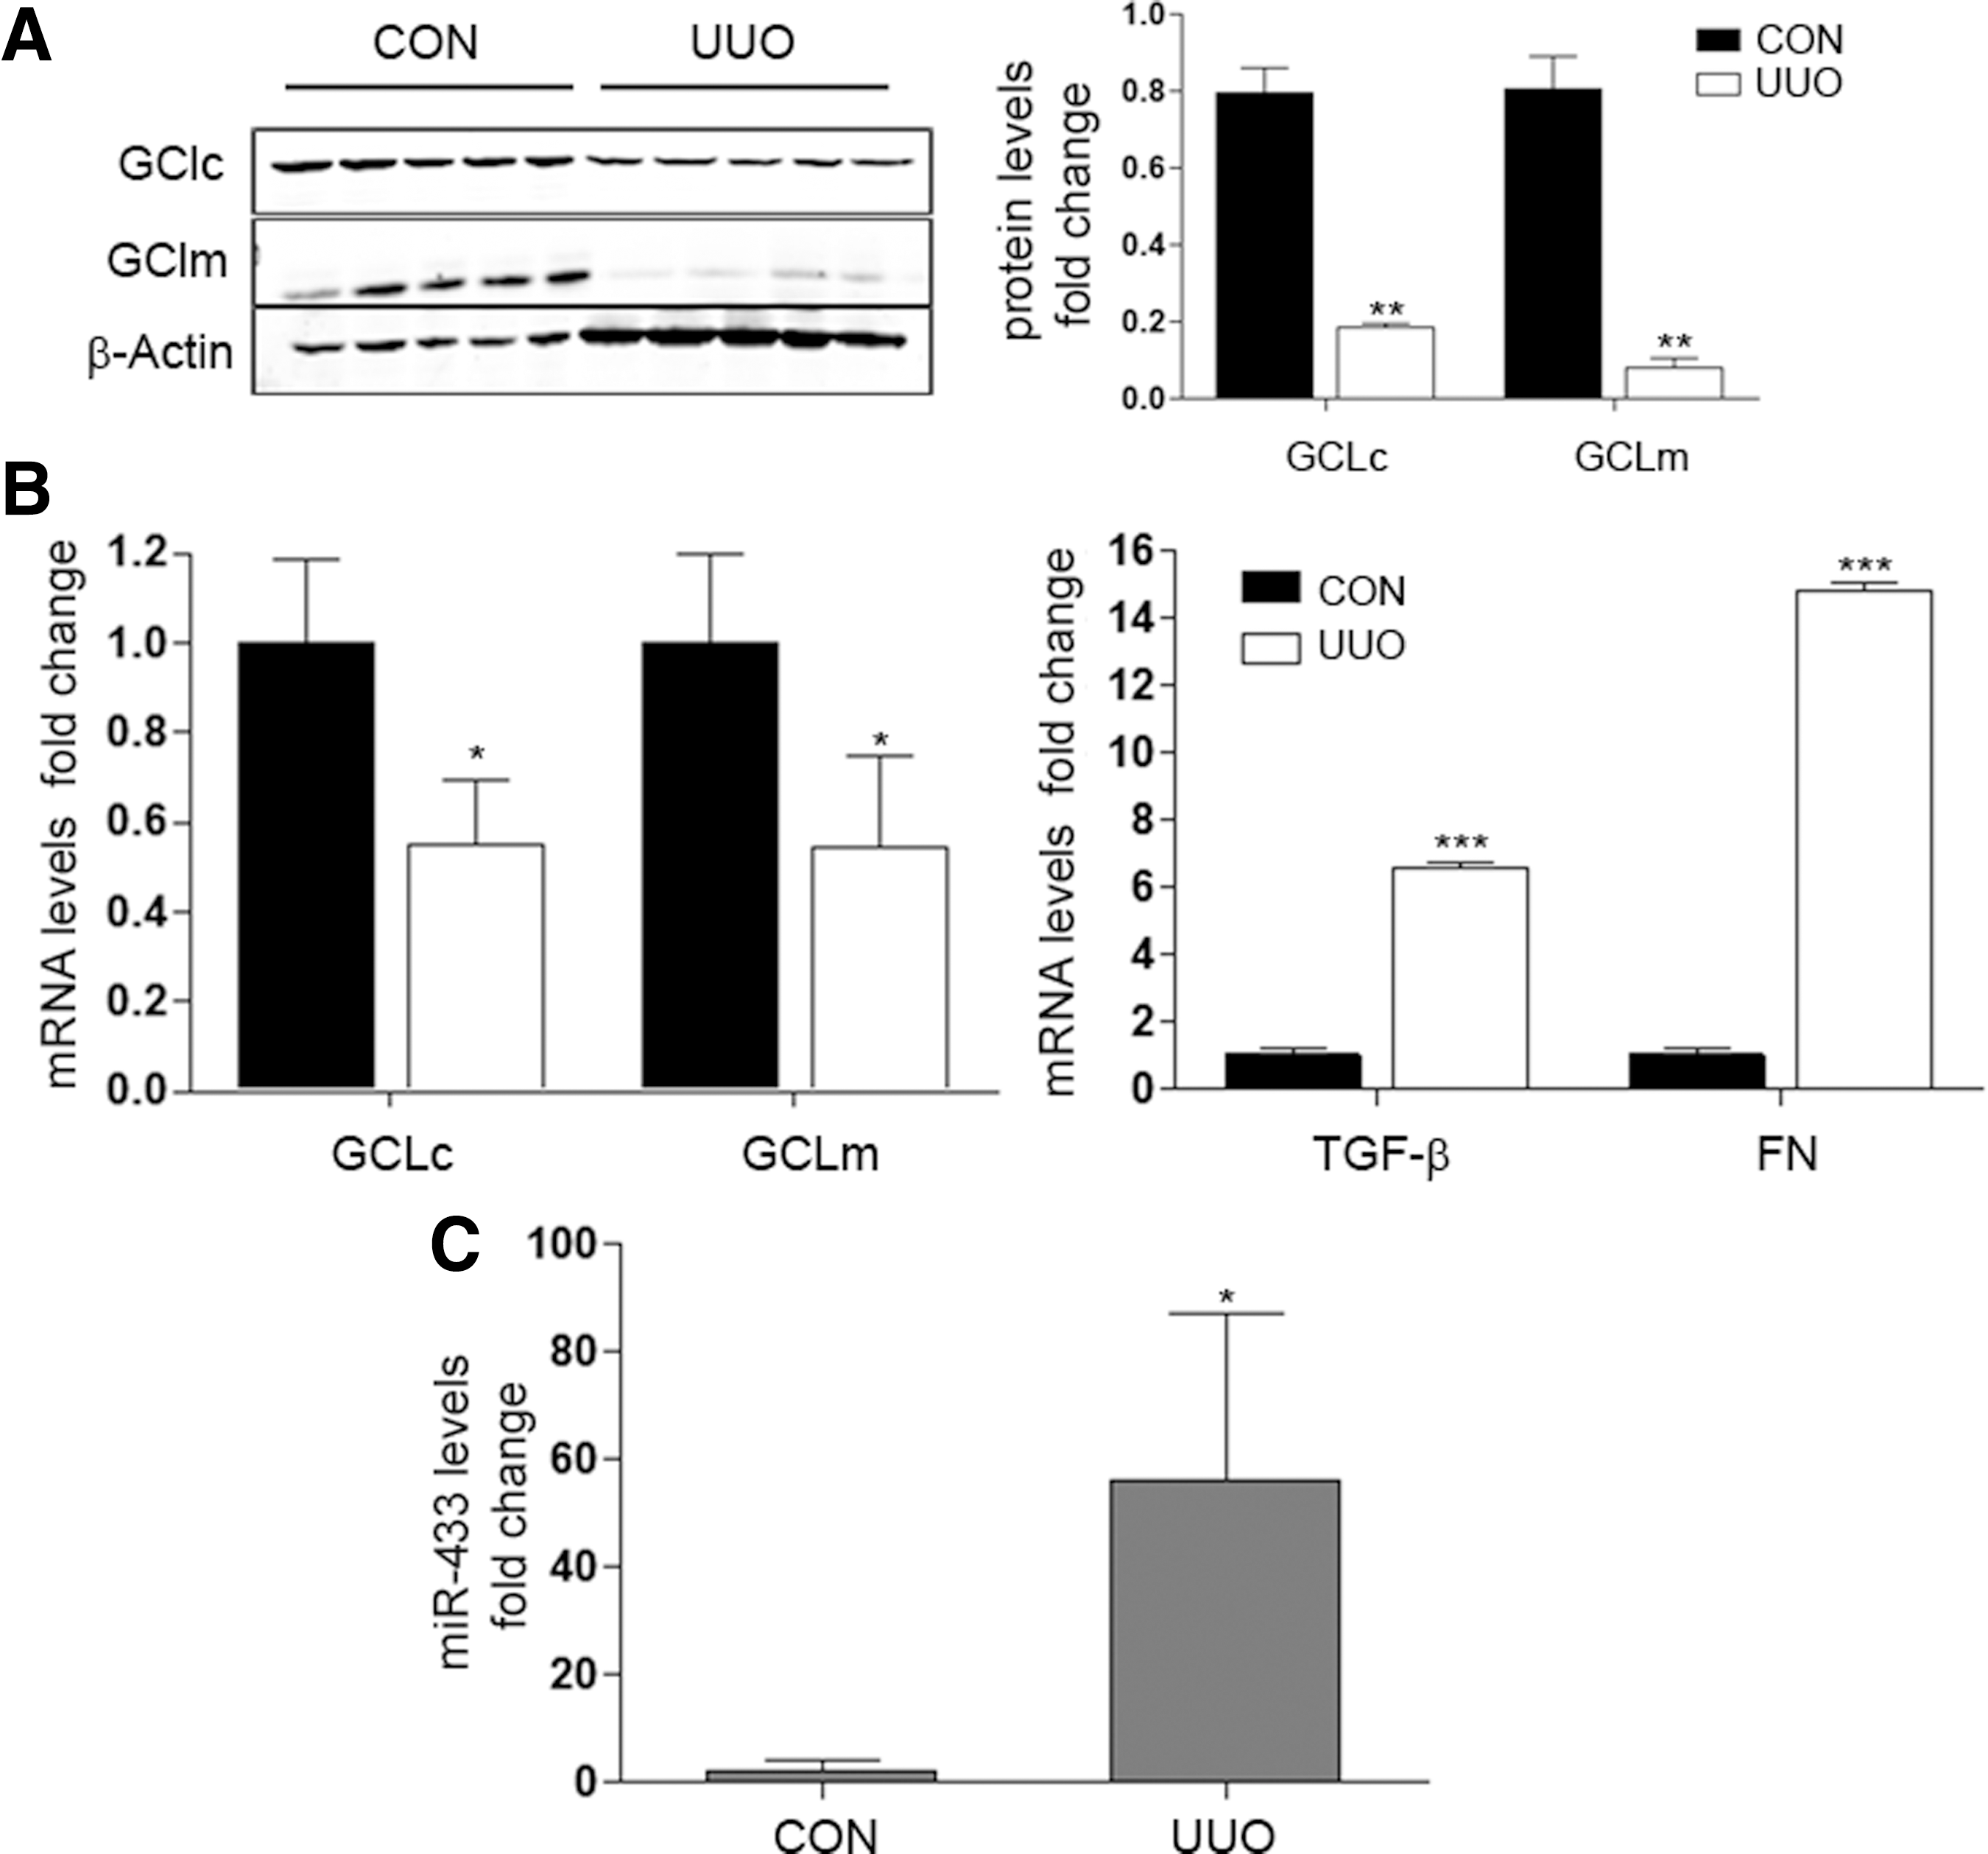
The second model, unilateral ureteral obstruction (UUO), results in obstructive uropathy of one kidney and abolition of its function due to renal fibrosis (65, 66). This fibrotic process is characterized by the activation of the TGF-β pathway. We found that the expression of GCLs was significantly decreased in the obstructed kidney after 5, 10, and 15 days of UUO (Fig. 10A, B and Supplementary Fig. S5B). As expected, TGF-β and fibronectin levels were significantly higher after 5 days (Fig. 10B right panel). To evaluate further renal damage, two novel described biomarkers, kidney injury molecule 1 (Kim-1), related to the transition from acute to chronic renal damage (25, 47) and neutrophil gelatinase-associated lipocalin (Ngal), an early marker of kidney disease (12), were also evaluated. Ngal and Kim-1 gene expression became increased at 5 and 10 days after UUO surgery compared with control mice (Supplementary Fig. S5A). Importantly, miR-433 was also significantly upregulated in the obstructed kidney at 5 days post-UUO (Fig. 10C), supporting the notion that miR-433 is involved in the reduction of GCLs levels promoted by UUO. Collectively, these results suggest not only that both UUO and BDL are good models for exploring TGF-β-mediated inhibition of GCLs but also, and more importantly, that miR-433 reveals itself as a potential mediator of injury and fibrogenesis through its inhibitory action on GCLs expression.
Discussion
Since their discovery, miRNAs have progressively moved to central stage in our understanding of the post-transcriptional regulation of gene expression (1, 4, 5, 18); it is now difficult to conceive a cellular pathway in which these small molecules do not play an important regulatory role. However, only very recently has the contribution of miRNAs been formally addressed in the field of redox biology (11, 46). It is now clear that redox stress modulates miRNAs biogenesis (43, 52, 67) and, indeed, miRNAs control redox homeostasis at multiple levels, including antioxidant responses. Our results add new insights into the balance of the major endogenous redox pair, 2GSH/GSSG, by identifying miR-433 as a new regulatory player of GSH synthesis through the specific targeting of GCL.
As the rate limiting enzyme involved in GSH synthesis, the regulation of GCL has been the object of thorough study. Both transcriptional and post-transcriptional mechanisms are important, and their role has been reviewed in depth elsewhere (15, 36, 37). Information on the involvement of miRNAs in these enzymes' final level of expression is limited. miR-144 has been studied in detail and demonstrated to interfere with GCLs' abundance in several reports (44, 57), which concur in the notion that the Nrf2 pathway plays an important role as an intermediate target and, hence, the mechanism of action of miR-144 appears to be indirect. Our data are consistent with an effect by which miR-433 downregulates GCLs expression in an Nrf2-independent manner. This is sustained by the fact that overexpression of miR-433 in HUVEC does not modify Nrf2 mRNA or protein levels (Fig. 7A). A regulatory role of Nrf2 in miR-433 cannot be excluded, as its knockdown appears to reduce the levels of the miRNA. However, an extensive analysis of 10 kb of the miR-433 promoter region (human chromosome 14) did not reveal evident ARE binding sites dosing blast algorithm (data not shown), thus suggesting an indirect mechanism for this downregulation. It is possible that the potential depletion of the antioxidant systems (GSH in particular) promoted by miR-433 or Nrf2 depletion and the unbalance in the nucleophilic tone (14) toward a more oxidative state could tend to reduce the expression of pro-oxidant molecules such as miR-433 as a part of the cellular homeostatic response. This is in line with our observations that increased levels of H2O2, well above its signaling range, promote the repression of miR-433 (Supplementary Fig. S3). Clearly and importantly, as shown by others and confirmed here, Nrf2 is essential for the transcriptional regulation of GCLs (9, 20, 37) (Fig. 7B).
The importance of redox unbalance in vascular and endothelial dysfunction has been well known for at least two decades and reviewed elsewhere (6, 60). In the particular case of GSH, several reports have shown that reduction in the levels of this antioxidant results in endothelial dysfunction (8, 10, 30). Recent and enlightening evidence was provided by the genetic deficiency of GCLm in a mouse model (69). The authors of this study provided conclusive evidence that haploinsufficiency of GCLm is associated to alteration of aortic vascular reactivity in classical organ bath experiments where aortic strips precontracted with phenylephrine showed reduced vasodilatation in response to acetylcholine. Significantly, complete deficiency of GCLm was associated to enhanced vasorelaxation but greater sensitivity to vasoconstriction, perhaps indicating that only precise levels of GSH allow appropriate homeostatic responses. Our results are consistent with the idea that reduced levels of GSH mediated by miR-433 result in functional biochemical changes associated to endothelial dysfunction such as increased global and specific S-glutathionylation (Fig. 4B and Supplementary Fig. S2) and diminished eNOS activation (Fig. 4C). These data suggest that GCL is a key enzyme whose intact functionality is indispensable for a correct endothelial and vascular response.
Beyond the direct effects of miR-433 on endothelial function derived from the abrogation of GSH synthesis and reduced nucleophilic tone, we have explored other potential pathophysiological consequences. Here, we focused on the process of fibrogenesis for several reasons: (1) There is an established link between oxidative stress and fibrosis mainly due to the reciprocal relationship between TGF-β, a major profibrotic cytokine, and redox homeostasis (21, 50); (ii) The ability of TGF-β to downregulate the expression of GCL has been known for over a decade. In this regard, TGF-β has been shown to decrease GSH in various cell types. The mechanism appears to relate to the inhibition of GCL gene expression due to the hindrance of Nrf2 binding to the ARE sequence promoted by the competition of Smad3 or small Maf proteins (3, 16, 27, 53, 55). (iii) A recent important report has shown that miR-433 is upregulated by TGF-β1 and is relevant to the development of renal fibrosis (32). By using two different experimental models of organ fibrosis in the kidney and liver, UUO and BDL respectively, we confirmed the repression of GCL expression under the induction of fibrogenesis (Figs. 8 and 10A, B). These observations were recapitulated by the exposure of liver-derived cells to TGF-β1. An important novelty is that antagonism of miR-433 prevented the downregulation of GCLs in this cell type (Fig. 9A). We believe that this finding adds new mechanistic insights to the reports mentioned earlier and allows us to propose a model (Fig. 11) in which fibrotic stimuli, such as TGF-β1, downregulate GCLs and GSH levels by specifically inducing miR-433. We are tempted to propose a scenario in which a biphasic response is mounted in the context of inflammation, leading to fibrosis. In the early stage of damage, the expression of GCLs is quickly upregulated, mediated by Nrf2 activation. When the exposure to injury persists, as is the case in profibrotic TGF-β-dependent processes, miR-433 expression increases progressively, reducing GCLs expression and GSH levels. This, in turn, results in an unbalance in the nucleophilic cellular tone in the cell and could contribute toward limiting miR-433 expression. However, persistent damage overcomes this situation, leading to deposition of extracellular matrix (ECM) proteins and fibrosis.

The term “redoximiRs” has been recently proposed to describe a set of miRNAs that participate in redox responses both as direct regulatory molecules of the post-transcriptional expression of several pathways and as indirect modulators of the redox homeostatic response (11). In addition, the term “fibromiRs” has been coined to suggest the orchestrated influence of a panoply of miRNAs participating in the regulation of fibrogenesis through several mechanisms (51). As expected, and even though this has not yet been formally established, these two functional families of miRNAs overlap. We have now identified a new member, miR-433, which we suggest belongs to both subgroups of miRNAs due to its capacity to regulate the levels of a critical target, GCL, that is essential for homeostatic and hormetic redox responses, including those involved in fibrogenesis (27). We believe that changes observed in the levels of miR-433 in response to variations in the redox state are specific. As shown in Supplementary Figure S6, both the redoximir miR-34a (61, 64) and the fibromir miR-21 (49, 51) behave similarly to miR-433 when exposed to BSO. However, when Nrf2 was silenced, miR-34a and miR-21 exhibited a tendency to increase. In the UUO model, both miRNAs were not significantly upregulated, in contrast to miR-433 (74). Corroboration of this belief should arrive from the study of further pathophysiological scenarios where redox responses are already known to be key players in the process of organ fibrosis.
Materials and Methods
Reagents
H2O2, L-BSO, N-ethylmaleimide (NEM), and GSNO were purchased from Sigma. BIOGEE was purchased from Life's Technologies. TGF-β1 was purchased from R & D systems.
Cell culture
HUVEC were obtained from umbilical cords of normal deliveries (after approval by the ethics committee of the Hospital “Ruber Internacional”). For isolation, umbilical cords were digested with 0.1% collagenase at 37°C for 20 min. Endothelial cells were collected and grown on 0.2% gelatin with Medium EGM2 (Lonza) at 37°C in 5% CO2. Human tumor hepatic cells, HepG2 and Huh7, were maintained in Dulbecco's modified Eagle's medium (DMEM) supplemented with 10% fetal bovine serum (FBS), 2% penicillin-streptomycin, and L-glutamine and nonessential amino acids at 37°C in 5% CO2. COS-7 cells were grown in DMEM supplemented with 10% FBS, 2% penicillin-streptomycin at 37°C in 5% CO2.
Transfection of miRNA mimics and miRNA antimiRNAs in human cells. HUVEC at 70% confluence were transfected with 40 nM mirVana mimic (miR-433) or with 40 nM antimiR miRNA inhibitor (antimiR-433) (Life Technologies) by utilizing Lipofectamine 2000 (Invitrogen) and studied 48 h later. In all experiments, an equal concentration of a nontargeting control mimic sequence (miR-NC) or an antimiR negative control (antimiR-NC) sequence was used as a control for nonsequence-specific effects in miRNA experiments.
3′-UTR luciferase reporter assays
cDNA fragments corresponding to the 3′-UTRs of human GCLc and GCLm were amplified by reverse transcription-polymerase chain reaction (PCR) from genomic DNA extracted from HUVEC with XhoI and NotI linkers. The PCR products were directionally cloned downstream of the Renilla luciferase open reading frame in the psiCHECK2 vector (Promega), which also contains a constitutively expressed firefly luciferase gene, which is used to normalize transfections. Site-directed mutations in the seed region of predicted miR-433 sites within the 3′-UTRs were generated by using the Multisite-QuikChange directed mutagenesis kit (Stratagene) according to the manufacturer's protocol. All constructs were sequenced before use to confirm their proper structure. COS-7 cells were plated into 12-well plates and cotransfected with 125 μg of the indicated 3′-UTR luciferase reporter vectors and the miR-433 mimic or negative control by using Lipofectamine 2000. Luciferase activity was measured by using the Dual-Glo luciferase assay system (Promega). Renilla luciferase activity was normalized to the corresponding firefly luciferase activity and plotted as a percentage of the control. Experiments were performed in triplicate samples at least thrice.
Western blot and densitometric analysis
After treatment, cells were washed in phosphate-buffered saline (PBS) and lysed in RIPA lysis buffer (25 mM Tris/HCl pH 7.6, 150 mM NaCl, 1% NP-40, 1% sodium deoxycholate, 0.1% sodium dodecyl sulfate solution, 1 mM PMSF, 0.2 mM Na3VO4, and 0.2 mM NaF). Cells were harvested by scraping, and proteins were analyzed by Western blot as previously described. Blots were probed with anti-GCLc (generous gift of Dr. Kavanagh's laboratory), anti-GCLm and anti-Nrf2 (Santa Cruz Biotechnology), and anti-β-actin antibody (Sigma). eNOS and p-eNOS (Ser1177) antibodies were purchased from Cell Signaling. Secondary antibodies against rabbit and mouse were from LI-COR. Densitometry of n≥3 Western blots was done using β-actin or glyceraldehyde 3-phosphate dehydrogenase (GAPDH) as housekeeping controls for the total levels of protein loaded. p-eNOS analysis was corrected by the levels of eNOS, after normalization with β-actin. These analyses were represented in bar graphs showing the mean±SEM of protein with regard to controls.
Real-time PCR
Total RNA and miRNA were isolated with miRNeasy Mini Kit (Qiagen). Reverse transcription was performed with 1 μg/μl mRNA sample using iScript cDNA synthesis kit (Bio-Rad) or in the case of miRNAs, Universal cDNA Synthesis and Master Mix (Exiqon). cDNA expression was analyzed by determining SYBR green-based real-time quantitative PCR with Bio-Rad master mix, using specific primers (Sigma). miRNA expression was determined using specific miRNA Locked Nucleic Acid (LNA™) PCR primers (Exiqon) or for tissue samples, specific Taqman probes (Life Technologies). The relative quantification of gene expression was determined using the 2−ΔΔCt method (35). Using this method, we obtained the fold changes in gene expression normalized to an internal control gene, GAPDH or U6 snRNA, respectively.
Small-interfering RNA design and transfection
HUVEC were transfected with specific small-interfering RNA (siRNA)-targeting constructs as previously described and analyzed for the presence of Nrf2 (40 nM, 48 h), GCLc, and GCLm (40 nM, 48 h). Duplex siRNA-targeting constructs were purchased from Ambion (Life Technologies).
GSH assay
Reduced and oxidized forms of GSH were measured in HUVEC utilizing GSH-Glo assay and 2GSH/GSSG assay (Promega) according to their protocol.
roGFP2 probes
Redox status was measured using ro-GFP adenovirus probe (19, 41). HUVEC were transfected with the appropriate miRNA as described, left for 24 h, infected for 2 h, and washed with PBS and the medium was replaced. 2GSH/GSSG ratio was analyzed after 24 h by fluorescence-activated cell sorting after blocking with NEM 100 μM for 5 min. They were then fixed with paraformaldehyde 4% at 37°C for 5 min. The samples were excited by FL1 (485 nm) and FL8 (405 nm) lasers, and emission was recorded at 552 nm. The ratio was calculated by analyzing the values of fluorescence obtained with the reduced form (485 nm) divided by those of the oxidized form (405 nm).
Protein S-glutathionylation assay
HUVEC were transiently transfected for 48 h, and were deprived of FBS 16 h before treatments. They were treated with GSNO 50 μM for 1 h, and then incubated with BIOGEE for 30 min. Cells were lysed in RIPA lysis buffer. S-Glutathionylated proteins were precipitated with A-Sepharose beads (Thermo Scientific) and analyzed by Western blot in nonreducing conditions with antistreptavidin antibody (LI-COR).
Protein 3-nitro-tyrosine assay
HUVEC were transiently transfected for 48 h, and were deprived of FBS at least 6 h before treatments. They were treated with SIN-1 500 μM for 1 h. Cells were lysed in RIPA lysis buffer and analyzed by Western blot in nonreducing conditions with anti-3-Nitro-Tyr antibody (Millipore).
Bile duct ligation
Studies were conducted according to the NIH Guide for the Care and Use of Laboratory Animals. Male C57BL/6 mice (3 months old) were anesthesized and bile duct was ligated, as described (73). In addition, another group of mice was subjected to surgery without ligation (Sham). Animals were sacrificed at 1, 7, 14, and 21 days after surgery. Liver was snap frozen in liquid nitrogen for RNA and protein studies.
Unilateral ureteral obstruction
Studies were conducted according to the NIH Guide for the Care and Use of Laboratory Animals. Male C57BL/6 mice (12–14-week-old) were anesthesized, the left ureter was ligated, and the kidney was obstructed (n=4–8/group), using the contralateral kidney as control (nonobstructed), as previously described (13). Animals were sacrificed at 5, 10, and 15 days after surgery. Kidneys were perfused in situ with cold saline before removal. Half a kidney was snap frozen in liquid nitrogen for RNA and protein studies.
Statistical analysis
Statistical analysis was performed with GraphPadPrism (GraphPad Software). Data are expressed as means±SEM. Differences among groups with one experimental condition were assessed with Kruskal–Wallis test with Dunn's correction. Two-way ANOVA with Bonferroni correction was used to analyze differences among groups exposed to more than one condition. Differences between only two groups were analyzed with Mann–Whitney two-tailed test.
Footnotes
Acknowledgments
Funding agencies: Ministerio de Economía y Competitividad (MINECO): SAF 2012-31338 (S.L.), CSD 2007-00020 (S.L.), Instituto de Salud Carlos III RD12/0021/0009 (S.L. and M.R.-O.), PI11/01854 (M.R.-O.), Comunidad de Madrid “Fibroteam” S2010/BMD-2321 (S.L. and M.R.-O.), and Fundación Renal “Iñigo Alvarez de Toledo,” all of which are in Spain. This study was supported by COST actions BM-1203 (EU-ROS) and BM-1005 (ENOGAS). C.E.-D is a fellow of the FPI program from MINECO. The authors are indebted to all the members of their lab (S.L.) for helpful discussions.
Author Disclosure Statement
No competing financial interests exist.
Abbreviations Used
References
Supplementary Material
Please find the following supplemental material available below.
For Open Access articles published under a Creative Commons License, all supplemental material carries the same license as the article it is associated with.
For non-Open Access articles published, all supplemental material carries a non-exclusive license, and permission requests for re-use of supplemental material or any part of supplemental material shall be sent directly to the copyright owner as specified in the copyright notice associated with the article.