
Abstract
The haptoglobin (Hp) 2 allele directly predicts coronary artery disease in type 1 diabetes, potentially due to its decreased antioxidative/anti-inflammatory properties. We measured the concentrations of oxidative/inflammatory biomarkers (urinary 15-isoprostane F2t [IsoP], α- and γ-tocopherol, tumor necrosis factor α [TNF-α], high-sensitivity C-reactive protein [hsCRP], white blood cell [WBC] count, fibrinogen, and adiponectin) thrice during 20 years of follow-up among 454 individuals with childhood-onset type 1 diabetes (mean baseline age, 28 years and diabetes duration, 19 years). Differences in biomarkers by Hp were assessed both at baseline (i.e., the first time point of measurements) and over time (with mixed models). No differences by Hp were observed at baseline with the exception of a significant trend toward higher IsoP concentrations with the number of Hp 2 alleles (p=0.01). In multivariable mixed models, the concentrations of IsoP (β=0.05, p=0.01) and WBC count (β=0.20, p=0.06) overtime increased incrementally with the number of Hp 2 alleles. No other biomarker assessed related to Hp. Reported elevated IsoP and WBC count concentrations over time among Hp 2 allele carriers lead to the hypothesis that the antioxidative and anti-inflammatory capacity of the Hp 2 is inferior to that of the Hp 1 allele in type 1 diabetes. Antioxid. Redox Signal. 23, 1439–1444.
Introduction
O
Hp is an acute-phase glycoprotein, whose plasma concentrations increase twofold to fivefold in response to inflammatory stimuli (7). The main role of Hp is to bind free hemoglobin following erythrocyte destruction, inhibiting heme iron release and reducing the heme-mediated generation of reactive oxygen species and subsequent oxidative tissue damage (7). The Hp-hemoglobin complex formed through this binding is cleared from circulation by either the monocyte/macrophage scavenger receptor CD163 or hepatocytes (7).
Three common Hp genotypes in humans (Hp 1-1, 2-1, and 2-2) are derived from two classes of alleles: Hp 1 and Hp 2 (7). Evidence has been accumulating that the antioxidant and anti-inflammatory properties of Hp are genotype dependent. Thus, the Hp 1 protein allele product is a more efficient antioxidant and anti-inflammatory factor, whereas Hp 2 is associated with enhanced angiogenic activity (1, 7). As both oxidative stress and inflammation have been implicated in the pathophysiology of atherosclerosis, impaired antioxidative activity and anti-inflammatory macrophage signaling associated with the Hp 2-2 genotype may constitute one of the underlying mechanisms by which this genotype is associated with increased cardiovascular risk.
With the exception of potentially higher low-density lipoprotein concentrations among Hp 2-2 carriers, however, few other differences have been observed across Hp genotypes (5, 6), although a detailed assessment of variations in oxidative/inflammatory biomarkers by Hp in type 1 diabetes is currently lacking. We therefore conducted repeated measurements of eight oxidative/inflammatory biomarkers (the plasma antioxidants, α- and γ-tocopherol; the lipid peroxidation biomarker, urinary 15-isoprostane F2t [IsoP]; and the biomarkers of inflammation, tumor necrosis factor α [TNF-α], high-sensitivity C-reactive protein [hsCRP], white blood cell [WBC] count, fibrinogen, and adiponectin) over a period of 20 years by Hp genotype in adults with childhood-onset type 1 diabetes.
The haptoglobin (Hp) 2 allele is thought to increase cardiovascular disease risk due to a deficiency in its antioxidative and anti-inflammatory properties compared with the Hp 1 allele. However, no data currently exist on the concentrations of multiple oxidative/inflammatory markers over time by Hp genotype in humans. We provide data on the concentration of eight oxidative/inflammatory biomarkers (urinary isoprostanes, α- and γ-tocopherol, tumor necrosis factor α [TNF-α], high-sensitivity C-reactive protein [hsCRP], white blood cell count, fibrinogen, and adiponectin) over time by Hp genotype among individuals with type 1 diabetes. Our findings suggest that the antioxidative and anti-inflammatory capacity of the Hp 2 is inferior to that of the Hp 1 allele.
Results and Discussion
Distribution of, and participant characteristics by, the Hp genotype
Of 658 Pittsburgh Epidemiology of Diabetes Complications (EDC) study participants, the Hp genotype and samples for the assessment of biomarkers at three time points were available in 454, although samples were not always adequate for analyses of all biomarkers at all three time points. Of these 454, 11.7% were homozygous for the Hp 1 allele and 41.6% for the Hp 2 allele. In agreement with previous reports (5, 6), no differences in participant characteristics were observed by Hp genotype at the first time point of biomarker assessment, with the exception of a trend toward greater incident CAD events with the number of Hp 2 alleles (Table 1). Few differences were also noted in oxidative/inflammatory biomarkers by Hp and were restricted to a trend toward greater urinary IsoP concentrations with the number of Hp 2 alleles.
Data are mean (SD), median (interquartile range), or percent (n).
CAD, coronary artery disease; eGFR, estimated glomerular filtration rate; ESRD, end-stage renal disease; HDL, high-density lipoprotein; Hp, haptoglobin; hsCRP, high-sensitivity C-reactive protein; LDL, low-density lipoprotein; TNF-α, tumor necrosis factor α.
Oxidative/inflammatory biomarkers over time by Hp genotype
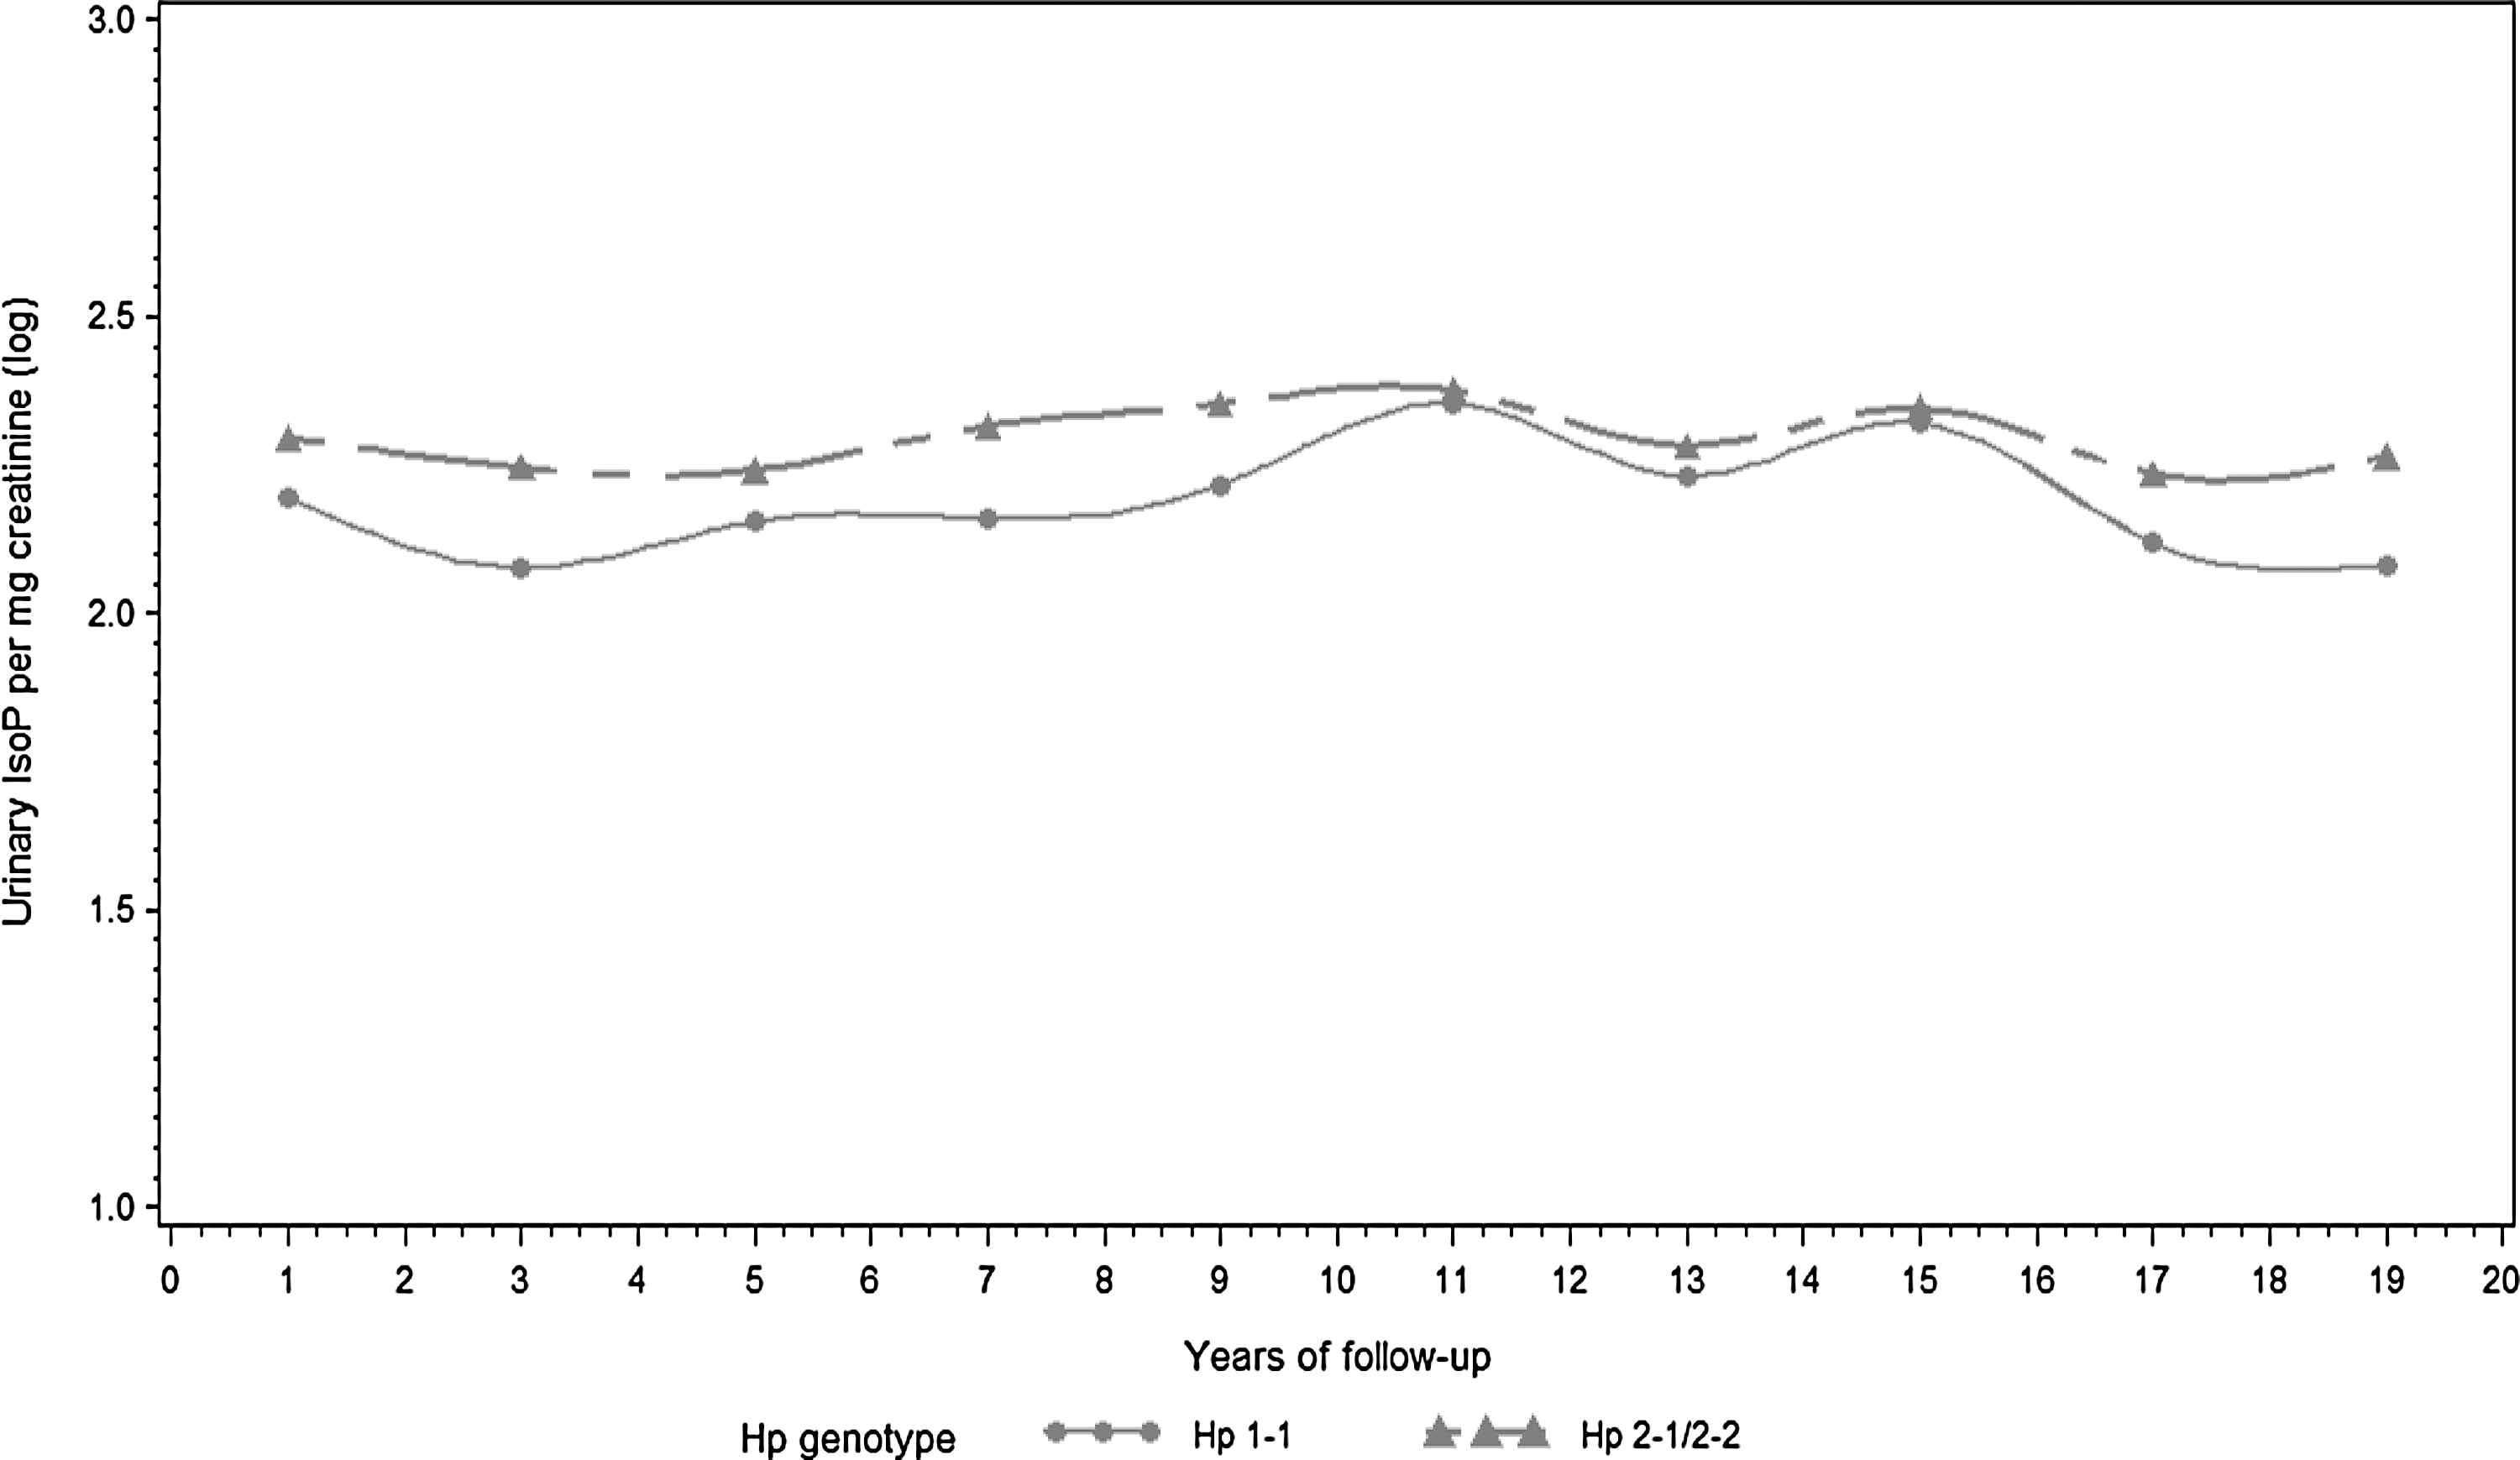
To evaluate whether differences in measured oxidative/inflammatory biomarkers existed by Hp genotype over time, we conducted repeated measures analyses using mixed models. We observed that Hp 2 allele carriers exhibited higher creatinine-adjusted urinary IsoP concentrations compared with their Hp 1-1 counterparts (β=0.05, p=0.01). Diabetes duration, female gender, a history of smoking, HbA1c, systolic blood pressure, and estimated glomerular filtration rate (eGFR) were also positively related to urinary IsoP.
IsoPs are currently considered the gold standard biomarker of oxidative stress and lipid peroxidation in vivo and have been previously associated with both subclinical atherosclerosis and manifest CAD (2). In type 1 diabetes, we have demonstrated the presence of an inverse association between the ratio of α-tocopherol to urinary IsoP as a marker of response to oxidative stress and the development of CAD (4). Thus, although no differences were observed in α-tocopherol concentrations by Hp in the present investigation, the noted divergence in urinary IsoP trajectories between the Hp 1-1 and Hp 2-1/2-2 groups certainly compliments previous type 2 diabetes findings of increases in lipid peroxides associated with high-density lipoprotein (HDL) among Hp 2-2 carriers (1).
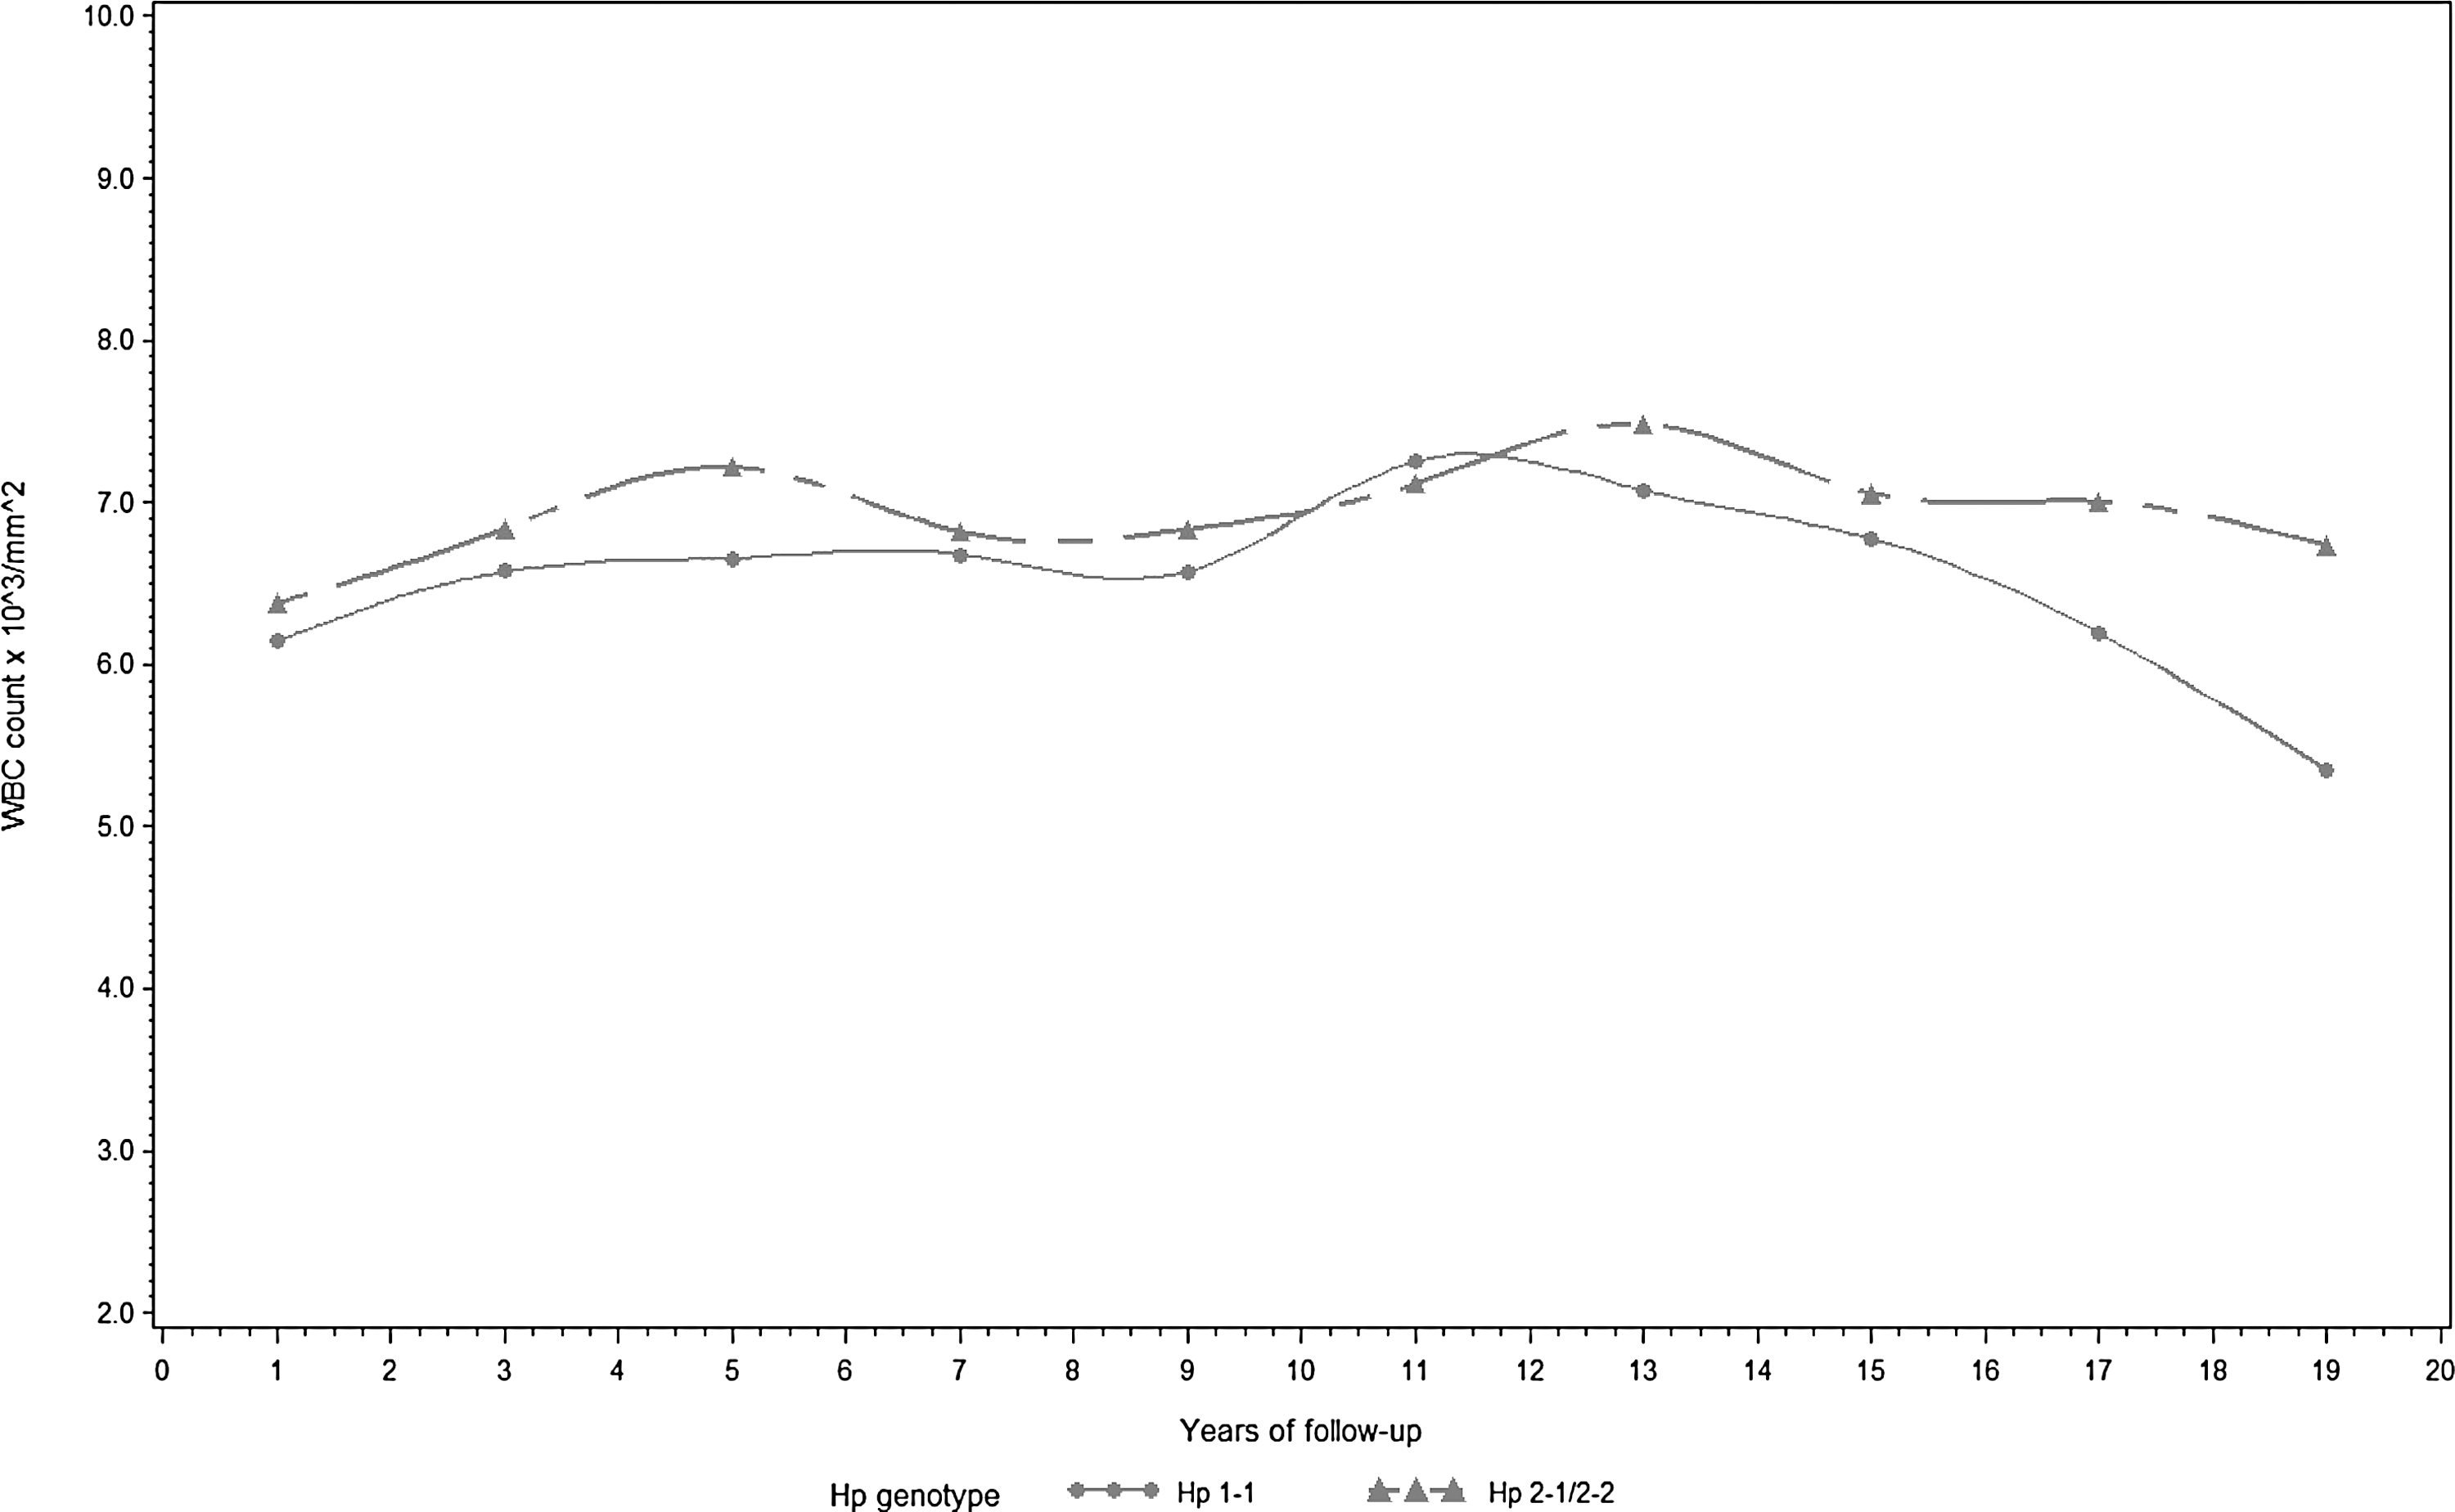
WBC count also increased with the number of Hp 2 alleles (β=0.20, p=0.06). Table 2 shows the results of the full and reduced (after backward elimination) models. A graphic display of trajectories of urinary IsoP and WBC count over the follow-up period by the presence or absence of the Hp 2 allele is shown in Figures 1 and 2, respectively. Hp 1-1 carriers appear to exhibit lower urinary IsoP and WBC concentrations throughout follow-up. Conversely, the trajectories of other measured biomarkers of oxidation/inflammation did not appear to consistently differ over the follow-up period by Hp (data not shown).
All models included a term for follow-up time (i.e., time of measurement).
IsoP, urinary 15-isoprostane F2t.
Cross-sectional reports of oxidative/inflammatory biomarkers by Hp genotype
No other studies, to date, have produced data on repeated measurements of oxidation/inflammation biomarkers over time by Hp genotype. However, similar to our results, no significant differences were observed in fibrinogen and CRP concentrations by Hp genotype in an earlier study of male Caucasians (3). Conversely, in a small (n=56) cross-sectional study of chronic kidney disease patients, hsCRP was elevated among Hp 2-2 compared with Hp 1-1 carriers, although no differences existed with the heterozygous group (9). In another cross-sectional study of obese adults, greater concentrations of TNF-α and interleukin 6 (IL-6) (but not hsCRP) were observed in Hp 2-2 versus Hp 1-1 carriers, with no differences noted with the heterozygous group (8). In this latter study, the gender distribution, age, and measures of body fat differed significantly by Hp. Thus, although the authors adjusted for these factors in multivariable analyses, questions are raised as to whether residual confounding may have been, at least partially, responsible for the observed associations with TNF-α and IL-6 as these biomarkers have been previously implicated in obesity and insulin resistance.
Limitations and conclusion
Despite the improved precision derived from our repeated risk factor measurements, biomarker assessment at three time points over a 20-year follow-up may not adequately represent an individual's oxidative/inflammatory status. Another limitation of these data lies in the restriction of measured markers to eight from a vast array of currently known oxidative/inflammatory biomarkers. Thus, whether other biomarkers better reflect differences in the antioxidative/anti-inflammatory capacity of the three Hp alleles cannot be derived from these data. Nevertheless, our findings suggest that the Hp 2 allele is associated with increased inflammation and oxidative stress in type 1 diabetes. Should these findings be replicated in further prospective studies, they could, at least partially, explain the strong and independent association of the Hp genotype with the incidence of cardiorenal complications.
Notes
Design and methods
This investigation was based on participants of the EDC study, a representative, retrospectively defined incident cohort of childhood-onset type 1 diabetes cases, diagnosed at the Children's Hospital of Pittsburgh (1950–1980). A baseline examination was conducted in 1986–1988 (n=658; mean age, 28 years and diabetes duration, 19 years). Subsequently, participants have been reexamined or surveyed biennially for up to 20 years. The University of Pittsburgh IRB approved the study protocol.
At each assessment, participants provided demographic, healthcare, self-care, and medical history information, as previously described in detail (4). Blood pressure was measured with a random zero sphygmomanometer, and hypertension was defined as blood pressure >140/90 mmHg or antihypertensive medication use. Stable glycosylated hemoglobin (HbA1) was measured by ion exchange chromatography (Isolab, Akron, OH) for the first 18 months and for the subsequent 10 years by automated high-performance liquid chromatography (Diamat; BioRad, Hercules, CA); the two assays were highly correlated (r=0.95). For follow-up beyond the 10 years, HbA1c was measured with the DCA 2000 analyzer (Bayer, Tarrytown, NY). The DCA and Diamat assays were highly correlated (r=0.95). Original HbA1 (1986–1998) and HbA1c values (1998–2004) were converted to DCCT-aligned standard HbA1c values using regression formulae derived from duplicate assays.
HDL cholesterol was determined by a precipitation technique; cholesterol and triglycerides, enzymatically; and non-HDL cholesterol was calculated as the total minus HDL cholesterol. Urinary albumin was measured by immunonephelometry, and creatinine was assayed by an Ektachem 400 analyzer (Eastman Kodak Co., Rochester, NY). GFR was estimated by the Chronic Kidney Disease Epidemiology Collaboration (CKD-EPI) creatinine equation. Microalbuminuria was defined as the albumin excretion rate (AER) of 20–200 μg/min (30–300 mg/24 h) and macroalbuminuria as AER >200 μg/min (>300 mg/24 h) in at least two of three validated timed urine collections. ESRD was defined as dialysis or kidney transplantation. CAD was determined by myocardial infarction confirmed by Q-waves on the electrocardiogram (Minnesota codes 1.1 or 1.2) or hospital records, angiographic stenosis ≥50%, or revascularization. Hp was genotyped by an amplification method; when DNA was unavailable, the Hp phenotype was assessed.
The concentrations of eight biomarkers (α- and γ-tocopherol, urinary IsoP, TNF-α, hsCRP, WBC count, fibrinogen, and adiponectin) were measured at three time points during the 20-year follow-up from samples collected at each clinical visit and stored at −70°C until the present analyses. Given the availability, samples were chosen to reflect an early, midpoint, and late assessment during a participant's follow-up. The concentrations of α- and γ-tocopherol in EDTA-anticoagulated plasma samples were measured under subdued lighting (interassay CV between runs of 6.0% and 2.8%, respectively); TNF-α (interassay CV of 15%), using ELISA (R&D Systems, Minneapolis, MN); and hsCRP using reagents from Carolina Liquid Chemicals (Brea, CA) and an AU400 from Olympus America, Inc., (Melville, NY) (interassay CV of 3.0%). Fibrinogen was determined with a biuret colorimetric procedure and a clotting method, and WBC count was obtained using a counter S-plus IV. Adiponectin was assessed with a sandwich ELISA test, using reagents obtained from ALPCO Diagnostics (Salem, NH; # 47-ADPH-9755) (interassay CV of 10.9%). Urine samples were obtained in 24 h (∼58%) or overnight (∼42%) collections. The same type of timed sample was used at all time points for a given individual. Levels of urinary 15-isoprostane F2t were measured using a competitive ELISA procedure developed by Oxford Biomedical Research (Oxford, MI), which has a correlation (r 2) of >0.8 with GC-MS procedures. The 15-isoprostane F2t assay appeared stable regardless of the length of sample storage.
Statistical analysis
Urinary IsoPs (ng/ml) were normalized for urinary creatinine concentration and expressed as nanograms per milligram of creatinine. Univariate associations between measurements conducted at the first time point (baseline) and the Hp genotype were determined using the appropriate methods for continuous and categorical variables. Spearman rank correlations were used to investigate the association between each biomarker and participant characteristics. The procedure MIXED in SAS was used to assess the association between the Hp genotype and repeated measurements of each biomarker (as the dependent variables) after adjustment for risk factors significantly univariately associated with either the Hp genotype or the measured biomarker. Mixed models were also used to graph trajectories of the main independent variables over time by Hp. Trajectories were plotted as a function of the follow-up time, and cubic splines with continuous second derivatives were used to smooth lines. Non-normally distributed outcome variables were logarithmically transformed to more closely satisfy the assumption of normality.
Footnotes
Acknowledgments
The authors thank Ms. B. Hauth, Department of Epidemiology, University of Pittsburgh, and Ms. R. de la Vega, Department of Epidemiology, University of Pittsburgh, for expert laboratory analyses. The authors are forever indebted to the participants of the Pittsburgh Epidemiology of Diabetes Complications (EDC) study who have tirelessly volunteered their time for more than 20 years. This research has been supported by NIH grants, DK34818 and DK082900.
Authors' Contributions
T.C. conceived the hypothesis, researched data, and wrote the manuscript. R.W.E. researched data and edited the manuscript. T.J.O. researched data and edited the manuscript. T.C. is the guarantor of this work.