
Abstract
Introduction
R
The present work represents the first use of tools for measuring and manipulating H2O2 and glutathione (GSH) levels to perform a thorough analysis of the redox changes following treatment of tumor cells with reactive oxygen species (ROS)-based chemotherapeutics piperlongumine and phenethyl isothiocyanate. The reported data indicate that contrary to previous publications involving these compounds, GSH depletion plays an insignificant role in the toxicity mechanism. The study also demonstrates how the combined used of sensors and generators for specific oxidants, in this case H2O2, can yield a deeper mechanistic insight into how a particular ROS generated as a result of treatment with these compounds causes toxicity.
Intracellular glutathione (GSH) is an example of a target of ROS-based chemotherapeutics. Given the role of GSH in the reduction of H2O2 and the oxidation of sulfhydryl group, it is believed that GSH depletion will cause toxicity via accumulation of H2O2 and oxidized proteins (6). It has been previously suggested that electrophilic small molecules such as buthionine sulfoximine (BSO), piperlongumine (PL), and phenethyl isothiocyanate (PEITC) convey at least part of their toxicity via this mechanism (9, 16, 39, 49, 51, 56), and all of these drugs have been shown to be selectively toxic to certain in vitro and in vivo tumor models (1, 5, 13, 39). Incubation of tumor cells with piperlongumine and PEITC results in depletion of GSH and elevation of fluorescence from dichloro-dihydro-fluorescein diacetate (DCFH-DA), a cell permeable dye that exhibits increasing fluorescence intensity upon oxidation (9, 39, 49, 56). However, recent comprehensive studies involving a broader class of small molecules suggest that the depletion of GSH is often insufficient to induce death of tumor cells. In a study of six chemotherapeutics that induced varying degrees of GSH depletion, Zhu et al. showed no discernible correlation between GSH level and cell growth inhibition (57). This is corroborated by Adams et al., who created a library of piperlongumine analogs, many of which caused depletion of GSH but no cell toxicity (2). In addition, both groups measured the DCFH signal from cells treated with a variety of small molecules, including several current chemotherapeutics and their analogs, and found that while many small-molecule chemotherapeutics cause an increase in the DCFH signal, a dose–response relationship between fluorescence intensity and toxicity of the compound was not evident (1). These reports are difficult to reconcile with previous hypotheses regarding the mechanism of these compounds, and more generally highlight a lack of detailed understanding of ROS and how these drugs utilize ROS to cause toxic effects.
One way to improve our understanding is to discontinue thinking of ROS as a collective entity, but rather consider them as distinct molecules that have unique lifetimes, reactivity, and reaction kinetics with varying downstream targets. DCFH is oxidized by a one-electron, free radical mechanism, so it responds to several ROS, reactive nitrogen species (RNS), and even radicals localized on protein residues. Furthermore, since the molecule does not react directly with nonradical species such as H2O2, the signal can be affected by confounding variables such as availability of a metal catalyst. Activities of antioxidants, oxygen tension, and exposure to light are additional variables that impact the DCFH signal and lead to artifacts (54). Advances in specific protein-based probes for certain redox species, such as H2O2, have addressed these difficulties. These sensors are fusions of fluorescent proteins with bacterial or yeast domains that have natural selectivity for reaction with hydrogen peroxide (3, 17). Fusions are constructed such that reversible changes in the spectrum of the fluorescent protein occur when hydrogen peroxide oxidizes a cysteine of the microbial or yeast protein, causing it to subsequently form a disulfide bond with a neighboring cysteine (34). Two spectral features are affected, with an excitation peak at one wavelength decreasing and an excitation peak at a second wavelength increasing in a dose-dependent manner upon stimulation with hydrogen peroxide. The ability to examine the ratio of two spectral features, in contrast with measuring changes in fluorescence intensity for only one feature like DCFH, enables better intracellular quantification of H2O2 (21, 30, 47). The creation of these reversible, quantitative, oxidant-specific probes opens up new avenues for detailed study of oxidative stress produced by chemotherapeutics.
Complementary to these measurement probes, tools that allow determination of whether the observed level of antioxidant depletion or oxidant production is important to the toxicity of a drug, or merely a secondary effect of the compound. This involves manipulating the antioxidant level through reaction with small molecules and genetic overexpression of protein generators that can produce specific oxidants at controlled rates intracellularly. D-amino acid oxidase (DAAO) from Rhodotorula gracilis has been previously shown to be a powerful intracellular enzyme that can produce tunable and localizable H2O2 intracellularly depending on the concentration of D-alanine (D-Ala) substrate added (18, 20, 33). Using DAAO to provide spatial and temporal control over the production of H2O2, we can mimic the generation of the oxidant by chemotherapeutics and isolate its contribution to the mechanism of toxicity, if any.
In this study, we illustrate how using specific tools to quantitatively measure and manipulate intracellular GSH and H2O2 can contribute to a refined understanding of the involvement of these species in the action of chemotherapeutics, specifically piperlongumine and PEITC. We parse the importance of GSH depletion in these compounds using BSO, a specific GSH synthesis inhibitor. We also use a combination of a specific H2O2 sensor, HyPer, with an intracellular peroxide generator, DAAO, to determine if GSH depletion is linked to H2O2 elevation, and if the amount of H2O2 elevation is a critical part of drug toxicity. The resulting insights allow us formulate a hypothesis about the biochemical differences that contribute to the differential drug responses of HeLa and A549 cells to these drugs. Then, using nuclear factor erythroid 2-related factor 2 (Nrf-2) and Keap-1 knockout variants of a lung tumor model cell line, p53fl/KrasG12D, we established a genetic cause of these biochemical differences (10, 12). Our investigation illustrates the value of using chemically specific sensing and perturbation tools to gain a deeper understanding of ROS-based drugs, which may translate to further success in designing additional members of this class of promising therapeutic and to matching drugs with tumors that are likely to be susceptible.
Results
Differential response of HeLa and A549 cells to piperlongumine and PEITC
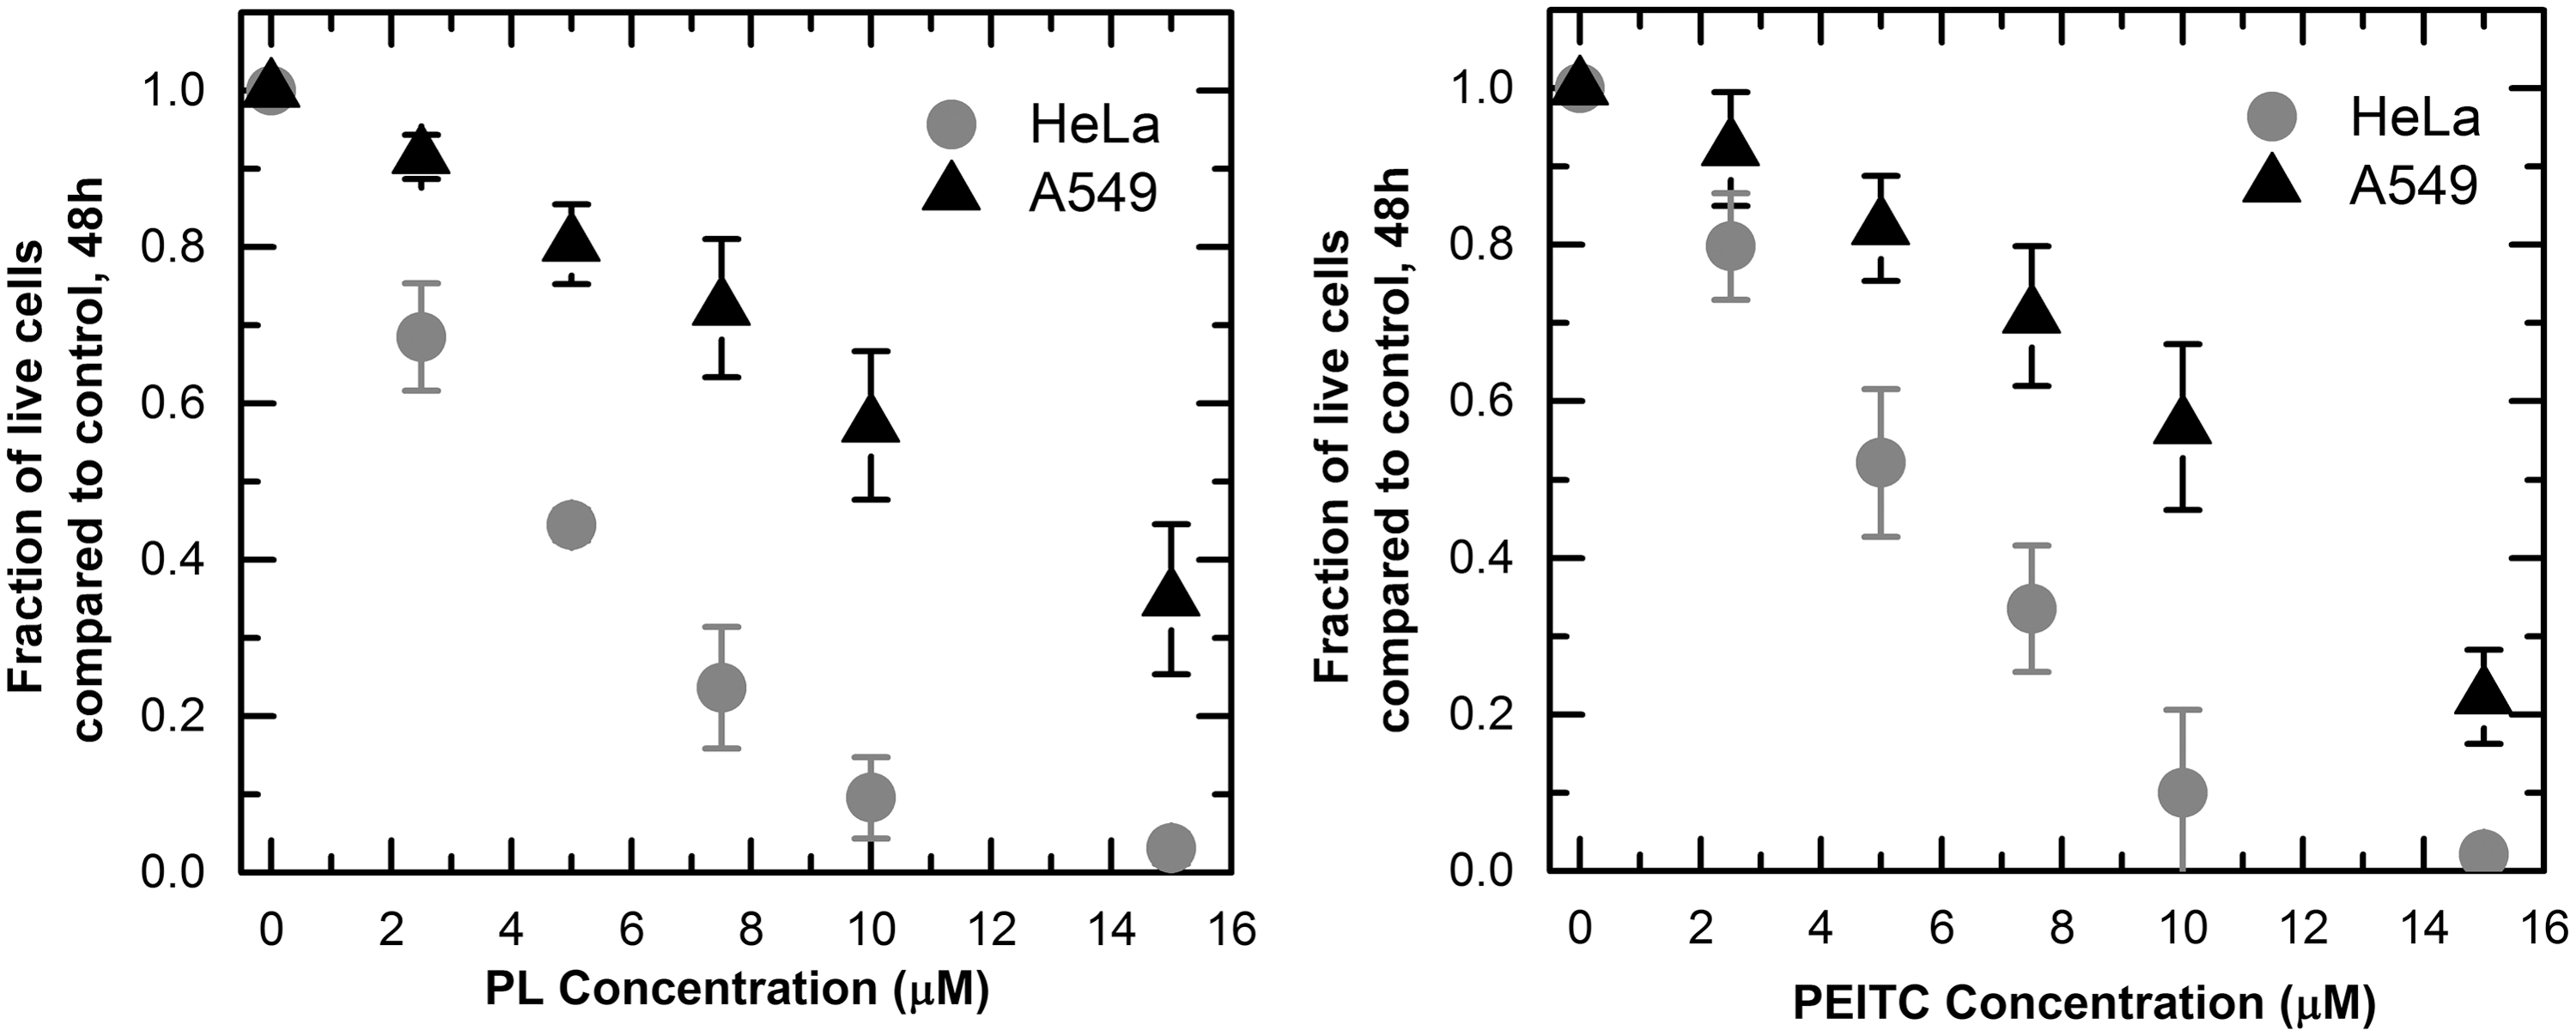
We exposed HeLa and A549 cells to increasing concentrations of piperlongumine and PEITC for a period of 48 h. We measured the inhibitory effects of the compounds by counting the live cells remaining on the dish after a period of 48 h and comparing the result to that of a control culture exposed to the same amount of dimethyl sulfoxide (DMSO) without a drug. We found that for both compounds, the A549 cells were more resistant than the HeLa cells. In the case of piperlongumine, the concentration needed to inhibit the tumor cell population by 50% was 4.4 ± 0.1 μM for HeLa and 11.7 ± 2.0 μM for A549; for PEITC it was 5 ± 0.08 μM and 10.2 ± 1.1 μM, respectively (Fig. 1). Comparing the toxicity of the drug to both cell lines with toxicity to a nontumor forming cell line, MCF-10A, the A549 cells were of similar resistance while the HeLa cells were much more susceptible (Supplementary Fig. S1; Supplementary Data are available online at
The role of glutathione in piperlongumine and PEITC mediated tumor inhibition
One of the mechanisms of piperlongumine and PEITC toxicity suggested by previous studies is the depletion of the total GSH level and the subsequent increase in oxidative stress (5, 9, 39, 49, 56). We used a specific, small-molecule inhibitor of GSH synthesis, BSO, as a control for determining whether the level of depletion in the two compounds is an important contributor to tumor inhibition (57). We found that BSO did not cause significant growth inhibition in either the HeLa or the A549 cell lines after 48 h (Fig. 2a). To measure the magnitude of GSH depletion, we quantified the intracellular level of GSH in both cell lines after 10 h of exposure to BSO, piperlongumine, and PEITC. HeLa cells exhibited a twofold decrease in the level of GSH in response to PEITC, and a fourfold decrease in response to piperlongumine. BSO depleted the intracellular GSH level more significantly than PEITC and to the same level as piperlongumine in these cell lines (Fig. 2b). Together, these findings suggest that the depletion of GSH alone is not enough to induce toxicity in HeLa cells to the same degree as piperlongumine and PEITC. By comparison, the A549 cells showed virtually no GSH depletion effects as a result of treatment with piperlongumine or PEITC.
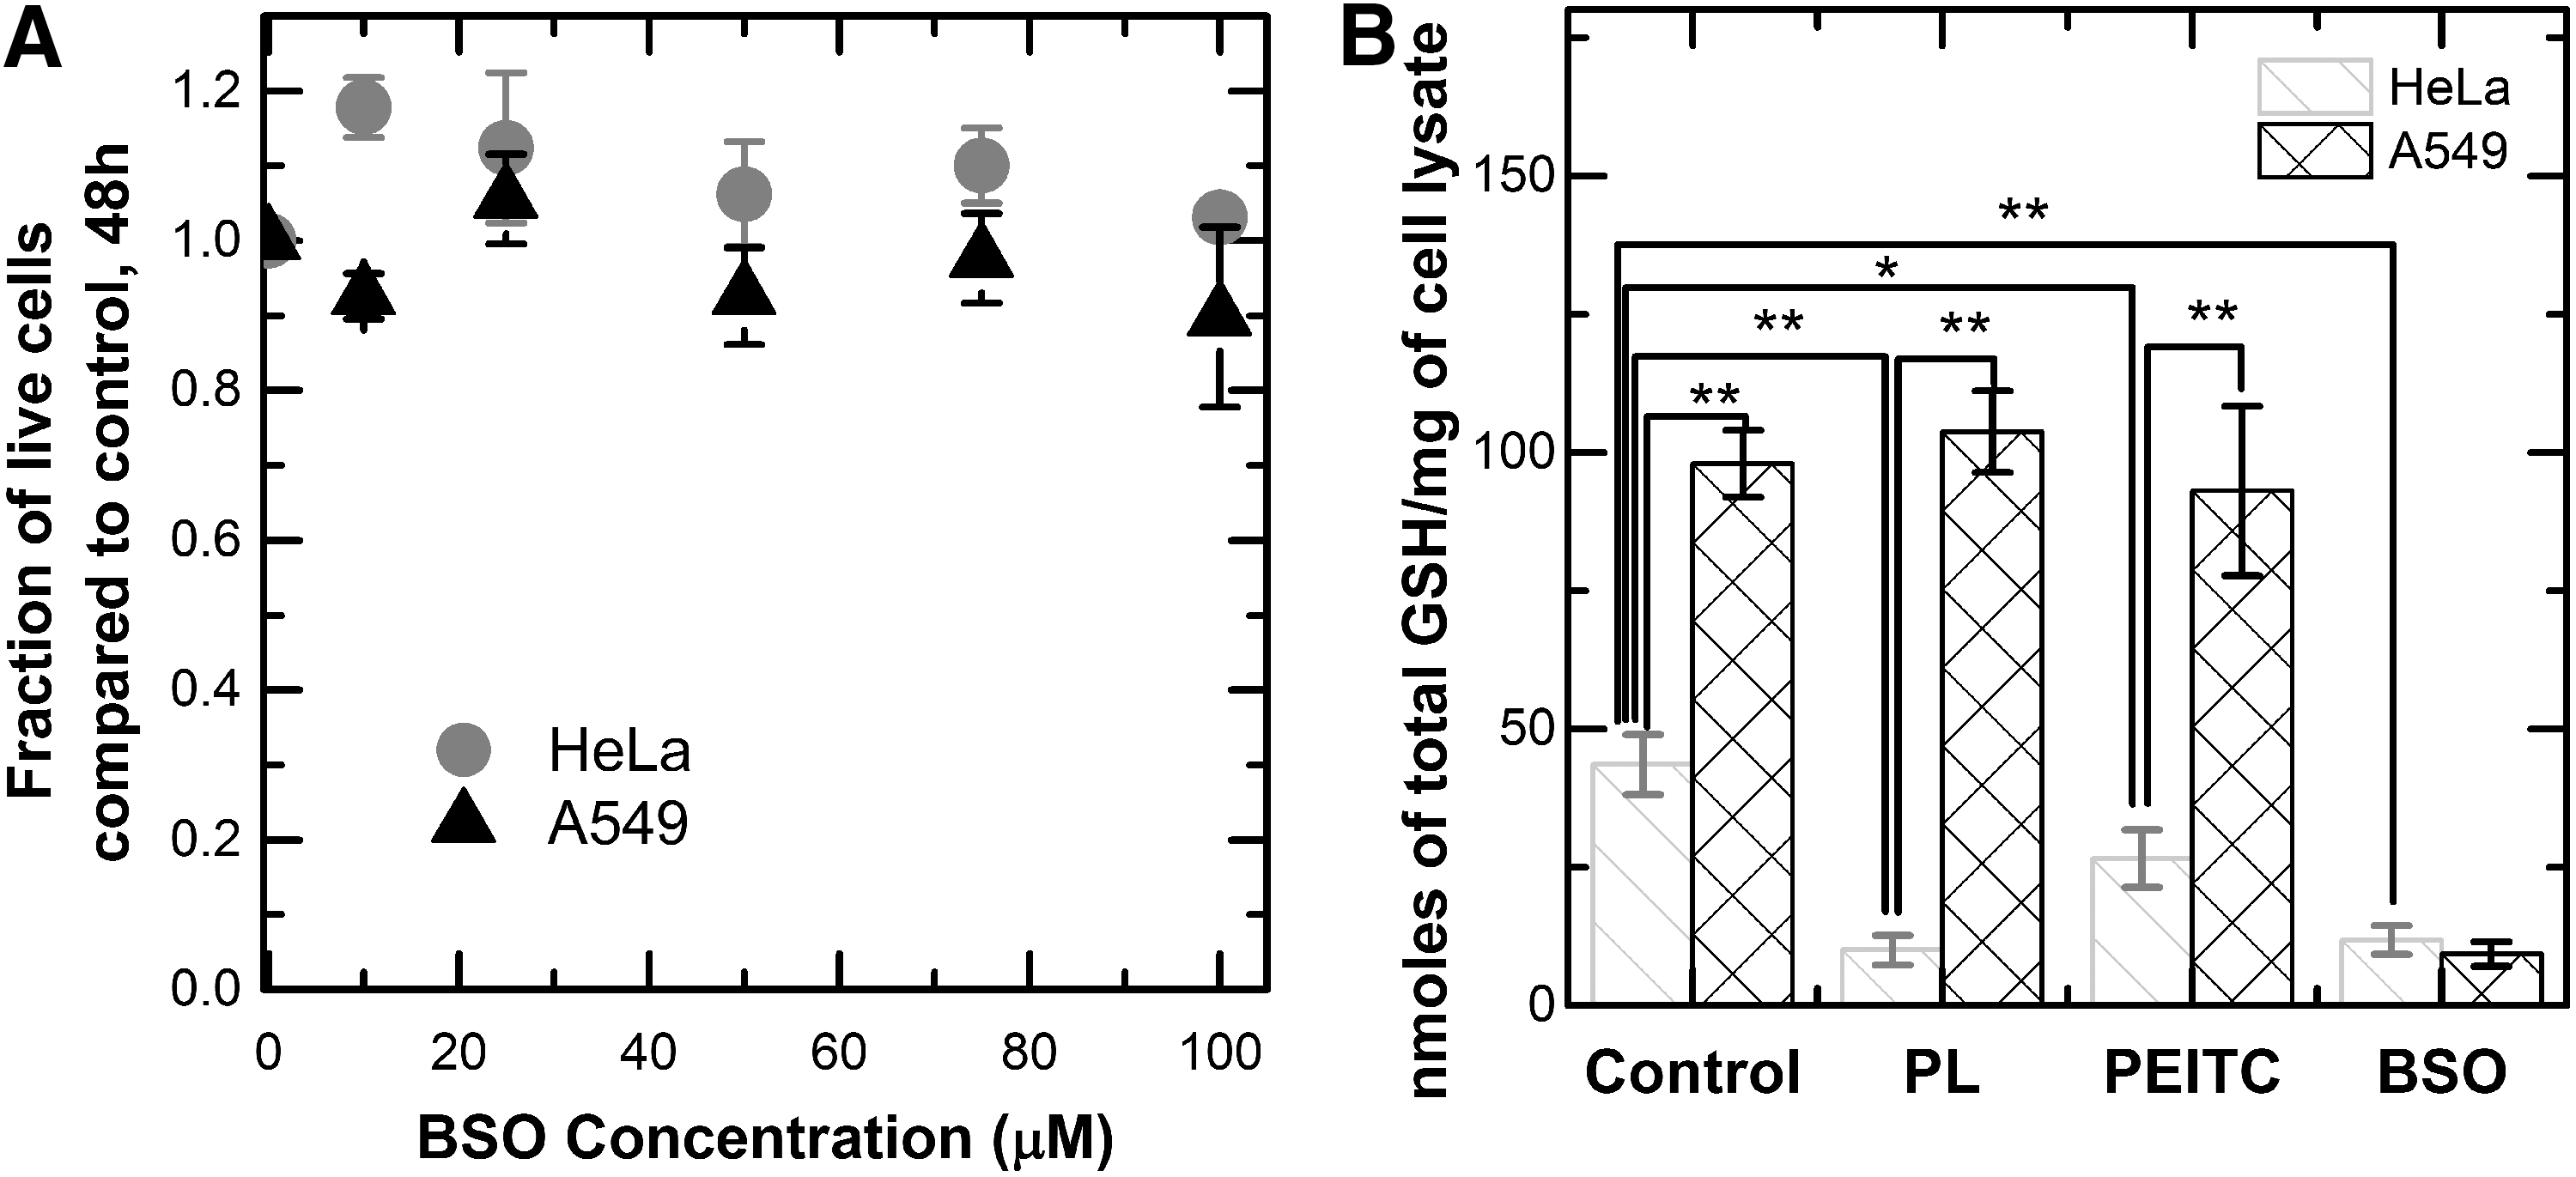
The data in Figure 2 raise the question of whether the resistance of A549 cells to GSH depletion contributes to the overall resistance of these cells to piperlongumine and PEITC in comparison with HeLa cells. One hypothesis is that while GSH depletion might not be the main toxicity mechanism, the presence of additional GSH in the A549 cells serves an important protective function. For example, if the drug acted by causing damaging DNA modifications, cell types with more GSH and more resistance to GSH depletion by the drug would have greater capacity to repair the damage, conferring resistance for the cell. We tested this hypothesis by cotreating A549 cells with BSO and piperlongumine, or BSO and PEITC, then comparing the subsequent GSH concentration and growth inhibition effects to those of HeLa cells incubated with just piperlongumine or PEITC. The purpose of the coincubation with BSO is to deplete the excess GSH of the A549 cells to test the antioxidant's protective function against the drugs. Coincubating A549s with 75 μM of BSO and piperlongumine or PEITC depleted A549s' GSH level to 2% of the original concentration, well below the GSH levels of HeLa cells treated with piperlongumine or PEITC alone (Fig. 3a). However, the coincubation did not make the A549s more susceptible to the two drugs compared to treatment with the drugs alone, without BSO (Fig. 3b,c). Thus, the additional GSH in A549s did not selectively protect these cells from the chemotherapeutics compared to the HeLa cells.
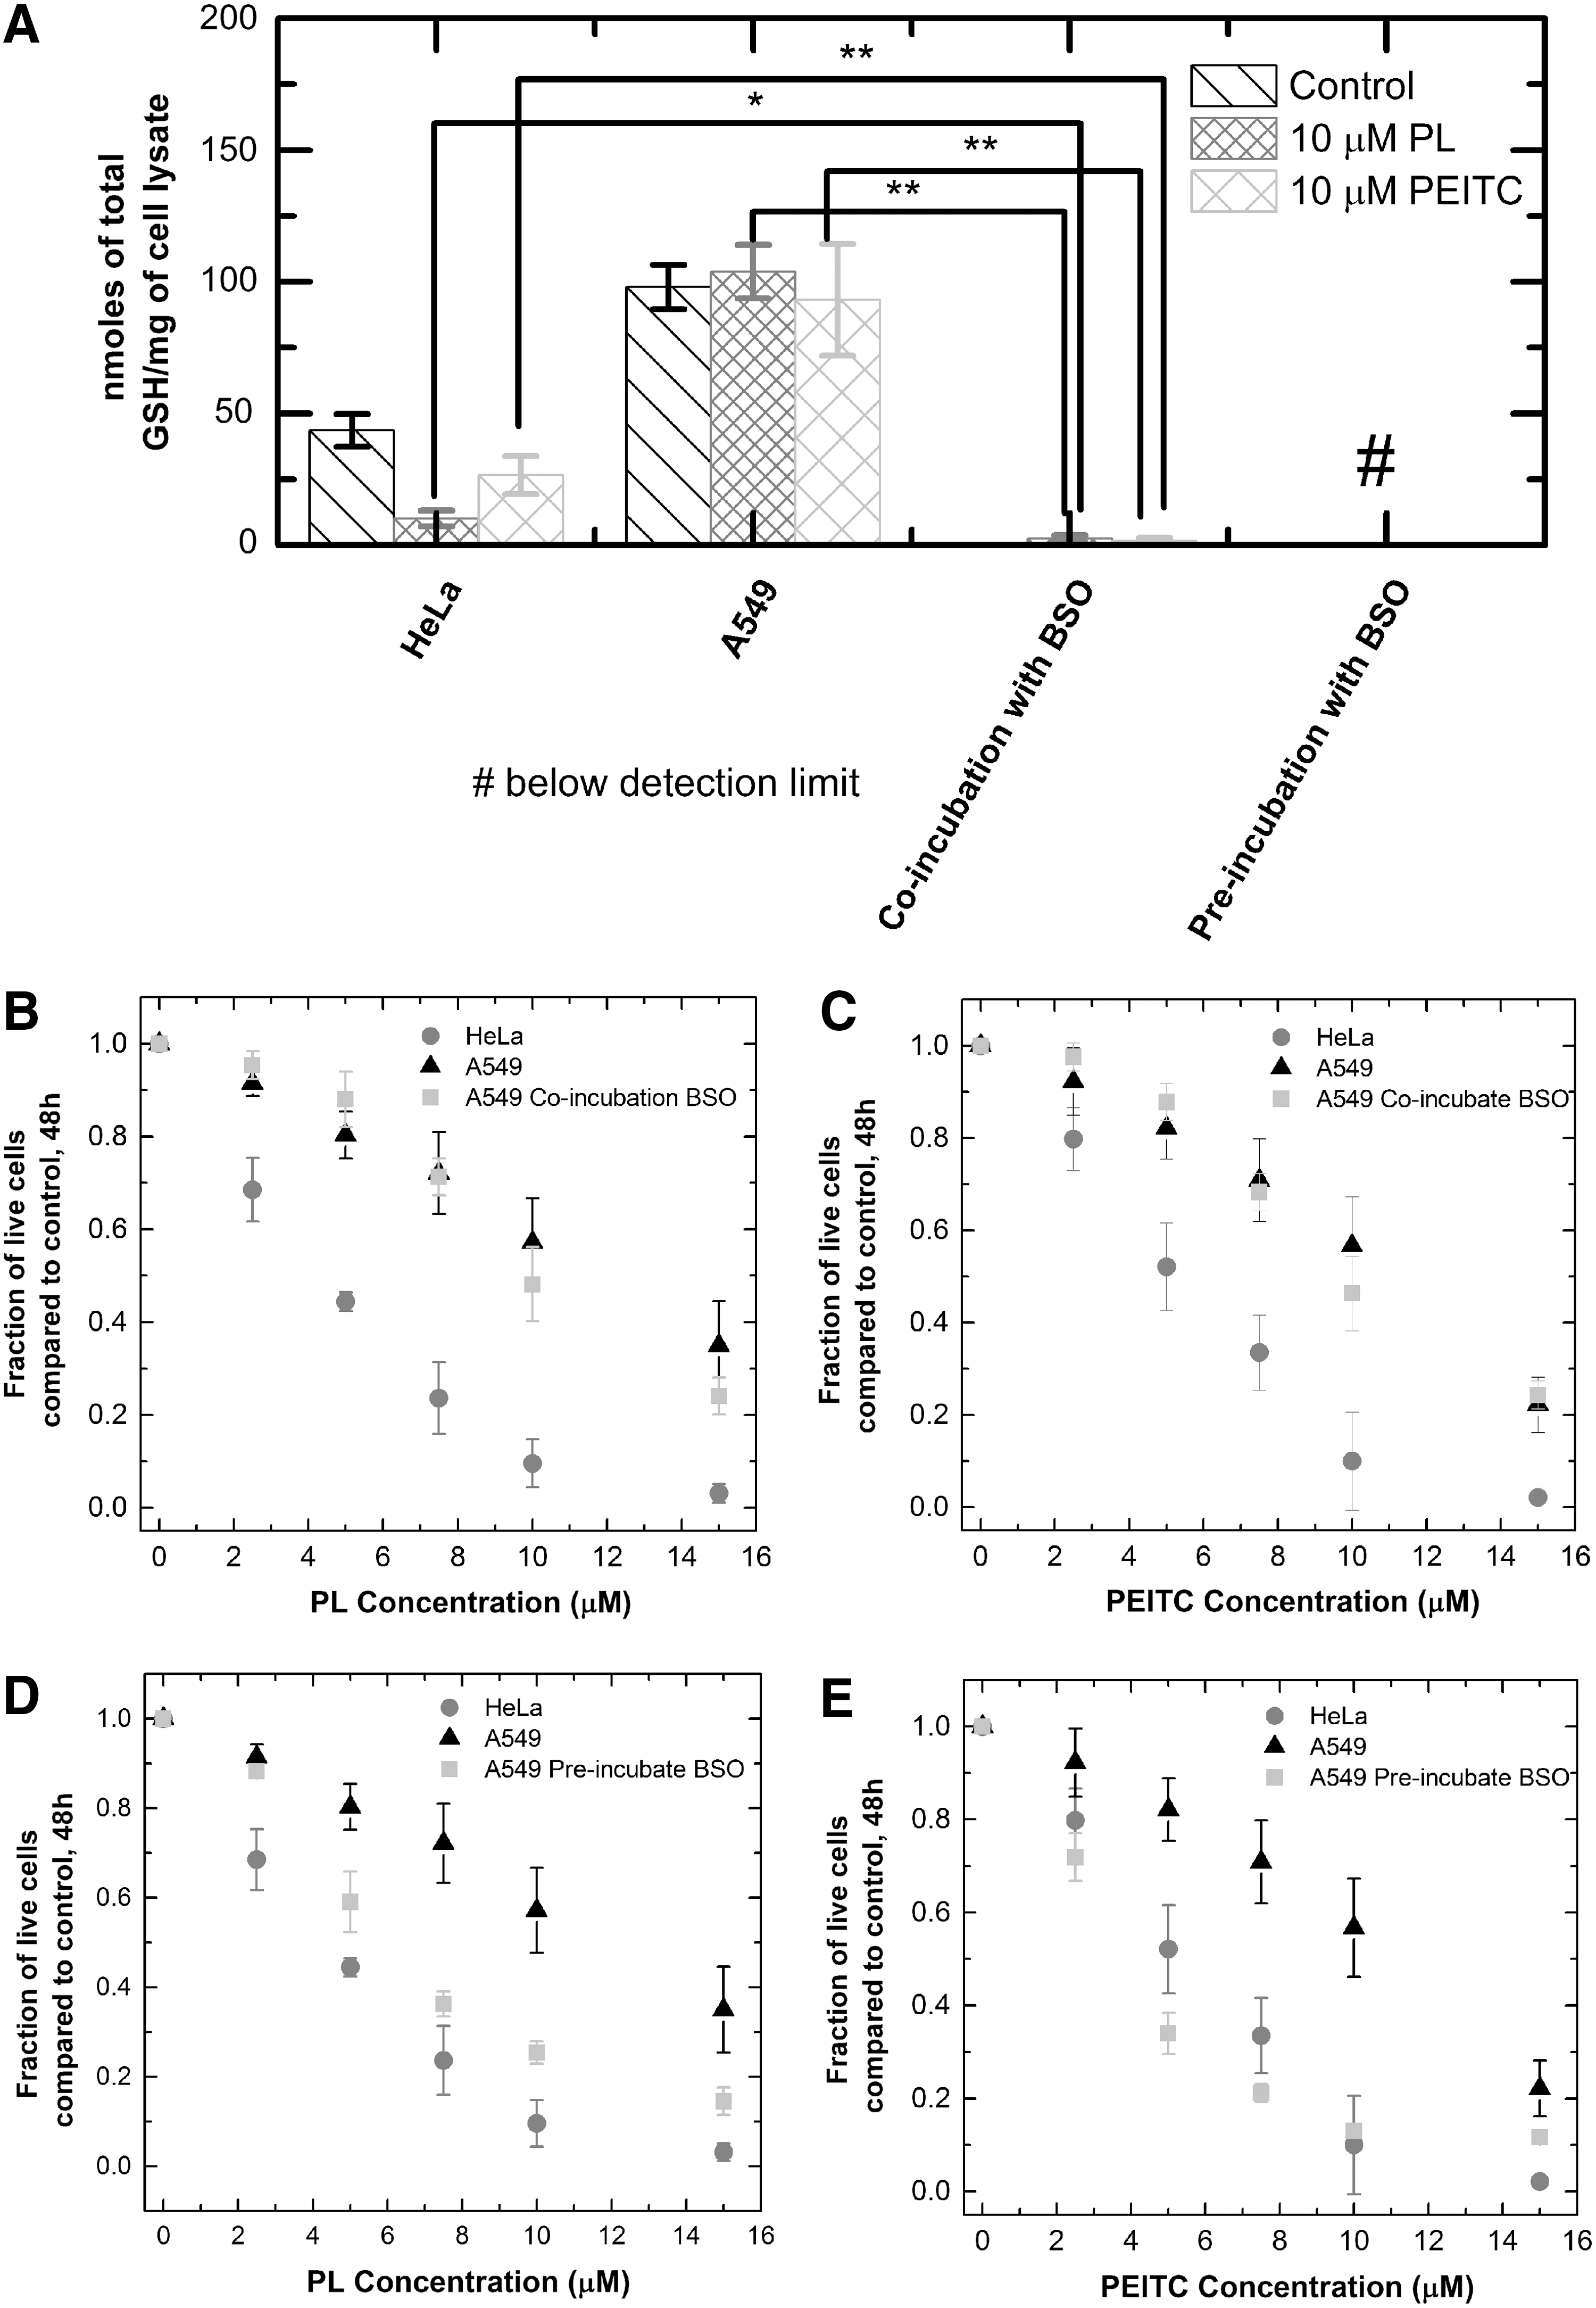
To determine whether further GSH depletion would result in an increased sensitivity of A549 cells to piperlongumine and PEITC, we preincubated A549 cells with 100 μM of BSO for 10 h before the addition of piperlongumine and PEITC. This pretreatment caused greater depletion of GSH than was observed for coincubation, resulting in concentrations below the detection limit of Ellman's assay. At this level of GSH depletion, the A549s showed increased sensitivity to piperlongumine and PEITC compared to drug treatment alone (Fig. 3d,e). It appears that some amount of GSH, however small compared to the control, is necessary for combating the toxicity effects of piperlongumine and PEITC. Thus, a way to increase the potency of the chemotherapeutics to the resistant A549 cells would be to pretreat the tumors with BSO to deplete almost all of the GSH, followed by treatment with the drugs.
The role of oxidative stress generated by piperlongumine and PEITC
Previous studies of piperlongumine and PEITC used the fluorescent dye DCFH as an indicator of intracellular oxidative stress, despite its nonspecificity and potential for artifacts as discussed earlier. The observed increase in DCFH signal was attributed to the diminishing oxidant scavenging ability due to the depletion of GSH (39, 49). The studies by Adams et al. and Zhu et al. appear to contradict that hypothesis; thus, it is necessary to study individual oxidants produced by these drugs separately to understand the mechanisms of action. Since many ROS-based therapies are thought to interfere with major peroxide-eliminating antioxidants (13), we focused on the role of H2O2 in the toxicity mechanism of piperlongumine and PEITC using tools that measure and manipulate the peroxide level. A specific sensor for H2O2 allows us to determine the amount of this oxidant that cells generate in response to the compound. An intracellular generator that produces H2O2 allows us to determine whether quantities generated are sufficient to induce toxicity.
We expressed HyPer, a ratiometric protein-based sensor with specificity toward H2O2, in the cytoplasm of HeLa cells exposed to piperlongumine and PEITC. As intracellular H2O2 increases, the ratio of peaks in the excitation spectrum at 488 and 415 nm, also known as the HyPer ratio, also increases (3, 11). Incubation of HeLa cells with either drug over a period of 12.5 h did not result in an increase in the HyPer ratio, while causing significant growth inhibition effects, with 61% and 38% of live cells remaining for piperlongumine and PEITC, respectively (Fig. 4a). As a comparison, we coexpressed intracellular enzymatic generator for H2O2, DAAO, with HyPer in the HeLa cells. By adding different concentrations of a substrate, D-Ala, we tuned the kinetics of intracellular H2O2 generation by the enzyme, measured via HyPer ratio changes (black lines, Fig. 4a). To see a 50% growth inhibition of HeLa cells, we needed a 1.6-fold increase in the ratiometric signal over the 12.5-h period. This means that to achieve growth inhibition at the same level as the drug compounds would require H2O2 concentrations significantly above the detection threshold of the HyPer sensor. The combination of generator and sensor for H2O2 allows us to conclude that the generation of peroxide alone cannot cause the observed toxicity of these drugs.

The fact that HyPer's signal did not provide evidence of H2O2 elevation leaves the question of whether the amount of H2O2 produced by piperlongumine and PEITC is below the detection limit of the probe. Peroxiredoxin II (Prx-2) is an antioxidant found in the cytoplasm of mammalian cells at hundreds of micromolar abundance and reacts specifically with H2O2 at rate constants greater than 107 M−1s−1 (21, 29, 31, 32). Compared to HyPer, which exists at submicromolar concentrations and reacts with H2O2 with second-order rate constant of 105 M−1s−1 (24, 50), Prx-2 reacts with peroxide with much higher efficiency, providing greater detection sensitivity. Upon oxidation by H2O2, a particular cysteine residue of Prx-2 is oxidized to a sulfenic acid (−SOH), which can then form a disulfide bond with a nearby thiol group of another Prx-2 to form a dimer (40, 55). The presence of this Prx-2 dimer is evidence of H2O2-derived oxidative stress and has the potential to be a more sensitive peroxide indicator than HyPer. We treated HeLa and A549 cells with 10 μM piperlongumine, 10 μM PEITC, or 100 μM BSO for 10 h and used an immunoblot to detect the monomer and the dimer forms of Prx-2. Treatment with piperlongumine resulted in an increase in the dimer form of Prx-2 in both HeLa and A549, while treatment with PEITC or BSO did not cause an increase in the dimerization of Prx-2 (Fig. 4b,c). We note that this observed H2O2 increase as a result of piperlongumine treatment is not detected by HyPer. The lack of Prx-2 dimerization from BSO and PEITC treatment indicated that the H2O2 increase in response to piperlongumine is not due to glutathione depletion. Comparing the level of Prx-2 dimerization in HeLa versus A549 cells showed that HeLa cells are much more susceptible to H2O2 elevation than A549 cells in response to piperlongumine. It is thus possible that this difference afforded the A549 cells an advantage in combating drug toxicity in comparison with HeLa cells.
To test this hypothesis, we determined whether this small amount of elevated H2O2 was important for the toxicity of piperlongumine. By overexpressing catalase in the cytoplasm, we provided a means to scavenge the peroxide produced during piperlongumine treatment. A comparison of drug toxicity with and without the additional catalase allowed us to determine whether the elevated H2O2 was an important part of the drug's mechanism. We modified the catalase gene by mutating the peroxisome targeting sequence—KANL of human catalase to KADL (37). Immunofluorescence staining and immunoblotting showed that the HeLa cells with this modified gene construct have increased catalase expression in the cytoplasm (Supplementary Fig. S2). This modified cell line, HeLaCat, displayed less Prx-2 dimerization, as well as less toxicity upon incubation with piperlongumine compared to the unmodified HeLa cells (Fig. 5), suggesting that the H2O2 elevation is important to the toxicity mechanism. To test whether the H2O2 originated from superoxide dismutation, we pretreated HeLa cells with TEMPOL and mito-TEMPO before addition of piperlongumine. These small molecules are superoxide dismutase mimetics that act as a radical trap for superoxide in the cytoplasm and mitochondria, respectively (27, 51). Neither TEMPOL nor mito-TEMPO reduced the piperlongumine-induced Prx-2 dimerization (Supplementary Fig. S3), nor did they improve the survival of HeLa cells after treatment. Thus, incubation with the drug led to production of hydrogen peroxide but not superoxide, and that production conferred some of the toxic effects.

The observation that low-level H2O2 elevation in piperlongumine treatment is important to drug toxicity is interesting in comparison with the observation that DAAO-generated H2O2 at sub-HyPer levels is essentially nontoxic (Fig. 4a). This implies that H2O2 produced during treatment with piperlongumine is acting in synergy with the drug to cause greater toxicity than if the H2O2 is produced independently. We measured a major target of H2O2 oxidation, the thiol groups (−SH) of cysteine residues. Elevated H2O2 can oxidize the −SH group to sulfenic acid (−SOH), which can then be followed by protein s-glutathionylation, where GSH protects the oxidized protein thiols by forming a mixed disulfide with the −SOH group. The formation of the mixed disulfide allows the oxidized protein to be repaired by glutaredoxin (Grx), which converts the disulfide back to a sulfhydryl group (15). Detection of glutathionylated proteins is an indication of proteins whose thiol groups have been oxidized. For HeLa cells treated with 10 μM piperlongumine, 10 μM PEITC, or 100 μM BSO for a period of 10 h, an antibody that detects protein-GSH complexes was used to visualize intracellular protein oxidation via immunofluorescence. Unsurprisingly, only piperlongumine treatment showed an elevation of glutathionylation (Fig. 6a). Thiol oxidation from piperlongumine treatment was then compared to thiol oxidation from H2O2 generated via DAAO. We found that even though the DAAO generator produced more intracellular H2O2 than piperlongumine, at levels well above the detection limit of HyPer (Fig. 6b), the drug treatment still showed greater thiol oxidation (Fig. 6c). To understand this higher thiol oxidation from the drug, we tested whether the reaction between GSH and the oxidized protein thiol for drug-treated cells resulted in a disulfide bond. After converting all intracellular sulfhydryl groups of cysteine side chains to −S−S−CH3 using methyl methanethiosulfonate (MMTS), we used Grx to reduce GSH-protein mixed disulfides to sulfhydryl groups (6) and detected the newly reduced groups using biotinylated maleimide (Fig. 6d). We found that there was no increased detection of sulfhydryl groups in cells that were treated with piperlongumine (Fig. 6e), meaning there was minimal formation of Grx-reducible disulfides. This suggests that the GSH-protein complexes formed during drug treatment do not contain the typical disulfide bonds formed during s-glutathionylation. The presence of an irreducible protein-GSH bond provides a possible hypothesis for how the H2O2 produced by piperlongumine causes enhanced thiol oxidation and toxicity: proteins oxidized and glutathionylated in the presence of elevated H2O2 interact synergistically with the drug to form a unique, irreversibly oxidized protein, the accumulation of which leads to cell death.

Quantifying the fluorescence signal from protein-GSH complexes using flow cytometry, we showed that the HeLa cells displayed more thiol oxidation than the A549 cells in response to the same piperlongumine treatment (Fig. 6f). This corroborates our previous data showing less H2O2 elevation in A549 cells compared to HeLa cells in response to the drug. These results support our hypothesis that A549 cells were more resistant to piperlongumine than HeLa cells due an enhanced peroxide scavenging system, which prevented irreversible protein oxidation by the drug.
The role of Nrf-2 in conferring A549 resistance to piperlongumine and PEITC
Our investigation so far has shown that A549 cells are much more resistant to the effects of PEITC and piperlongumine than HeLa cells. While the GSH level has little effect on resistance to either compound, we now have evidence suggesting that the cell's ability to prevent H2O2 accumulation could be important for resistance to piperlongumine. To provide a genetic basis for the increased resistance, we investigated the role of Nrf-2, a transcription factor that is a master regulator for many protective functions from oxidative stress inside the cell (8, 46). At the basal state, Nrf-2 is sequestered and bound to Keap-1 in the cytoplasm. When an elevation in oxidative stress occurs, the redox-sensitive Keap-1 is oxidized and undergoes a conformational change, releasing Nrf-2 and allowing it to translocate into the nucleus, activating the antioxidant response element (ARE) signaling pathway (22). The products of the ARE pathway, in turn, modulate oxidative stress, often times by upregulating important antioxidants related to H2O2. It has been shown that A549 cells have elevated nuclear Nrf-2, likely due to the presence of Keap-1 mutations (23, 36, 43, 45). Therefore, we designed experiments to isolate the effects of the nuclear Nrf-2 level on the observed cellular responses to PEITC and piperlongumine treatment. To do so, we used primary cells from a murine lung tumor model, p53fl/KrasG12D (10, 52), and two knockouts were created: Nrf-2 null and Keap-1 null cells. The three cell lines are hereby known collectively as the Nrf-2 cell lines. The knockout of Nrf-2 should severely deplete the nuclear Nrf-2, and the knockout of Keap-1 should cause a significant increase in the Nrf-2 level, mimicking the mutations found in A549s. The difference in nuclear Nrf-2 level between these three cell lines was reflected in measurements of intracellular GSH levels, since Nrf-2 regulates GSH synthesis. The Keap-1 null cells had the highest concentration of intracellular GSH, at 10 times that of the Nrf-2 null cells (Supplementary Fig. S4).
When we exposed the Nrf-2 cell lines to both drugs, we found that the Keap-1 null cells were much more resistant to the chemotherapeutics than the p53fl/KrasG12D or the Nrf-2 null cells (Fig. 7a,b). In line with this observation, the Keap-1 null cells also showed very little dimerization of Prx-2 during piperlongumine treatment compared to the other cell lines (Fig. 7c,d). As a result, the increase in thiol oxidation in Keap-1 null cells upon piperlongumine treatment was the least among the three cell lines (Supplementary Table S1). We can conclude that the increased nuclear Nrf-2 level in the Keap-1 null cells was important for diminishing the H2O2 elevation caused by piperlongumine treatment, conferring protection of the cells against the potential toxic effects of thiol protein oxidation.

Discussion
A better understanding of ROS-based chemotherapeutics can be achieved by measuring and manipulating the levels of individual redox molecules inside the cell in a quantitatively controlled manner. In this study, we focused on PEITC and piperlongumine, two electrophiles whose toxicity has been suggested to be related to the observed depletion of GSH and the observed increase in oxidative stress, as measured by DCFH, a nonspecific probe. However, a detailed, molecular-level understanding of the relationship between the toxicity of these drugs, GSH depletion, and oxidative stress has not been established. By using tools that specifically measure and manipulate the levels of GSH and the H2O2 inside the cell, we were able to further elucidate the roles of these individual species in the mechanisms of these drugs.
Using the specific GSH synthesis inhibitor, BSO allowed us to control the GSH level independently of other toxicity effects of the drugs. Our finding that the GSH depletion alone cannot cause any toxicity in PEITC or piperlongumine agrees with previous observations by Zhu et al. and Adams et al. showing a lack of correlation between the ability to deplete GSH and cellular toxicity for a sample of small molecules. The GSH depletion via BSO did not elevate H2O2 as measured by HyPer or peroxiredoxin dimerization, even though previous studies have linked it to the elevation in DCFH signal. The lack of elevation can be attributed to the relative importance of GSH compared to other faster reacting antioxidants such as peroxiredoxin and glutathione peroxidase. GSH depletion also did not affect protein glutathionylation during piperlongumine treatment. While the HeLa cells experience much greater depletion than the A549 cells in response to incubation with the drug, the abundance of protein-GSH complexes detected in HeLa cells was still much greater than the A549 cells. This seemingly contradictory result suggests that the amount of GSH used in reactions with oxidized thiols resulting from treatment with these drugs is negligible compared to the total pool of intracellular GSH. In addition to our finding that GSH depletion alone is nontoxic, we also found that the amount of depletion induced by piperlongumine or PEITC is not important for the increased resistance of A549 cells in comparison with HeLa cells. This finding resulted from comparing the toxicity to A549 cells coincubated with BSO and one of the drugs to that of the HeLa cells incubated with the drug alone. The coincubation depleted the GSH level of A549 cells below that of HeLa cells incubated with the drug, but it did not decrease the resistance of A549 cells to the drug. This observation was surprising because GSH was suggested as a major contributing factor to chemoresistance in certain tumor cells (42), but in this case, the cellular GSH level appears unimportant for sensitivity to piperlongumine and PEITC.
The combination of an intracellular H2O2 sensor and generator demonstrated a unique approach for understanding the intracellular oxidative perturbations induced by ROS-based chemotherapeutics. These tools allowed us to not only assess whether a specific oxidant is produced but also if the quantity produced is substantial enough to cause toxicity. In this study, the HyPer sensor allowed us to conclude that the amount of peroxide generated by either piperlongumine or PEITC is below the detection limit of the probe, and the DAAO generator showed that the H2O2 level below the detection limit is nontoxic. Using Prx-2 dimerization as a more sensitive way to detect elevated H2O2, we saw that only piperlongumine caused an elevation of H2O2. We investigated the importance of this H2O2 elevation by eliminating it via overexpressed catalase in the cytoplasm. We were surprised to find that the elimination of this low, nontoxic amount of H2O2 rescued the HeLa cells from toxicity due to piperlongumine treatment, suggesting an essential role for elevated H2O2 in the drug's mechanism of action. Furthermore, the amount of glutathionylated protein in response to piperlongumine treatment was much higher than that caused by the peroxide generator DAAO, despite the fact that DAAO produced more H2O2 than piperlongumine. All of this suggests a toxicity mechanism involving a synergy between the H2O2 produced and the drug. Molecular tools that enabled specific measurement and manipulation of intracellular H2O2 levels were critical in achieving an enhanced understanding of how these redox therapeutics function.
While we cannot confirm the exact mechanism by which H2O2 and piperlongumine act together to cause enhanced, irreversible protein oxidation and cell toxicity, our preliminary investigation into the nature of the protein-GSH bond formed during piperlongumine treatment provided some working hypotheses. We found that this bond was not reducible by Grx and atypical of the mixed disulfide bonds generally formed during glutathionylation, in agreement with findings from Adams et al. (2). Thus, one possibility is that the H2O2 produced by piperlongumine causes glutathionylation of thiol proteins, which then interact and form an irreversible covalent bond with piperlongumine. The irreversible accumulation of oxidized protein gives the drug its enhanced H2O2 toxicity effect. Testing this hypothesis will require mass spectrometry to elucidate these protein-GSH adducts.
One of the lasting challenges of chemotherapy is the variation in drug efficacy against different cell types. A549 cells belong to a class of nonsmall cell lung carcinomas that typically have poor prognosis and show resistance to treatment with chemotherapeutics (12). We found that both piperlongumine and PEITC were less toxic to A549s than HeLa cells, but it is unknown what biochemical changes contribute to this difference in response. In this study, we specifically examined whether GSH and H2O2 levels played a role in A549 resistance. We found that A549 resistance to both drugs is independent of its upregulated GSH level. However, A549 cells were more resistant to H2O2 elevation and subsequent protein oxidation in response to piperlongumine, suggesting that these cells may have upregulated antioxidants against H2O2 that provided the resistance. We manipulated an important transcription factor involved in antioxidant regulation, NRF-2, which is increased in the A549 cells as a result of its KEAP-1 mutation. We demonstrated using NRF-2 cell lines that increased nuclear NRF-2 level, protected cells from the effects of piperlongumine, and elevated H2O2. This is perhaps unsurprising since NRF-2 has been shown to be upregulated in many instances of chemoresistance; cell lines adapted to increasing concentrations of doxorubicin often show elevated levels of NRF-2 (42). However, increasing NRF-2 does not always exert a protective function on the intracellular oxidant level. A recent study showed that increasing NRF-2 level above a threshold actually amplifies oxidative stress by induction of KLF9 and causes additional cellular toxicity, and so, a balance of its pro-oxidant and antioxidant function has to be considered (58).
Our study showed that the elevation in H2O2 is responsible for at least part of piperlongumine's toxicity mechanism, but we cannot rule out other contributing factors. The increase in Prx-2 dimerization from incubation with the drug could also be due to inhibition of thioredoxin, the reduction partner of Prx-2. There are also alternative ways of causing protein glutathionylation other than H2O2 oxidation. Free radical formation on the thiol group followed by reaction with GSH, and thiol group reaction with oxidized GSH (GSSG) can also form protein-GSH complexes (7). In addition, we have not considered the potential role of RNS. Nitric oxide reacts with thiol proteins in a process called nitrosylation, the product of which can be an important part of toxicity, and nitrosylated proteins often convert to glutathionylated proteins by GSH, adding to the glutathionylation measurement (38). We also were not able to determine the oxidant relevant to PEITC mechanism in this study. While originally thought to operate similarly to piperlongumine, we showed that treatment with PEITC does not produce H2O2 or superoxide necessary for toxicity (Supplementary Fig. S5). Recent studies of PEITC suggest the involvement of RNS (5), but the current repertoire of available tools is insufficient to study these molecules in a controlled manner.
With these caveats, the insights from our study are useful for future application of both chemotherapeutics, particularly in combating the chemoresistance of certain tumor cells through combinational therapy. Even though A549 cells were robust against GSH depletion from the drugs, there is still some minimal GSH concentration required for cell survival. Pretreatment using high concentrations of BSO followed by PEITC or piperlongumine can make these cells much more susceptible to the drugs. Furthermore, H2O2 role in the mechanism of piperlongumine suggests that an effective strategy of sensitizing A549 cells may be to cotreat the compound with an inhibitor of H2O2 antioxidants. These scavenger candidates are likely those upregulated by NRF-2. More generally, this work provides a demonstration of how to use specific intracellular sensors and generators to study particular oxidants, highlighting the need for both tools simultaneously to parse the role of a particular species in a mechanistic study that considers levels. We anticipate that the resulting enhanced understanding will allow judicious use and design of ROS-based cancer chemotherapeutics, making a promising field even more impactful.
Materials and Methods
Materials
Piperlongumine (PL) and BSO, GSH assay kit, and S-glutathionylation kit were purchased from Cayman Chemicals. PEITC, DMSO, Triton X-100, D-Ala, Flavin adenine dinucleotide (FAD), MMTS, and puromycin were purchased from Sigma. Dulbecco's modified Eagle's medium (DMEM) was purchased from Lonza. Fetal bovine serum (FBS) and pCAT10 catalase plasmid were purchased from ATCC. HyPer plasmid was obtained from Evrogen. DAAO plasmid was a gift from Brian Ross (University of Michigan). The lentiviral transfer plasmid pLJM-EGFP was a gift from David Sabatini (Addgene plasmid No. 19319). The HeLa cell line was a gift from Dane Wittrup (Massachusetts Institute of Technology). The A549 cell line was a gift from Doug Lauffenburger (Massachusetts Institute of Technology). The NRF-2 cell lines, p53fl/KrasG12D, p53fl/Kras G12D/Nrf-2−, and p53fl/Kras G12D/Keap-1− cell lines were a gift from Tyler Jacks (Massachusetts Institute of Technology). The HeKFT cell line and the PAX2 and pMD2.G viral packaging plasmids were a gift from Christopher Chen (Boston University). Cell Tracker Deep Red, Opti-MEM, and Lipofectamine 2000 were purchased from Invitrogen. A primary polyclonal goat antibody for Prx-2 was purchased from R&D systems. Primary polyclonal rabbit antibodies for alpha tubulin and GADPH were purchased from Cell Signaling. A primary monoclonal mouse antibody (clone no. D8) against protein-GSH conjugates was purchased from Abcam. Secondary LI-COR antibodies against goat and rabbit primary antibodies were purchased from LI-COR Biosciences. Secondary FITC-labeled antibodies against mouse primary antibody were purchased from Jackson ImmunoResearch. The same lot for each antibody was used for all of the experiments.
Cell culture
HeLa, A549, p53fl/Kras G12D, p53fl/Kras G12D/Nrf-2−, p53fl/Kras G12D/Keap-1− were cultured in DMEM supplemented with 10% FBS. The MCF-10A cells were cultured in DMEM/F12 medium (Invitrogen) supplemented with 5% horse serum (Invitrogen), 20 ng/ml EGF (Peprotech), 0.5 mg/ml hydrocortisone (Sigma), 100 ng/ml cholera toxin (Sigma), and 10 μg/ml insulin (Sigma). The cultures were maintained in a 37°C humidified incubator in the presence of 5% CO2. Medium was changed every 3 days and cells were passaged every 5–6 days. HeLa cells virally transfected with plasmids containing HyPer, catalase, and DAAO were maintained in the same DMEM containing 2 μg/ml of puromycin.
Molecular cloning for HyPer, catalase, and DAAO
The coding sequence for HyPer (1.5 kb) and DAAO (1.2 kb) was amplified and reinserted in the lentiviral transfer vector pLJM-EGFP at cloning sites Nhe1 and BamH1, removing the EGFP. The relevant coding sequence of human catalase (1.6 kb) was amplified from the pCAT10 vector with a point mutation in the reverse primer, changing the penultimate amino acid from asparagine (N) to aspartic acid (D). The primers used to amplify the sequence were 5′ primer: AAAA GCTAGC GCA GTG TTC CGC ACA GCA AAC and 3′ primer: AAAA GGCGCGCC TCA CAG AT
Lentiviral transfection of cells with genes encoding HyPer, catalase, and DAAO
HEK FT cells were seeded at 7.5 × 10⁵ cells/35-mm well and grown for 2 days until 90% confluence. The pLJM transfer vector with the appropriate gene insert was cotransfected with the packaging plasmids PAX2 and pMD2.G at a 3:2:1 ratio for a total of 5 μg of plasmid and 10 μg of Lipofectamine 2000 for a period of 18 h in Opti-MEM. Subsequently, 1 ml of DMEM supplemented with 10% FBS was used to replace the transfection medium. This medium containing lentiviruses was collected every 24 h for a period of 2 days. The medium was centrifuged at 500 g for 5 min and the supernatant was collected. One milliliter of the supernatant, along with 6 μg/ml of polybrene, was then added to an 80–90% confluent 35-mm well of HeLa cells. Three days postinfection, the medium containing 5 μg/ml of puromycin was used for selection of HeLa cells containing the plasmid for a period of 10 days.
Growth inhibition assay
HeLa and A549 cells were seeded at 1.5 × 10⁵ cells/well in a 12-well plate the night before drug addition. The MCF-10A cells were seeded at 0.75 × 10⁵ cells/well in a 12-well plate 2 days before drug addition. All of the cell lines have similar cell count at the start of the drug treatment. One milliliter of appropriate media for each cell line containing the chemotherapeutic was added to each well and incubated for a period of 48 h. Afterward, the remaining live cells on the dish were trypsinized and quantified using the Beckman Coulter Vi-Cell Counter, which detects exclusion of trypan blue. The fraction of live cells remaining was calculated by dividing the number of live cells for each experimental condition by the number of live cells in the control case with DMSO only, 48 h postdrug addition.
Total GSH measurement
Cells were seeded at 3.5 × 10⁵ cells/well in a six-well dish. The next day, 2.5 ml of DMEM supplemented with 10% FBS containing the appropriate chemotherapeutic was added to each well and incubated for a period of 10 h. Afterward, the cells were trypsinized and lysed with 100 μL of 1% triton X-100 for 20 min on ice, followed by 10 min of centrifugation at 12,000 g. Proteins in the supernatant were precipitated using an equal volume of 0.1 g/ml of metaphosphoric acid. Centrifugation at 12,000 g separated the liquid from the precipitate. The pH was readjusted by adding 4 M triethanolamine at 1:20 dilution to the supernatant. Both oxidized and reduced glutathione were measured by using glutathione reductase to reduce the GSSG, followed by reaction with DTNB (Ellman's Reagent) as dictated by the Glutathione Quantification Kit from Cayman Chemicals.
Using DAAO enzyme for controlled peroxide production
HeLa cells cotransfected with HyPer and DAAO plasmids were seeded at 3.5 × 10⁵ cells/well on a six-well plate. The substrate for the DAAO enzyme, D-Ala, was added at 0–20 mM concentrations to the 2 ml of extracellular medium (10% FBS + DMEM), along with the cofactor substrate FAD at 5 μM. Four to five images per well of the cells were taken with the HyPer wavelengths every 30 min for a period of 12.5 h.
Quantification of HyPer's fluorescent signal
Fluorescent images of all cells expressing HyPer were captured using an Olympus wide-field fluorescence microscope (IX81) on a 10× Olympus objective. Samples were excited using a Prior Lumen2000 lamp at wavelengths 415/30 nm and 488/25 nm light and emission was recorded at 525/40 nm, with lamp intensity set at 10% and an exposure time of 300 ms. Four to five fields of view were captured per condition, and the images were exported to ImageJ for postprocessing. All images were background subtracted using the rolling ball algorithm with radius of 200 pixels, and then, the mean pixel intensity for each image was measured (19). The HyPer ratio for each field of view was calculated by dividing the mean pixel intensity at 488 nm by the mean pixel intensity at 415 nm. The baseline HyPer ratio under these conditions is 0.5, and the maximum ratio for the probe is 0.9.
Immunoblotting for Prx-2 oxidation
Cells were seeded at 3.5 × 10⁵ cells per well in a six-well plate. The wells were treated with 2.5 ml of 10 μM PL, PEITC, or 100 μM of BSO for a period of 10 h. After treatment, the cells were trypsinized, washed once with phosphate-buffered saline (PBS), followed by resuspension in 2 ml of 100 mM MMTS to convert sulfhydryl groups to −S−CH3. to prevent oxidation artifacts (44). The MMTS cell suspension was placed on ice for 20 min, followed by two more PBS washes. The cell pellet was lysed using 100 μl of 1% Triton X-100, spun at 12,000 g for 10 min, and the supernatant cell lysate was collected. To immunoblot for the monomer and dimer form of Prx-2, we ran a nonreducing tris-tricine gel. After transfer, the blot was incubated overnight in the goat anti-Prx2 primary antibody (1:1000 in PBS-blocking buffer-Tween20) at 4°C. The next day, the LI-COR anti-goat secondary antibody IR 688 was added at 1:10,000 dilution and incubated for 1 h. Blots are visualized using an Odyssey CLx Infrared Imaging System (Koch Institute, Cambridge, MA).
Detection of protein-GSH conjugation
By immunofluorescence: HeLa cells seeded at 1.0 × 10⁴ cells/well in a 24-well plate were incubated for 10 h with 10 μM PL, PEITC, or 100 μM of BSO. After incubation, the cells were fixed in plate with 4% paraformaldehyde for 30 min, washed three times with PBS, and followed by permeabilization with 0.5% triton X-100 in PBS (PBS with 0.5% Triton x-100 [PBST]) for 30 min. The cells were then blocked for 30 min in PBST +2% BSA, and then, the primary mouse antibody against glutathione protein conjugates at 1:200 dilution in PBST +2% BSA overnight at 4°C. After three washes with PBST, the secondary anti-mouse FITC antibody was incubated at 1:250 dilution in PBST +2% BSA. The images were acquired using a Nikon x81 epifluorescence microscope at 10% lamp intensity and 200 ms exposure.
By flow cytometry: HeLa and A549 cells seeded at 2 × 10⁵ cells/well in a six-well plate were incubated for 10 h with 10 μM PL, or DMSO control. After incubation, the cells were trypsinized, washed with PBS, and resuspended in 4% paraformaldehyde for 30 min. After fixation and washing, the cells were permeabilized with 0.5% triton X-100 for 30 min, and then blocked with 2% BSA for an hour on a rocker. The cell pellets were resuspended in 100 μl of 1:100 primary mouse antibody and rocked for 2 h at room temperature. After washes, cells were resuspended in a secondary anti-mouse FITC antibody solution (1:100 dilution) and incubated for 30 min on ice. The labeled cells were analyzed using a Becton Dickinson LSR II (Becton Dickinson).
Immunofluorescence quantification of S-glutathionylation
HeLa cells were seeded at 7500 cells/well in a 24-well plate, and then treated for 10 h with 10 μM PL, or DMSO control. After incubation, the cells were fixed on the dish with 4% paraformaldehyde for 30 min, followed by PBS washes. Following fixation, cells were labeled with Cell Tracker Deep Red for 1 h at RT. Cells were permeabilized and protein-free thiols were blocked with 100 mM MMTS. The reduction and detection steps were carried out according to the instructions provided with the S-Glutathionylation Kit from Cayman Chemicals. Eight images were taken per condition (N = 200) using a Nikon x81 epifluorescence microscope with an FITC filter set (biotinylated reduced thiol groups) and a Cy5 filter set (cell tracker label) using 400 ms exposure, 10% lamp intensity. Using a pipeline we built in Cell Profiler (Broad Institute, Cambridge, MA) (4), the Cell Tracker Red images were used to determine the outline of the cells, create a mask that was then superimposed onto the FITC images, and the total pixel intensity per cell was determined.
Statistical analysis
Data for toxicity curves are expressed in mean ±95% confidence interval and compared between different cell types and conditions. Data for all bar graphs are expressed in mean ± standard deviation among separate experiments. The statistical differences between pairs of bar graph groups are analyzed using Student's t-test with p-values <0.05 considered significant. *Indicates p < 0.05 and **indicates p < 0.01. Information about replicate numbers for specific experiments can be found in the legend for each figure.
Footnotes
Acknowledgments
The authors thank Thales Papagiannakopoulos and Rodrigo Romero for their generous gift of the NRF-2 lung tumor cell lines and for sharing their expertise with these cells, Doug Lauffenburger for the use of the Beckman Coulter Vi-Cell Counter, Glen Paradis at the Koch Institute for assistance with flow cytometry, and Kassi Stein for her critical reading of the manuscript. The authors acknowledge support from a National Science Foundation Graduate Research Fellowship (B.K.H.), a Burroughs Wellcome Fund Career Award at the Scientific Interface (H.D.S.), the Joseph R. Mares endowed chair in chemical engineering (H.D.S.), and the National Institutes of Health-National Cancer Institute (P30CCA14051 to the Massachusetts Institute of Technology Flow Cytometry Core Facility).
Author Disclosure Statement
No competing financial interests exist.
Abbreviations Used
References
Supplementary Material
Please find the following supplemental material available below.
For Open Access articles published under a Creative Commons License, all supplemental material carries the same license as the article it is associated with.
For non-Open Access articles published, all supplemental material carries a non-exclusive license, and permission requests for re-use of supplemental material or any part of supplemental material shall be sent directly to the copyright owner as specified in the copyright notice associated with the article.