
Abstract
Introduction
E
In contrast, nuclear erythroid 2-related factor 2 (Nrf2) is an oxidative stress-mediated transcription factor and binds a specific DNA sequence called the antioxidant response element (ARE: 5′-NTGAG/CNNNGC-3′) in the regulatory domain of its target genes to maintain cellular redox homeostasis, leading to the attenuation of liver fibrosis (27). Under basal condition, Nrf2 is negatively regulated by Cul3-Keap1-E3 ligase through ubiquitinating Nrf2 and targeting it for degradation. Under oxidant stress condition, the conformation of Keap1 is altered, losing its ability to bind and ubiquitinate Nrf2. Released Nrf2 translocates to the nucleus and binds the ARE to initiate the antioxidant response (30). However, the precise signaling mechanism underlying oxidative stress in liver fibrosis remains elusive.
We demonstrated for the first time that the NOD-like receptor family pyrin domain containing 3 (NLRP3) inflammasome/IL-1β secretion axis, which is activated by NADPH oxidase (NOX4)-dependent reactive oxygen species (ROS) and inactivated by the nuclear erythroid 2-related factor 2 (Nrf2)/antioxidant response element (ARE) pathway, is required for liver fibrogenesis induced by angiotensin II (Ang II)-mediated ROS. Angiotensin-(1–7) [Ang-(1–7)] inhibits liver fibrosis by suppressing the NLRP3 inflammasome/Smad pathway induced by Ang II-mediated ROS.
There are numerous downstream molecules involved in oxidative stress, among which the NOD-like receptor family pyrin domain containing 3 (NLRP3) inflammasome has been identified as a novel mechanism of liver injury and fibrosis (26). The inflammasome is a cytoplasmic multiprotein complex that recognizes a range of molecules ranging from pathogen-associated molecular pattern molecules to damage-associated molecular pattern molecules, which are involved in infection, tissue injury, and metabolic dysregulation. The NLRP3 inflammasome consists of the NOD-like receptor NLRP3, adaptor molecules such as the apoptosis-associated speck-like protein (ASC), and the effector molecule procaspase-1. NLRP3 inflammasome activation promotes the cleavage and activation of caspase-1, resulting in the maturation of effector proinflammatory cytokines such as pro-IL-1β (25).
The NLRP3 inflammasome/IL-1β secretion axis exists in intrahepatic cells, including hepatic stellate cells (HSCs) (26). IL-1β amplifies chronic liver inflammation and mediates the activation of HSCs (26, 31). Because NOX/mitochondria-induced ROS are closely related to NLRP3 inflammasome activation (26), we hypothesize that NOX/mitochondria-derived ROS activates the NLRP3 inflammasome, leading to hepatic fibrosis. However, the effect of Nrf2-ARE on the NLRP3 inflammasome is controversial (8, 35), and further study is necessary to elucidate the precise mechanism.
The renin–angiotensin system (RAS) is a pivotal regulator of hepatic fibrosis (3). In the classic axis of RAS, angiotensin II (Ang II), which is hydrolyzed by angiotensin-converting enzyme (ACE), is the main effector molecule of RAS and exerts physical effects through its type 1 receptor (AT1R). Studies have suggested that NOX/mitochondria-derived ROS could be induced by Ang II in the process of liver fibrosis (5). Ang II is functionally linked to NOX4 in the liver (20), but the precise relationship between NOX4 and Ang II in HSCs remains elusive. Furthermore, the correlation of Ang II and Nrf2 in liver fibrosis remains unclear. Interestingly, the ACE inhibitor, captopril, showed potent caspase-1 inhibitory ability (12), indicating the potential activation of Ang II in the inflammasome.
The discovery of the ACE homolog, ACE2, adds a new complexity to the RAS. ACE2 degrades Ang II to angiotensin-(1–7) [Ang-(1–7)], which exerts physical effects through its receptor, Mas (23). The alternative ACE2/Ang-(1–7)/Mas axis of the RAS can be viewed as the principal counter-regulatory mechanism for the ACE/Ang II/AT1R axis. ACE2 and Ang-(1–7) have been shown to protect against animal liver fibrosis (13, 14, 19). Oral Ang-(1–7) has been used in laboratories to test its role in preventing hepatic inflammation and has had favorable results (24). This suggests that oral Ang-(1–7) is a promising clinical agent for treating liver fibrosis. However, the precise mechanism by which the ACE2/Ang-(1–7)/Mas axis attenuates liver fibrosis is unclear. To determine if this axis plays a role via the inhibition of ROS-induced activation of the NLRP3 inflammasome, further research is warranted.
We hypothesized that the NLRP3 inflammasome/IL-1β secretion axis, which is activated by NOX4-dependent ROS and inactivated by the Nrf2/ARE pathway, is required for liver fibrogenesis. Ang-(1–7) inhibits liver fibrosis by suppressing Ang II-induced ROS and thus NLRP3 inflammasome activation.
The present study aimed to investigate the differential effects of the two RAS axes on NLRP3 inflammasomes via redox balance regulation in liver fibrosis. We demonstrated that Ang-(1–7) improves liver fibrosis by regulating the redox balance and NLRP3 inflammasome activation.
Results
Increased NOX4 and NLRP3 protein levels in fibrotic human liver
Liver fibrosis in patients was confirmed by hematoxylin and eosin and Masson's trichrome staining (Fig. 1A). Immunohistochemical staining revealed that both NOX4 and NLRP3 protein levels were markedly elevated in fibrotic liver (Fig. 1B). Double staining showed that NOX4 and NLRP3 localized with α-smooth actin (α-SMA)-positive cells, indicating increased NOX4 and NLRP3 protein expression in HSCs in fibrotic human liver (Fig. 1C, D).

Constant infusion with Ang-(1–7) improved liver fibrosis induced by bile duct ligation
To explore the exact mechanism of liver fibrosis, an animal model was established. The mortality rate for the sham group and the bile duct ligation (BDL) plus Ang-(1–7) was 0% (0/9), and for the BDL plus saline group, it was 11.11% (1/9). Other general and liver biochemical parameters showed different changes in three groups (Supplementary Fig. S1; Supplementary Data are available online at

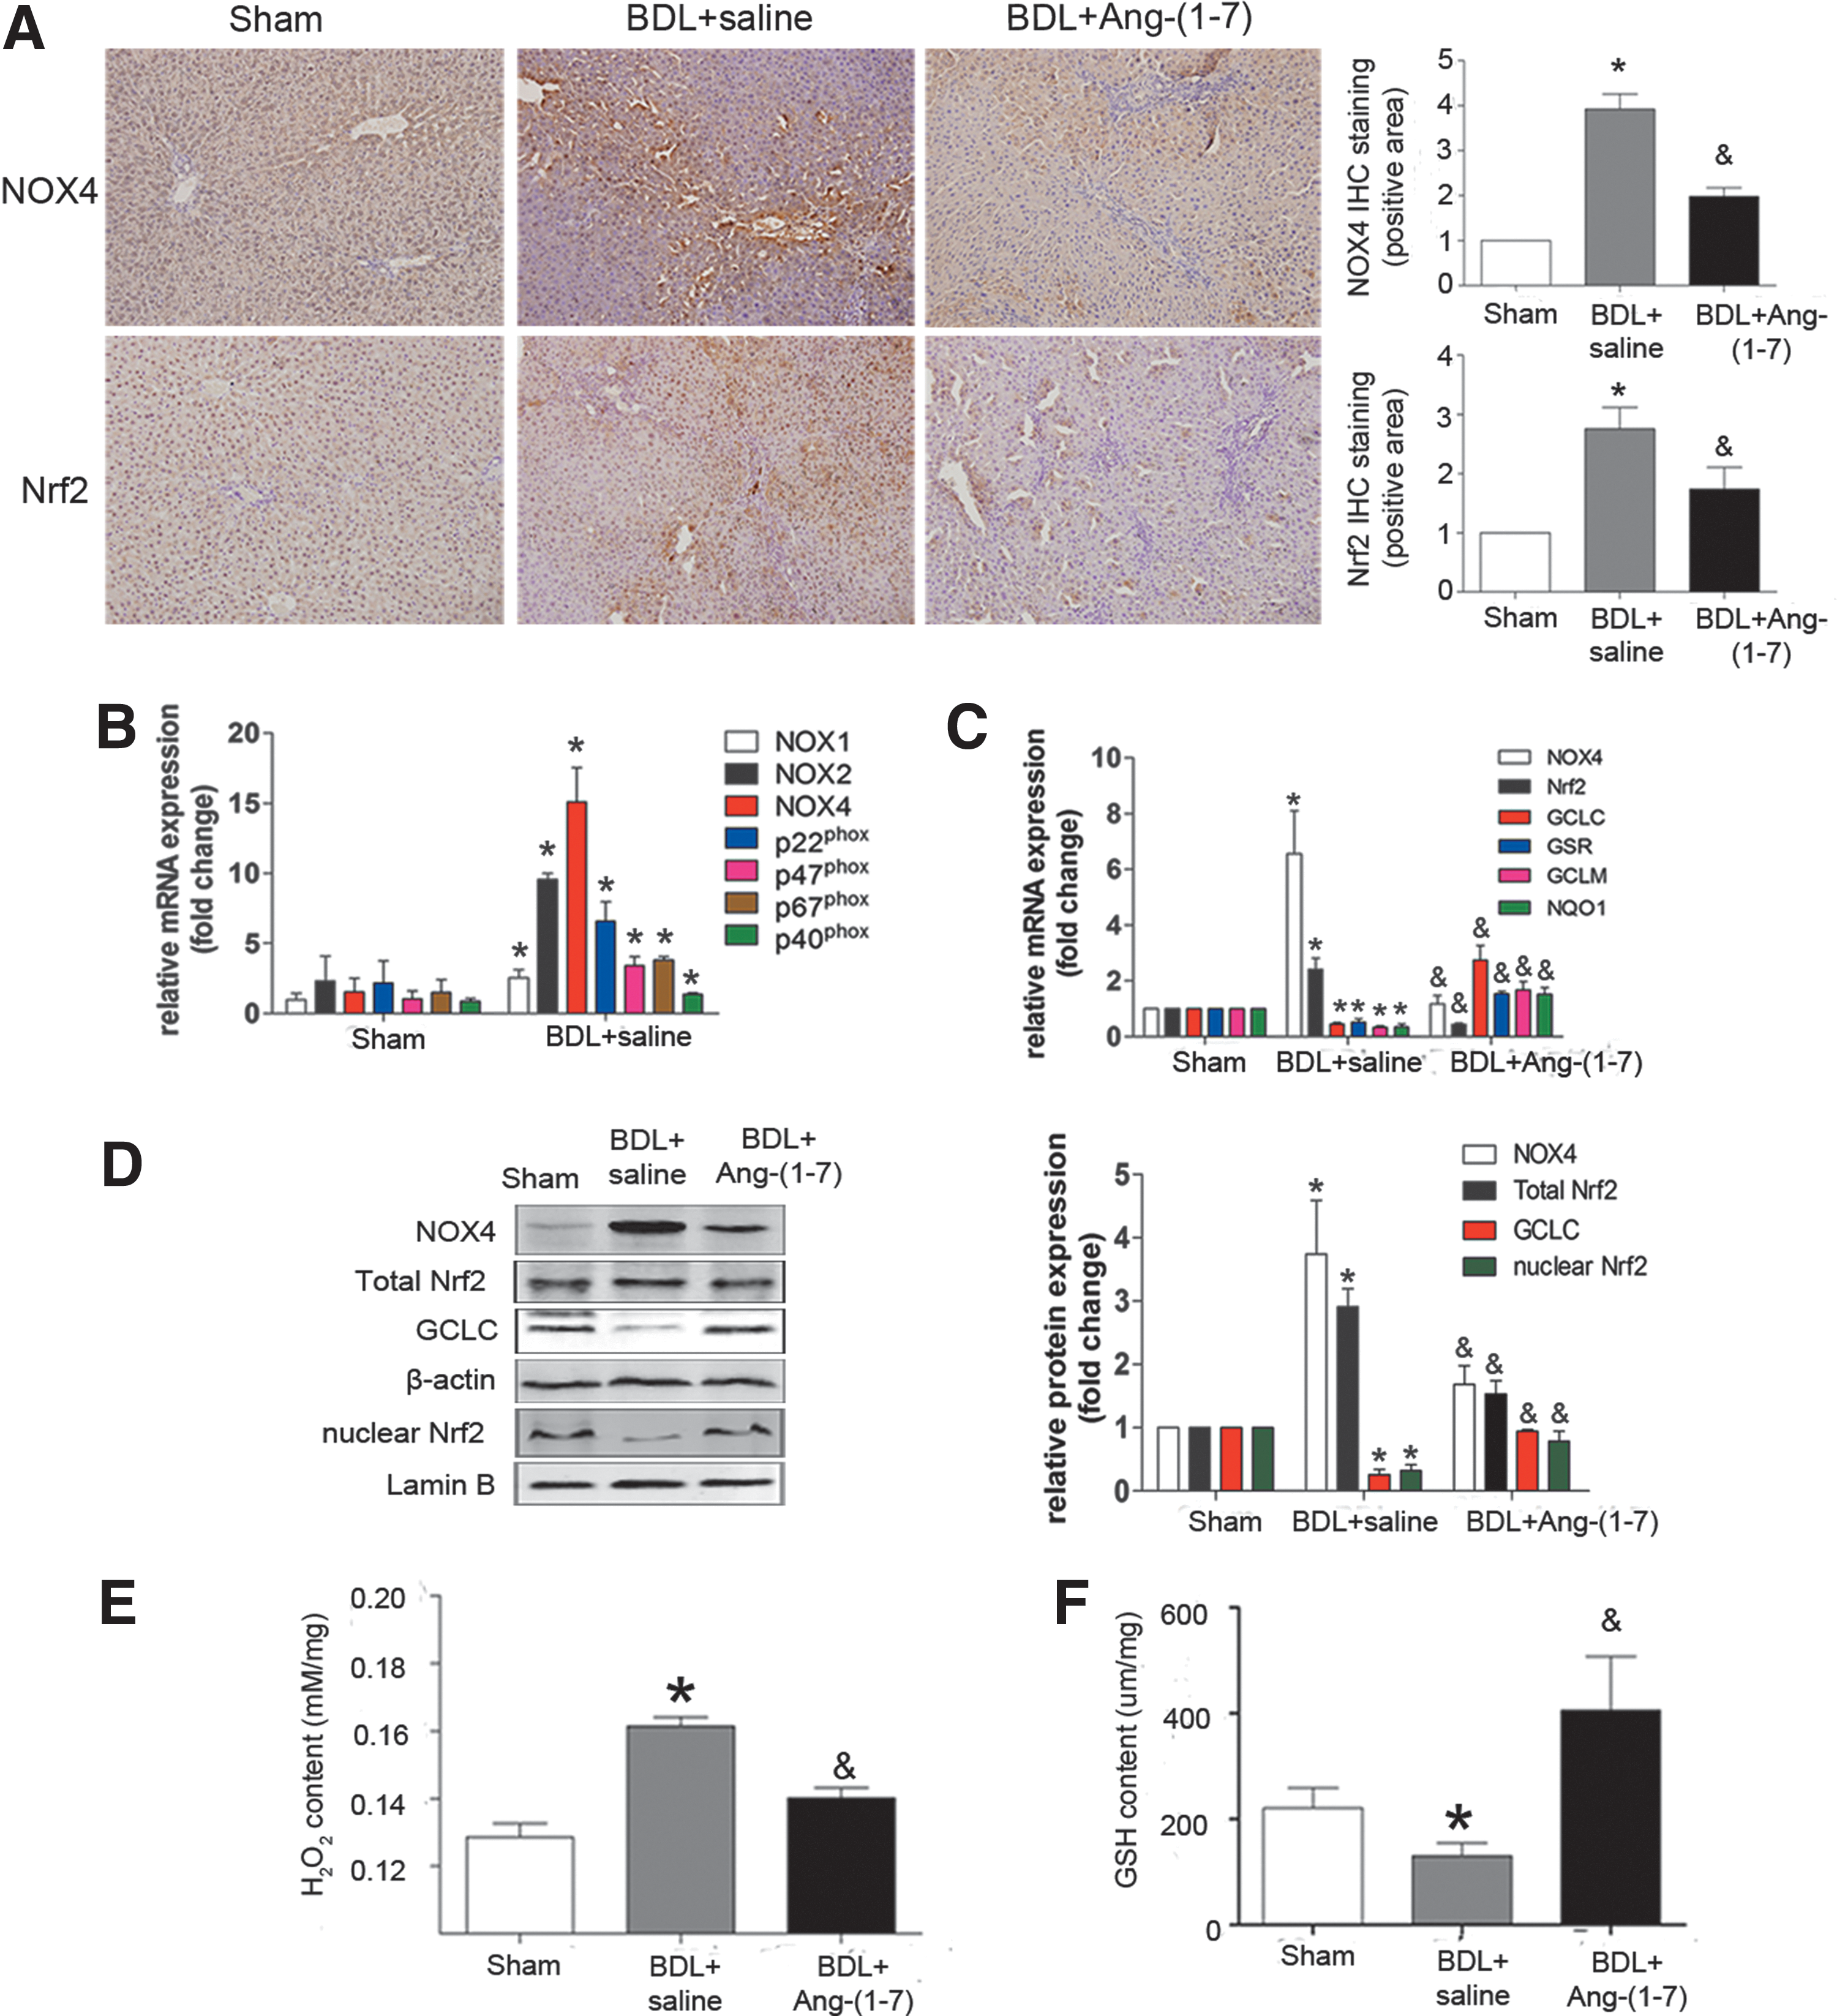
Constant infusion with Ang-(1–7) suppressed oxidative stress by inhibiting NOX4-dependent ROS and activating Nrf2/ARE in BDL-induced liver fibrosis
We found that the messenger RNA (mRNA) and protein levels of NOX isoforms (especially the NOX4) and total Nrf2 were increased in the liver in the BDL plus saline group, which were inhibited by Ang-(1–7) treatment (Fig. 3A–D). As downstream genes of Nrf2, the mRNA levels of GCLC, GSR, GCLM, and NQO1 were decreased in the BDL plus saline group, whereas they were increased in the Ang-(1–7) treatment group (Fig. 3C). The nuclear protein level of Nrf2 decreased in the BDL plus saline group, while it increased in the Ang-(1–7) treatment group (Fig. 3D). Furthermore, the H2O2 content was markedly increased and the glutathione (GSH) content was decreased in the BDL plus saline group, whereas these effects were reversed by Ang-(1–7) treatment (Fig. 3E, F).
Constant infusion with Ang-(1–7) suppressed NLRP3-mediated inflammasome activation in BDL-induced liver fibrosis
The components of the NLRP3 inflammasome/IL-1β secretion axis were markedly upregulated in BDL-induced fibrotic liver. These effects could be inhibited by Ang-(1–7) treatment (Fig. 4A–C).

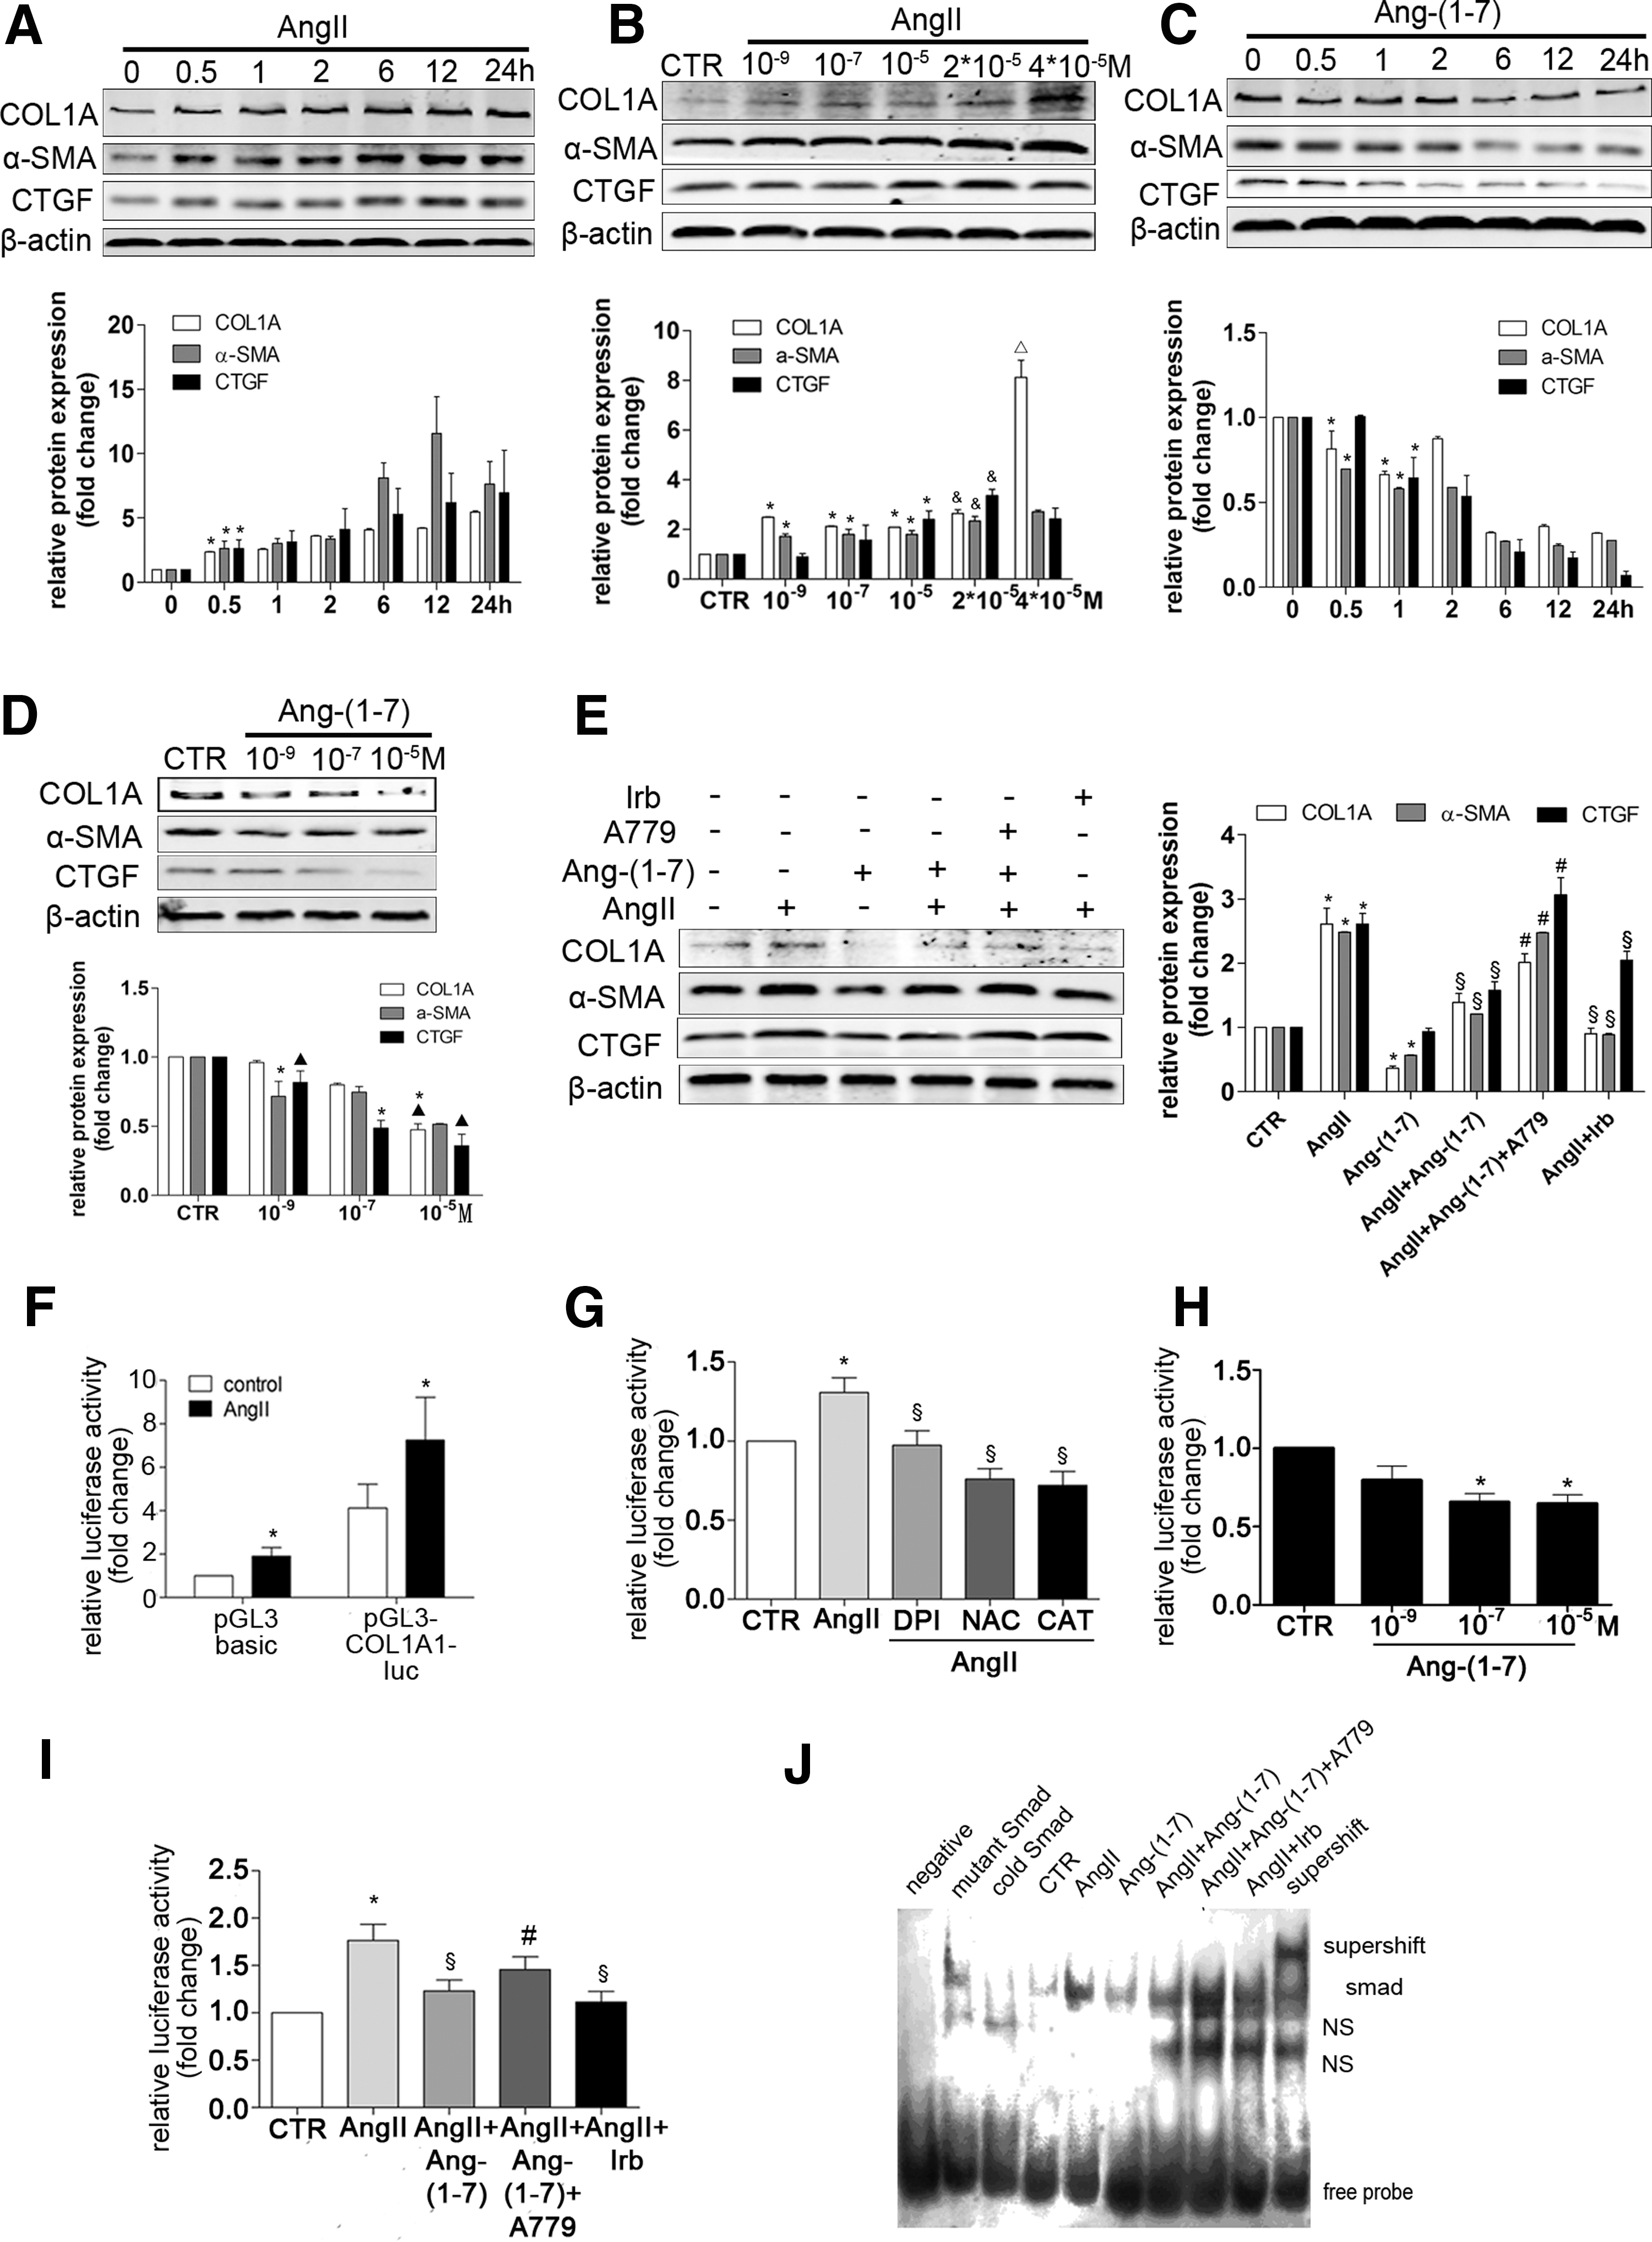
The differential effects of Ang II and Ang-(1–7) on collagen production in HSCs
In vitro, we examined the effects of Ang II and Ang-(1–7) on collagen production in rat HSCs. Protein levels of CTGF, α-SMA, and COL1A were elevated by Ang II treatment, whereas they were reduced by Ang-(1–7) treatment (Fig. 5A–D). Pretreatment with Ang-(1–7) inhibited the effects of Ang II (Fig. 5E). A dual-luciferase reporter assay showed that antioxidants markedly reduced Ang II-induced collagen I promoter activity (Fig. 5F, G), indicating that intracellular ROS contributes to Ang II-induced collagen promoter activity. Ang-(1–7) treatment reduced collagen I promoter activity in a dose-dependent manner (Fig. 5H). Ang II-induced collagen I promoter activity was reduced by Ang-(1–7) treatment (Fig. 5I). Electrophoretic mobility shift assay further confirmed that Ang II-induced Smad DNA binding activity could be inhibited by Ang-(1–7) (Fig. 5J).
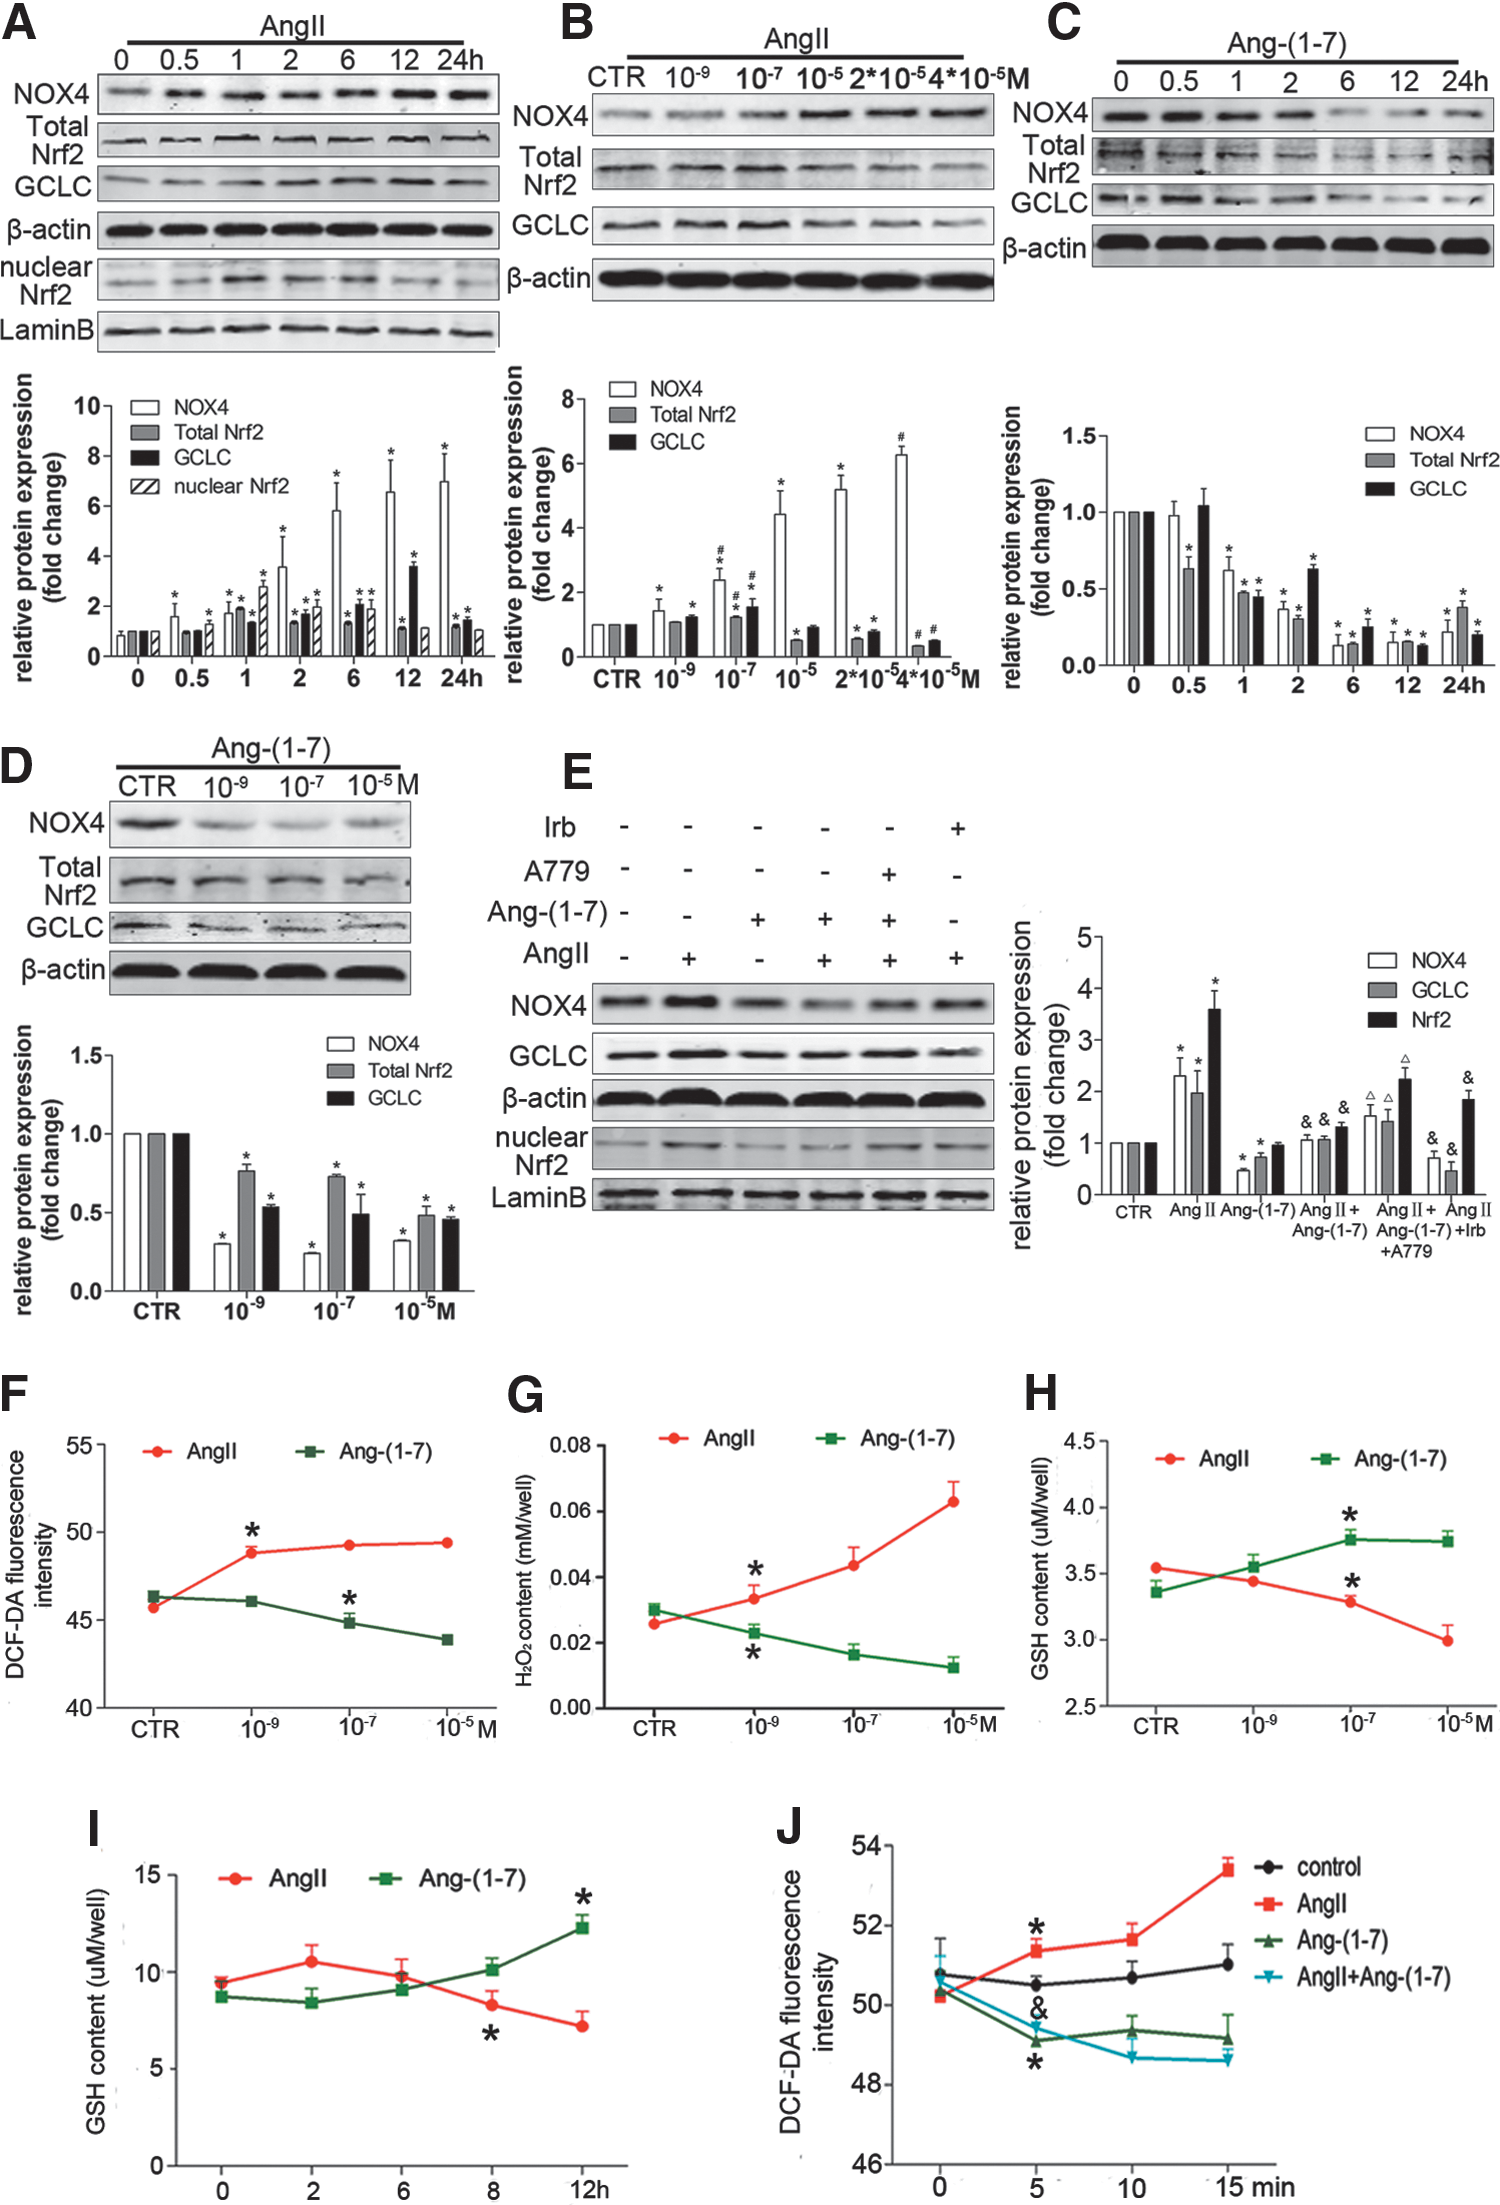
The differential effects of Ang II and Ang-(1–7) on NOX4 or Nrf2/ARE-mediated redox balance in HSCs
Consistent with the results in vivo, NOX4 protein expression was elevated by Ang II treatment in HSCs. The nuclear protein level of Nrf2 increased and reached a peak at 1 h after exposure to Ang II. The protein levels of total Nrf2 and GCLC were elevated by a lower dose of Ang II, but reduced by a higher dose of Ang II (Fig. 6A, B). ARE mRNA expression was also inhibited by a higher dose of Ang II (Supplementary Fig. S2A–F). In contrast, Ang-(1–7) treatment reduced the protein levels of NOX4, total Nrf2, and GCLC (Fig. 6C, D). Pretreatment with Ang-(1–7) reversed the effects of Ang II (Fig. 6E). Similarly, Ang II treatment increased intracellular ROS and H2O2 production (Fig. 6F, G), but reduced the GSH content (Fig. 6H, I). In contrast, Ang-(1–7) alone showed opposite effects to those of Ang II treatment (Fig. 6F–I). Moreover, Ang II-induced intracellular ROS were suppressed by Ang-(1–7) treatment (Fig. 6J).
Ang II treatment mildly impairs mitochondrial homeostasis in HSCs
We further assessed the effects of Ang II and Ang-(1–7) on mitochondrial ROS (mito-ROS). mito-ROS was mildly increased by Ang II treatment (Supplementary Fig. S3A, B). Furthermore, Ang II-induced mito-ROS was inhibited by NOX4 small interference RNA (siRNA), suggesting cross talk between Ang II-induced NOX4 and mito-ROS generation (Supplementary Fig. S3C). In addition, Ang II induced reduction of ATP (Supplementary Fig. S3D). Finally, we analyzed the functional mitochondrial pool through use of MitoTracker Deep Red and MitoTracker Green. Treatment with Ang II and Ang-(1–7) had no significant influence on the percentage of intact mitochondria (positive for MitoTracker Deep Red and MitoTracker Green) (Supplementary Fig. S3E). Therefore, Ang II treatment mildly impairs mitochondrial homeostasis in HSCs.
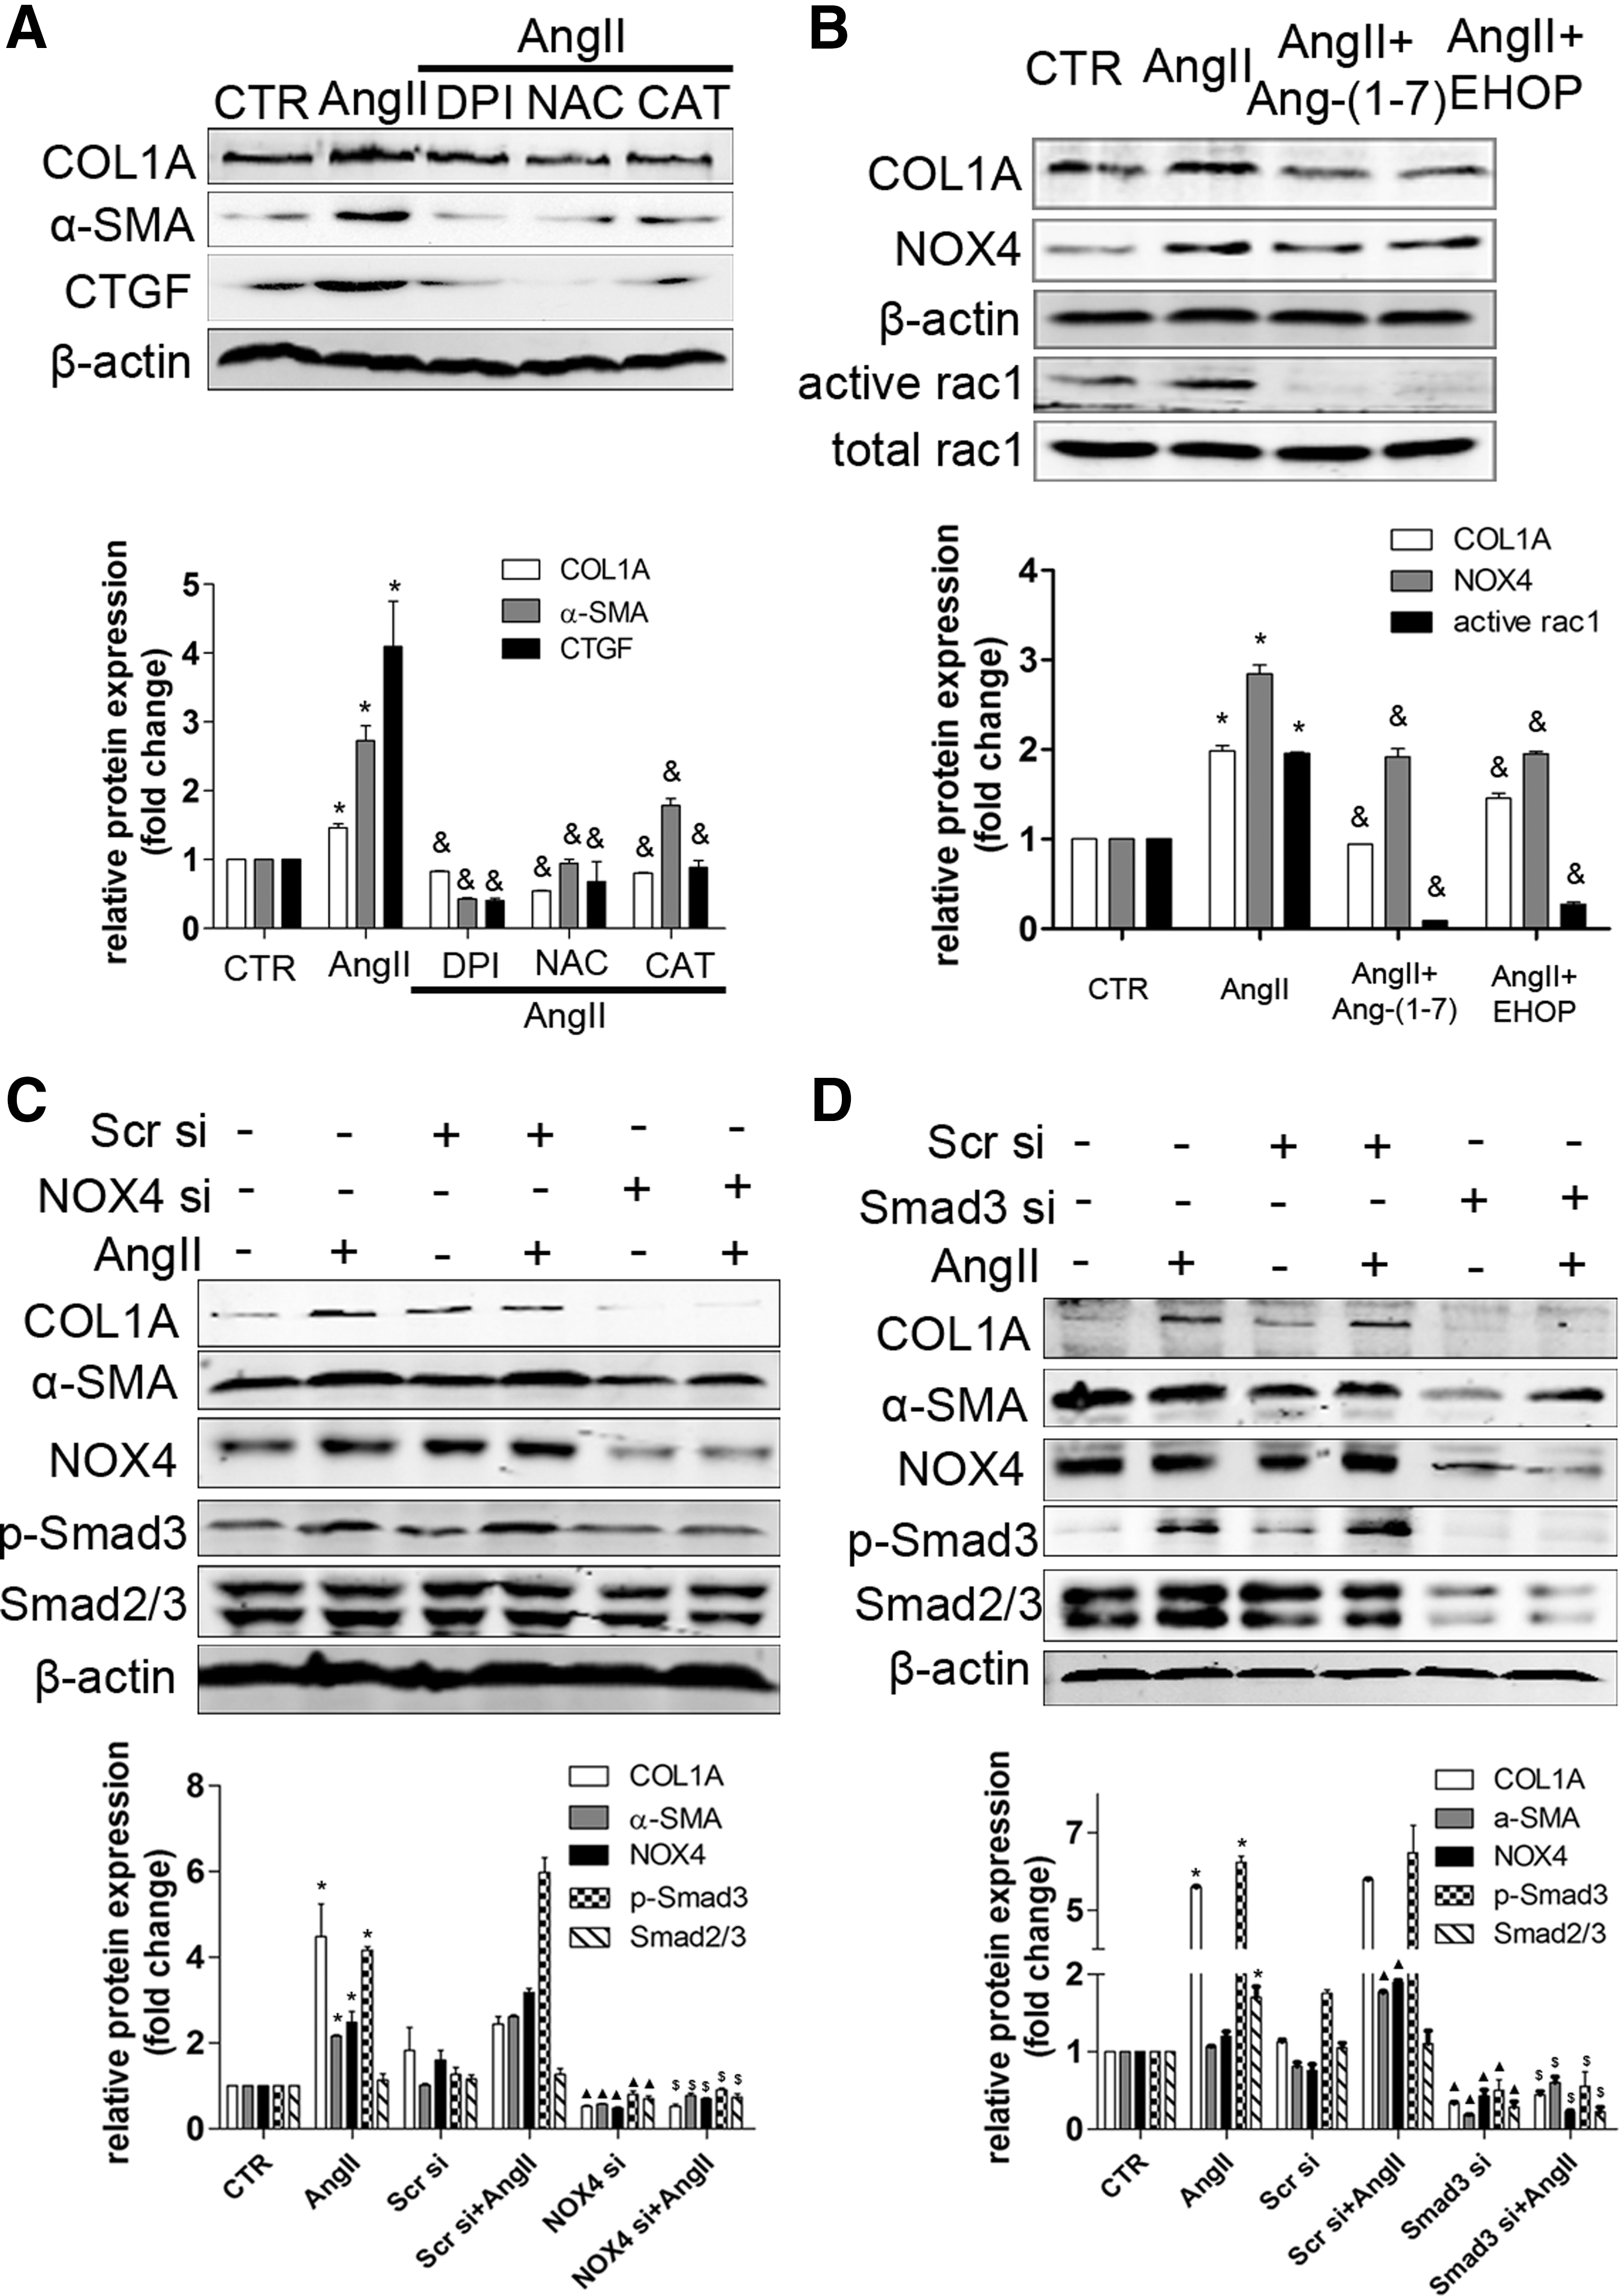
The effects of Ang II on collagen production were dependent on NOX4-derived ROS in HSCs
We found that pretreatment with NADPH-oxidase inhibitor DPI, superoxide inhibitor NAC, or H2O2 scavenger CAT suppressed the increase of CTGF, α-SMA, and COL1A induced by Ang II (Fig. 7A). Similarly, Ang II-induced protein expression of Smad2/3, p-Smad3, α-SMA, and COL1A was inhibited after NOX4 depletion by NOX4 siRNA, indicating that Ang II-induced collagen production was dependent on NOX4-derived ROS in HSCs (Fig. 7C). Rac1, a pivotal cytosolic subunit for activating NOX isoform, was elevated by Ang II treatment. Moreover, Ang II-induced NOX4 and COL1A protein could be inhibited by Ang-(1–7) and the Rac1 inhibitor, Ehop (Fig. 7B). Hence, Rac1 plays an important role in Ang II-induced NOX4 and COL1A expression. Interestingly, Smad3 depletion also inhibited NOX4 protein expression, suggesting feedback between NOX4 and Smad3 (Fig. 7D).
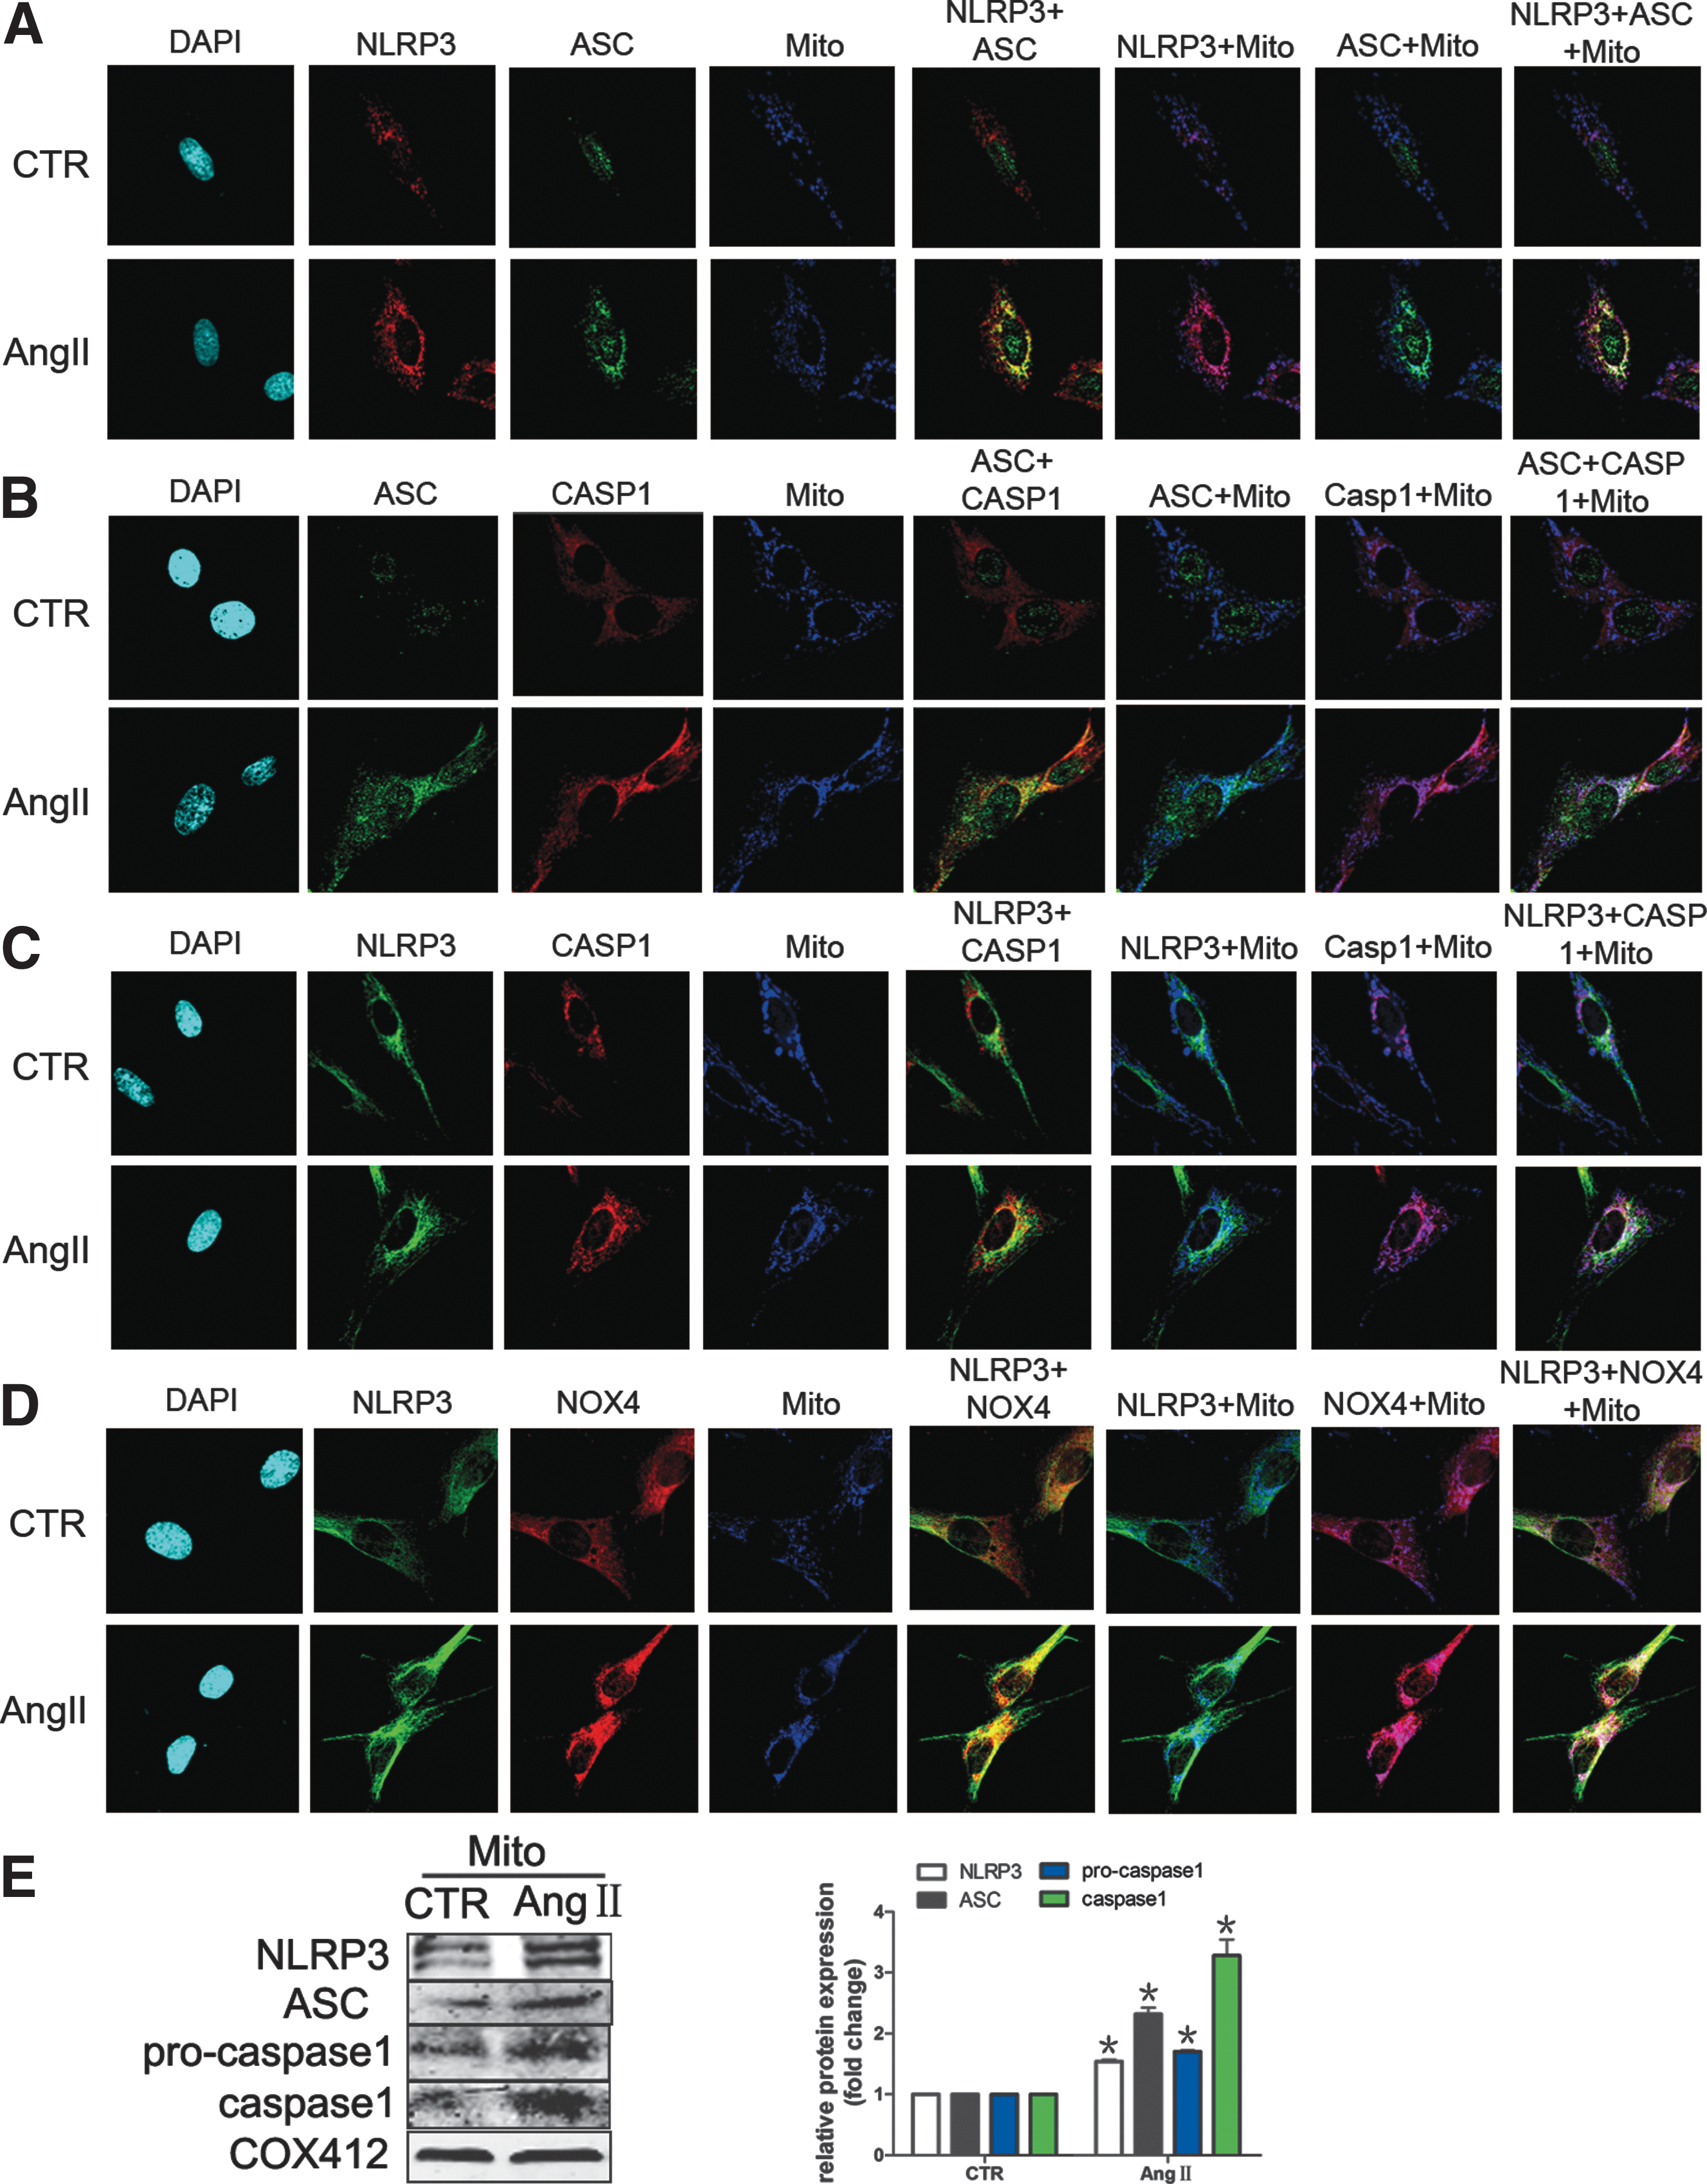
NLRP3 inflammasome complex assembling in mitochondria was induced by Ang II
Since NLRP3 inflammasome plays a key role in liver fibrosis, we investigated the effect of NLRP3 inflammasome on Ang II-induced liver fibrosis. Triple immunofluorescence staining showed that Ang II-induced ASC translocated from the nucleus into the cytoplasm and colocalized with NLRP3 or caspase-1. Interestingly, the complex colocalized in mitochondria, suggesting that the NLRP3 inflammasome complex assembles in mitochondria. Moreover, Ang II-induced colocalization of NOX4 and NLRP3 in mitochondria indicated a close connection between them in mitochondria (Fig. 8A–D). In addition, we found that the protein levels of NLRP3 inflammasome complex were increased in mitochondria in HSCs (Fig. 8E).
The effects of Ang II and Ang-(1–7) on the NLRP3 inflammasome/Smad pathway in HSCs
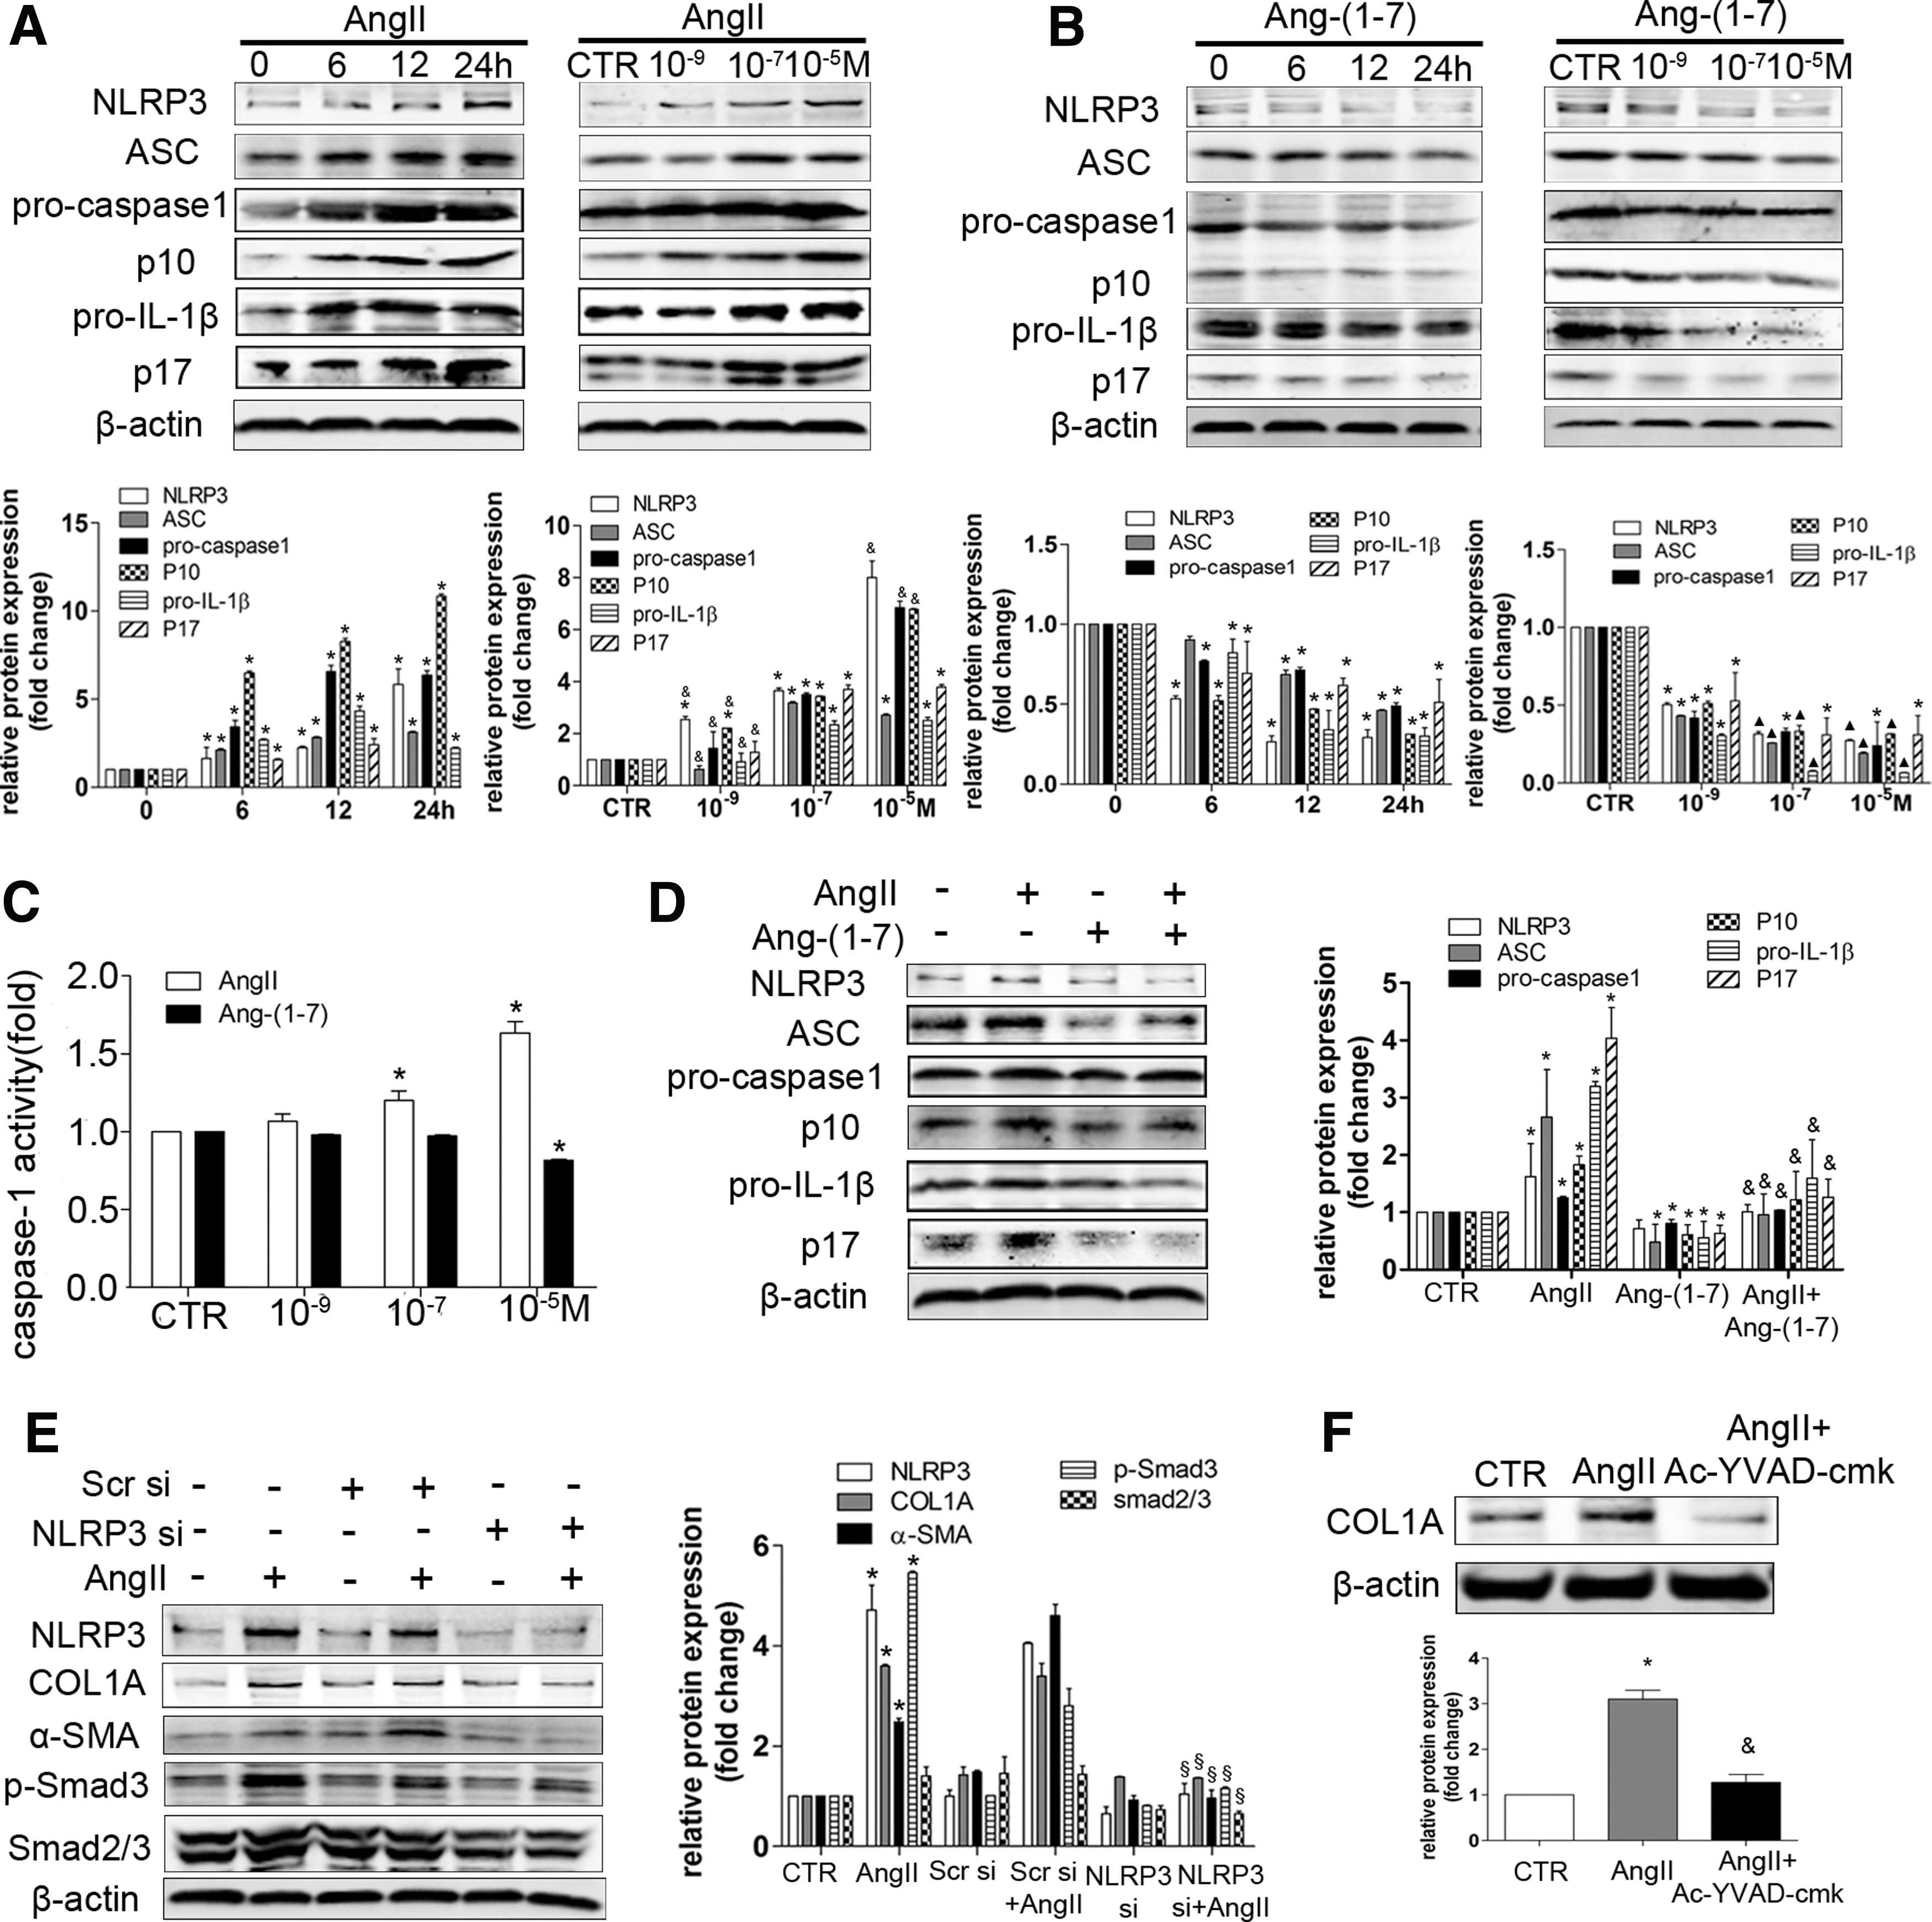
Ang II treatment elevated the protein levels of the NLRP3 inflammasome/IL-1β secretion axis components and caspase-1 activity, while Ang-(1–7) alone exerts the opposite effects (Fig. 9A–C). Furthermore, Ang-(1–7) treatment inhibited the effects of Ang II (Fig. 9D). Moreover, we found that NLRP3 siRNA significantly inhibited the Ang II-induced Smad pathway and collagen production, implicating NLRP3 as a key molecule involved in HSC activation and collagen synthesis (Fig. 9E). Ac-YVAD-cmk, a selective irreversible inhibitor of caspase-1, inhibited collagen production induced by Ang II (Fig. 9F), further confirming the role of the NLRP3 inflammasome in collagen generation.
Ang II and Ang-(1–7) regulate the NLRP3/IL-1β secretion axis through the TLR4/MyD88/NF-κB pathway in HSCs
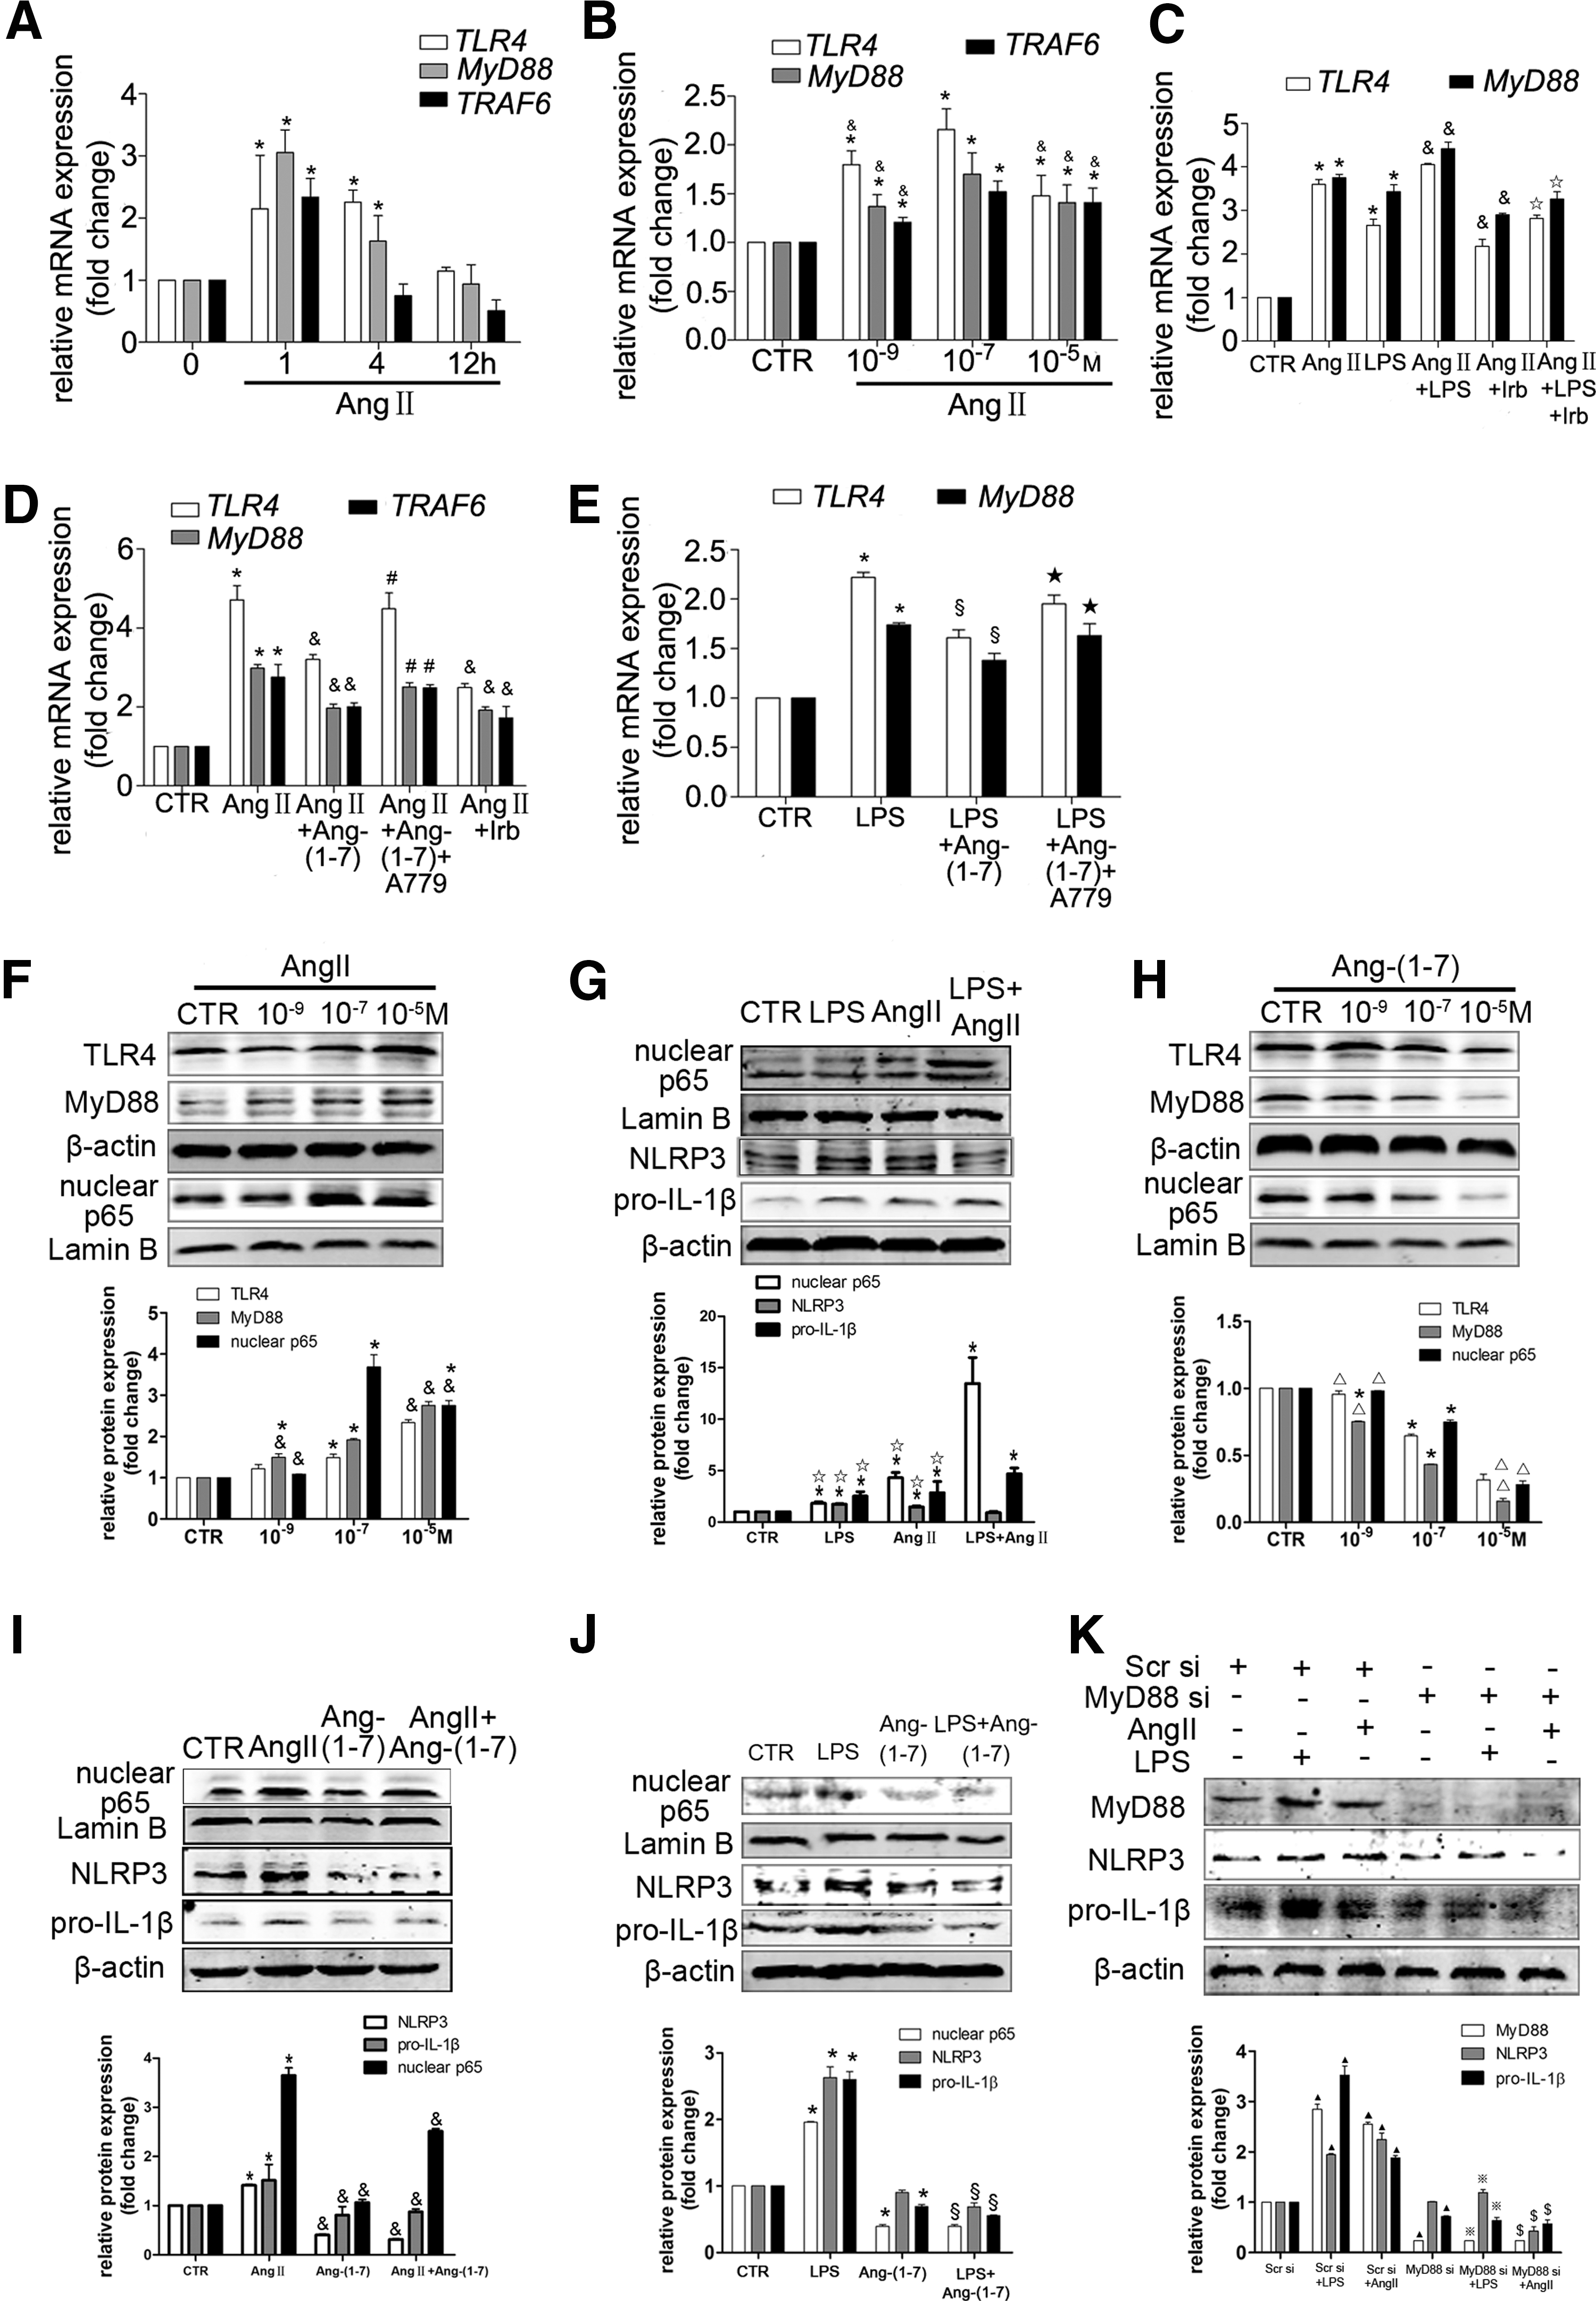
Because priming with the Toll-like receptor 4 (TLR4) ligand LPS is the first signal of the NLRP3 inflammasome, we determined the effects of Ang II and Ang-(1–7) on the TLR4/MyD88/NF-κB pathway (signal 1). We found that the mRNA and protein levels of signal 1 were increased by Ang II or LPS stimulating in HSCs (Fig. 10A–C, F, G). Ang II promoted the LPS-induced signal 1, whereas Ang II inhibited the LPS-induced protein expression of NLRP3 (Fig. 10G). Additionally, signal 1 was inhibited by Ang-(1–7) (Fig. 10H), and Ang-(1–7) inhibited Ang II and the LPS-induced signal 1 and NLRP3 protein expression (Fig. 10D, E, I, J). Therefore, Ang-(1–7) inhibited Ang II or the LPS-induced NLRP3/IL-1β secretion axis by blocking signal 1 in HSCs. MyD88 siRNA markedly inhibited Ang II or LPS-induced NLRP3 and pro-IL-1βprotein expression (Fig. 10K).
Interestingly, treatment with recombinant rat IL-1β showed synergistic effects on Ang II-induced TRL4, MyD88, and COL1A protein levels, whereas it did not affect the protein levels of NLRP3, procaspase-1, caspase-1 p10, pro-IL-1β, and IL-1β p17, indicating that exogenous IL-1β did not increase collagen production through NLRP3 inflammasome activation in HSCs (Supplementary Fig. S4).
The effects of the NOX4 or Nrf2/ARE-mediated redox balance on NLRP3 inflammasome activation in HSCs
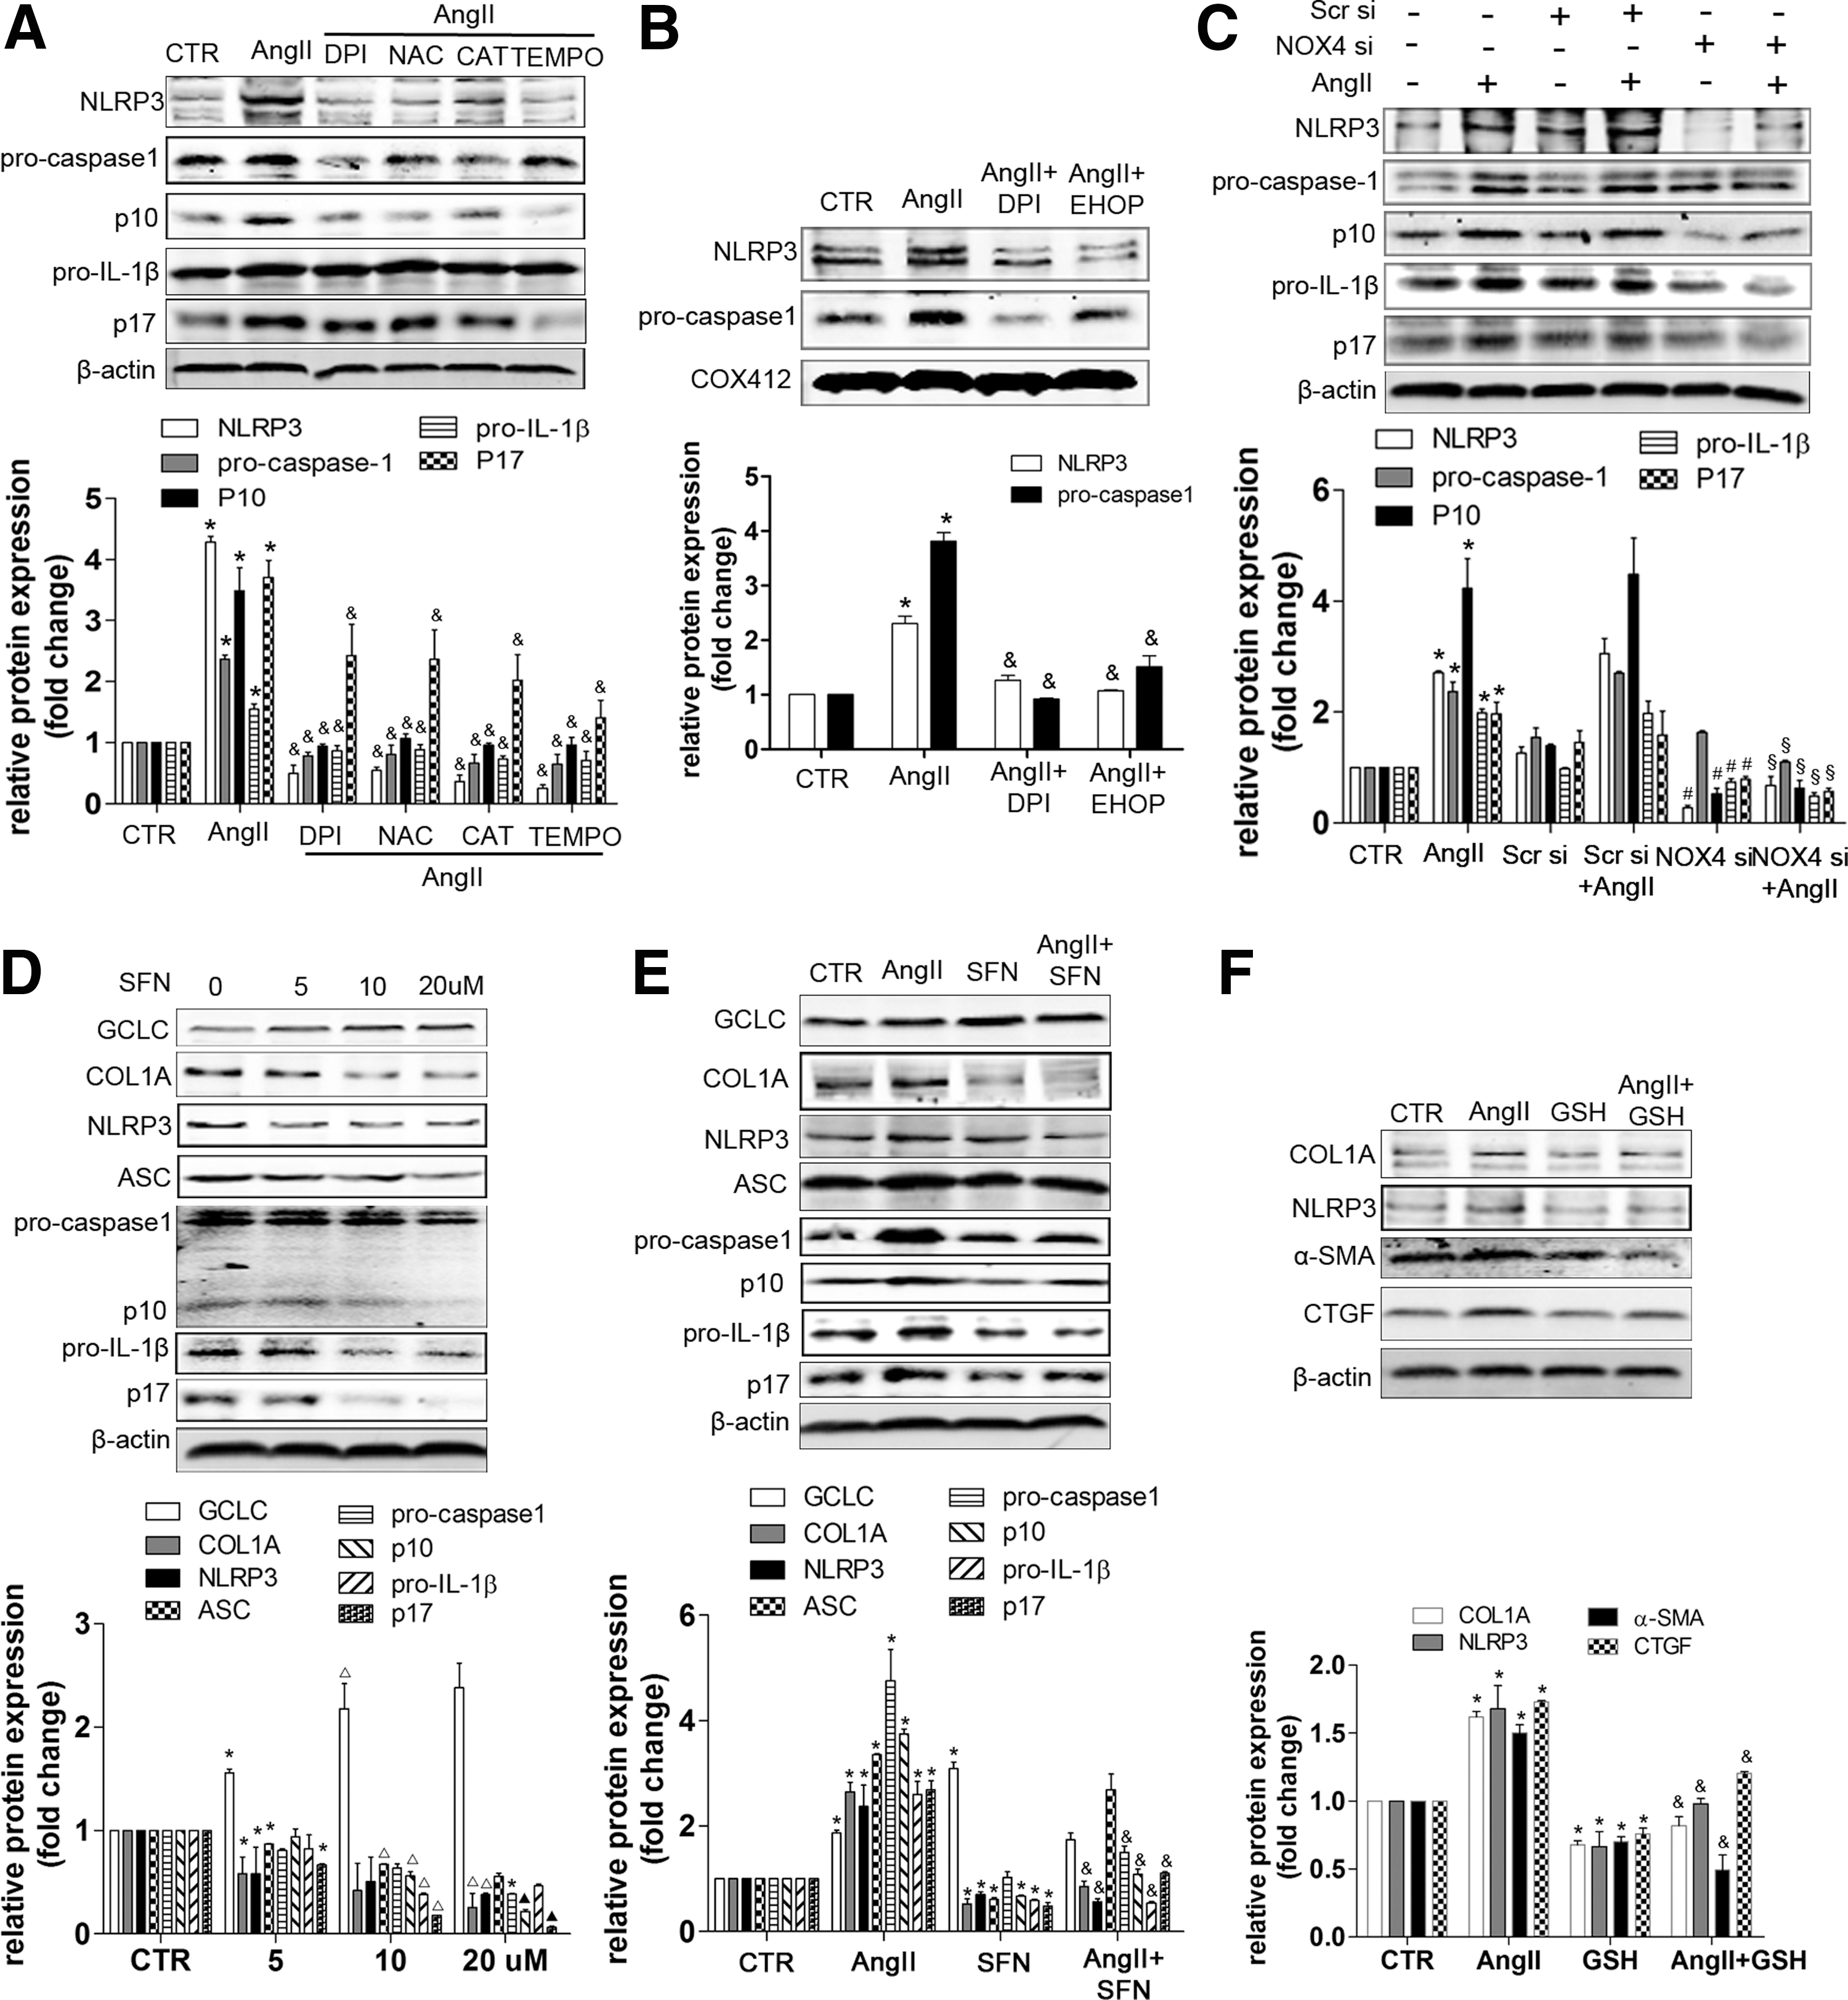
Finally, we evaluated the effect of redox balance regulation on NLRP3 inflammasome activation. Treatment with antioxidants, such as DPI, NAC, catalase, and TEMPO, inhibited the NLRP3 inflammasome/IL-1β secretion axis induced by Ang II (Fig. 11A). Mitochondrial protein levels of NLRP3 and procaspase-1 were elevated by Ang II treatment, but were reduced by DPI and Ehop (Fig. 11B). Furthermore, NOX4 siRNA also inhibited the protein expression of the NLRP3 inflammasome complex induced by Ang II (Fig. 11C), suggesting an important role for NOX4-derived ROS on NLRP3 inflammasome activation in HSCs. Additionally, SFN, an Nrf2 activator, and GSH inhibited Ang II-induced NLRP3 inflammasome activation and collagen generation (Fig. 11D–F), indicating protective effects of Nrf2/ARE against Ang II-induced NLRP3 inflammasome activation and collagen secretion in HSCs.
Discussion
In this study, for the first time, NLRP3 inflammasome activation regulated by the NOX4 and Nrf2-mediated redox balance was shown to play an essential role in liver fibrosis. The principal findings obtained include the following: (i) Ang II increased collagen production in HSCs by regulating the redox balance, (ii) Ang II upregulated the NLRP3 inflammasome/IL-1β secretion axis by activating the TLR4/Myd88/NF-κB pathway, (iii) the NLRP3 inflammasome was activated by Ang II-induced NOX4/mito-ROS, but was inhibited by Nrf2/ARE, and (iv) Ang-(1–7) improved liver fibrosis by regulating the redox balance and NLRP3 inflammasome activation.
NOX4 is a constitutively active enzyme that predominantly generates H2O2, which is regulated primarily at the level of gene expression (4). Until now, little was known regarding the role of nonphagocytic NOX4 in liver fibrosis. Recently, Jiang et al. reported that NOX4 is a key element in HSC activation (11). We found that NOX4 mRNA was the most highly induced among the NOX isoforms in fibrotic liver, suggesting the constitutive activity of NOX4. Unlike other NOX isoforms, NOX4 does not require cytosolic subunits that are essential for other NOX isoforms (1). However, we found that Ang II treatment increased the active Rac1 protein level, and the Rac1 inhibitor Ehop significantly reduced Ang II-induced protein levels of NOX4 and COL1A. Therefore, Rac1 participates in the regulation of NOX4. These data are consistent with Wu et al.'s report that Rac1 regulates NOX4 function in endothelial cells (34).
Ang II, the key pro-oxidative effector of the RAS, was shown to induce NOX4-dependent ROS in liver fibrosis (20), but the precise mechanism remains unclear. Our study confirmed that Ang II-induced NOX4-derived ROS play a critical role in HSC activation and collagen generation. As another source of cellular ROS, mitochondrial dysfunction was reported to play a role in chronic liver diseases (18). However, the effect of Ang II on mitochondrial dysfunction in HSCs remains unclear. We found that Ang II treatment merely induced a mild increase of mito-ROS as well as the reduction of ATP and depolarization of the mitochondrial membrane potential, suggesting mild mitochondrial dysfunction in HSCs. Recently, more and more studies focused on the cross talk between NOX4 and mitochondria. Dikalov et al. reported that Nox-2 induced production of mitochondrial superoxide in Ang II-mediated endothelial oxidative stress (6). Similarly, we found that NOX4 depletion inhibited mito-ROS induced by Ang II in HSCs. Moreover, Ang II induced NOX4 translocation into mitochondria.
Nrf2-ARE activates cellular rescue pathways against oxidative injury, such as liver fibrosis (27). However, the means by which Ang II regulates Nrf2-ARE in HSCs remains unclear. We found that Nrf2-AREs were upregulated by a low dose of Ang II, but were inhibited by a high dose of Ang II. Furthermore, the Nrf2 activator, SFN, attenuated Ang II-induced collagen synthesis in vitro.
The NLRP3 inflammasome, which can be activated by ROS, has been identified as a novel mechanism for liver injury and fibrosis (10, 26, 33). Chronic liver inflammation, which is amplified by IL-1, leads to hepatic fibrosis. The IL-1 receptor antagonist (15) or an IL-1R deficiency (10) attenuates liver fibrosis. HSCs possess the NLRP3 inflammasome/IL-1β secretion axis, and depletion of either NLRP3 or ASC results in the alleviation of liver fibrosis (31). In contrast, a recent report showed that myeloid-specific NLRP3 activation causes severe liver inflammation and HSC activation with collagen deposition in the liver (33).
Therefore, the NLRP3 inflammasome/IL-1β secretion axis is a promising therapeutic target for the prevention and treatment of liver fibrosis. Our report is the first to demonstrate that NLRP3 depletion inhibits the Smad pathway and collagen production induced by Ang II, which confirms that the NLRP3 inflammasome is required for Ang II-induced HSC activation and liver fibrosis.
We focused on two signal pathways of the NLRP3 inflammasome. NF-κB activation is the first signaling step. The TLRs/MyD88/NF-κB pathway (signal 1) has been suggested to upregulate NLRP3 as well as pro-IL-1β (26, 37). A broad variety of activators compose the second signal, among which oxidative stress acts as a key secondary signal (signal 2) in NLRP3 activation (26).
Signal 1 can be triggered by TLR activation, which leads to the synthesis of pro-IL-1β. Stimuli activate TLR4 at the cell surface and trigger NF-κB activation through the adaptor protein, MyD88. NF-κB target genes include proinflammatory cytokines such as members of the IL family (16). We first confirmed the activation of signal 1 induced by Ang II in HSCs. There is a synergistic effect of Ang II on the LPS priming signal 1 in HSCs.
Furthermore, we observed a synergistic effect of recombinant rat IL-1β on Ang II-induced signal 1 and collagen production. Interestingly, the recombinant rat IL-1β did not affect the components of the NLRP3 inflammasome complex induced by Ang II. We propose that IL-1β increases collagen production through other collagen-inducing pathways regulated by signal 1 instead of the NLRP3 inflammasome/IL-1β secretion axis in HSCs.
As for signal 2, ROS are the most crucial molecules that direct NLRP3 inflammasome activation (36). Our findings showed that Ang II induced the assembly of the NLRP3-ASC-caspase-1 complex in mitochondria. DPI, NAC, or NOX4 depletion reduced the expression of Ang II-induced NLRP3 inflammasome components, indicating that NOX4-dependent ROS is required for Ang II-induced NLRP3 inflammasome activation. Moreover, TEMPO, a mito-ROS scavenger, also inhibited the Ang II-induced NLRP3 inflammasome complex, suggesting mito-ROS participate in the inflammatory response by modulation of NLRP3 inflammasome, which elucidate the results of Weidinger et al. (32). Ang II induced a mild increase in mito-ROS levels, while there was a marked increase of H2O2. Therefore, Ang II-induced NOX4-derived ROS seem to be the main activators of the NLRP3 inflammasome in HSCs.
Interestingly, the mitochondrial protein levels of NLRP3 and procaspase-1 were elevated by Ang II, but were reduced by DPI and Ehop (Rac1 inhibitor), suggesting that Rac1 and NOX participate in the regulation of the NLRP3 inflammasome in mitochondria. Additionally, we observed an Ang II-induced colocalization of NOX4 and NLRP3 in mitochondria, indicating a possible role of NOX4 in the NLRP3 inflammasome complex assembly process in mitochondria. The interactions of molecules during the activation of the NLRP3 inflammasome in mitochondria require further investigation.
In contrast to our findings, studies on chronic granulomatous disease, an inherited NOX disorder in which phagocytes are defective in generating superoxide anion, have indicated that NOX is not essential for NLRP3 inflammasome activation (29) and DPI did not inhibit the generation of active caspase-1. As Jurg Tschopp (28) implied, ROS are necessary, but not sufficient, for NLRP3 inflammasome activation.
We further determined the role of Nrf2/ARE in NLRP3 inflammasome activation. Consistent with a recent report (35), we confirmed the inhibitory effects of SFN, an activator of Nrf2, and GSH on Ang II-induced NLRP3 inflammasome activation in HSCs. However, there are opposing opinions on this issue. Freigang et al. (8) identified Nrf2 as a novel positive regulator of the inflammasome, and Nrf2 signaling aggravates atherosclerosis by enhancing IL-1-mediated vascular inflammation. Rubartelli et al. suggested that both ROS and an antioxidant system are required for inflammasome activation (21). The diverse properties of different cell types might play a role in causing these opposing results.
Finally, we must consider the effects of the Ang-(1–7) on the redox balance and the NLRP3 inflammasome. In vivo, exogenous Ang-(1–7) infusion significantly inhibited oxidative stress and activated the Nrf2/ARE pathway, leading to the attenuation of liver fibrosis. In vitro, Ang-(1–7) inhibited Ang II-induced NOX4-derived ROS and mitochondrial dysfunction. In contrast to the dual effects of Ang II on Nrf2/ARE, Ang-(1–7) alone inhibited Nrf2/ARE, which seems to be associated with the reduction of intracellular ROS (an activator of Nrf2/ARE) induced by Ang-(1–7). The complicated internal environment and intercellular interaction in the in vivo cellular network may account for the opposing effects of Ang-(1–7) and Ang II on Nrf2/ARE in vivo.
For the first time, we showed that Ang-(1–7) infusion inhibits the NLRP3 inflammasome activity in liver fibrosis. Interestingly, Ang-(1–7) modulates two signals of NLRP3 inflammasome: Ang-(1–7) inhibits the signal 1 activation induced by LPS or Ang II. Furthermore, Ang-(1–7) blocks signal 2 by reducing Ang II-induced ROS. Finally, we confirmed that Ang-(1–7) inhibits Ang II-induced Smad DNA binding activity and collagen I promoter activity in HSCs.
There are some limitations to the present study. Although this study could be relevant to clinical therapy for liver fibrosis, the effects of Ang-(1–7) on liver fibrosis were not evaluated in patients suffering from this condition. Future studies will focus on the role of Ang-(1–7) in the treatment of liver fibrosis patients.
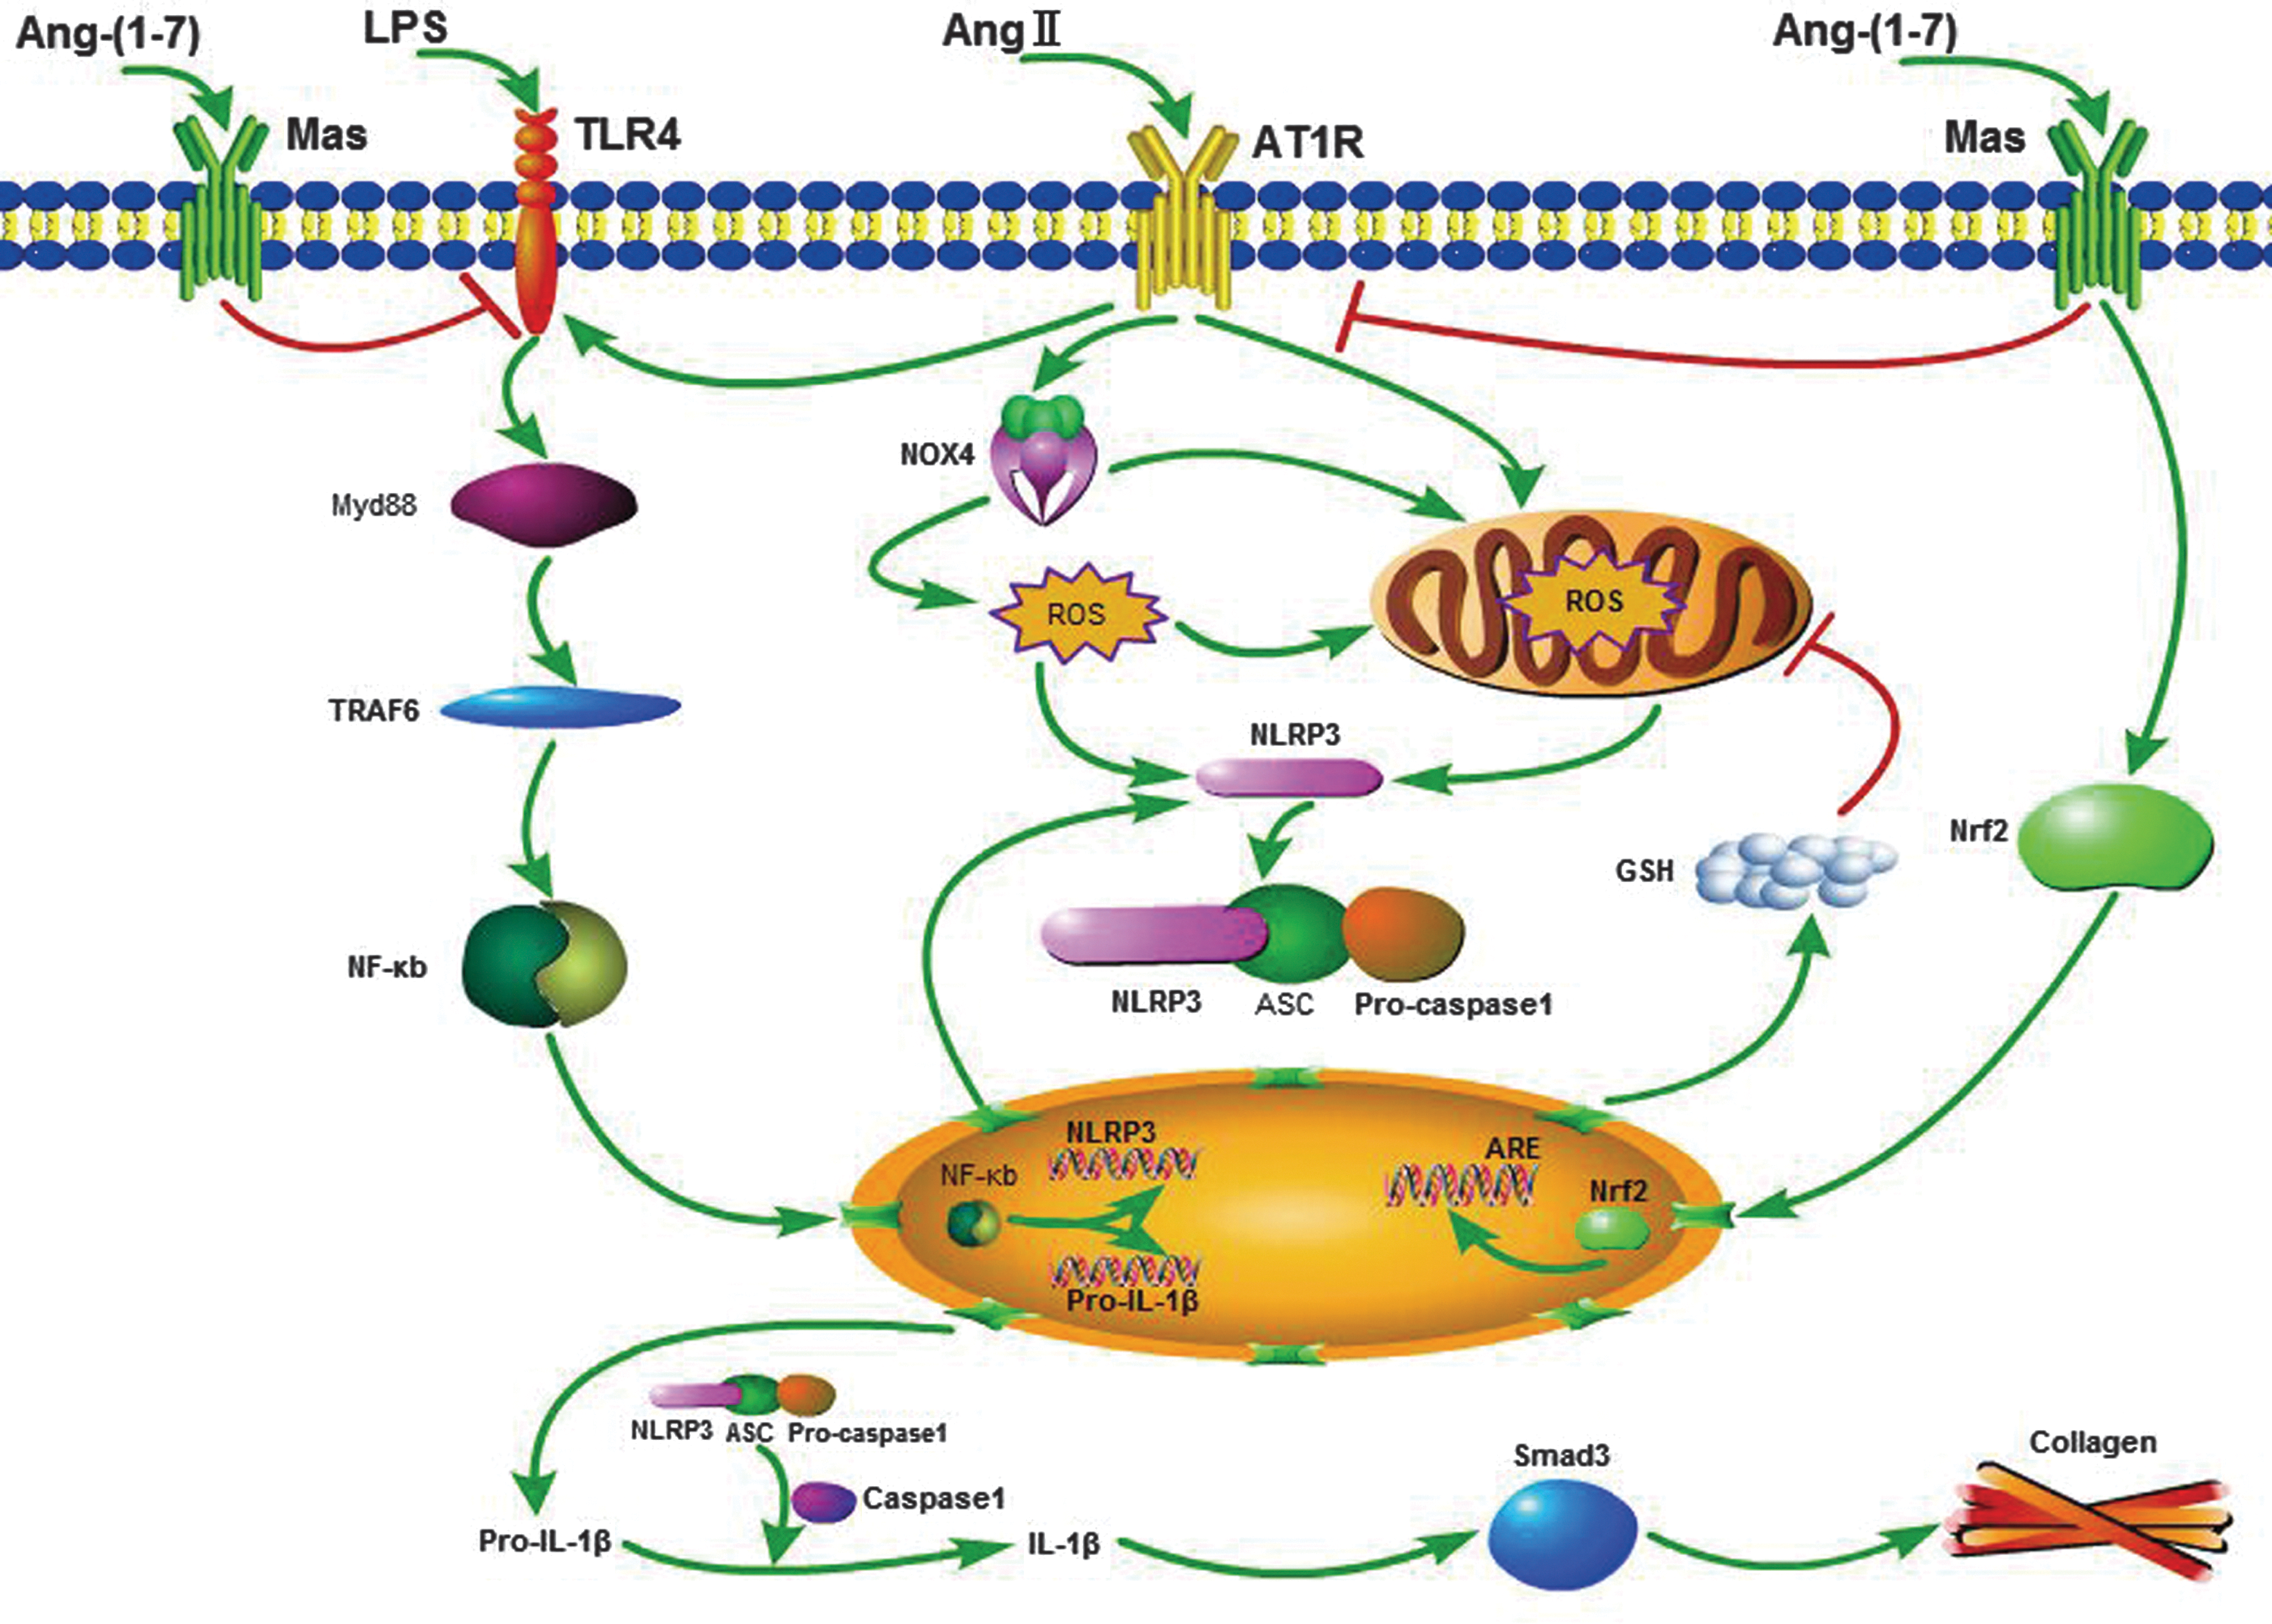
In summary, we showed a protective effect of Ang-(1–7) against liver fibrosis through the regulation of the redox balance and the consequent NLRP3 inflammasome/IL-1β secretion axis activation (Fig. 12). Consequently, these results revealed a specific mechanism of Ang-(1–7) attenuation of liver fibrosis, suggesting that Ang-(1–7) is a promising therapeutic agent for the prevention and treatment of liver fibrosis.
Materials and Methods
Reagents
Ang II, Ang-(1–7), A779 (a selective Mas inhibitor), Ac-YVAD-cmk (a caspase-1 inhibitor), Ehop (Rac1 inhibitor), SFN (an Nrf2 activator), diphenyleneiodonium (DPI, an NADPH oxidase inhibitor), N-acetylcysteine (NAC, a superoxide inhibitor), catalase (CAT, H2O2 scavenger), and TEMPO were purchased from Sigma-Aldrich (St. Louis, MO). Recombinant rat IL-1β was purchased from ProSpec (Protein Specialists, Rehovot, Israel). Irbesartan (an AT1R blocker) was kindly provided by Merck & Co. (Darmstadt, Germany). Other reagents are described below.
Human liver specimens
We retrospectively studied paraffin specimens of liver tissue from 12 patients. Normal liver samples were collected from six patients undergoing partial liver resection for hepatic hemangioma. Liver biopsy specimens (fibrosis stage: F3–4) were obtained from six patients. Informed consent in writing was obtained from each patient; the use of the samples was approved by the Ethics Committee at the Nanfang Hospital.
Animals and procedures
Male Wistar rats (300–350 g) were purchased from the Central Animal Care Facility of Southern Medical University. All animals were housed (12-h light/12-h dark; temperature 22–24°C) and given food and water ad libitum in the Animal Experiment Center of Nanfang Hospital. Protocols for animal use were approved by the Ethics of Animal Experiments Committee at the Southern Medical University.
In the animal model, hepatic fibrosis was induced by double BDL. Twenty-seven male Wistar rats were randomly divided into three groups, each containing nine rats: the sham group, the BDL+saline group, and the BDL+Ang-(1–7) treatment group. While the animals were under anesthesia, the animals in the sham group received sham operation. The other two groups received BDL operation. Miniosmotic pumps (ALZET Osmotic Pumps, Cupertino, CA) containing either saline or Ang-(1–7) (25 μg·kg−1·h−1) were implanted into the abdominal cavity of animals in the BDL+saline group and the BDL+Ang-(1–7) treatment group. The rats were sacrificed 4 weeks later.
Histological and immunochemical analyses
Liver specimens were incubated with primary antibody against COL1A (1:100; Sigma-Aldrich), p-Smad3 (1:100; Cell Signaling Technology, Danvers, MA), CTGF, α-SMA, NOX4, Nrf2, NLRP3, caspase-1 p10, and IL-1β p17 (1:100; Abcam, Cambridge, MA), followed by incubation with streptavidin–peroxidase complex. Peroxidase conjugates were subsequently visualized by utilizing diaminobenzidine solution.
Cell culture
HSCs from Wistar rats were prepared and cultured as previously described by collagenase/pronase perfusion and isolated by Nycodenz gradient (7). Cells were preincubated for 1 h with irbesartan (10−5 M), A779 (10−5 M), DPI (10−5 M), NAC (10−3 M), catalase (10 mM), Ehop (4 μM), TEMPO (10−5 M), Ac-YVAD-cmk (4 × 10⁻⁵ M), SFN (5, 10 μM), and GSH (1 mM) before exposure to Ang II or Ang-(1–7) for the indicated time.
Measurement of hepatic hydroxyproline content
The hepatic hydroxyproline content was determined using a hydroxyproline detection kit (Nanjing Jiancheng Bioengineering Institute, Nanjing, China) according to the manufacturer's instructions; absorbance was measured at 550 nm. All experiments were performed in triplicate. Results are expressed as μ/g of wet liver tissue.
Measurement of GSH content
GSH in liver tissue or cells was quantified using the GSH-Glo Glutathione Assay (Promega, Madison, WI). Briefly, liver tissue was homogenized in phosphate-buffered saline (PBS) containing 2 mM EDTA, and then centrifuged. The supernatant was collected for assay directly. Culture cells were counted and washed with PBS. Cells ready for assay or liver tissue extracts were then incubated in a solution containing a luciferin derivative and GSH S-transferase for 30 min at room temperature (20–25°C). In the presence of GSH, the luciferin derivative is converted to luciferin. The cells were then incubated with luciferase enzyme, which initiates a luminescence signal directly proportional to the luciferin previously generated. Luminescence was measured using a SpectraMax M5 plate reader (Molecular Devices, Sunnyvale, CA). Serial dilution of a GSH standard solution was included to generate a standard curve, facilitating the conversion of relative light unit (RLU) to GSH concentration.
Hydrogen peroxide assay
The H2O2 content was analyzed with a hydrogen peroxide assay kit (Beyotime Institute of Biotechnology, Shanghai, China). Briefly, liver tissue (10 mg) was homogenized in 150 μl lysis buffer provided in the assay kit at 4°C, and then centrifuged at 12,000× g for 5 min. The supernatants (50 μl) were incubated with reaction solution (100 μl) at room temperature (20–25°C) for 30 min, and then the absorption at 560 nm was measured. The concentration of H2O2 released was calculated from a standard concentration curve with triplicate experiments.
Intracellular ROS measurement
To monitor intracellular ROS accumulation, the fluorescent probe DCF-DA, an ROS-sensitive membrane-permeable fluorescent probe, was used. After exposure to stimulus, the cells were incubated in PBS containing 10 mM 2′,7′-dichlorodihydrofluorescein diacetate (H2-DCFDA; Molecular Probes, Life Technologies, Grand Island, NY) for 30 min at 37°C to label intracellular ROS. H2-DCFDA was metabolized by nonspecific esterases to the nonfluorescent product, 2′,7′-dichlorodihydrofluorescein, which was oxidized to the fluorescent product, DCF, by ROS. Then, the cells were washed twice in PBS, CM-H2DCFDA fluorescence was detected at excitation and emission wavelengths of 488 and 520 nm using a SpectraMax M5 plate reader (Molecular Devices) or visualized under a confocal fluorescent microscope (FV10i-W; Olympus, Tokyo, Japan), and images were analyzed using the accompanying FV10i-ASW 3.0 Viewer software.
mito-ROS measurement by flow cytometry
In brief, cells were seeded onto 30-mm culture dishes at a density of 1 × 10⁶ cells. mito-ROS was assessed in cells by MitoSOX Red reagent (Invitrogen, Life Technologies, Grand Island, NY) staining (2.5 μM at 37°C for 15 min). After staining, cells were analyzed by flow cytometry (BD LSRFortessaTM X-20; BD Biosciences, San Jose, CA) and data were analyzed with FlowJo analytical software (Tree Star, Ashland, OR). In addition, for determination of mitochondrial mass, cells were stained with 200 nM MitoTracker Green FM and MitoTracker Deep Red FM (Invitrogen) at 37°C for 30 min. After staining, cells were analyzed by flow cytometry.
Measurement of intracellular ATP level
The intracellular ATP levels were determined by a luminometric ATP assay kit (Beyotime Institute of Biotechnology). Cells were dispersed and centrifuged to obtain a cell pellet, then resuspended with 100 μl lysis buffer and centrifuged at 12,000× g for 5 min at 4°C. One hundred microliters of ATP detection working solution was added to wells of a white 96-well culture plate and preincubated for 5 min at room temperature to reduce the background. Then, 50 μl of supernatant was added, and after 2 s, the luminescence value was measured by a luminometer (SpectraMax M5/M5e; Molecular Devices). The ATP level was calculated based on the standard concentration curve of triplicate experiments.
Mitochondria isolation
HSC mitochondria were isolated by differential centrifugation through Percoll density gradient as described previously (17).
siRNA transfection
These are the siRNA sequences of targeted proteins: NOX4 (sense: 5′-GGGCCAGAAUACUACUACATT-3′; antisense: 5′-UGUAGUAGUAUUCUGGCCCTT-3′); Smad3 (sense: 5′-CCGCAUGAGCUUCGUCAAATT-3′; antisense: 5′-UUUGACGAAGCUCAUGCGGTT-3′); NLRP3 (sense: 5′-CCGCAUGAGCUUCGUCAAATT-3′; antisense: 5′-UUUGACGAAGCUCAUGCGGTT-3′); and MyD88 (sense: 5′-GCCAGAAAUACAUACGCAATT-3′; antisense: 5′-UUGCGUAUGUAUUUCUGGCTT-3′).
Electrophoretic mobility shift assay
Briefly, to start with, double-stranded Smad oligonucleotide (5′-TCGAGAGCCAGACAAAAAGCCAGACATTTAGCCAGACAC-3′; 5′-GTGTCTGGCTAAATGTCTGGCTTTTTGTCTGGCTCTCGA-3′) was biotin labeled using the Biotin 3′ end labeling kit (Thermo Fisher Scientific, Waltham, MA). Specificity was determined by a competition assay with the addition of 125-fold molar excess of the appropriate unlabeled competitor oligonucleotides. Supershift experiments were performed by incubating 1 μg Smad 4 antibody (Santa Cruz Biotechnology, Dallas, TX) in the binding reaction mixture for 1 h at 4°C before the addition of the oligonucleotide probe to start the binding reaction. Nuclear extracts (10 μg) were incubated with Smad (1× binding buffer, 50 mM KCl, 5 mM MgCl2, 10 mM EDTA, 0.05% NP40, 2.5% glycerol, and 50 ng/μl poly dI-dC) and were electrophoresed and transferred to a nylon membrane, and then cross-linked for 15 min with a UV transilluminator. Streptavidin–horseradish peroxidase conjugate and the chemiluminescent substrate were used to detect the biotin end-labeled DNA. All experiments were repeated at least thrice.
Luciferase reporter assay
Cells plated onto 24-well plates were cotransfected with 0.8 μg of a reporter plasmid (pGL3-COL1A1-luc) carrying the firefly luciferase gene and 0.2 μg of the reference plasmid pRL-SV40 carrying the Renilla luciferase gene under the control of the SV40 enhancer and promoter (Promega) for transfection control. The pGL3 basic vector was used as negative control. After 48 h, treated cells were lysed in 100 μl of Passive lysis buffer (Promega). The Dual-Glo Luciferase Assay System (Promega) was used to analyze luciferase expression according to the manufacturer's protocol. Relative activity was defined as the ratio of firefly luciferase activity to Renilla luciferase activity.
Caspase-1 activity assay
Briefly, cells or liver tissue were homogenized in lysis buffer and centrifuged for 1 min at 10,000× g. The supernatant was collected and protein concentration was measured. A volume of 50 μl of protein sample (containing 100–200 μg protein) was added to 2× caspase-1 reaction buffer (containing 10 mM DTT) in a 96-well plate. Then, 5 μl of the 4 mM YVAD-pNA substrate was added to each sample, followed by 2 h of incubation at 37°C. Caspase-1 activity was measured using a SpectraMax M5 plate reader (Molecular Devices) at 400 or 405 nm. Fold increase in caspase-1 activity was determined by comparing the results of treated samples with the level of the untreated control.
Rac1 pull-down assay
Grow adherent cells until they are ∼75–80% confluent to a density of about 107 cells/ml. Reduce serum in culture overnight and treat with a cdc42 activator of choice for 1 h. The cells were lysed on the culture plate with 1 ml lysis/binding/wash buffer. The suspensions were centrifuged for 15 min at 16,000× g at 4°C. Save a sample of the lysates for protein quantitation. Immediately add 10 μg of Rac/cdc42 assay reagent to 1 ml of cell lysate. Gently rock the reaction mixture at 4°C for 60 min. Collect the agarose beads by pulsing (5 s in the microcentrifuge at 14,000× g) and drain off the supernatant. Wash the beads thrice with lysis/binding/wash buffer. Resuspend the agarose beads in 50 μl of 2 × Laemmli sample buffer and boil for 5 min. Use 20 μl per assay for 10 × 10 cm minigels.
Western blotting analysis
The whole proteins separated by sodium dodecyl sulfate–polyacrylamide gel electrophoresis were subjected to Western blotting. The primary antibodies were NLRP3, ASC, caspase-1 p10, IL-1β p17, NOX4, Nrf2, CTGF, α-SMA, Myd88, and TLR4 (1:1000; Abcam), GCLC, p-Smad3, and Smad2/3 (1:1000; Cell Signaling Technology), α1-type 1 collagen (1:100; Sigma-Aldrich), and β-actin (1:700; Santa Cruz Biotechnology). Levels of proteins were detected with goat anti-rabbit IRDye® 800CW (1:7500; LI-COR Bioscience, Lincoln, NE) by using the ODYSSEY® Infrared Imaging System. The relative density of bands was quantified with β-actin as an internal control. All Western blots were repeated at least thrice.
Real-time polymerase chain reaction analysis
Total RNA of cultured cells or liver tissue was isolated by using TRIzol reagent (Invitrogen, Life Technologies) according to the manufacturer's instructions. Reverse transcription was carried out using the Revert Aid RT-PCR system. Real-time polymerase chain reaction (PCR) was performed by mixing complementary DNA (cDNA) with primers and Faststart Universal SYBR Green Master (ROX) (Roche, Indianapolis, IN). The following primers were used: GCLC (F: 5′-ATTCAAGGACAAGAACACACCA-3′; R: 5′-AGAAATCACTCCCCAGCGACA-3′); HO-1 (F: 5′-GGGAAGGCTTTAAGCTGGTG-3′; R: 5′-AGGGAAGTAGAGTGGGGCAT-3′); Nrf2 (F: 5′-GGTGATGAATTTTACTCTGC-3′; R: 5′-TTTCCGAGTCACTGATGAACC-3′); Gclm (F: 5′-AAGTTAACCTGGCCTCCTGC-3′; R: 5′-GAGAGCAGTTCTTTCGGGTCA-3′); GSR (F: 5′-TGGCACTTGCGTGAATGTTG-3′; R: 5′-CGAATGTTGCATAGCCGTGG-3′); NQO1 (F: 5′-CCGAAGCATTTCAGGGTCGT-3′; R: 5′-TTCGGCTCCCCTGTGATGTC-3′); NOX4 (F: 5′-CCGGACAGTCCTGGCTTATC-3′; R: 5′-GGCTACATGCACACCTGAGA-3′); NOX1 (F: 5′-GGATCACAACCTCACCTTCC-3′; R: 5′-GCTGCATACATCACTGTCACG-3′); NOX2 (F: 5′-TGACTCGGTTGGCTGGCATC-3′; R: 5′-CGCAAAGGTACAGGAACATGGG-3′); p22phox (F: 5′-CCCCGGGGAAAGAGGAAAAA-3′; R: 5′-GGATGGCTGCCAGCAGATAG-3′); p47phox (F: 5′-TACGCAGGTGAACCGTATGT-3′; R: 5′-TGGATGGGAAATAGCCGGTG-3′); p67phox (F: 5′-TGGACTTCGGATTCACCCTCAGTC-3′; R: 5′-CACCTTGAGCATGTAAGGCATAGG-3′); p40phox (F: 5′-GAGAGAGGACATTGCCCTTA-3′; R: 5′-AAGTAGAATCCTGTCCAGTG-3′); TLR4 (F: 5′-AGCTTTGGTCAGTTGGCTCT-3′; R: 5′-GGCACTCATCAGGATGACAC-3′); MyD88 (F: 5′-TGATCCGGCAACTAGAACAG-3′; R: 5′-ATCGTCAGAAACAACCACCA-3′); TRAF6 (F: 5′-AAGCACAGCAGTGTAATGGC-3′; R: 5′-CCAGGTCTGCCTGTGTAGAA-3′); and GAPDH (F: 5′-ACCACAGTCCATGCCATCAC-3′; R:5′-TCCACCACCACCCTGTTGCTGTA-3′). Real-time PCR was performed using an ABI 7500 Real-Time PCR System with supplied software (Applied Biosystems, Foster City, CA), according to the manufacturer's instructions. Relative expression levels for each gene of interest were calculated with the ΔΔCt method and normalized to the expression of GAPDH.
Statistical analysis
All of the experiments were repeated at least thrice. Data are expressed as the mean ± SD. The fibrosis scores for the mice were analyzed by the nonparametric Kruskal–Wallis test and an analysis of variance (ANOVA) with Dunnett's T3 for multiple comparisons. The other data were analyzed by ANOVA with the least significant difference for multiple comparisons. Differences were considered significant at a p-value <0.05. All of the data were analyzed using SPSS 13.0.
Footnotes
Acknowledgments
This study was supported by research grants from the National Science Foundation of China (81070338). The authors thank Prof. Pingsheng Wu, Prof. Zhenshu Zhang, and Prof. Xishan Yang for their kind help in this study.
Author Disclosure Statement
No competing financial interests exist.
Abbreviations Used
References
Supplementary Material
Please find the following supplemental material available below.
For Open Access articles published under a Creative Commons License, all supplemental material carries the same license as the article it is associated with.
For non-Open Access articles published, all supplemental material carries a non-exclusive license, and permission requests for re-use of supplemental material or any part of supplemental material shall be sent directly to the copyright owner as specified in the copyright notice associated with the article.