
Abstract
Introduction
H
This study provides the first line of evidence revealing amplified accumulation of oxidative DNA damage and mitochondrial fragmentation in the in vitro and ex vivo Fuchs endothelial corneal dystrophy (FECD) corneal endothelium. We have shown that menadione induced oxidative stress, leading to rosette formation, DNA damage, and subsequent induction of endothelial cell death corresponding to findings in an ex vivo FECD specimen.
Specifically, studies on the composition of rosettes showed overproduction of clusterin (CLU) and transforming growth factor-β-induced (TGFBI) protein, as well as increased proportion of TUNEL-positive cells adjacent to the acellular centers of the rosettes (2, 22, 23). Evidence indicated an underlying oxidant–antioxidant imbalance, which leads to oxidant-induced apoptosis, in FECD ex vivo and in vitro models (2, 23). Nevertheless, the mechanism leading to HCEnC degeneration is not known. Postmitotic cells of the ocular tissues, such as HCEnCs, have a lifelong exposure to ultraviolet light and exuberant metabolic activity due to pumping of ions; therefore, due to limited regenerative capacity and division, HCEnCs are susceptible to oxidized DNA accumulation over time (29). To study the role of DNA damage in the FECD pathogenesis, we developed an in vitro model by inducing intracellular stress seen in the cells surrounding the rosettes and mimicking the oxidant–antioxidant imbalance seen in FECD.
Our previous studies detected higher levels of 8-hydroxy-2′-deoxyguanosine (8-OHdG) and increased levels of intracellular reactive oxygen species (ROS) and apoptosis in FECD corneal endothelium (23). Since only 10% of ROS-induced DNA damage is captured by the 8-OHdG assay, and our previous work did not distinguish between mtDNA and nDNA damage, we utilized a quantitative PCR methodology to distinguish genomic damage in normal and FECD cell lines and tissue specimens. The aim of this study was to determine whether nDNA and/or mtDNA damage is involved in the pathogenesis of FECD. We formulated the hypothesis that chronic accumulation of oxidative DNA damage in HCEnCs leads to mitochondrial dysfunction and apoptosis seen in FECD. The biological consequence of DNA damage, mainly mtDNA, has been linked to multiple oxidative stress-induced degenerative disorders, including Alzheimer's and Parkinson's diseases (8, 17) and age-related macular degeneration. However, the integrity of the DNA has not been studied in depth in corneal endothelium and FECD.
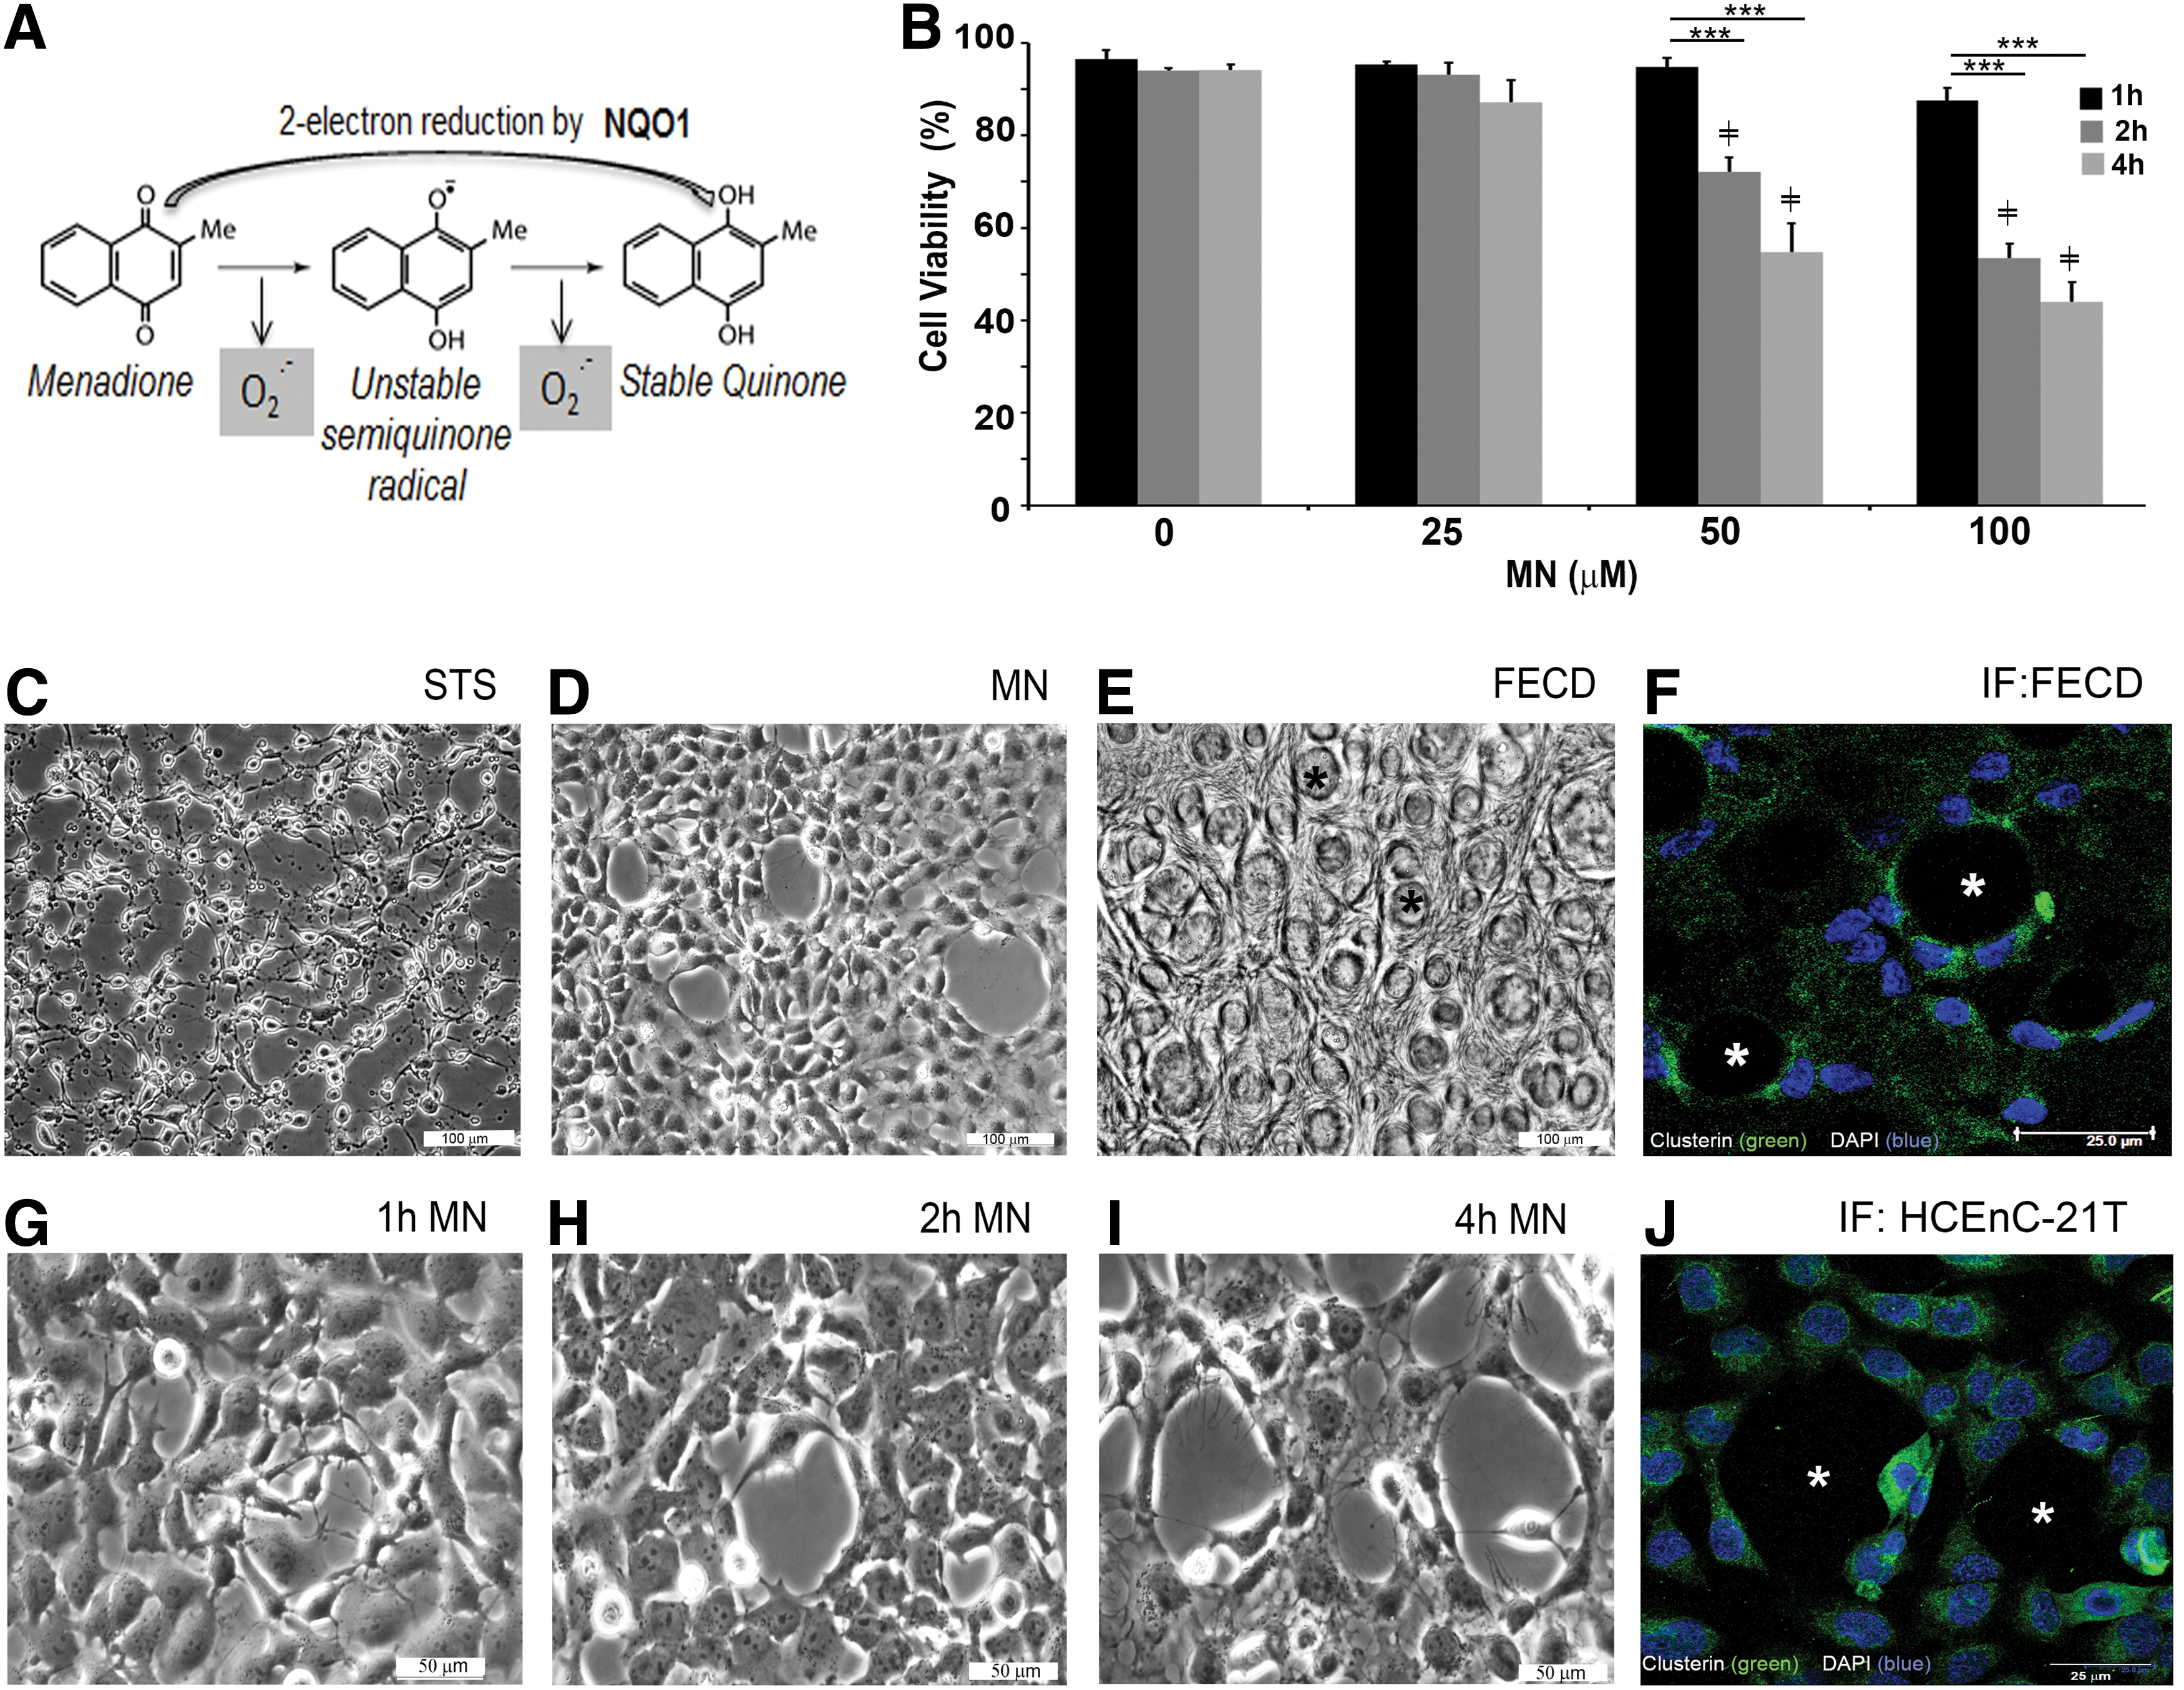
To understand the basis of ROS-induced damage in FECD corneal endothelium, we increased intracellular ROS by treating cells with menadione (MN), testing its effects in normal and FECD cells. MN is a quinone that is metabolized by a 1-electron reducing enzyme, such as NADPH-cytochrome P450 reductase or mitochondrial NADH-ubiquinone oxidoreductase, and generates intracellular superoxide and an unstable semiquinone radical that in turn increases intracellular ROS (Fig. 1A). In this study, we analyzed the influence of MN exposure on normal HCEnC morphology and detected that mitochondrial ROS generation led to rosette formation in normal HCEnCs, mimicking the changes seen in the ex vivo FECD specimens. These findings led us to develop an in vitro model, which analyzes the direct influence of intracellular ROS generation on DNA lesion levels, mitochondrial distribution, and the inner mitochondrial membrane potential (ΔΨm) during rosette formation. As corneal endothelium is especially rich in mitochondria, mtDNA damage and cell dysfunction could be the basis of decline in local adenosine triphosphate (ATP) supply, leading to cellular apoptosis in FECD (43). We detected that superoxide generation by MN induced DNA damage and led to the disruption of the ΔΨm, leading to the loss of functionally intact mitochondria. DNA-damaging influence of MN led to mitochondrial fragmentation and activation of apoptosis in corneal endothelium. Taken together, these findings demonstrate a novel pathogenic mechanism in which DNA damage and subsequent mitochondrial fragmentation lead to postmitotic cell loss in the ocular tissue.
Results
MN induces rosette formation in HCEnCs—the hallmark of FECD
To investigate the effects of intrinsic oxidative stress on corneal endothelium, MN was used in our study. MN is metabolized by a one-electron reduction, generating superoxide and unstable semiquinone, and inducing intracellular oxidative stress (Fig. 1A) (30). Normal telomerase-immortalized human corneal endothelial (HCEnC-21T) cells were grown in hexagonal monolayers and exposed to MN to determine its effects on cellular viability and morphology. Cellular viability, determined by trypan blue dye exclusion, was not significantly reduced due to increasing doses (25, 50, and 100 μM) of MN for 1 h. MN decreased viable cell numbers at 50 μM (by 21%, p < 0.001) and 100 μM (by 39%, p < 0.001), starting with a 2-h exposure; the viability continued to decline after the 4-h MN treatment with cell viability falling by 41% (p < 0.001) and 49% (p < 0.001), respectively (Fig. 1B). Cell morphology revealed that after MN treatment, cell monolayers developed rosette-like clusters with clear acellular centers and spindle-like cells surrounding them. The centers often exhibited a dying or a detaching cell with surrounding cell processes extending toward the detaching cells (Fig. 1G–I). Rosette-like structures formed as early as 1 h after 50 μM MN exposure (Fig. 1G) and increased in number and size with increased incubation time (Fig. 1H, I) and MN dose (Supplementary Fig. S1; Supplementary Data are available online at
To represent chronic endothelial dysfunction seen in FECD, low-dose MN (1 and 10 μM) exposure for 24 and 48 h was performed. Chronic stress induced rosette formation in a time-dependent manner (Supplementary Fig. S3), similarly to what was detected after 50 μM MN exposure (Fig. 1). Moreover, CLU and TGFBI mRNA levels were upregulated after 48 h with 10 μM MN treatment (Supplementary Fig. S2B), similarly to what was seen after more acute exposure to MN (Supplementary Fig. S2A) and in ex vivo specimens (22, 24). Since more acute MN exposure accelerated changes in the endothelial cell morphology and extracellular protein composition seen after chronic exposure (Supplementary Figs. S2 and S3), we induced the rosette formation with ensuing macromolecular damage with the acute stress model.
mtDNA and nDNA damage in FECD
Our hypothesis was that accumulation of oxidative DNA damage contributes to endothelial cell degeneration in FECD. To test this, we assessed MN-induced DNA damage in normal corneal endothelial cells during rosette formation. As the optimal rosette formation without significant decline in cell viability (79% live cells) occurred after 2 h of treatment with 50 μM MN, we exposed cells to this sublethal dose of MN. Long-extension PCR was performed to investigate mtDNA and nDNA damage separately (37). The relative amplification of mtDNA short fragments served as an estimate of mtDNA copy number as the probability of inducing DNA damage in a short fragment was low (Fig. 2A). Small mtDNA amplification was not altered with MN or NAC treatment in the normal (HCEnC-21T or HCECi) or FECDi cell lines. However, mitochondrial copy number by LX-PCR was 80% (p < 0.001) lower in FECDi cells compared with normal cells at baseline and remained at a reduced level after MN exposure, indicating that FECDi cells have significantly lower quantity of mitochondria compared with normal cells.
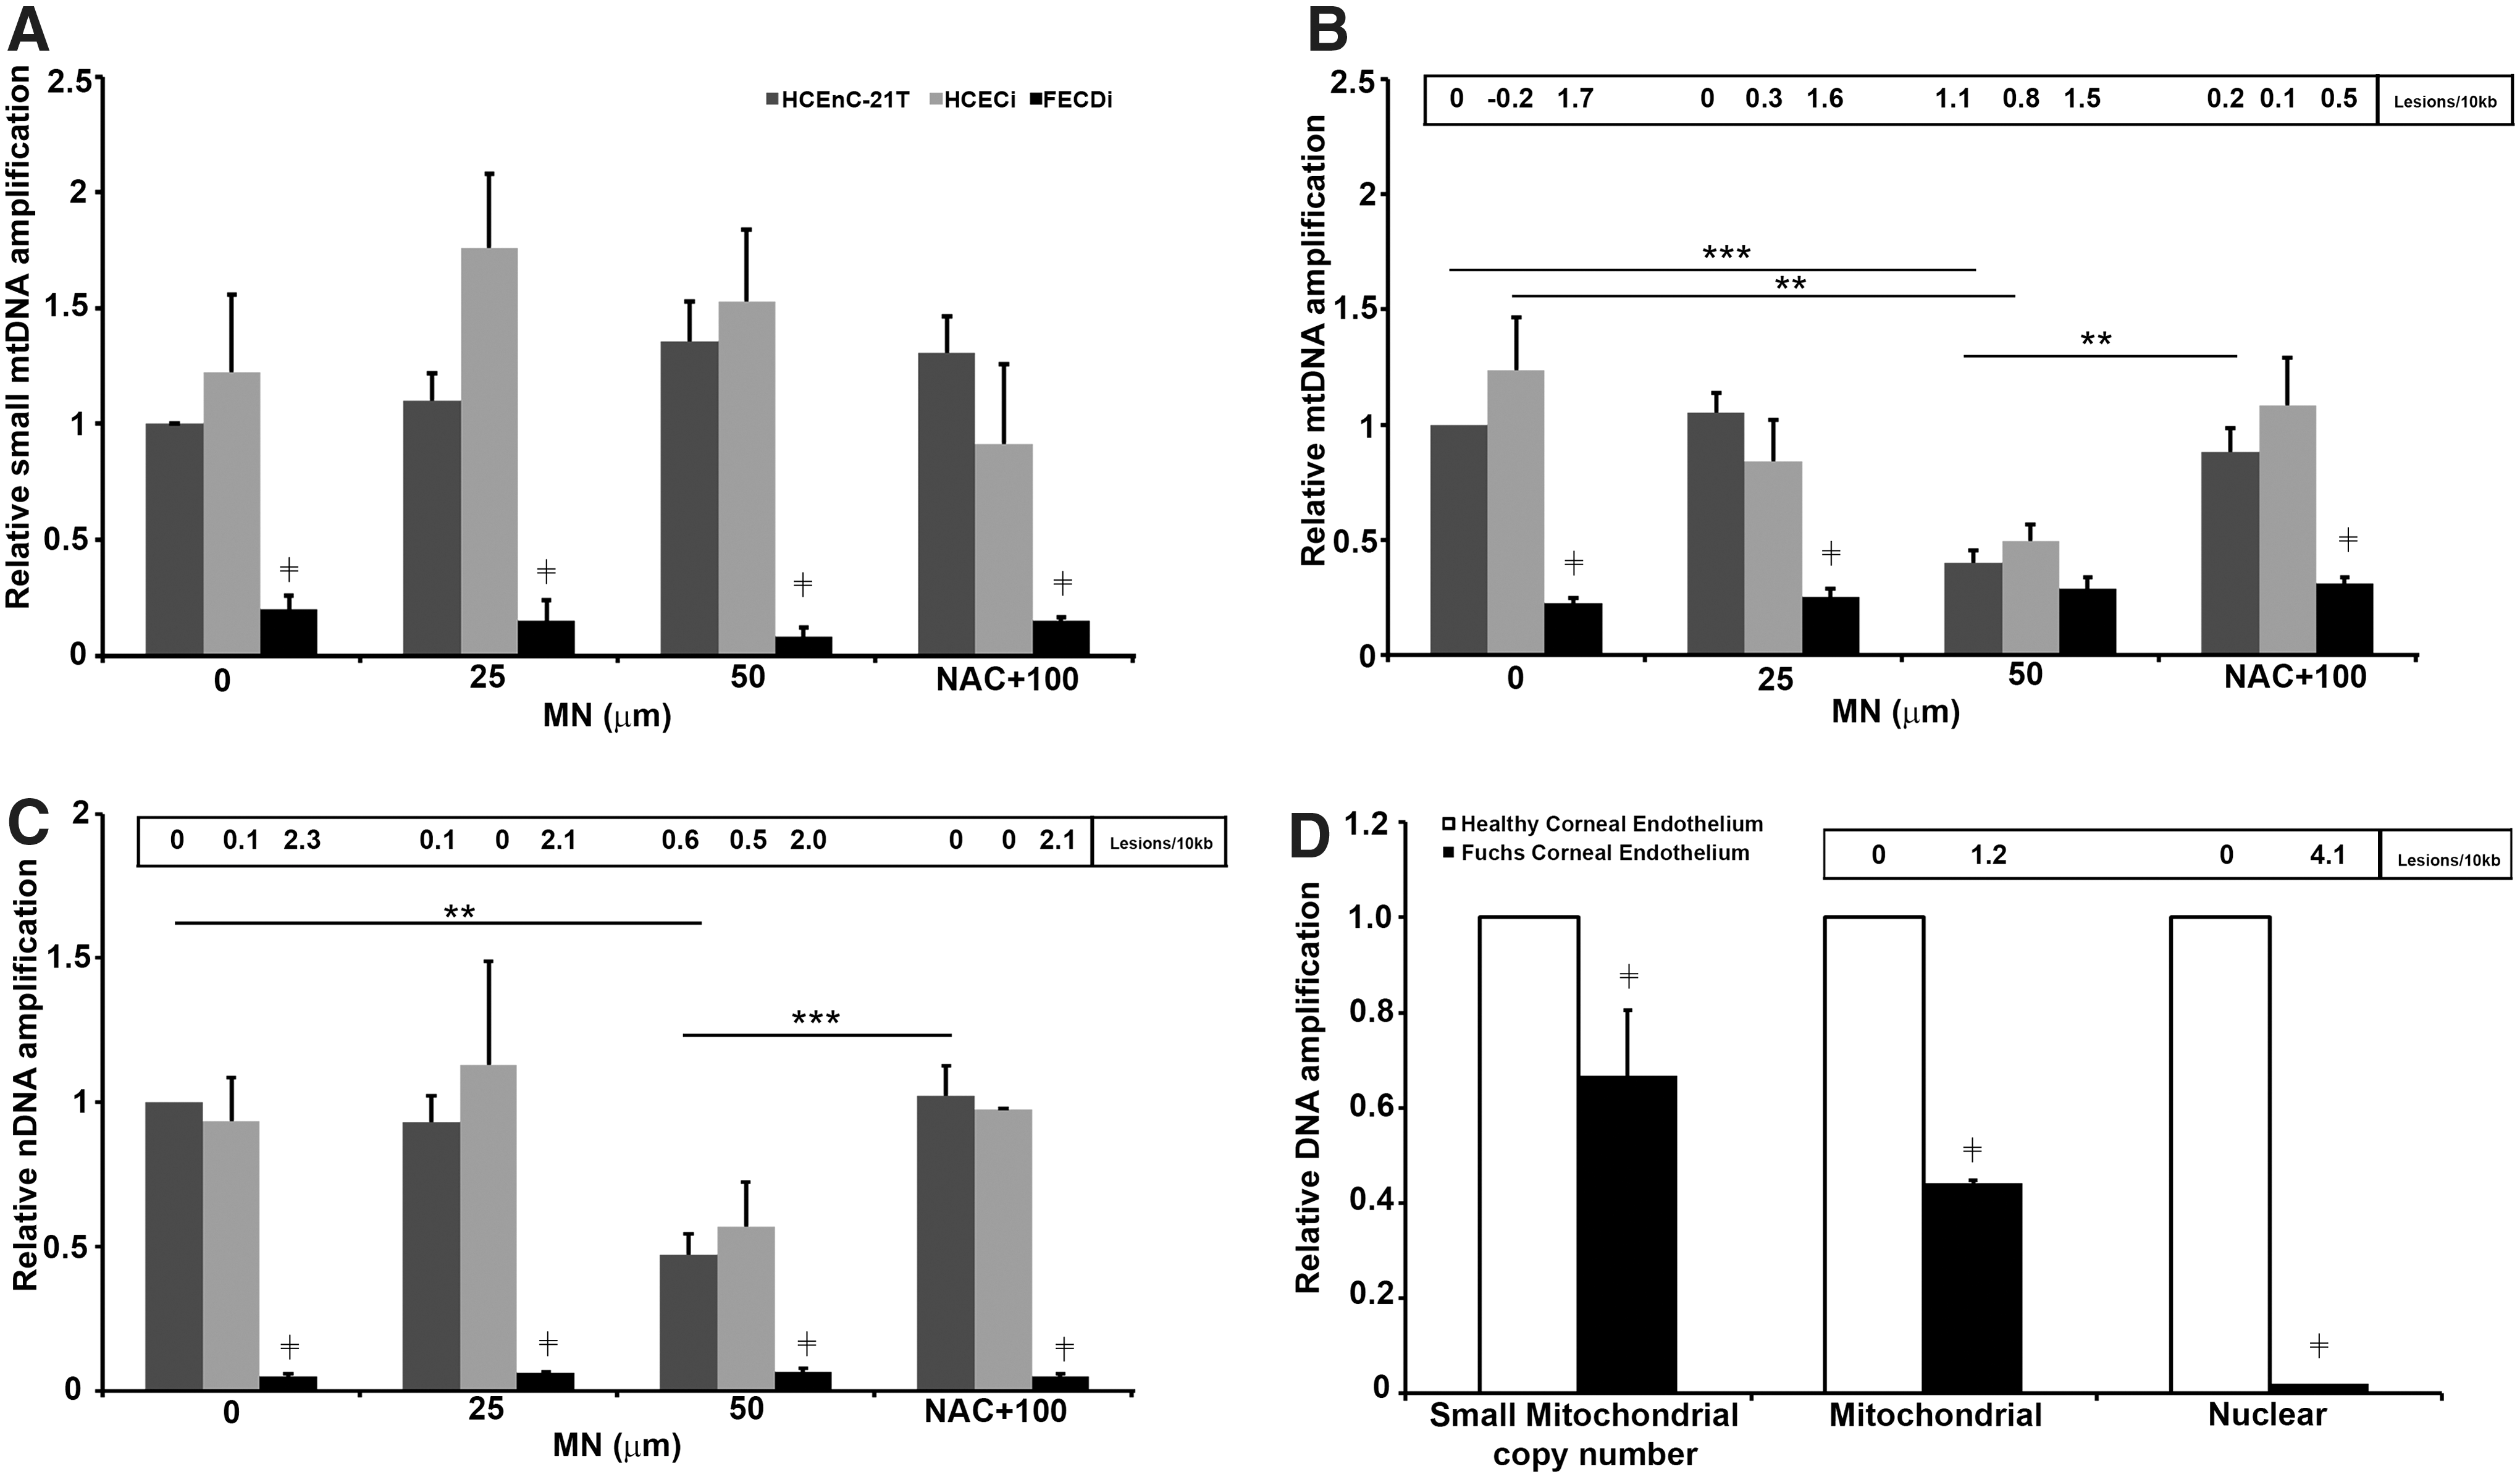
In normal endothelial cell lines (HCEnC-21T and HCECi), a low dose of MN, 25 μM, did not have an effect on mtDNA damage compared with untreated control, while 50 μM MN decreased DNA amplification by 60% and 50% and increased lesion frequency to 1.1 (p < 0.001) and 0.8 in HCEnC-21T and HCECi cells, respectively (Fig. 2B). DNA damage did not further decrease with 100 μM MN (data not shown) compared with 50 μM. Pretreatment with NAC significantly increased DNA amplification, suggesting that MN-induced DNA damage was mediated by ROS. At baseline, FECDi exhibited significantly higher mtDNA lesion frequency (1.7 lesions/kb, p < 0.001) than HCEnC-21T (0 lesions/10 kb) and HCECi (−0.2 lesions/10 kb) cells, respectively. MN did not further induce DNA damage in FECDi as the lesion number remained around 1.7–1.5 lesions/10 kb with or without MN.
Interestingly, we also detected a marked decrease in nDNA amplification by 95% (p < 0.001) and an increase in lesion number to 2.3 in FECDi at baseline compared with normal cell lines. The higher nDNA lesion frequency persisted in FECDi with MN treatments and NAC rescue (Fig. 2C). MN treatment did not induce any further damage in FECDi cells. Long-extension PCR detected a 53% and 43% decrease in DNA amplification of the β-globin gene and increase in lesion number to 0.6 and 0.5 with 50 μM MN in HCEnC-21T and HCECi cells, respectively. Pretreatment with NAC rescued the effect of MN (data not shown) back to control level (untreated) in HCEnC-21T and HCECi cells.
To corroborate the cell line data, FECD specimens were collected for DNA integrity analysis; samples were pooled due to low amount of cells retrieved. The mtDNA and nDNA damage in FECD was compared with age-matched normal cornea donors (Fig. 2D). FECD specimens exhibited a 37% lower small mitochondrial copy number (p < 0.01) compared with normal specimens. Moreover, when compared with normal specimens, FECD mtDNA showed a marked reduction in amplification (by 56%; p < 0.001), corresponding to 1.2 lesions/kb. Furthermore, FECD nDNA amplification was significantly lower (99%; p < 0.001) corresponding to 4.1 lesions/kb compared with normal corneal donors. These data indicate a greater accumulation of basal mtDNA and nDNA damage in FECD than what is seen in normal aging of corneal endothelium.
MN induced mitochondrial oxidative stress and dysfunction as seen in FECD
Next, we sought to determine whether DNA damage leads to mitochondrial ROS accumulation and mitochondrial dysfunction. We analyzed the influence of MN exposure on mitochondrial ROS generation and cellular ability to maintain ΔΨm in a dose- and time-dependent manner. As mitochondrial dysfunction can be the basis of cellular death during rosette formation, we investigated whether ATP production was altered during the process.
MN has been shown to increase mitochondrial-derived ROS (30). Thus, we determined mitochondrial superoxide levels by MitoSOX™ Red, a mitochondrial superoxide indicator, using flow cytometry (Fig. 3A). FECDi cells had significantly higher mitochondrial superoxide levels (by 22%, p < 0.01) at baseline compared with HCECi cells, consistent with the basal mtDNA damage. Mitochondrial superoxide levels increased eightfold with 25 μM MN compared with baseline in HCEnC-21T and HCECi cells, respectively. Furthermore, 50 μM MN increased superoxide levels up to 10–12-fold in normal cells from baseline and no further significant increase was observed with 100 μM MN (Fig. 3B). Superoxide generation was abrogated by cotreatment of cells with NAC compared with 100 μM MN treatment alone in normal cell lines, but not in FECDi, potentially indicating greater baseline oxidant–antioxidant imbalance of the diseased cells.
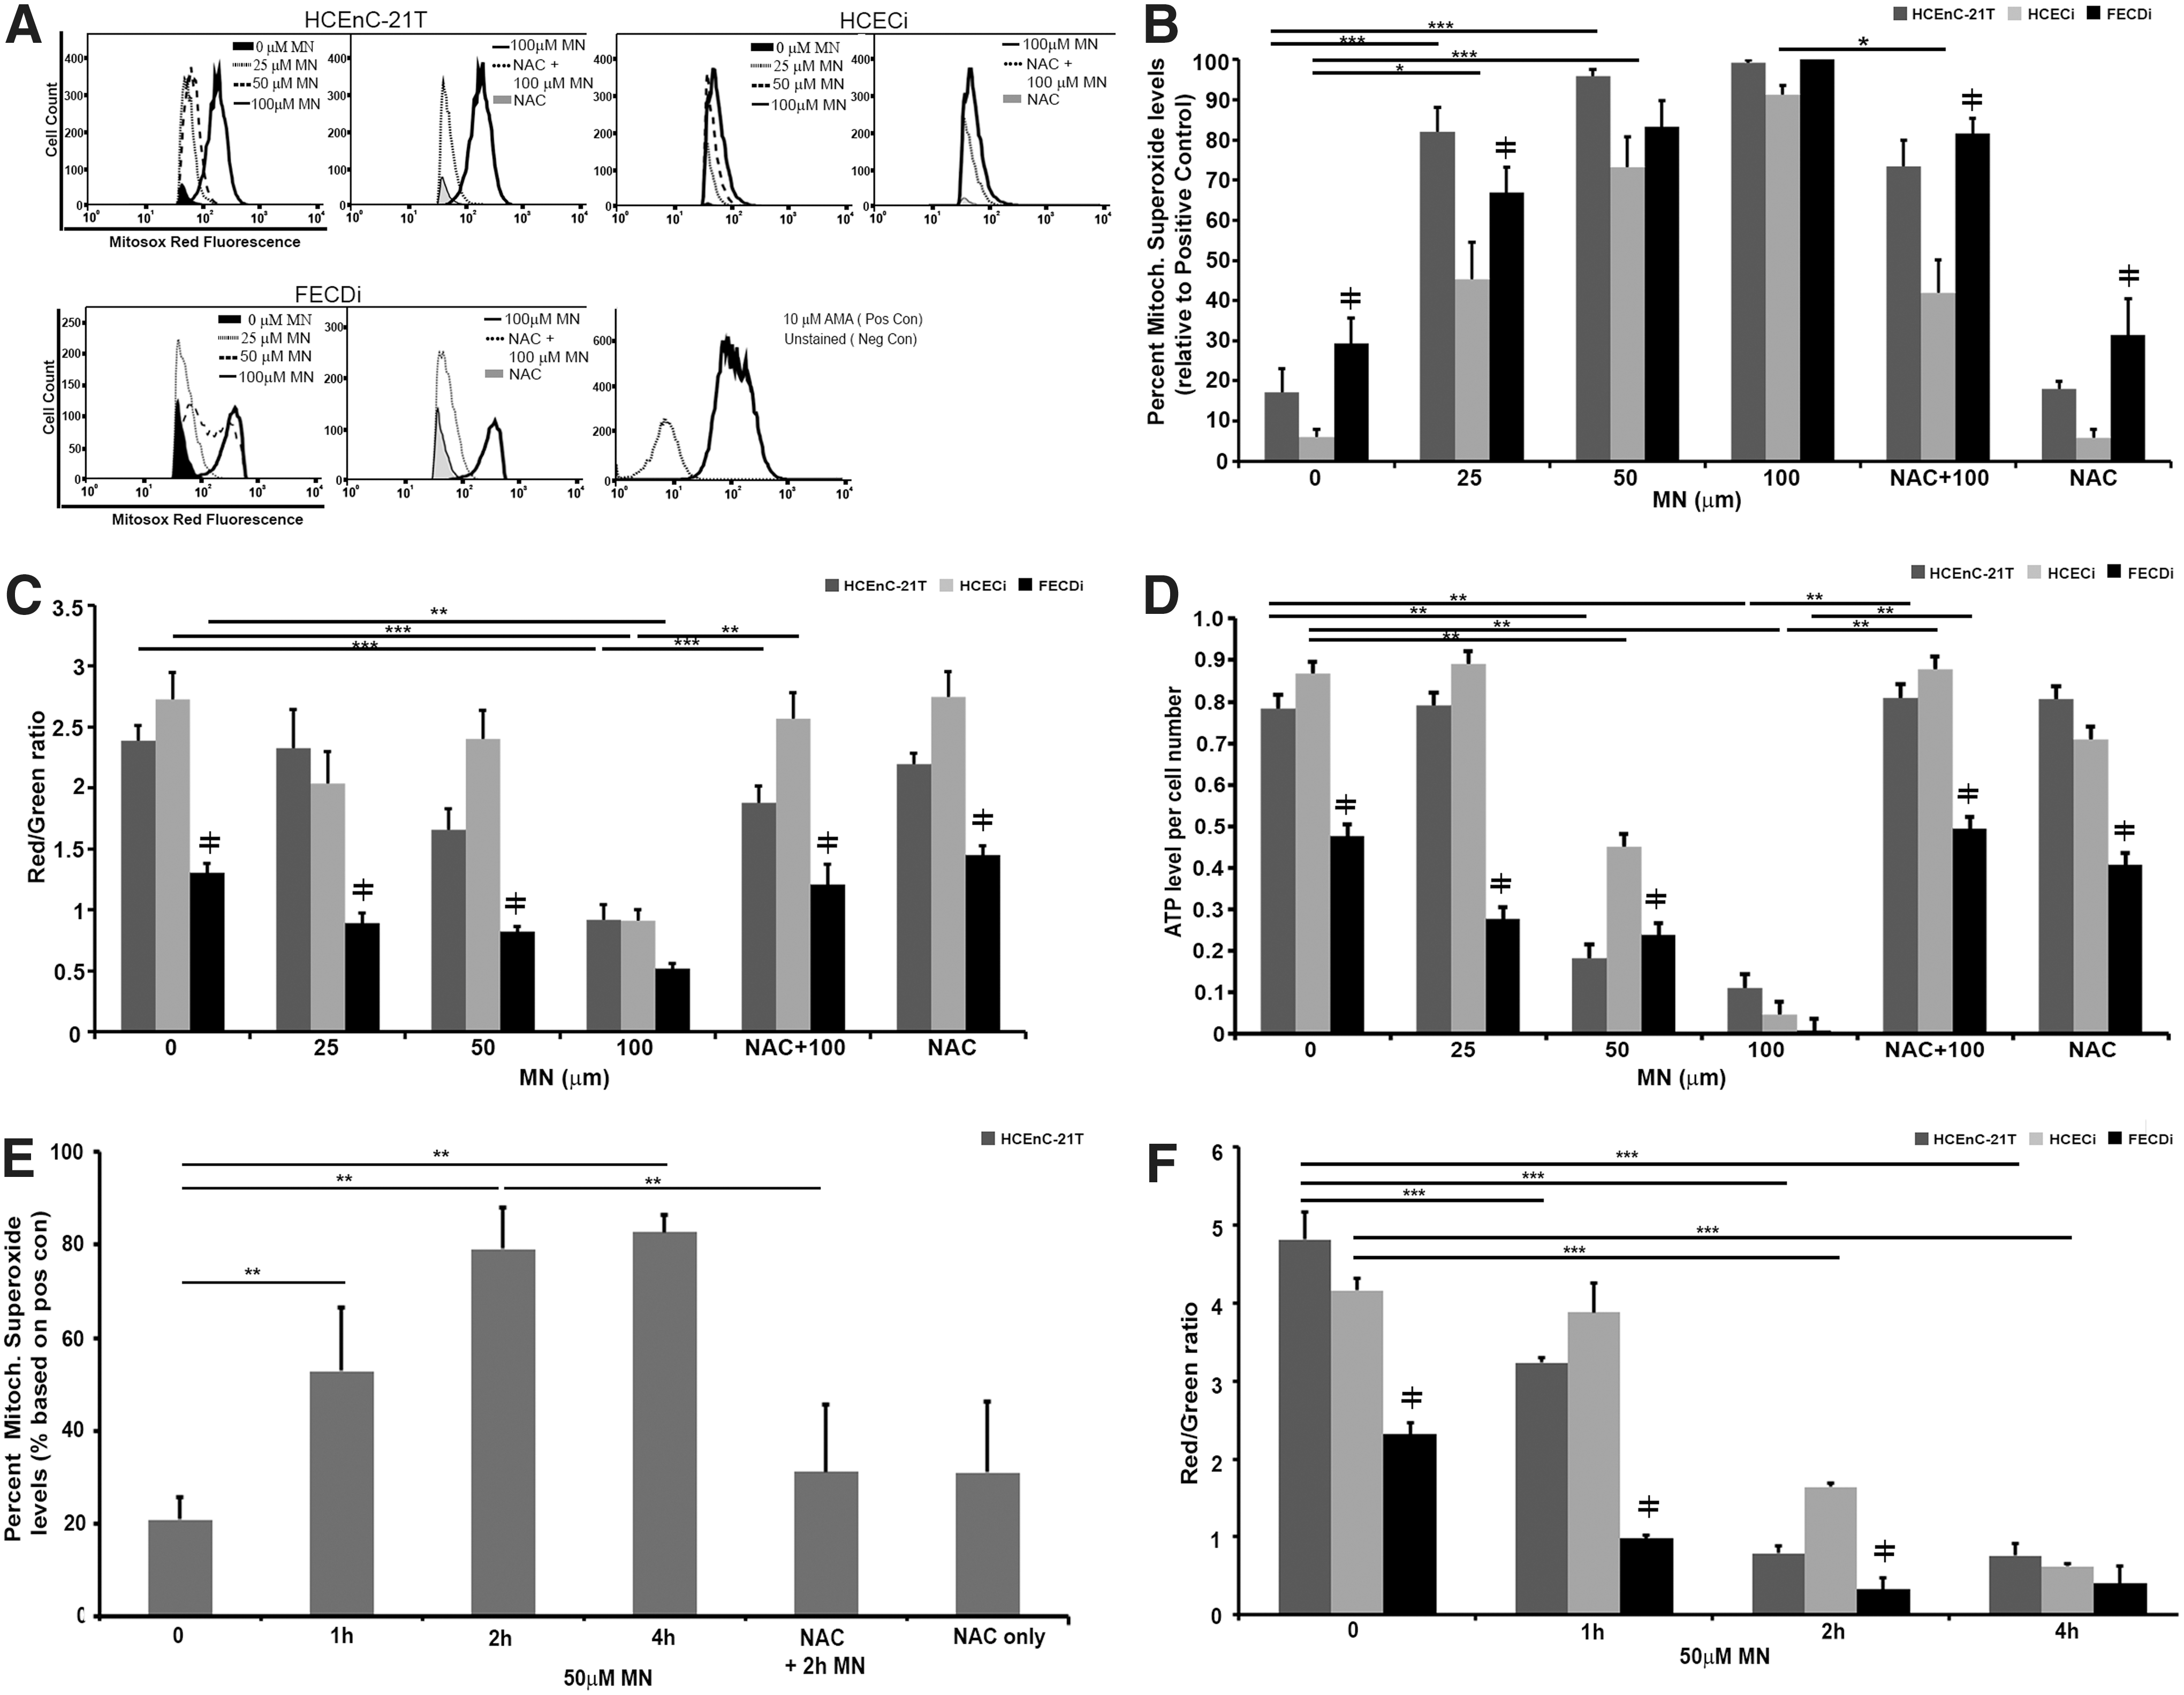
The integrity of ΔΨm was measured by the JC-1 assay. Cells were treated with different MN concentrations and analyzed after 1 h (Fig. 3C). At baseline, ΔΨm was lower by 52% (p < 0.001) and 45% (p < 0.001) in FECDi compared with HCEnC-21T and HCECi cells, respectively. FECDi continuously exhibited lower ΔΨm with 25 and 50 μM MN compared with normal cells. Normal cells were resistant to changes in the ΔΨm up until 100 μM MN, where ΔΨm decreased by 66% (p < 0.001) and 61% (p < 0.001) in HCEnC-21T and HCECi cells, respectively. Pretreatment with NAC restored ΔΨm levels back to baseline in all three cell lines, suggesting that the effect of MN on ΔΨm was ROS mediated.
To determine whether MN-induced mitochondrial impairment leads to depletion of ATP, we determined ATP levels based on the conversion of the D-luciferin to the luminescent product in the presence of ATP (Fig. 3D). FECDi exhibited greater susceptibility to MN-induced ATP loss compared with normal cells. At baseline, FECDi has lower ATP production by 39% (p < 0.001) and 45% (p < 0.001) compared with HCEnC-21T and HCECi cells, respectively. Even with a low dose of MN (25 μM), ATP levels decreased in FECDi by 42% (p < 0.05) from baseline, but did not significantly change in normal cells. Normal cells responded to higher doses of MN by lowering ATP production by 77% (p < 0.001) and 48% (p < 0.001) in HCEnC-21T and HCECi cells, respectively, after 50 μM MN and to almost undetectable levels after 100 μM MN. Pretreatment with NAC restored ATP back to control levels. In summary, increased doses of MN induced mitochondrial depolarization and loss of ATP in normal cells to the levels seen in FECDi. Pretreatment with NAC protected ΔΨm depolarization and ATP loss from MN-induced oxidative stress.
While we observed a dose-dependent increase in superoxide levels and loss of ATP and ΔΨm due to MN, the optimal dose for rosette formation without significant cell loss was seen at 50 μM dose. Therefore, to investigate temporal mitochondrial involvement during rosette formation, a time course analysis of superoxide and ΔΨm with 50 μM MN was performed. Mitochondrial superoxide levels significantly increased starting at 1 h of treatment, corresponding with the start of rosette formation (Figs. 3E and 1G). Superoxide levels continued to escalate at 2 h and plateaued at 4 h, corresponding with the increase in cell death associated with progressive rosette formation (Fig. 1B, I). Conversely, ΔΨm levels decreased after 2 h of MN treatment, correlating with the time point of greatest level of DNA damage in both normal cell lines (Figs. 2B, C, and 3F). Our data indicate that during rosette formation, MN increased mitochondrial ROS production after 1 h of treatment leading to the eventual decrease of ΔΨm at 2 h. MN induced mitochondrial depolarization up to the level of FECDi at the 4-h time point (Fig. 3F).
MN induces mitochondrial fragmentation and cytochrome c release seen in FECD
Considering that mitochondrial morphology has been shown to be regulated by ΔΨm (18), and we detected a loss of ΔΨm in FECDi and in MN-treated normal cells, we next sought to investigate whether mitochondrial integrity and morphology were compromised during rosette formation. Studies have shown that depletion of ATP and the alteration in ΔΨm trigger general fragmentation of the mitochondria (42). Mitochondrial morphology of HCEnC-21T cells was assessed by confocal microscopy with immunostaining of cytochrome c to visualize mitochondria after cells were treated with 50 μM MN for 0, 1, 2, 4, and 6 h (Fig. 4A, left panel). This method enabled visualization of mitochondrial distribution during rosette formation in a time-dependent manner. Normal endothelial cells (HCEnC-21T) and ex vivo specimens displayed elongated tubular mitochondrial networks, which readily stained with intracellular cytochrome c (Fig. 4A, left side and B, bottom image). The 1-h treatment of MN did not affect the overall organization of the mitochondrial network compared with the control. After 2 h of MN treatment, the mitochondria started to lose their tubular shape and mitochondria became fragmented compared with the untreated control. There was an increase in spherical mitochondria at the 4-h time point. With increasing doses of MN, mitochondria shape changed into small and spherical organelles and tended to aggregate around the nuclei. Similar changes were seen with rotenone, a known inhibitor of complex I of the electron transport chain and inducer of mitochondrial fragmentation (Supplementary Fig. S4A) (10). At 6 h, MN induced abnormal mitochondrial clustering and cytochrome c release, indicative of excessive fragmentation and cell death. Since it is known that (during the early stage of apoptosis) several proteins such as cytochrome c are released from the mitochondrial intermembrane space to the cytosol (39), we monitored cytochrome c release after treatment with MN. HCEnC-21T cells were pretreated with pan-caspase inhibitor, zVAD-fmk, followed by 50 μM MN for 0, 1, 2, 4, and 6 h (Fig. 4A, right panel), and stained using cytochrome c. Similarly, we found that with MN treatment, there was a transition from the typical tubular mitochondrial network of healthy cells (control and 1 h MN) into vesicular punctiform mitochondria (2 and 4 h). The intracytoplasmic staining with cytochrome c was first detected after the 4-h treatment in cells mostly surrounding rosettes (Fig. 4, asterisk). However, even at the 4-h time point, some cytochrome c was still retained in mitochondria, indicating that only a portion of cells were undergoing apoptosis. The cells with most cytochrome c release were located next to rosettes. With prolonged MN treatment (6 h), cytochrome c was released diffusely and completely into the cytosol. Low-magnification images revealed widespread formation of rosettes and generalized release of cytochrome c (Supplementary Fig. S4B). These findings indicate that mitochondrial fragmentation occurred at an early stage of cellular apoptosis and eventually led to cytochrome c release during rosette formation. Similarly, application of STS led to cytochrome c release and served as a positive control for apoptosis (Supplementary Fig. S4A) (11). To determine whether mitochondrial morphology is altered in FECD pathogenesis, postkeratoplasty FECD tissues were stained for the mitochondrial marker cytochrome c (4, 7, 10, 31). In the FECD male specimen (Fig. 4B, upper images), we detected cytochrome c release, predominantly expressed around cells adjacent to the guttae, which were stained with DAPI. We also found that mitochondria showed a stretched appearance with their long axis directed toward the guttae (Fig. 4B, upper images). In the FECD female specimen (Fig. 4B, lower image), mitochondria were fragmented and appeared as round and smaller in size. As the guttae get bigger than the endothelial cell in size, adjacent cells seem to form a rosette, corresponding to our in vitro model with MN exposure (Fig. 1D, G–J).

MN-induced apoptosis is caspase dependent during rosette formation
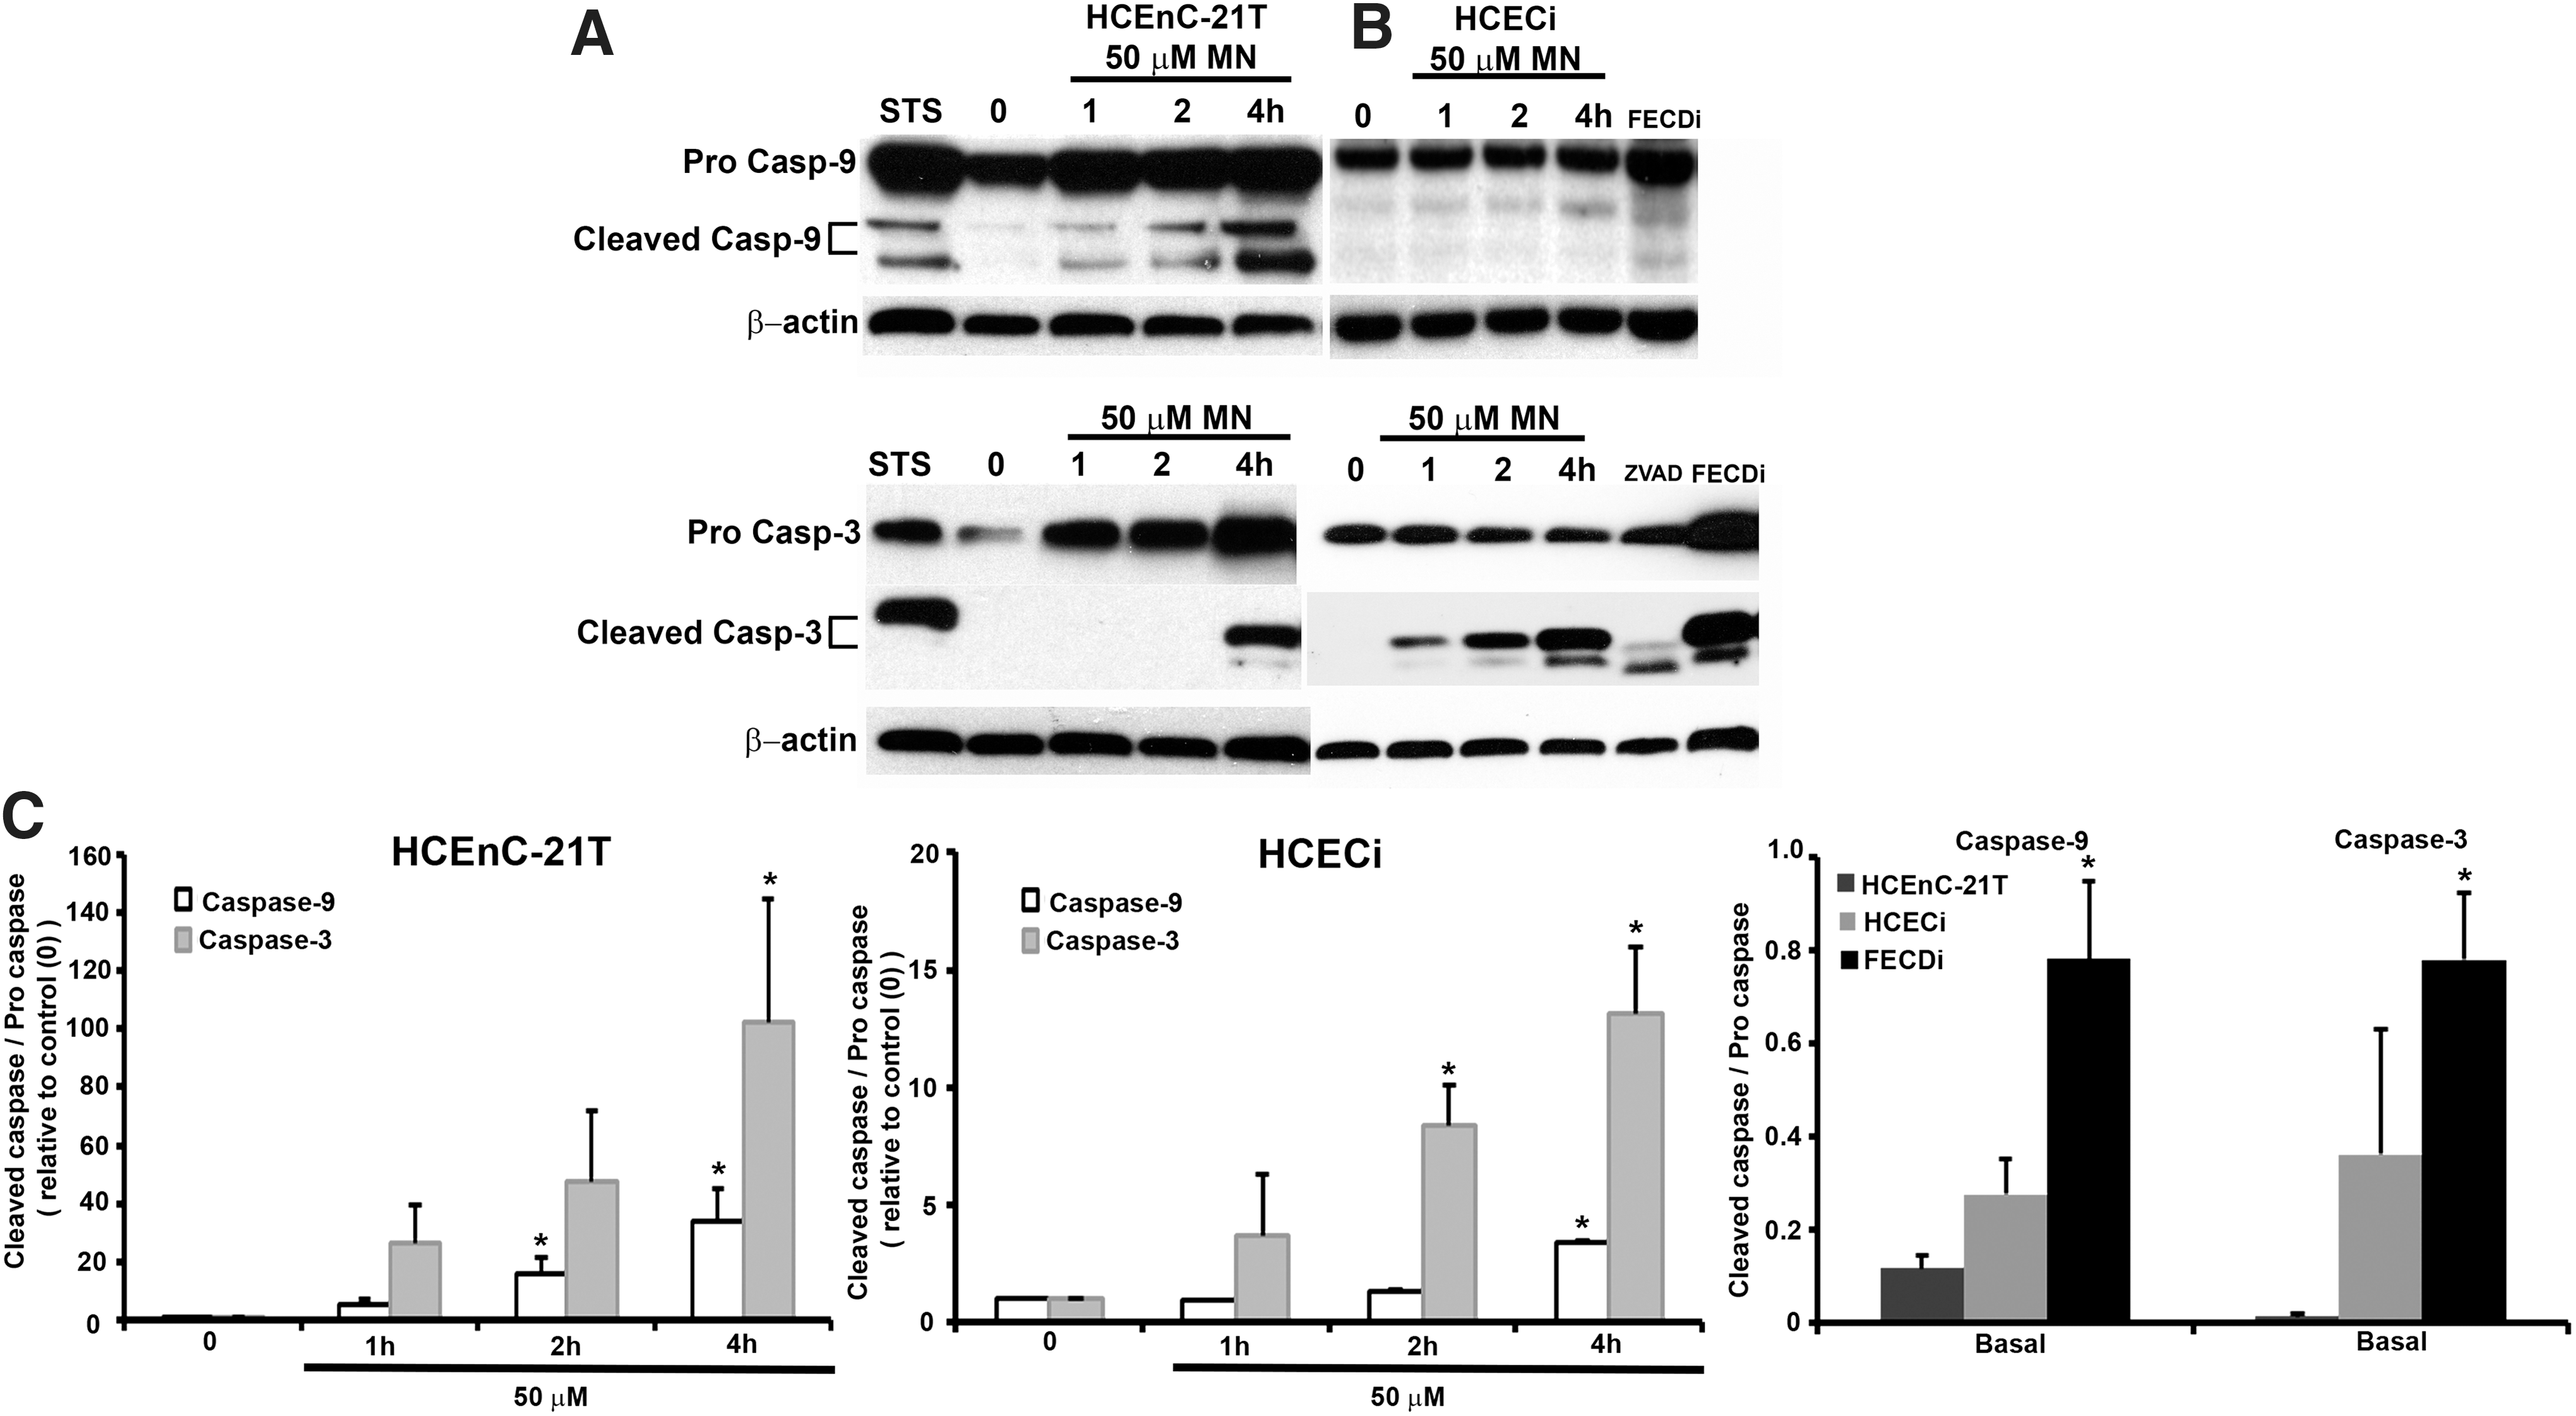
Cell loss in FECD has been shown to be mediated by apoptosis and specifically p53 (2, 6, 23). Next, we investigated whether caspase activation was involved in rosette formation, leading to endothelial cell loss. Caspase-9 has been associated with the release of cytochrome c from the mitochondrial intermembrane space to the cytosol. Moreover, MN has been shown to induce apoptosis defined by the release of cytochrome c and caspase-9 and caspase-3 activation in pancreatic acinar cells (14). Therefore, we aimed to determine if the release of cytochrome c resulted in the activation of caspase-9 and subsequently its downstream effector caspase, caspase-3, in our in vitro model. HCEnC-21T and HCECi cells were subject to a time-dependent analysis with 50 μM MN detected by Western blotting (Fig. 5A–C). STS served as a positive control of apoptosis. Cleaved caspase-9, 35 and 37 kDa, was detected at 1 h with increasing expression at 2 and 4 h in HCEnC-21T cells (Fig. 5A), while in HCECi cells, peak expression of cleaved caspase-9 was seen at 4 h (Fig. 5B). In FECDi cells, cleaved caspase-9 was already detected at baseline (Fig. 5C). Procaspase-9 did not vary with or without treatment in HCEnC-21T or HCECi cells; however, FECDi cells had slightly higher expression of procaspase-9 compared with normal cells. The release of cytochrome c into the cytoplasm is a critical component in caspase-9 activation and therefore subsequent caspase-3 activation. Increased expression of cleaved caspase-3, 17 and 19 kDa, was observed at 4 h in HCEnC-21T cells (Fig. 5A, lower blot), while caspase-3 cleavage was observed starting at 1 h in HCECi cells (Fig. 5B, lower blot). Interestingly, FECDi cells had higher cleaved caspase-3 expression at baseline (Fig. 5C), suggesting that FECDi cells are prone to cell death.
Discussion
Corneal endothelium is a postmitotic cell type, which is susceptible to oxidative macromolecular damage due to lifelong exposure to sunlight and robust metabolic activity controlling corneal deturgescence. This study provides the first line of evidence presenting accumulation of oxidative DNA damage in FECD endothelium that in turn leads to depletion of mtDNA, mitochondrial dysfunction, fragmentation, and subsequent induction of endothelial cell death. In this study, we modeled the rosette formation in FECD by inducing endogenous oxidative stress with MN to depict a temporal relationship in the sequence of pathogenic events. MN is specifically relevant to the study of FECD as it is metabolized by the reductive system found to be deficient in FECD. When MN is neutralized by 2-electron reduction by NAD(P)H quinone dehydrogenase 1 (NQO1), it forms a stable hydroquinone without abnormal ROS generation. In FECD, there is decrease in Nrf2-dependent antioxidant defense shown by decreased nuclear Nrf2 translocation and the ability to upregulate antioxidant response element-dependent antioxidants, such as NQO1 (2). Due to the deficient 2-electron reductive scavenging by NQO1, it is envisaged that MN is reduced by the 1-electron pathway, causing greater internal ROS production and overwhelming the antioxidant system that is dysfunctional in FECD (35). Treatment of HCEnCs with MN induced rosette formation, seen in FECD specimens, and decreased mitochondrial bioenergetic function such as ATP and MMP levels, leading to mitochondrial fragmentation and cytochrome c release, findings seen in FECD cells at baseline.
We show that HCEnCs in FECD accumulate DNA damage, which can be induced in normal endothelium with MN. The long-extension PCR technique was utilized to analyze genomic injury, rendering this to be the first study quantifying MN-induced DNA damage by LX-PCR. Previous studies have shown a dose-dependent increase in mtDNA damage in astrocytes upon exposure to 50, 75, and 100 μM MN for 1 h by Southern blot analysis. The break frequency was significantly higher in oligodendrocytes than astrocytes after 100 μM MN exposure (17). Interestingly, this type of assay did not detect any nDNA damage in neuronal cells after MN treatment. In contrast, our studies detected that MN induced both nDNA and mtDNA damage in the telomerase-immortalized HCEnCs after 50 μM. This difference between the studies could be attributed to the variability in the cell type response to MN and immortalization methods. In addition, qPCR has higher sensitivity in detecting DNA lesions than Southern blot analysis, which detects lesions per 50 kbs compared with per 10 kbs by qPCR. However, consistent with previous reports, our study found that MN-induced mtDNA lesion frequency was greater than that of nDNA in both cell lines, indicating that MN targets mtDNA more efficiently compared with nDNA (45). Interestingly, MN did not further increase DNA damage in FECDi. One of the possibilities is that the diseased cells have activated basal DNA repair, which was fairly effective in dealing with more stress once the cells were exposed to MN. More likely, FECDi cells have undergone more damage by MN and later died and thus were not captured by LX-PCR.
Our study detected that the central mechanism of HCEnC death in FECD, including that from MN, was increased generation of superoxide in mitochondria, loss of ΔΨm, and depletion of ATP levels. Therefore, mtDNA damage likely has a significant contribution to the subsequent decline in mitochondrial physiology in FECD. Potential sources of mitochondrial dysfunction are superoxide-induced lipid peroxidation as well as inactivation of ETC due to decline in the mtDNA transcript levels (36, 45). Mitochondrial DNA encodes key protein components of the oxidative phosphorylation system involved in ATP production, lack of which leads to mitochondrial dysfunction. In support of this, we showed the correlation between loss of ΔΨm and decline in ATP levels after exposure to 50 μM MN for 2 h, the dose at which mtDNA damage was induced in both normal HCEnC lines. Such DNA-damaging effects could be due to net damage being greater than repair mechanisms involved and possible loss of trafficking of nuclear encoded proteins from the cytosol to mitochondria due to loss of ΔΨm, further potentiating the compromise of the repair activity in the mitochondria (39). Future studies should investigate further whether the damage seen in FECD is caused by the abnormal repair of nDNA and mtDNA in the diseased cells.
In normal HCEnCs, mitochondria form interconnected reticular networks that depend on mitochondrial fusion to maintain healthy mitochondrial morphology and function. In our study, loss of ΔΨm led to mitochondrial fragmentation and inability to maintain the network, consistent with previous reports indicating the requirement of ΔΨm to maintain healthy mitochondrial filamentous networks (18). Mitochondrial fragmentation was preceded by rosette formation and MN-induced DNA damage—the findings have not yet been conclusively correlated with mitochondrial fission in the past. There is a scarcity of evidence in the literature linking DNA damage with mitochondrial fission or lack of fusion. In contrast to our findings, DNA-damaging agents such as camptothecin caused mitochondrial fusion, not fission, in cortical neurons (44). Mitochondrial fusion was mediated by p53 activation, while p53-independent apoptotic stress, such as the one induced by STS, led to mitochondrial fragmentation. Apoptosis in FECD has been shown to be p53 dependent, but mitochondrial fission, and not fusion, was present in ex vivo specimens and the MN stress model (2). Similarly, oxidative insult due to H2O2 was shown to induce changes in mitochondrial morphology (19, 20). Our study indicates that during rosette formation, DNA damage and depletion of ATP along with the fall in ΔΨm likely lead to unbalanced fission and potential activation of autophagy/mitophagy, explaining the findings of markedly decreased mtDNA copy number in FECD endothelial specimens and cells. In support of this, induction of mitochondrial fragmentation with Phen, a DNA-damaging agent, leads to a decline in the mitochondrial DNA content and loss of mitochondrial mass in HeLa cells (33). Similarly to the findings in FECD specimens, a low content of mtDNA has been detected in the cerebrospinal fluid of Alzheimer's disease patients and has been postulated to be a causal factor for mitochondrial-driven neurodegenerative processes (34).
The biological consequence of mitochondrial dysfunction and fission in FECD is cell death (11, 28). We demonstrated that intracellular oxidative stress led to cytochrome c release and cleavage of caspase-9 and caspase-3 in HCENC-21T cells. Interestingly, FECDi demonstrated cleaved caspase-9 and caspase-3 bands without MN treatment, indicating activation of the apoptotic pathways at baseline. Similarly, MN induced caspase activation in MCF-9 cells, in cortical neurons, and pancreatic cells (1, 14, 40). Moreover, MN induced mtDNA damage, followed by cytochrome c release and caspase-dependent cell death in oligodendrocytes and microglia, with 100 μM MN treatment for 3 h, but did not cause significant cytochrome c release and caspase activation due to efficiently repaired mtDNA damage in astrocytes (17). However, another study has shown that MN-induced mitochondrial ROS causes mitochondrial dysfunction and cellular ATP depletion, but leads to caspase-independent cell death in mouse hippocampal neurons (12). Inability to activate caspases was attributed to MN-induced depletion of intracellular ATP levels, which are required for apoptosome formation. Our study detected a reduction in ATP levels after 1 h of 50 μM MN treatment, but ATP stores were most likely not depleted, fully allowing parallel caspase activation seen in FECD.
In summary, a temporal link between oxidative DNA damage and mitochondrial fission during rosette formation provides novel insight into the general mechanisms of mitochondrial response to genotoxic stress. These studies turn our focus on the development of novel cytoprotective and antiaging therapies as potential options for treatment of mitochondrial dysfunction in FECD and other oxidative stress disorders.
Materials and Methods
Cell culture
Normal and FECD human corneal endothelial cell lines (HCECi and FECDi,), immortalized by infection of amphotropic recombinant retrovirus containing human papillomavirus type 16 genes E6 and E7, were gifts from Dr. May Griffith (Ottawa Hospital Research Institute, Ottawa, Ontario, Canada) and Dr. Rajiv R. Mohan (University of Missouri Health System, Columbia, MO) (15, 16). HCEnC-21T cells were immortalized by retrovirus transfection containing pBABE-puro-hTERT (38).
Human tissue
This study was conducted according to the tenets of the Declaration of Helsinki and approved by the Massachusetts Eye and Ear Institutional Review Board. Written and informed consent was obtained from patients undergoing surgical treatment for FECD. After surgical removal, the tissue was immediately placed in storage medium (Optisol-GS; Bausch & Lomb) at 4°C. Normal donor corneas (n = 41, age range 53–86) were purchased from National Disease Research Interchange or Tissue Banks International according to the criteria previously reported (21). FECD endothelium (n = 48) was derived from postkeratoplasty specimens (age range 47–82).
Cellular viability and morphology
HCEnC-21T, HCECi, and FECDi cells were plated as previously described (2). Cells were incubated with 1, 10, 25, 50, and 100 μM MN (Sigma-Aldrich) in DMEM (Life Technologies) with or without pretreatment with NAC (5 mM; Sigma-Aldrich) for 1 h. The cell number and viability were measured using an automatic cell counter (Countess; Life Technologies) and trypan blue dye exclusion, respectively. Phase-contrast microscopy (Leica DM IL LED) was employed to detect cell morphology.
Detection of DNA damage using long-extension QPCR
Total genomic DNA was isolated from HCEnC, HCECi, FECDi, and corneal human specimens (31 FECD and 22 normal corneas for mtDNA and 11 FECD and 15 normal for nDNA) and LX-PCR was performed and analyzed as previously described (13, 26, 37, 44). Specific primers were used to amplify mtDNA and nDNA (26). Conditions for each primer set were empirically optimized to ensure that the assay was in the linear range. The thermocycler (Biorad T100; Biorad) program included an initial denaturation at 94°C for 30 s, 26 cycles for β-globin (16 and 14 cycles for large and small mitochondrial target) at 94°C for 30 s, annealing at 64°C for 30 s, and extension at 68°C for 13:30 min for β-globin (8:50 min for large mitochondrial target and 30 s for small mitochondrial target). DNA lesion frequencies were calculated as described (36). Two-way analysis of variance (ANOVA) was utilized for statistical analysis, with p-values corresponding to <0.05 (*) as significant.
Intracellular ATP levels
After determining cellular viability, cells were resuspended in 100 μl warm HBSS and transferred to a 96-well plate, and ATP content was determined with recombinant firefly luciferase and D-luciferin in all three cell lines (HCEnC-21T, HCECi, and FECDi) using a bioluminescence ATP Determination Assay Kit (Molecular Probes).
Detection of intracellular ΔΨm using JC-1 dye
Cells were cultured in 12-well plates and stained using JC-1 dye (Cayman Chemical) according to the manufacturer's instructions for 15 min at 37°C, followed by a readout at 488/535 nm excitation and 590 nm emission wavelengths to measure green and red fluorescence as readout of ΔΨm.
Mitochondrial superoxide detection
MitoSOXTM Red (Molecular Probes) was used for detection of mitochondrial superoxide production. Cells were treated with MN and washed with HBSS. A 5 mM stock of MitoSOX was prepared according to the manufacturer's protocol and 2.5 μM MitoSOX was added to the cells for 15 min at 37°C in the dark. Cells were washed, trypsinized, and centrifuged at 1200 rpm for 5 min. The pellet was washed and centrifuged at 1200 rpm for 5 min and resuspended in HBSS, and fluorescence intensity was analyzed using FACSCalibur™ (BD Biosciences).
Immunofluorescence staining
HCEnC-21T cells were seeded on two-well chamber slides and treated with 50 μM MN for 1, 2, 4, and 6 h. Rotenone (1 μM; Sigma-Aldrich) for 2 h was used as a positive control. In addition, HCEnC-21T cells were pretreated with or without 50 μM of the pan-caspase inhibitor, zVAD-fmk (Peptide Institute, Inc.), followed by 50 μM MN treatment for 1, 2, 4, and 6 h. Cells were fixed using 4% paraformaldehyde for 20 min at room temperature, permeabilized for 20 min using 0.15% Triton-X in PBS, and blocked for 1 h in 10% BSA (w/v). Tissue of FECD and normal donors was fixed using 4% PFA for 20 min at room temperature (RT), permeabilized using 0.3% Triton-X in 10% normal goat serum for 1.5 h at RT, and blocked for 30 min with 10% BSA. Cytochrome c (BD Bioscience #556432,) or clusterin (Santa Cruz Biotechnology; sc-8354) primary antibody was used overnight at 4°C, followed by secondary Alexa546 or 488-conjugated antibody (Invitrogen) for 1–2 h at RT. For the negative control, only secondary antibody was used. Nuclei were stained with DAPI (Vectashield; H1000) and observed using confocal microscopy (Zeiss) with different magnifications (40x zoom 1.5 and zoom 4). Specimens of 5 FECD donors (62F, 64 F, 61 M, 74 F, 81 F) and 4 normal cornea donors (52 F, 59 M, 72 M, 74 M) were used.
Western blotting
Cells were lysed in RIPA buffer containing HALT protease and phosphatase inhibitors (Thermo Fisher Scientific) for 30 min on ice. Protein concentration was determined using the BCA assay (Thermo Fisher Scientific) and samples were loaded onto a 12% Bis-Tris gel for SDS-PAGE and electrophoresed, followed by blotting onto a polyvinylidene difluoride membrane (Millipore). The membrane was blocked in 5% nonfat milk in PBS 0.1% Tween-20 (PBST) for 1 h and incubated overnight with primary antibody at 4°C. Primary antibodies (Cell Signaling) used were caspase-9 (#9502), cleaved caspase-9 (#9501), caspase-3 (#9665), cleaved caspase-3 (#9664), and β-actin (Sigma Aldrich). Blots were exposed to HRP-conjugated anti-mouse or -rabbit IgG (Jackson ImmunoResearch Laboratories, Inc.) for 1 h. The membrane was developed with chemiluminescent substrate (Thermo Fisher Scientific).
Real-time reverse transcription–polymerase chain reaction
Total RNA was extracted from HCEnC-21T cells using an RNeasy extraction kit (Qiagen), as previously described (5). cDNA was prepared using the iScript cDNA synthesis kit (Biorad). TaqMan primers and probes for CLU (hs00156548_m1) and TGFBI (hs00932747_m1) and GAPDH (hs99999905_m1) were obtained from Applied Biosystems. Real-time PCR reactions were set up in triplicate (Probe Fast master mix; Kapa Biosystems) using the comparative threshold cycle (CT) method with the ABI StepOne Plus qPCR instrument (Applied Biosystems). Results were the average relative expression of the different genes normalized to GAPDH.
Footnotes
Acknowledgment
This work was supported by NEI/NIH R01 EY020581.
Author Disclosure Statement
No competing financial interests exist.
Abbreviations Used
References
Supplementary Material
Please find the following supplemental material available below.
For Open Access articles published under a Creative Commons License, all supplemental material carries the same license as the article it is associated with.
For non-Open Access articles published, all supplemental material carries a non-exclusive license, and permission requests for re-use of supplemental material or any part of supplemental material shall be sent directly to the copyright owner as specified in the copyright notice associated with the article.