
Abstract
Aims:
A loss in brain acetylcholine and cholinergic markers, subchronic inflammation, and impaired mitochondrial function, which lead to low-energy production and high oxidative stress, are common pathological factors in several neurodegenerative diseases (NDDs). Glial cells are important for brain homeostasis, and microglia controls the central immune response, where α7 acetylcholine nicotinic receptors (nAChR) seem to play a pivotal role; however, little is known about the effects of this receptor in metabolism. Therefore, the aim of this study was to evaluate if glial mitochondrial energetics could be regulated through α7 nAChR.
Results:
Primary glial cultures treated with the α7 nicotinic agonist PNU282987 increased their mitochondrial mass and their mitochondrial oxygen consumption without increasing oxidative stress; these changes were abolished when nuclear erythroid 2-related factor 2 (Nrf2) was absent, heme oxygenase-1 (HO-1) was inhibited, or peroxisome proliferator-activated receptor gamma coactivator 1α (PGC-1α) was silenced. More specifically, microglia of animals treated intraperitoneally with the α7 nAChR agonist PNU282987 (10 mg/kg) showed a significant increase in mitochondrial mass. Interestingly, LysMcre-Hmox1Δ/Δ and PGC-1α−/− animals showed lower microglial mitochondrial levels and treatment with PNU282987 did not produce effects on mitochondrial levels.
Innovation:
Increases in microglial mitochondrial mass and metabolism can be achieved via α7 nAChR by a mechanism that implicates Nrf2, HO-1, and PGC-1α. This signaling pathway could open a new strategy for the treatment of NDDs, such as Alzheimer's, characterized by a reduction of cholinergic markers.
Conclusion:
α7 nAChR signaling increases glial mitochondrial mass, both in vitro and in vivo, via HO-1 and PCG-1α. These effects could be of potential benefit in the context of NDDs. Antioxid. Redox Signal. 27, 93–105.
Introduction
A
Mitochondria are the main producers of adenosine triphosphate (ATP), and therefore, a reduction in their number or functionality is translated into a reduction in brain energetic metabolism, which alters brain function. Beyond energy production, mitochondria serve for multiple functions, such as controlling the levels of metabolites, amino acids, or cofactors of regulating enzymes, synthesis of heme and Fe-S clusters, and calcium homeostasis (25). Therefore, strategies based on increasing mitochondrial number could be of potential interest to provide neuroprotection.
Increases in microglial mitochondrial mass and metabolism can be achieved via the α7 nicotinic acetylcholine receptor (nAChR) by a mechanism that implicates nuclear erythroid 2-related factor 2 (Nrf2) heme-oxygenase-1 (HO-1) and peroxisome proliferator-activated receptor gamma coactivator 1α (PGC-1α). By improving microglial mitochondrial function through activation of this new pathway, the brain could, in principle, better resolve inflammation and contribute to reduce pathology.
Mitochondria have a limited half-life and cells can respond to different situations by controlling their mitochondrial content by different pathways, among others through mitochondrial biogenesis. Mitochondrial biogenesis is a highly controlled and coordinated mechanism that implicates the transcription of both, nuclear and mitochondrial genes. There are a large number of physiological and pathological situations that demand an increase in mitochondrial number, such as nutrient deficits, temperature changes, exercise, hormones or growth factors (40), and inflammatory resolution (34). Different transcription factors are implicated in mitochondrial biogenesis, such as the nuclear respiratory factors (NRF-1 and NRF-2), members of the nuclear receptor (NR), the peroxisome proliferator-activated receptors (PPARs), the estrogen-related receptors (ERRs) (13), or additional transcription factors, including YY1, MEF2, and c-myc (41). Regardless of the transcription factor implicated, these signals converge in the activation of transcriptional coactivator peroxisome proliferator-activated receptor gamma coactivator-1α (PGC-1α) which acts as the master regulator of mitochondrial biogenesis.
PGC-1α integrates the activity of a variety of transcription factors such as NRF1-2, PPARα, and mitochondrial transcription factor A (mtTFA), regulating the generation of new mitochondria and the cellular energetic status (6, 10, 13). Several studies have demonstrated that PGC-1α is involved in the activation of the mitochondrial respiratory chain and fatty acid oxidation genes, and also in increasing mitochondrial number and respiratory capacity (41). PGC-1α also plays a pivotal role in controlling the cellular antioxidant responses since it controls the expression of many antioxidant genes such as glutathione peroxidase, catalase, or superoxide dismutase-1 (43). In this way, PGC-1α controls the generation of new mitochondria without increasing cellular oxidative stress. Moreover, deficiency in PGC-1α relates to early neurodegeneration (17) and alterations in this transcription factor have been related to the progression of different neurodegenerative diseases (NDDs) (4a).
Nicotinic acetylcholine receptors (nAChRs) are a family of ion-gated channels, which are expressed both in the periphery and in the central nervous system (CNS). Within the brain, the α7 nAChR subtype is expressed both in neurons, where it controls neurotransmission or neurite outgrowth, and in microglia, where it is known to control the cholinergic anti-inflammatory pathway. Furthermore, its activation has been reported to exert neuroprotection against a variety of pathological situations (12, 36); the intracellular signaling pathway to afford neuroprotection includes activation of the transcription factor nuclear erythroid 2-related factor 2 (Nrf2) (12, 22, 30), considered as the master regulator of redox homeostasis. When Nrf2 is activated it promotes the expression of phase II antioxidant enzymes to protect against oxidative damage. Among these phase II antioxidant enzymes, the role of heme-oxygenase-1 (HO-1) must be highlighted.
HO-1 catalyzes the rate-limiting step of the degradation of heme group generating carbon monoxide (CO); biliverdin, which is rapidly converted to bilirubin by biliverdin reductase; and ferrous iron. Both HO-1 and its three by-products have antioxidant and cytoprotective effects (2, 27), and HO-1 also has an anti-inflammatory effect as its activity is accompanied by the expression of IL-10 and IL-1βRa (34). Interestingly, the HO-1/CO axis has been reported to control mitochondrial biogenesis in a way that implies superoxide dismutase 2 (SOD2) expression and mitochondrial H2O2 production, which leads to the induction of Nrf2 via Akt/PKB and binding to the NRF-1 promoter (47). As a result, this transcriptional mechanism links the mitochondrial expansion to the antioxidant and counterinflammatory defenses.
Microglia are considered the resident macrophages of the CNS and are responsible for the brain's innate immune system. During aging, microglia lose their homeostastic functional role and could contribute to neurodegeneration (45, 46). By improving glial mitochondrial function, the brain could, in principle, better resolve inflammation and contribute to reduce pathology. Based on the participation of HO-1 in mitochondrial biogenesis (33, 34), in this study we have focused on the participation of the glial α7 nAChR in the generation of new mitochondria. Our results show that activation of α7 nAChR in glial cells increases mitochondrial mass and improves cellular mitochondrial respiration, both processes dependent on HO-1 and PGC-1α activity.
Results
The α7 nAChR agonist PNU282987 increased mitochondrial mass in glial cells
Our group and others have previously described the anti-inflammatory and antioxidant properties mediated by α7 nAChRs (12, 22). Due to the close relationship between those processes and mitochondrial biogenesis (34, 43), we thought of interest to study if α7 nAChR signaling could be increasing the mitochondrial content. To address this question, we used primary glial cultures treated with the specific α7 nAChR agonist, PNU282987, at a concentration of 10 μM during 48 h; thereafter, different methodological approaches were used to evaluate if changes in mitochondrial mass were taking place. Using the fluorescent stain MitoTracker-Green (Mtg), which is characterized for being independent of mitochondrial potential, we measured the mitochondrial content by flow cytometry. With this protocol, we obtained that cells treated with PNU282987 presented a higher mitochondrial content, comparable to the results obtained with the positive control resveratrol (Fig. 1A). We also labeled glial cells with Mtg and took images in a confocal microscope, observing higher fluorescent levels in cells treated with PNU282987 (Fig. 1B).
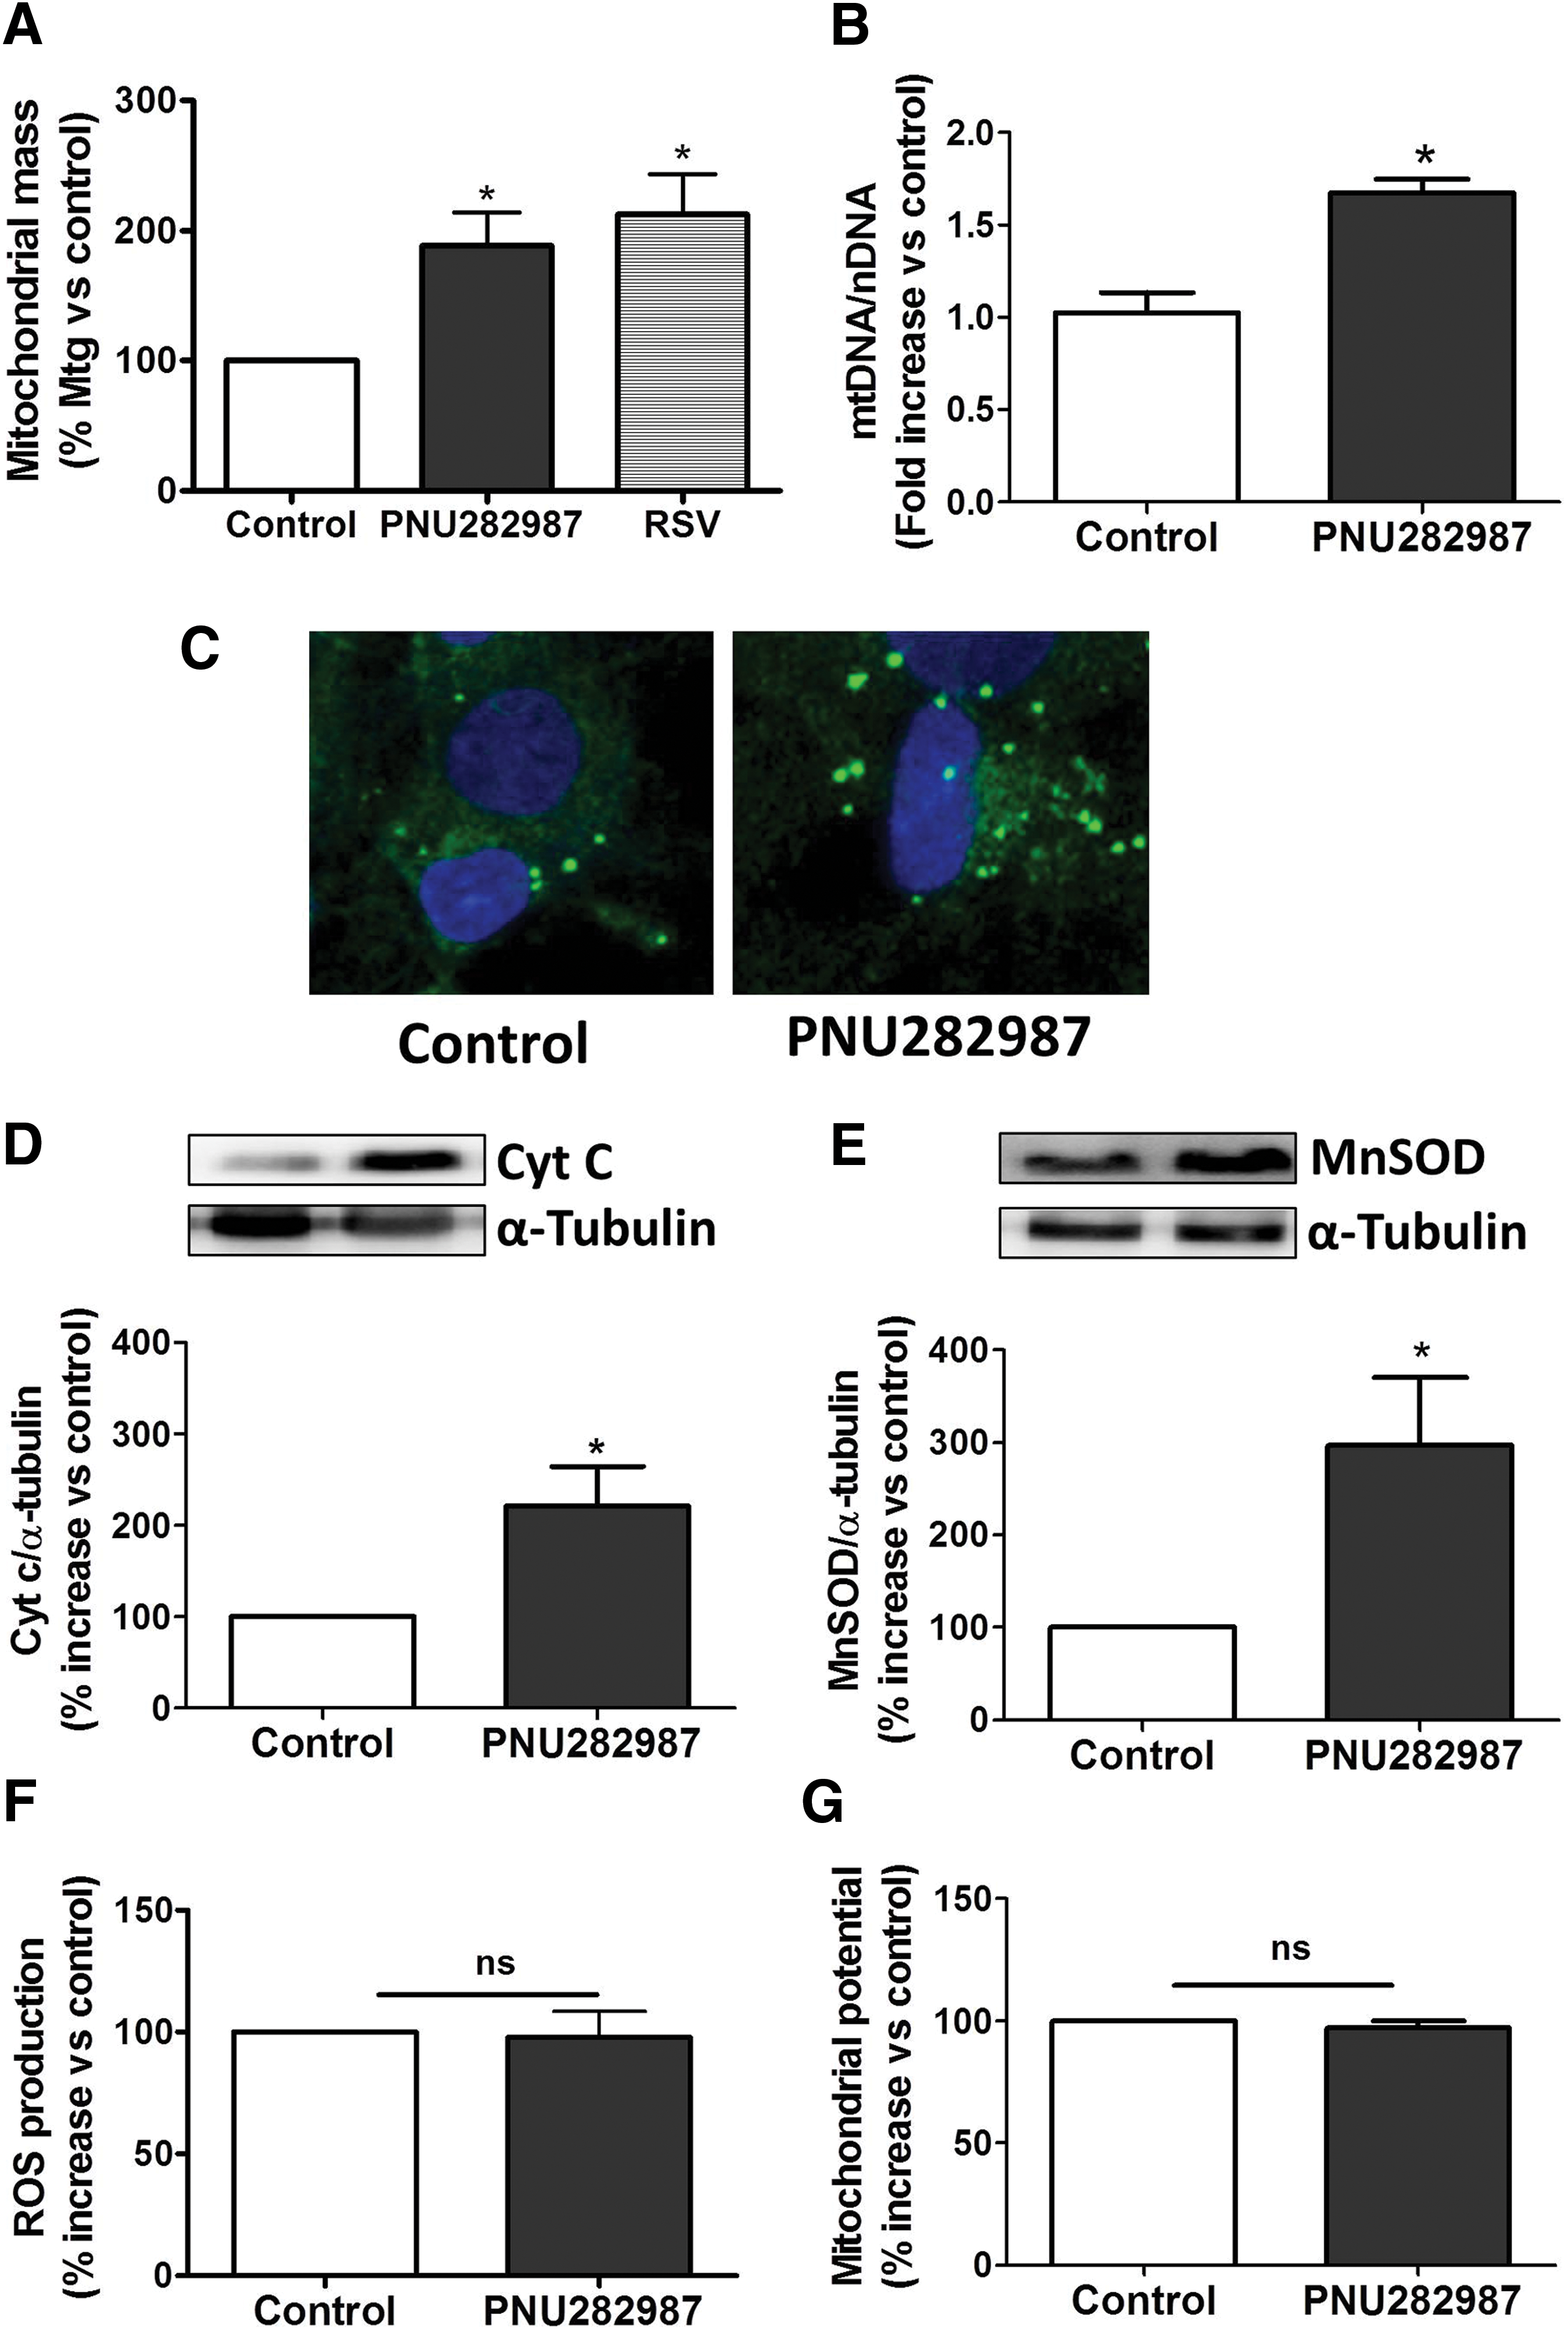
To ensure the results above, the expression of mitochondrial proteins, such as cytochrome c and manganese SOD (MnSOD), was also measured by Western blot. As shown in Figure 1C and D, PNU282987-treated glial cells increased by two- and threefold the expression of cytochrome c and MnSOD, respectively. Taken together, we can conclude that the treatment of glial cells with the α7 nAChR agonist increased mitochondrial mass.
The increase in mitochondrial mass was not associated with increased ROS production or mitochondrial membrane potential alterations
The main source of oxidative stress within the cell is the mitochondria and excessive ROS production can be deleterious to the cells. Therefore, we analyzed if the increase in mitochondrial content elicited by PNU282987 was accompanied by an increase in ROS production or alterations in mitochondrial membrane potential. For that purpose, we labeled the cells with the fluorescent dyes 2′,7′-dichlorofluorescein diacetate (H2DCFDA; to measure ROS) and tetramethylrhodamine, ethyl ester, perchlorate (TMRE; to assess changes in mitochondrial potential) and analyzed them by flow cytometry. We obtained that the increase in mitochondrial mass elicited by PNU282987 was not associated to changes in cellular redox status as we did not observe changes in H2DCFDA fluorescence (Fig. 1E). Furthermore, no mitochondrial membrane potential changes were detected using the ratio TMRE/Mtg (Fig. 1F).
Glial cells exhibit a higher mitochondrial respiratory efficiency after PNU282987 treatment
Changes in the cellular mitochondrial content are not always accompanied by alterations in respiratory parameters. To assess if PNU282987 treatment had any effect on mitochondrial bioenergetics, we used the XF24 Extracellular Flux Analyzer (Seahorse Bioscience, North Billerica, MA) to determine the oxygen consumption rate (OCR) in cultured cells (Fig. 2A). OCR was measured in control conditions, after the addition of oligomycin to determine the oxygen consumption linked to ATP synthesis, and after the addition of the uncoupling agent 2,4-dinitrophenol (DNP) to obtain the maximal respiratory capacity. At the end of each measurement, rotenone plus antimycin A were added to completely block mitochondrial respiration and to determine the nonmitochondrial respiration. This value was subtracted to all conditions.
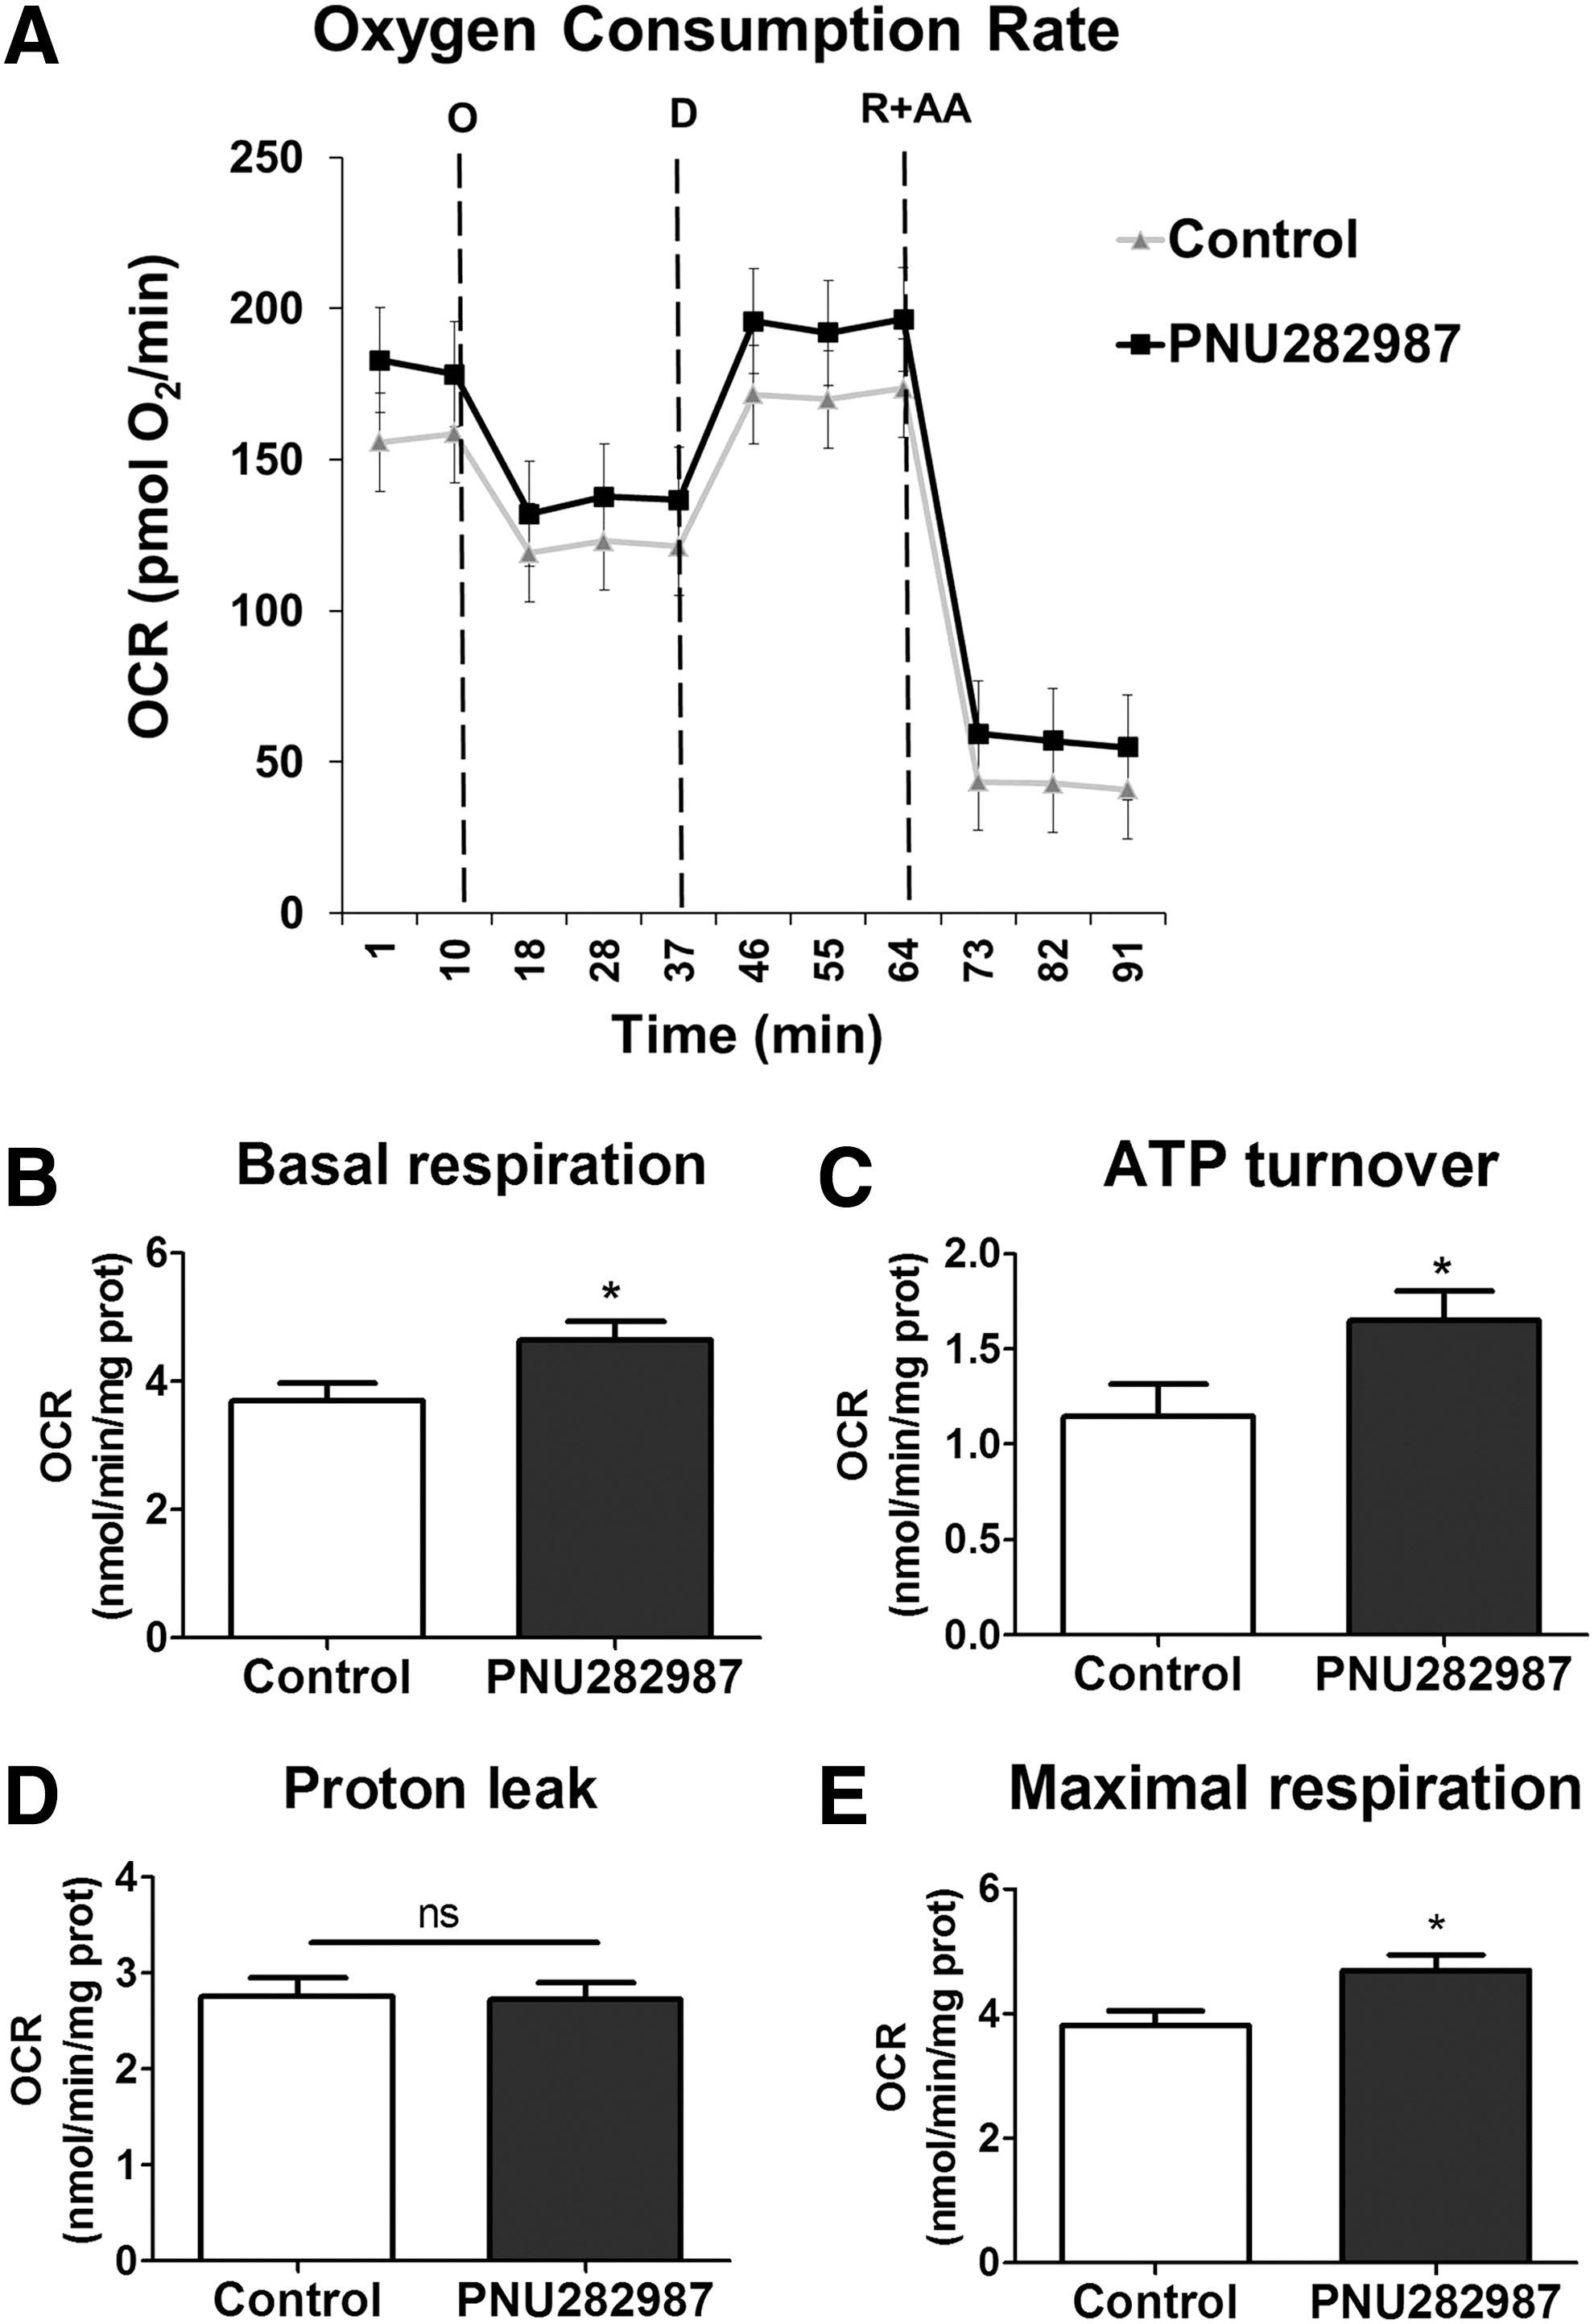
Our results show that PNU282987 increased OCR levels under basal conditions (Control 3.7 ± 0.28 nmol/min·mg protein; PNU282987: 4.65 ± 0.29 nmol/min·mg protein; Fig. 2B). Moreover, PNU282987 also increased the OCR due to ATP turnover (Control: 1.14 ± 0.18 nmol/min·mg protein; PNU282987: 1.65 ± 0.15 nmol/min·mg protein; Fig. 2C), whereas it had no effect on the proton leak (Fig. 2D). The α7 nAChR agonist also improved the maximal respiratory capacity of glial cells (Control: 3.81 ± 0.24 nmol/min·mg protein; PNU282987: 4.69 ± 0.26 nmol/min·mg protein; Fig. 2E). Taken together, these results indicate that the increase in mitochondrial mass elicited by PNU282987 treatment is accompanied by an increase in mitochondrial oxygen consumption and ATP synthesis.
Changes observed in mitochondrial mass were α7 nAChR specific and dependent on Nrf2/HO-1
It has been previously described how signaling mediated by α7 nAChR leads to an induction in HO-1 enzyme via Nrf2 transcription factor (22, 31). Since HO-1 has been reported to participate in mitochondrial biogenesis (33, 38), we decided to evaluate the implication of Nrf2/HO-1 in the effects elicited by PNU282987.
First of all, we performed glial cultures from wild-type (WT) and Nrf2−/− mice and observed that the increase in mitochondrial population elicited by PNU282987 was lost when Nrf2 was absent (Fig. 3A). To study the implication of HO-1, we first confirmed that treatment with the α7 nAChR agonist produced an induction of the enzyme; indeed, PNU282987 almost doubled the basal expression of HO-1 (Fig. 3B). Then, by inhibiting HO-1 with 3 μM tin protoporphyrin-IX dichloride (SnPP), the increase in mitochondrial mass induced by the α7 nAChR agonist was lost (Fig. 3B). Furthermore, we used 100 nM α-bungarotoxin (α-Bgtx) as an α7 nAChR blocker to determine that the effects observed with PNU282987 were receptor specific. Glial cultures were treated with PNU282987, in the absence or presence of the HO-1 and α7 nAChR inhibitors, and thereafter, mitochondrial mass and respiratory parameters were assessed. When cells were treated during 48 h with PNU282987 (10 μM) in the presence of α-Bgtx, changes observed in mitochondrial mass (Fig. 3C) and respiratory parameters (basal and maximal respiration, and ATP turnover) were abolished (Fig. 3D, E), indicating that the effects elicited by PNU282987 were specific of α7 nAChR activation. Moreover, the increase in mitochondrial mass (Fig. 3C) and mitochondrial respiration (basal and maximal respiration and ATP turnover) observed with the α7 nAChR agonist was lost when HO-1 was inhibited (Fig. 3D, E). Changes in proton leak were not observed among the different treatments.

These results provide a clear indication that induction of HO-1 via Nrf2 is necessary for mitochondrial biogenesis within the signaling pathway activated by α7 nAChR.
The increase in mitochondrial mass elicited by PNU282987 was dependent on PGC-1α activity
PGC-1α has been widely described as the master regulator of mitochondrial biogenesis but little is known about its relationship with α7 nAChR signaling. In this study, we demonstrate that activation of α7 nAChR produces an increase in the expression of PGC-1α measured by Western blot (Fig. 4A). We also observed activation of pAMPK and pCREB; two proteins associated with the activation of PGC-1α (Fig. 4B, C).

Moreover, mouse embryonic fibroblast (MEF) cells were transfected with the PGC-1α promoter linked to a luciferase reporter gene and they showed increased luciferase activity after Nrf2 transfection or sulforaphane (Sfn) treatment (potent inductor of Nrf2). These results provide evidence on the possible regulation of the expression of PGC-1α via Nrf2 transcription factor.
To assess the implication of PGC-1α in mitochondrial biogenesis activated by α7 nAChR, we used adeno-associated viral infection to silence the expression of PGC-1α and then studied the effect of PNU282987 treatment. Cells were infected for 8 h with the adeno-associated vectors expressing (i) scrambled small hairpin RNA (shRNA; shControl) and (ii) shRNA targeting PGC-1α (shPGC-1α), followed by overnight cell recovery. As shown by Western blot, PGC-1α was silenced in glial cells treated with shPG-1α and not in those treated with scrambled shRNA (Fig. 4E). Afterward, PNU282987 was added during 48 h and mitochondrial mass was assessed as Mtg fluorescence by flow cytometry. As it can be observed in Figure 4F, PGC-1α silencing prevented the changes in mitochondrial mass elicited by PNU282987, highlighting the implication of PGC-1α in the effect that PNU282987 had on this process.
Repeated intraperitoneal injection of PNU282987 increased mitochondrial content specifically in microglia only when HO-1 and PGC-1α were present
To further confirm our results, we decided to assess if the increase in mitochondrial mass mediated via α7 nAChR could be reproduced in vivo. For that purpose, we performed repeated intraperitoneal (i.p.) injections (twice per day) of 10 mg/kg of PNU282987 during 2 days (Fig. 5A). Body weight was monitored throughout the experiment, but no changes were observed (data not shown). Forty-eight hours after the first injection, animals were sacrificed; the microglial population was isolated by Percoll gradient and cells were stained with CD45-FITC, CD11b-PE, and GLAST-APC to confirm the purity of the microglial enrichment protocol. As shown in Figure 5B, the isolated population was positive for CD11b (microglial marker), expressed low levels of CD45 (macrophage marker), and was negative for GLAST (astrocytic marker), indicating that the population isolated was indeed microglia (purity: 82.1% ± 3.4%).
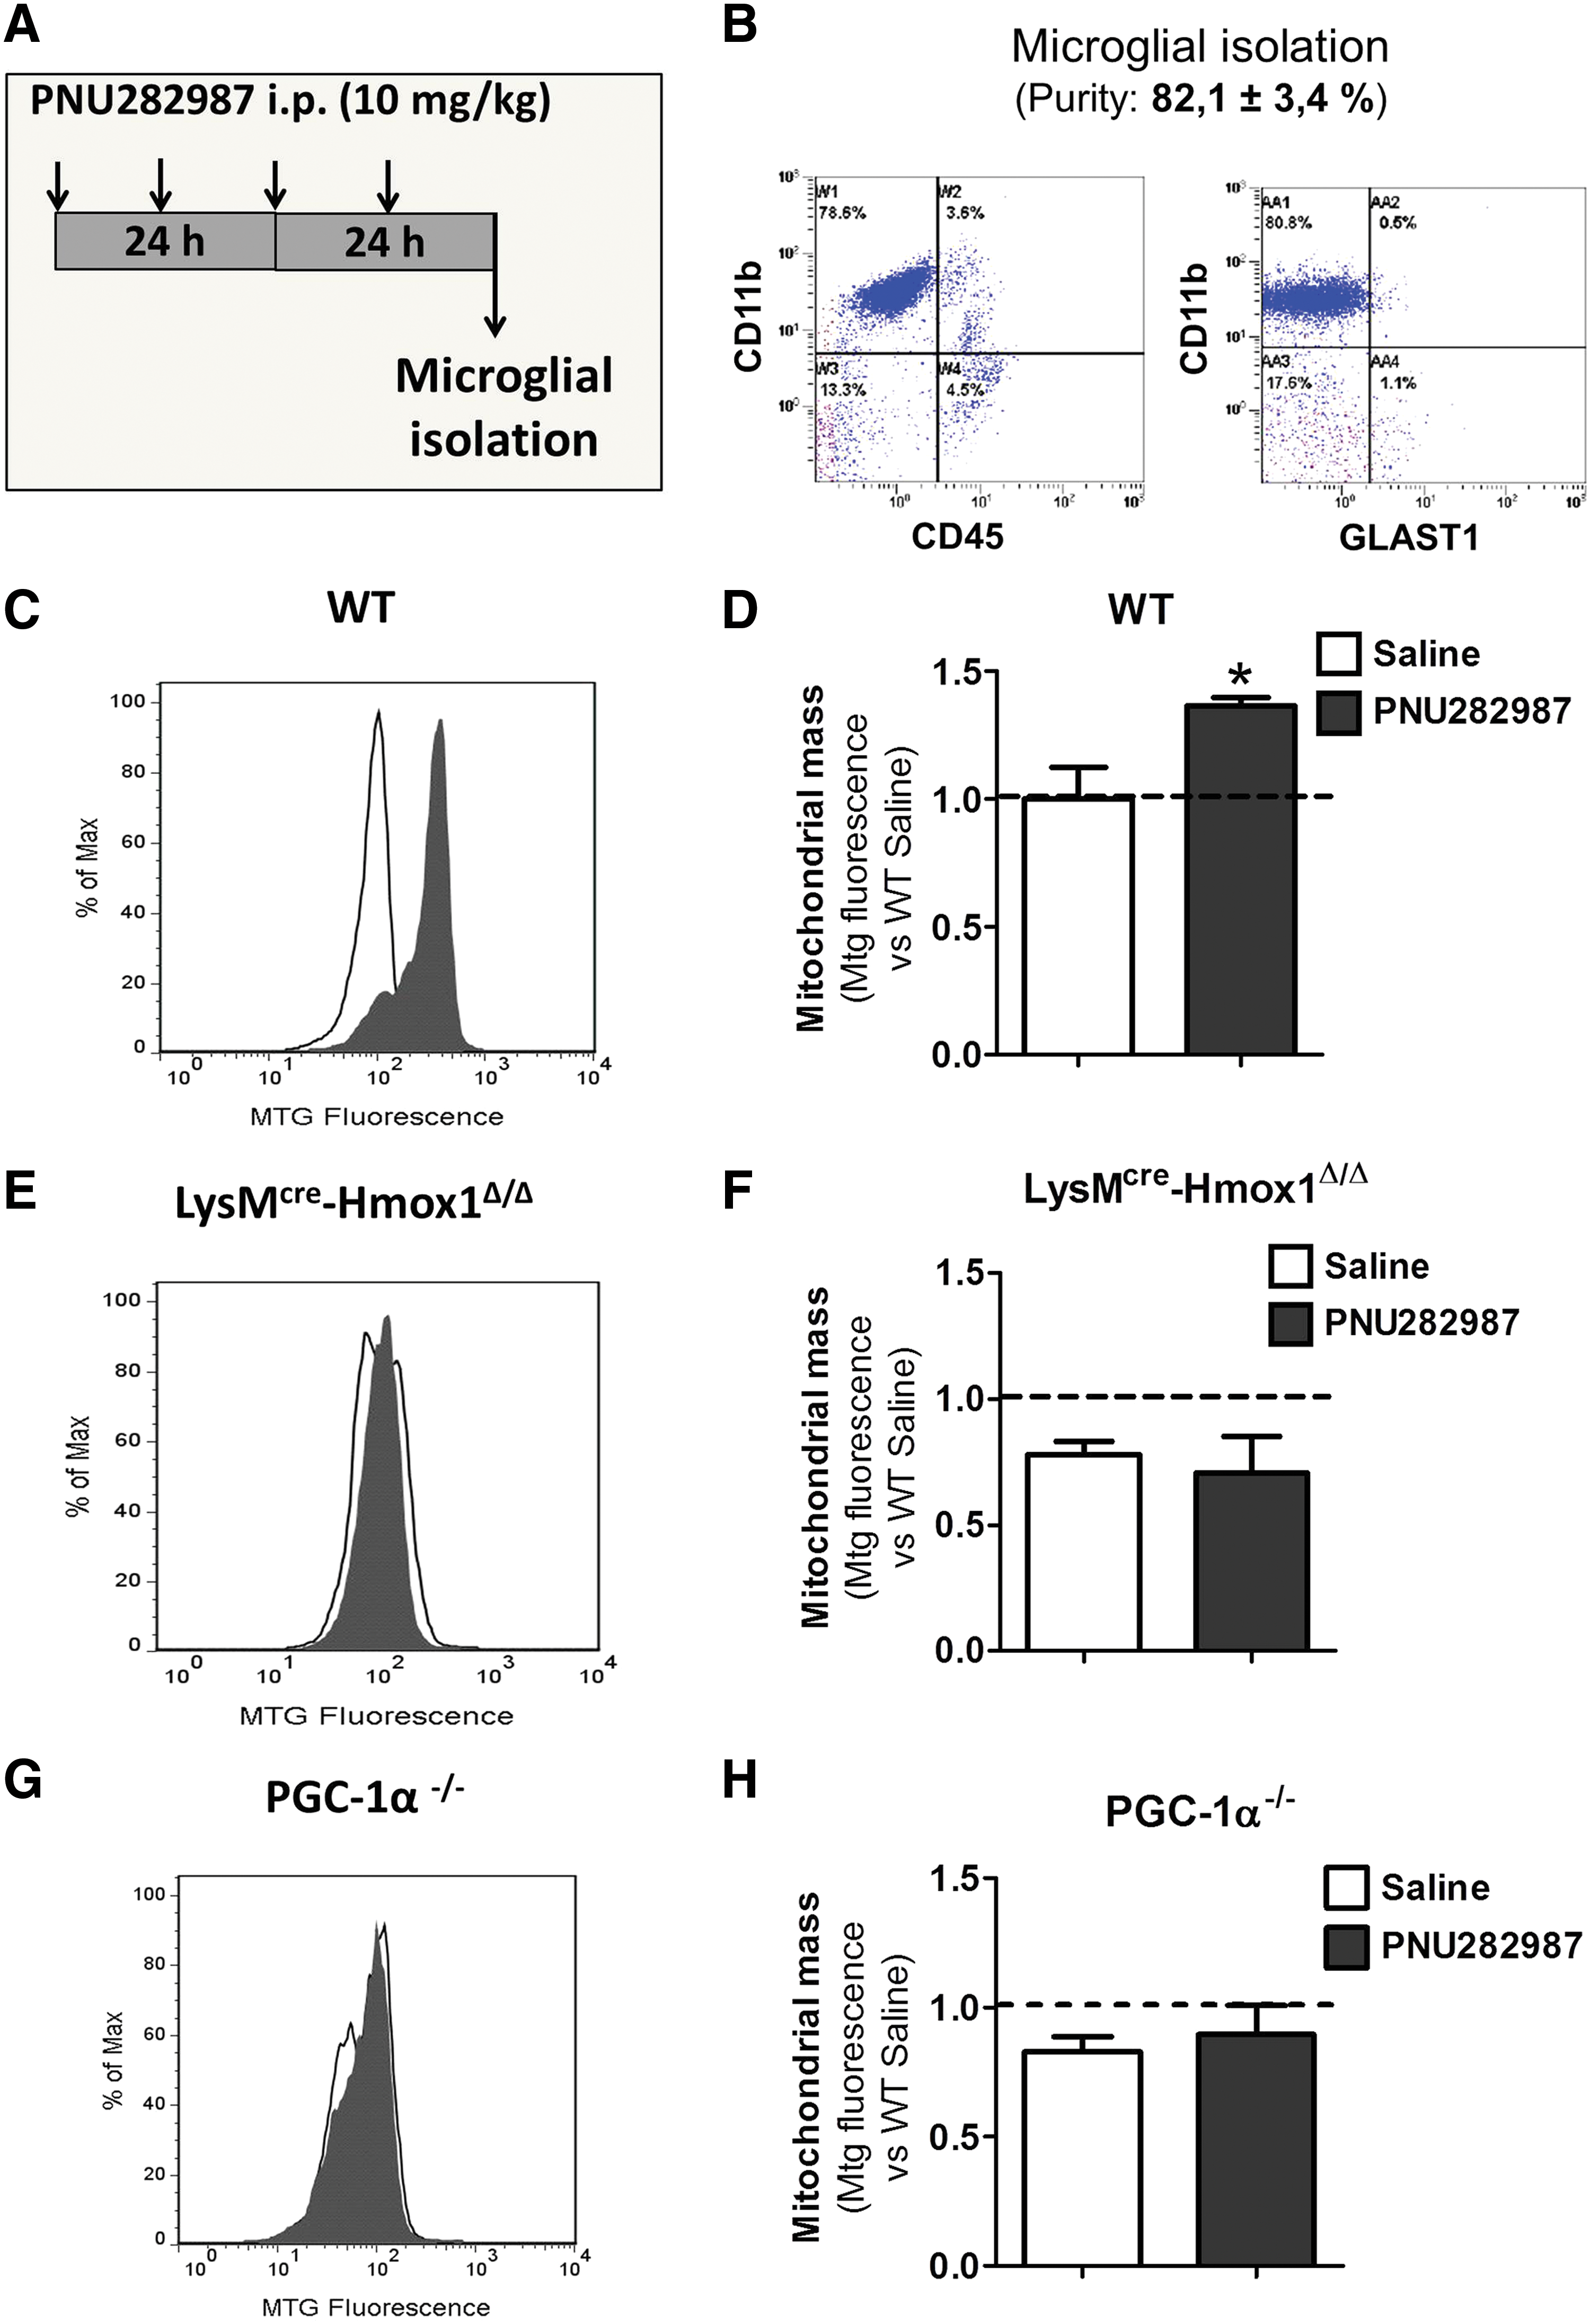
Once the purity of the population was established, cells were stained with CD11b and Mtg to evaluate changes in mitochondrial content in CD11b+ cells after PNU282987 injection. As represented in Figure 5C and D, PNU282987 treatment elicited a significant increase in mitochondrial content in the microglial population of WT animals (Saline: 1.0 ± 0.09 vs. PNU282987: 1.3 ± 0.08).
To establish conclusively the involvement of HO-1 in the effects of α7 nAChR stimulation on mitochondrial biogenesis, we performed the same experiment using LysMcre-Hmox1Δ/Δ animals, in which HO-1 expression is absent specifically in myeloid cells. The results were normalized against their age control littermates, named as WT. Noteworthy was the finding that LysMcre-Hmox1Δ/Δ mice injected with saline presented lower mitochondrial content in comparison with their age control littermates (WT Saline: 1.0 ± 0.08 vs. LysMcre-Hmox1Δ/Δ Saline: 0.78 ± 0.057; Fig. 5D, F). Moreover, LysMcre-Hmox1Δ/Δ animals injected with PNU282987 did not show an increase in mitochondrial content (LysMcre-Hmox1Δ/Δ Saline: 0.78 ± 0.056 vs. PNU282987: 0.71 ± 0.16; Fig. 5E, F), corroborating the previous results obtained in vitro (Fig. 3).
We also aimed to further demonstrate the implication of PGC-1α in the effect of PNU282987 on mitochondrial biogenesis; for this issue we used PGC-1α−/− mice. The absence of PGC-1α produced similar effects to those found in LysMcre-Hmox1Δ/Δ mice. When we analyzed the mitochondrial content in the microglial population, we also observed a decrease in mitochondrial mass in these animals when normalized against PGC-1α+/+ (named as WT; WT Saline: 1.0 ± 0.04 vs. PGC-1α−/− Saline: 0.83 ± 0.063; Fig. 5D, H). Moreover, when PGC-1α−/− animals were injected with PNU282987, no changes were observed in mitochondrial content (PGC-1α−/− Saline: 0.83 ± 0.063 vs. PGC-1α−/− PNU282987: 0.89 ± 0.13; Fig. 5G, H). These observations are in concordance with the results obtained in vitro (Fig. 4).
Taken together, these results highlight the implication of α7 nAChR in promoting mitochondrial biogenesis not only in vitro but also in vivo. Moreover, we provide clear evidence that HO-1 and PGC-1α are necessary to induce the increase in the number of mitochondria elicited by α7 nAChR activation.
Discussion
In this study we show as far as we know, for the first time, that α7 nAChR activation increases the mitochondrial content and respiratory capacity in microglia by a mechanism that implicates Nrf2, HO-1, and PGC-1α.
Mitochondria are crucial organelles for cellular homeostasis, which govern pivotal functions such as ATP production, calcium homeostasis, and apoptosis; therefore, it is known that processes which alter mitochondrial activity can lead to disease. During neurodegeneration, besides mitochondrial dysfunction, a decrease in cholinergic markers such as nAChRs has been recognized (35). Among nAChRs, the α7 subtype is emerging as an interesting target for neuroprotection as it is implicated in a variety of processes. In the CNS, α7 nAChRs are expressed not only in neuronal cells, where they participate in neurotransmission and neurite outgrowth, but also in non-neuronal cells where they participate in several functions such as the control of inflammation (12).
In this study, we provide data for a new effect of the α7 nAChR, such as mitochondrial energetics. Indeed, we have described that α7 nAChR activation (using PNU282987 as agonist) activates glial mitochondrial biogenesis in vitro and in vivo, as evidenced by the following results: (i) treatment of glial cells with PNU282987 increased cellular mitochondrial mass (Fig. 1A–D); (ii) PNU282987 improved mitochondrial respiration (increasing basal oxygen consumption, ATP-linked respiration, and maximal respiration; Fig. 2); and (iii) i.p. administration of PNU282987 (10 mg/kg) increased mitochondrial mass in the microglial population in vivo (Fig. 5C, D).
As a decrease in the number and function of mitochondria seems to play a pivotal role in the development of a wide variety of pathologies such as Alzheimer's disease (AD) or Parkinson's disease (PD), these results position α7 nAChRs as target for neuroprotection. For instance, AD brains are also characterized by a decreased expression of mitochondrial complexes, decreased blood flow, and metabolic failure (16, 21, 37). Moreover, amyloid-beta (Aβ) and tau, both proteins associated to AD, have been reported to inhibit the activity of mitochondrial complexes of the electron transport chain, which derives in decreased synthesis of ATP (39).
Similarly, there are also bioenergetic defects associated to PD. For instance, mutations in parkin, which is a leading cause of PD development, alter mitochondrial biogenesis causing a loss in dopaminergic neurons (44). Moreover, decreases of ATP levels have been related to the widely reported decreased activity in complex I (14, 32, 42). Furthermore, the mitochondrial dysfunction associated to both diseases and other NDDs produces increased ROS levels which, in turn, trigger mitochondrial DNA (mtDNA) mutations, inhibit mitochondrial proliferation, and increase apoptosis, which finally lead to neurodegeneration (4a).
To understand the pathway by which α7 nAChR activates mitochondrial biogenesis, we have focused on the Nrf2/HO-1 axis. Our group has previously described that the neuroprotective properties mediated by α7 nAChR depend on the activation of the Jak2/PI3K/Akt cascade, which finally leads to an overexpression of HO-1 via Nrf2 transcription factor (9, 31).
In this study, we have shown that Nrf2 and HO-1 are necessary for the effects of PNU282987 on mitochondrial mass and function as indicated by the following evidences: (i) PNU282987 did not increase mitochondrial mass in Nrf2−/− animals (Fig. 3A), (ii) the specific inhibitor of HO-1 (SnPP) prevented the increase in mitochondrial mass produced by PNU282987 (Fig. 3C), (iii) α7 nAChR did not produce an increase in mitochondrial respiratory parameters when HO-1 was inhibited (Fig. 3D), and (iv) LysMcre-Hmox1Δ/Δ animals injected with PNU282987 did not show an increase in microglial mitochondrial mass (Fig. 5E, F).
Several authors have previously described that HO-1 could be involved in mitochondrial biogenesis, although the mechanism has not been completely elucidated. This idea was raised by Suliman et al. who reported in 2007 that CO, a by-product of HO-1, increased cardiac mitochondrial biogenesis (47). These results have been corroborated also in hepatoma cells, where mitochondrial biogenesis was activated using a CO-releasing molecule and cobalt protoporphyrin (a HO-1 inducing agent) (15).
These authors demonstrated that this process was abolished when using a CO scavenger, indicating the implication of this by-product. Piantadosi et al. proposed that CO produced by HO-1 would cause the release of H2O2 from mitochondria, which could be activating the Nrf2 transcription factor that binds to the antioxidant response elements (ARE) activating the expression of a wide variety of genes, among them NRF-1, and thus activating mitochondrial biogenesis (33). Although the exact mechanism should be further investigated, our results corroborate the implication of Nrf2/HO-1 in the generation of new mitochondria.
As stated in the Introduction section, PGC-1α is considered the master regulator of mitochondrial biogenesis. In this study, we show that activation of α7 nAChR increases the expression of this transcriptional factor (Fig. 4A), which participates in the changes in mitochondrial mass elicited by PNU282987 (Fig. 4F). There are evidences in the literature that would link the expression of PGC-1α to Nrf2. Indeed, both transcription factors have overlapping functions in regulating the antioxidant system, having been described to increase the expression of SODs or glutathione peroxidase 1 (3), among other antioxidant enzymes. These notions raise the possibility that the expression of one gene could be regulated by the expression of the other.
In this line, PGC-1α has been described to increase the expression of Nrf2 in a model of metabolic imbalance (1), although the direct interaction between them has not been demonstrated. Nevertheless, no changes in Nrf2 mRNA levels were observed when comparing WT and PGC-1α−/− MEF cells (26). On the contrary, the PGC-1α promoter has two ARE core sequences (3, 43) even though they have not been demonstrated to be active. To assess this last regulation, we used PGC-1α promoter linked to luciferase reporter gene and we observed that Nrf2 increased the luciferase activity, indicating that Nrf2 could be controlling the expression of PGC-1α. In addition, pAMPK and pCREB could also be implicated in the activation of PGC-1α since these proteins were also upregulated in cells treated with the α7 nAChR agonist (Fig. 4B, C).
Taking into account that a decrease in PGC-1α or alterations in its signaling have been described in NDDs (4a) and PGC-1α knockout mice show neuropathology at earlier stages (17), these results are interesting from a pharmacological point of view. For that reason, compounds that could restore energy production and antioxidant capacity would be useful for the treatment of these pathologies and this is why PGC-1α is emerging as a new therapeutic target for neurodegenerative disorders (4a). Our results describe that the changes in mitochondrial mass elicited by α7 nAChR depend on the activation of PGC-1α as we did not observe mitochondrial biogenesis when we silenced PGC-1α in glial cultures (Fig. 4E) or when we used PGC-1α knockout mice (Fig. 5E, F). In conclusion, we describe a new pathway for increasing PGC-1α, which in turn increases mitochondrial content.
Interestingly, we have observed that the increase in mitochondrial number and activity derived from PNU282987 treatment was not accompanied by alteration in the mitochondrial membrane potential or an increase in the production of ROS (Fig. 1E, F). These results could be explained by the fact that the mechanism by which PNU282987 increased mitochondrial mass implicates PGC-1α and HO-1. PGC-1α has been reported to not only trigger the generation of new mitochondria but to also improve the antioxidant capacity and suppress ROS (43). Regarding HO-1, it is considered that both the enzyme itself and also its by-products have antioxidant properties, which could contribute to the maintenance of oxidative stress levels.
Although the aerobic respiration and generation of ATP have been considered the principal function of mitochondria, recent studies indicate the implication of mitochondria in controlling the inflammatory response (34, 48). Since α7 nAChRs have anti-inflammatory properties in macrophages (19, 49) and microglia (11, 30), we hypothesize that a potential link between the anti-inflammatory response and the increase in the cellular energetic capacity may coexist, although further studies need to be done to confirm this.
In conclusion, with this study we have progressed in the knowledge of α7 nAChR signaling. We describe for the first time how α7 nAChR activation, specifically in glia, increases not only mitochondrial mass but also mitochondrial function, showing a new mechanism that could complement the protective and anti-inflammatory properties of α7 nAChR signaling. We also provide mechanistic evidences showing the implication of HO-1 and PGC-1α, both controlled under Nrf2.
It should be noted that, apart from mitochondrial biogenesis, there are other processes necessary for the quality control of these organelles, such as mitochondrial fusion, mitochondrial mobility, or mitophagy. Whether α7 nAChR has the ability to control these processes remains unexplored and should be studied to better understand the implication of α7 nAChR in the mitochondrial network. Nevertheless, so far we can firmly conclude that microglial α7 nAChR improves mitochondrial functioning and this effect can be complementary to its anti-neuroinflammatory and neuroprotective properties for the treatment of NDDs.
Materials and Methods
Materials
Dulbecco's modified Eagle's medium: nutrient mixture F-12 (DMEM-F12) and fetal bovine serum (FBS) were obtained from Invitrogen (Madrid, Spain). Penicillin/Streptomycin purchased from Sigma (Madrid, Spain). TMRE, H2DCFDA, Mtg-FM, and Hoechst were purchased from Molecular Probes (Invitrogen). PNU282987 and α-Bgtx were purchased from Tocris Scientific/Biogen (Madrid, Spain), SnPP from Frontier Scientific Europe (Lancashire, United Kingdom), CD45-FITC, CD11b-PE, and GLAST-APC were purchased from Miltenyi Biotec (Madrid, Spain).
Animals
All animal assays were carried out following the Guide for the Care and Use of Laboratory Animals and were previously approved by the Institutional Ethics Committee of Universidad Autónoma de Madrid, Spain, according to the European Guidelines for the use and care of animals for research in accordance with the European Union Directive of September 22, 2010 (2010/63/UE), and with the Spanish Royal Decree of February 1, 2013 (53/2013). All efforts were made to minimize the number of animals used and their suffering.
Mixed glial culture
Glial culture was performed using neonatal Sprague-Dawley rats (2–4 days old) as described before (29). Briefly, brain cortex was removed, mechanically homogenized, and passed through a 70-μm nylon filter. Cells were centrifuged at 1000 rpm for 5 min and plated at a density of 300,000 cells/ml in DMEM/F12 supplemented with 20% FBS. After 5 days in vitro (DIV), the medium was replaced by DMEM/F12 10% FBS. The medium was changed twice a week and experiments were performed after 7/10 DIV. The same protocol was used for mice glial cultures (WT and Nrf2−/−) In all treatments, PNU282987 was used at a concentration of 10 μM during 48 h.
Flow cytometry
Samples were analyzed using Cytomics FC500 (Beckman Coulter, Madrid, Spain). Briefly, after the treatments, cells were collected and after centrifugation they were resuspended in 100 μl 1 × binding buffer (BD Biosciences, Madrid, Spain) containing the appropriate concentration of fluorescent dye (MitoTracker Green-FM 100 nM, H2DCFDA 1 μM, TMRE 100 nM, CD45-FITC, CD11b-PE, and GLAST-APC 1:100). After a 15-min incubation in the dark, 200 μl of phosphate buffered saline (PBS) 1 × was added. Cells were then subjected to FACS analysis with a total of 10,000 events per assay.
Mitochondrial copy number
Once the experiment was finished, cells were washed with PBS and DNA was isolated as follows. Cells were lysed in 500 μl of buffer containing 1 M Tris-HCl (pH 8), 5 M NaCl, 0.5 M EDTA, 10% sodium dodecyl sulfate (SDS), and 0.5 mg/ml proteinase K. After 2 h at 55°C, 500 μl of phenol/chloroform/isoamyl alcohol was added and mixed by vortex. Samples were centrifuged at 13,000 rpm for 10 min and the aqueous phase was transferred to a solution containing 0.7 (v/v) isopropanol and 0.3 sodium acetate 2 M at 50%. Samples were centrifuged 15 min at 13,000 rpm, and pellets were washed with 70% ethanol. After 5 min at 13,000 rpm centrifugation, pellets were dried and resuspended in water. DNA was amplified by quantitative polymerase chain reaction using the following primers: COII (subunit II cytochrome oxidase): F-CATTATTCCTAGAACCAGGCAGAC and R-GAATTAATTCTAGGACGATGGGC; β-actin: F-CACCTTCCAGCAGATGTGGA and R-AGCATTTGCGGTGGACGATGG. The ratio COII/β-actin represents mtDNA/nuclear DNA (nDNA).
Immunofluorescence
Once the experiment was finished, cells were washed three times with PBS (NaCl 9 g/L, 10 mM NaH2PO4, 10 mM K2HPO4) and stained with the mitochondrial fluorescent stain MitoTracker Green FM (100 nM) for 20 min. Then, cells were washed three times with PBS and the nuclear marker Hoechst (1 μg/ml) was added in the second wash. Finally, images were taken with a confocal microscope (TCS SPE; Leica, Wetzlar, Germany) with a magnification of 63 × .
Western blot
After treatment, cells were lysed in ice-cold lysis buffer (1% Nonidet P-40, 10% glycerol, 137 mM NaCl, 20 mM Tris–HCl, pH 7.5, 1 μg/ml leupeptin, 1 mM phenylmethylsulfonyl fluoride, 20 mM NaF, 1 mM sodium pyrophosphate, and 1 mM Na3VO4) supplemented with one tablet of protease inhibitor cocktail (Complete Mini; Roche, Mannhein, Germany). Thirty micrograms of protein lysates was resolved by polyacrylamide gel electrophoresis-SDS and transferred to immobilon-P membranes (Millipore Iberica, SA, Madrid, Spain). Membranes were incubated with anti-AMPKα [pT172] (1:1000; Invitrogen), anti-AMPKα (1:500; Invitrogen), anti-p-CREB [Ser133] (1:1000; Cell Signaling), anti-CREB (1:1000; Cell Signaling), anti-HO-1 (1:1000; Santa Cruz), anti-PGC-1α (1:1000; Cayman Chemical), anti-MnSOD (1:1000; Stressgen), anti-cytochrome c (1:1000; BD PharMingen), anti-p-85-PI3K (1:50,000; Merck Millipore), anti-tubulin (1:10,000; Calbiochem), and anti-β-actin (1:100,000; Sigma).
Measurement of OCR in cultured cells
Oxygen consumption was measured using the XF24 Extracellular Flux Analyzer (Seahorse Bioscience). To obtain a homogeneous monolayer of cells, 150,000 cells per well were plated in XF24 cell culture microplates (Seahorse Bioscience) 7–10 days before the experiment.
To study the effect of PNU282987 on cell respiration, glial cells were exposed to 10 μM PNU282987 for 48 h and then incubated in unbuffered DMEM supplemented with 25 mM glucose, 1 mM pyruvate, and 2 mM glutamine at 37°C in a CO2-free incubator for 1 h for equilibration before the experiment, period in which PNU282987 treatment was maintained in the unbuffered DMEM. A calibration cartridge (Seahorse Bioscience) was equilibrated overnight and then loaded with unbuffered DMEM (port A), 5 μg/ml oligomycin (port B), 500 μM DNP (port C), and 1 μM rotenone plus 1 μM antimycin A (port D), all obtained from Sigma-Aldrich. This allowed the determination of basal respiration, the amount of oxygen consumption linked to ATP production, the proton leak, the maximal respiration capacity, the reserve capacity, and the nonmitochondrial oxygen consumption. In all experiments, the protein concentration in each well was determined at the end of the measurements, using the Pierce BCA protein assay kit (Thermo Scientific) after cell lysis in RIPA buffer (Sigma-Aldrich) supplemented with protease inhibitor cocktail (Complete Mini; Roche), and was used to calibrate the oxygen consumption data.
Luciferase assay
For this assay, we used immortalized MEF cells derived from WT C57BL/6 mice. They were transfected using Lipofectamine 2000™ with 100 ng of a plasmid containing 2 kb of PGC-1α promoter linked to luciferase reporter gene (4). In addition, cells were transfected with 200 ng of either empty vector (pcDNA3.1) as control or with an expression factor of V5-tagged Nrf2 [pcDNA3.1-Nrf2-V5, kind gift of John Huyes (20)]. Twenty-four hours later, cells were treated with Sfn 10 μM or vehicle for 48 h. Forty-eight hours post-transfection, luciferase activity was determined with the Dual-Luciferase Reporter Assay System (Promega).
Adenoviral vectors and infections
Silencing Ad-shPGC-1α was constructed using the pSilencerTM Adeno 1.0 Cytomegalo-virus Promoter System from Ambion (Carlsbad, CA), as previously described (26). Primary glial cultures were infected during 8 h with adeno-viral vectors. After infection, the medium was changed for cell recovery overnight, and then cells were treated for 48 h with PNU282987 10 μM.
Animal treatments
In vivo experiments were performed using C57BL/6 mice as WT at the age of 8–10 weeks. PNU282987 was administered at a concentration of 10 mg/kg by i.p. injection twice per day during 2 days.
LysMCreHmox1Δ/Δ were generated in the Universidad Autónoma de Madrid from C57BL/6 Hmox1LoxP x LysMCre mice (29). Hmox1LoxP mice were generated by the laboratory of Dr. Masayuki Yamamoto (Tohoku University Graduate School of Medicine) (18). They were obtained through RIKEN BioResource Center (B6J.129P2 Hmox1). C57BL/6 LysMCre mice were generated by the laboratory of Dr. Forster (5) and obtained through the Jackson Laboratory [B6.129P2-Lyz2tm1(cre)Ifo/J Stock No. 004781]. Mice were used at 8–10 weeks of age and littermates were used as controls.
PGC-1α+/+ and PGC-1α−/− mice were originally provided by Dr. Bruce Spiegelman (Dana-Farber Cancer Institute, Harvard Medical School) and following embryo transfer, a colony was established at the Instituto de Investigaciones Biomédicas (Madrid, Spain). Mice were used at 8–10 weeks of age and littermates as controls.
Microglial isolation
Microglia were isolated from whole-brain homogenates using Percoll gradient as previously described (23, 24). Briefly, animals were killed and brains were homogenized by passing through a 70-μM cell strainer using PBS 1 × (pH 7.4). Homogenates were centrifuged at 600 × g during 6 min at 10°C. Thereafter, brains were resuspended in isotonic Percoll of 70% and a discontinuous Percoll gradient was layered (70%, 50%, 35%, and 0%). The gradient was centrifuged at 2000 × g during 20 min at 10°C. Microglia were collected from the interface between 50% and 70% layers and cells were washed with PBS and ready for flow cytometry analysis.
Statistical analysis
Results are expressed as mean ± standard error of the mean. Statistical analysis was performed using GraphPad Prism 5.0 program. Every independent experiment was normalized with respect to control situation and the remaining variables were referred to that value. Analysis was performed using the following tests: paired t-test, one-way analysis of variance (ANOVA) followed by Newman–Keuls post-hoc test or two-way ANOVA followed by Bonferroni post-hoc test. Statistical significance was considered when p ≤ 0.05.
Footnotes
Acknowledgments
This work was supported by the Spanish Ministry of Economy and Competence Ref. SAF2012-23332 and SAF2015-63935-R to M.G.L.; Ref. SAF2012-37693 to M.M. Comunidad Autónoma de Madrid grant number S2010/BMD-2361 to M.M. E.N. a predoctoral fellowship from Universidad Autónoma de Madrid. The work in SC laboratory is supported by grants from the Instituto de Salud Carlos III FIS (PI12/00933 and PI15/00448) and by Comunidad de Madrid (S2011/BMD-2402). We thank Laura Molero and Ana I. de las Heras for technical assistance in flow cytometry experiments and Javier Fernández-López for supervising statistical analyses. We also thank the Fundación Teófilo Hernando, the Network of Excellence Nrf2-net of MINECO, and the European Cooperation and Technology (COST Action BM1203/EU-ROS).
Author Disclosure Statement
No competing financial interests exist.