
Abstract
Aims:
The present study examined the role of cystathionine γ-lyase (CSE) in carbon tetrachloride (CCl4)-induced liver damage.
Results:
A CSE gene knock-out and luciferase gene knock-in (KI) mouse model was constructed to study the function of CSE and to trace its expression in living status. CCl4 or lipopolysaccharide markedly downregulated CSE expression in the liver of mice. CSE-deficient mice showed increased serum alanine aminotransferase and aspartate aminotransferase levels, and liver damage after CCl4 challenge, whereas albumin and endogenous hydrogen sulfide (H2S) levels decreased significantly. CSE knockout mice showed increased serum homocysteine levels, upregulation of inflammatory cytokines, and increased autophagy and IκB-α degradation in the liver in response to CCl4 treatment. The increase in pro-inflammatory cytokines, including tumor necrosis factor-alpha in CSE-deficient mice after CCl4 challenge, was accompanied by a significant increase in liver tissue hydroxyproline and α-smooth muscle actin and histopathologic changes in the liver. However, H2S donor pretreatment effectively attenuated most of these imbalances.
Innovation:
Here, a CSE knock-out and luciferase KI mouse model was established for the first time to study the transcriptional regulation of CSE expression in real time in a non-invasive manner, providing information on the effects and potential mechanisms of CSE on CCl4-induced liver injury.
Conclusion:
CSE deficiency increases pro-inflammatory cytokines in the liver and exacerbates acute hepatitis and liver fibrosis by reducing H2S production from L-cysteine in the liver. The present data suggest the potential of an H2S donor for the treatment of liver diseases such as toxic hepatitis and fibrosis. Antioxid. Redox Signal. 27, 133–149.
Introduction
T
In chronic liver disease, liver fibrosis acts as a sign of liver damage and is associated with liver dysfunction that is caused by progressive cirrhosis (28, 30). Hepatic stellate cells (HSCs) play a key role in hepatic fibrogenesis, remain quiescent in the normal liver, whereas they are activated and transformed into fibrogenic myofibroblast-like cells in response to liver damage. The treatment of liver injuries remains a significant challenge in clinical medicine. Although liver transplantation is currently the most effective therapy, its application is severely limited by the shortage of donor organs, surgery-related complications, and immunological rejection (2, 21).
As the liver is a major organ producing endogenous hydrogen sulfide (H2S) under normal conditions, investigation of the effects of H2S and its producing enzymes on inflammatory liver injury is important. The present study is the first to establish a cystathionine γ-lyase (CSE) knock-in mouse model for non-invasive monitoring of CSE expression in real time, facilitating the analysis of the effects of CSE and H2S on carbon tetrachloride (CCl4)-induced liver injury. The cytoprotective effects of NaHS and L-cysteine indicated that H2S may be an important candidate for the treatment of toxic hepatic damage.
Hydrogen sulfide (H2S) is a toxic, colorless gas with a rotten-egg odor that has been recognized as a signaling molecule as well as a cytoprotectant. The mammalian enzymes cystathionine β-synthase (CBS) and cystathionine γ-lyase (CSE) catalyze the release of H2S from the sulfur-containing amino acid, cysteine (15). These enzymes are abundantly expressed in various organs: CBS is mainly expressed in the brain, peripheral nervous system, and liver; whereas CSE is mostly found in the liver and in vascular and nonvascular smooth cells (11, 29). H2S possesses a very diverse biological profile, which includes anti-inflammatory, cytoprotective, and anti-fibrotic properties (23).
In the present study, the anti-inflammatory and anti-fibrotic roles of CSE and its product H2S were investigated in a luciferase gene knock-in (KI) and CSE gene knock-out mouse model generated by inserting the luciferase reporter gene downstream of the mouse CSE promoter. Luciferase bioluminescence was captured in real time by using a highly sensitive and non-invasive camera system to trace CSE expression in living animals (17, 33).
Our data indicated that this model can be successfully used to study the transcriptional regulation of CSE expression in various inflammatory disease processes. The homozygous mutant mice were fertile and indistinguishable from their wild-type (WT) littermates in terms of growth, feeding, and weight. However, CSE deficiency significantly aggravated liver inflammation and fibrosis, and it increased autophagy in mice subjected to CCl4 challenge, whereas exogenous and endogenous H2S preconditioning had the opposite effects.
Results
A CSE knock-out luciferase gene KI mouse model was generated by gene targeting
A schematic diagram of the CSE knock-out luciferase gene KI model is shown in Supplementary Figure S4A (Supplementary Data are available online at
Real-time quantitative PCR was used to quantify the levels of CSE mRNA in the different tissues, which showed the highest CSE mRNA expression in the liver and the kidney. CSE expression was lower in CSE+/− mice than in CSE+/+ mice, and it was almost undetectable in CSE−/− mice. The intensity of the CSE protein band from liver extracts of CSE+/− mice was ∼50% lower than that of CSE+/+ mice; the band was absent in blots from CSE−/− mice (Supplementary Figs. S1 and S4D, E). As previously reported (25), CSE−/− mice had significantly higher levels of serum homocysteine than WT mice (Supplementary Fig. S4F).
Luciferase expression was high in CSE+/− mice, and it was significantly reduced by an intraperitoneal (i.p.) injection of lipopolysaccharide (LPS). The luminescent signal gradually declined, reaching a nadir at 10 h post injection in both males and females (Supplementary Fig. S5A, B). The signal nadir was ∼59% of the baseline in male mice, and it was ∼40% in females. The signal returned to the baseline level at 72 h of treatment (Supplementary Fig. S5C). Both male and female mice showed a significantly reduced luciferase signal compared with the baseline level from 3 to 12 h after LPS treatment, and they showed a similar tendency of LPS-induced signal change.
To confirm the in vivo data obtained with the imaging system, luciferase activity was measured in dissected organs at 10 h after LPS injection. Luciferase activity was significantly low in the heart, liver, kidneys, and large intestine. Compared with saline-treated mice, LPS treatment inhibited luciferase activity by 0.4-fold in the heart, spleen, and kidneys, and 0.5-fold in the liver and large intestine (Supplementary Fig. S5D). Quantification of mouse endogenous CSE expression by real-time PCR (Supplementary Fig. S5E) showed that in parallel with that effect on luciferase activity, LPS treatment downregulated endogenous CSE gene expression by 0.5-fold in the heart, lung, and kidneys, and it caused a 0.1-fold reduction in the liver. These results indicated that the mouse model was successfully established.
CSE deficiency aggravated CCl4-induced liver injury
To detect the CSE expression in vivo in the CCl4-induced acute hepatic injury model, luciferase activity was detected by live imaging. Male CSE+/− mice showed significantly reduced luciferase activity across the body after CCl4 i.p. injection. The luminescent signal gradually declined and then reached a nadir at 24 h post injection (Fig. 1A, B). Liver function was assessed by measuring serum albumin, alanine aminotransferase (ALT), and aspartate aminotransferase (AST) levels (Fig. 1C). After CCl4 injection, the levels of ALT and AST increased rapidly compared with those in the control group. Serum albumin level decreased significantly after CCl4 treatment compared with that in the control group. CSE mRNA levels in the liver were significantly decreased in the CCl4 treatment group compared with those in the control group (Fig. 1D).

Histopathological changes in the liver tissues from the four groups were examined by hematoxylin and eosin (H&E) staining (Fig. 1E). The structure of liver tissues was maintained in the control group, whereas a disordered lobular structure with sinusoidal congestion, neutrophil invasion, and ballooning degeneration were observed in the CCl4 group. These pathological features were significantly enhanced in the CSE−/− group, including significant hemorrhage of the liver, periportal neutrophil infiltration, and large sections of ballooning degeneration.
Real-time quantitative PCR was used to quantify the levels of tumor necrosis factor-alpha (TNF-α), interleukin-1beta (IL-1β), and IL-6 mRNA in the liver (Fig. 2A). The data showed that TNF-α, IL-1β, and IL-6 were upregulated rapidly by CCl4 treatment. Furthermore, CSE deficiency significantly increased the expression of the cytokines compared with that in the WT group after CCl4 treatment. Next, the expression of LC3-II, an important marker of autophagy, was measured in liver tissues by real-time PCR. The results showed a significant increase in LC3-II levels after CCl4 treatment, and this effect was further enhanced in the CSE−/− group (Fig. 2B).
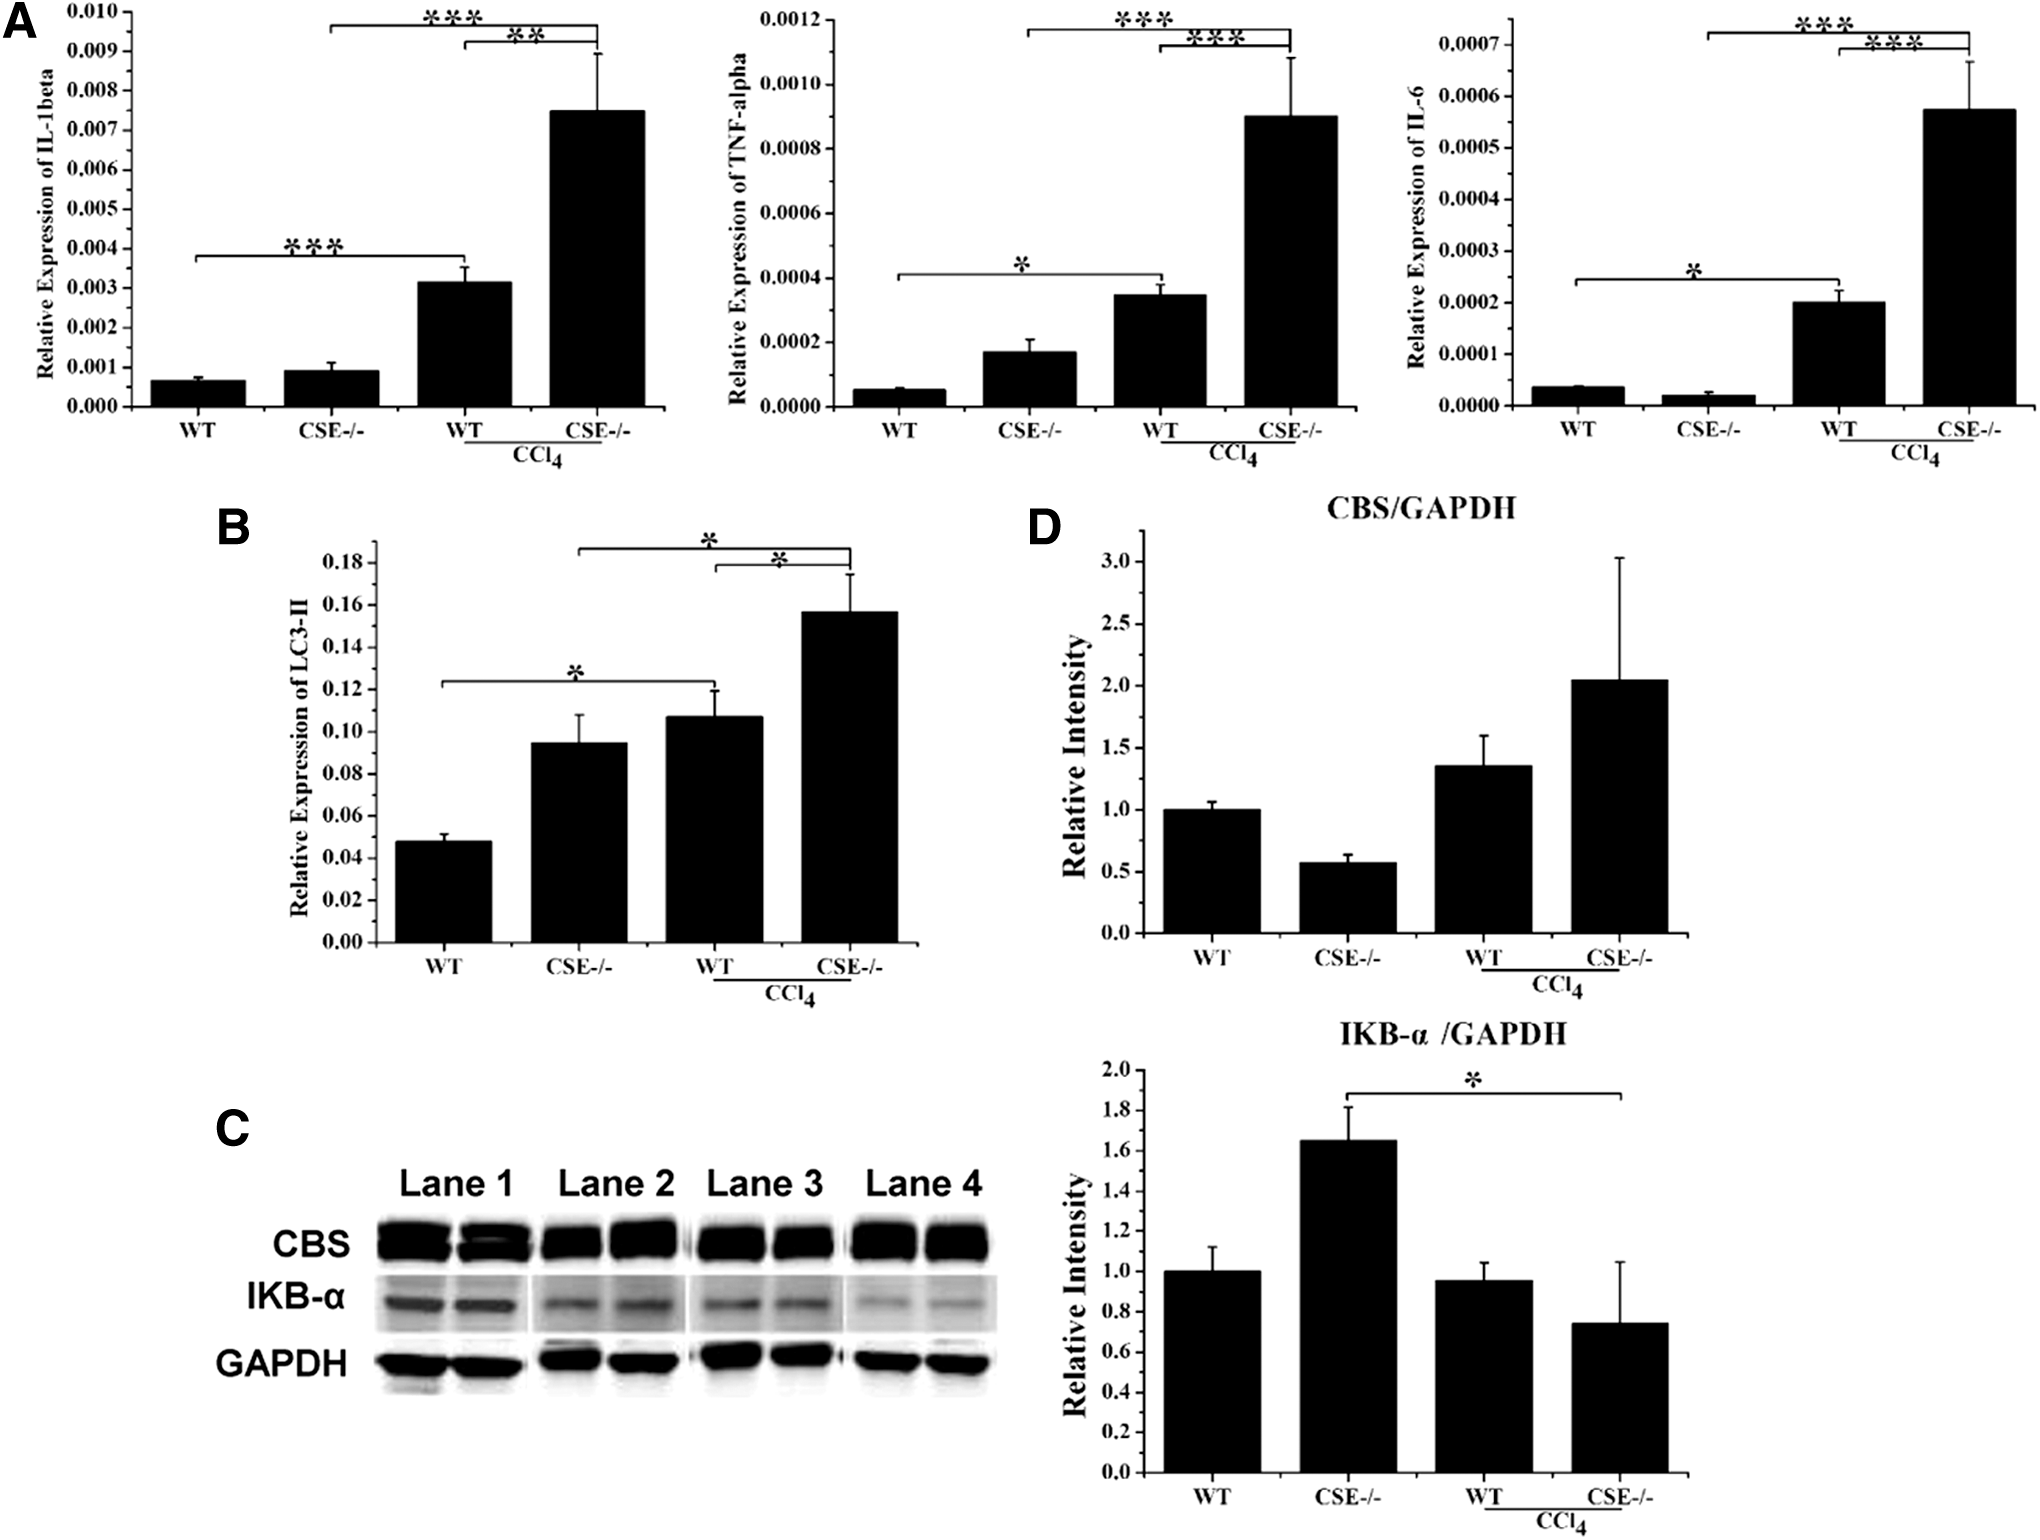
To elucidate the mechanisms responsible for the upregulation of inflammatory cytokines induced by the CCl4 challenge, we examined the levels of IκB-α. As shown in Figure 2C and D and Supplementary Figure S2, a low-intensity IκB-α band was detected in the CCl4-induced group compared with the control group, indicating that nuclear factor-kappa B (NF-κB) was activated. CSE deficiency further decreased the intensity of the IκB-α band compared with that in the WT group after CCl4 injection. Although CSE was downregulated by the CCl4 challenge in WT mice, CBS expression was not affected by CSE deficiency and the CCl4 challenge.
Next, the effects of CSE deficiency on CCl4-induced liver fibrosis were examined. CSE expression in the liver was markedly inhibited in the CCl4-treated WT group compared with that in the control group. The production of TNF-α and collagen 1 increased rapidly in the CCl4 group compared with that in the control group (Fig. 3A). That hepatic architecture was disrupted, with sinusoidal congestion, neutrophil invasion, and ballooning degeneration in the CCl4 group (Fig. 3B, C). Significant bridging fibrosis and fibrous septa were observed in liver sections of mice treated with CCl4 (Fig. 3D).
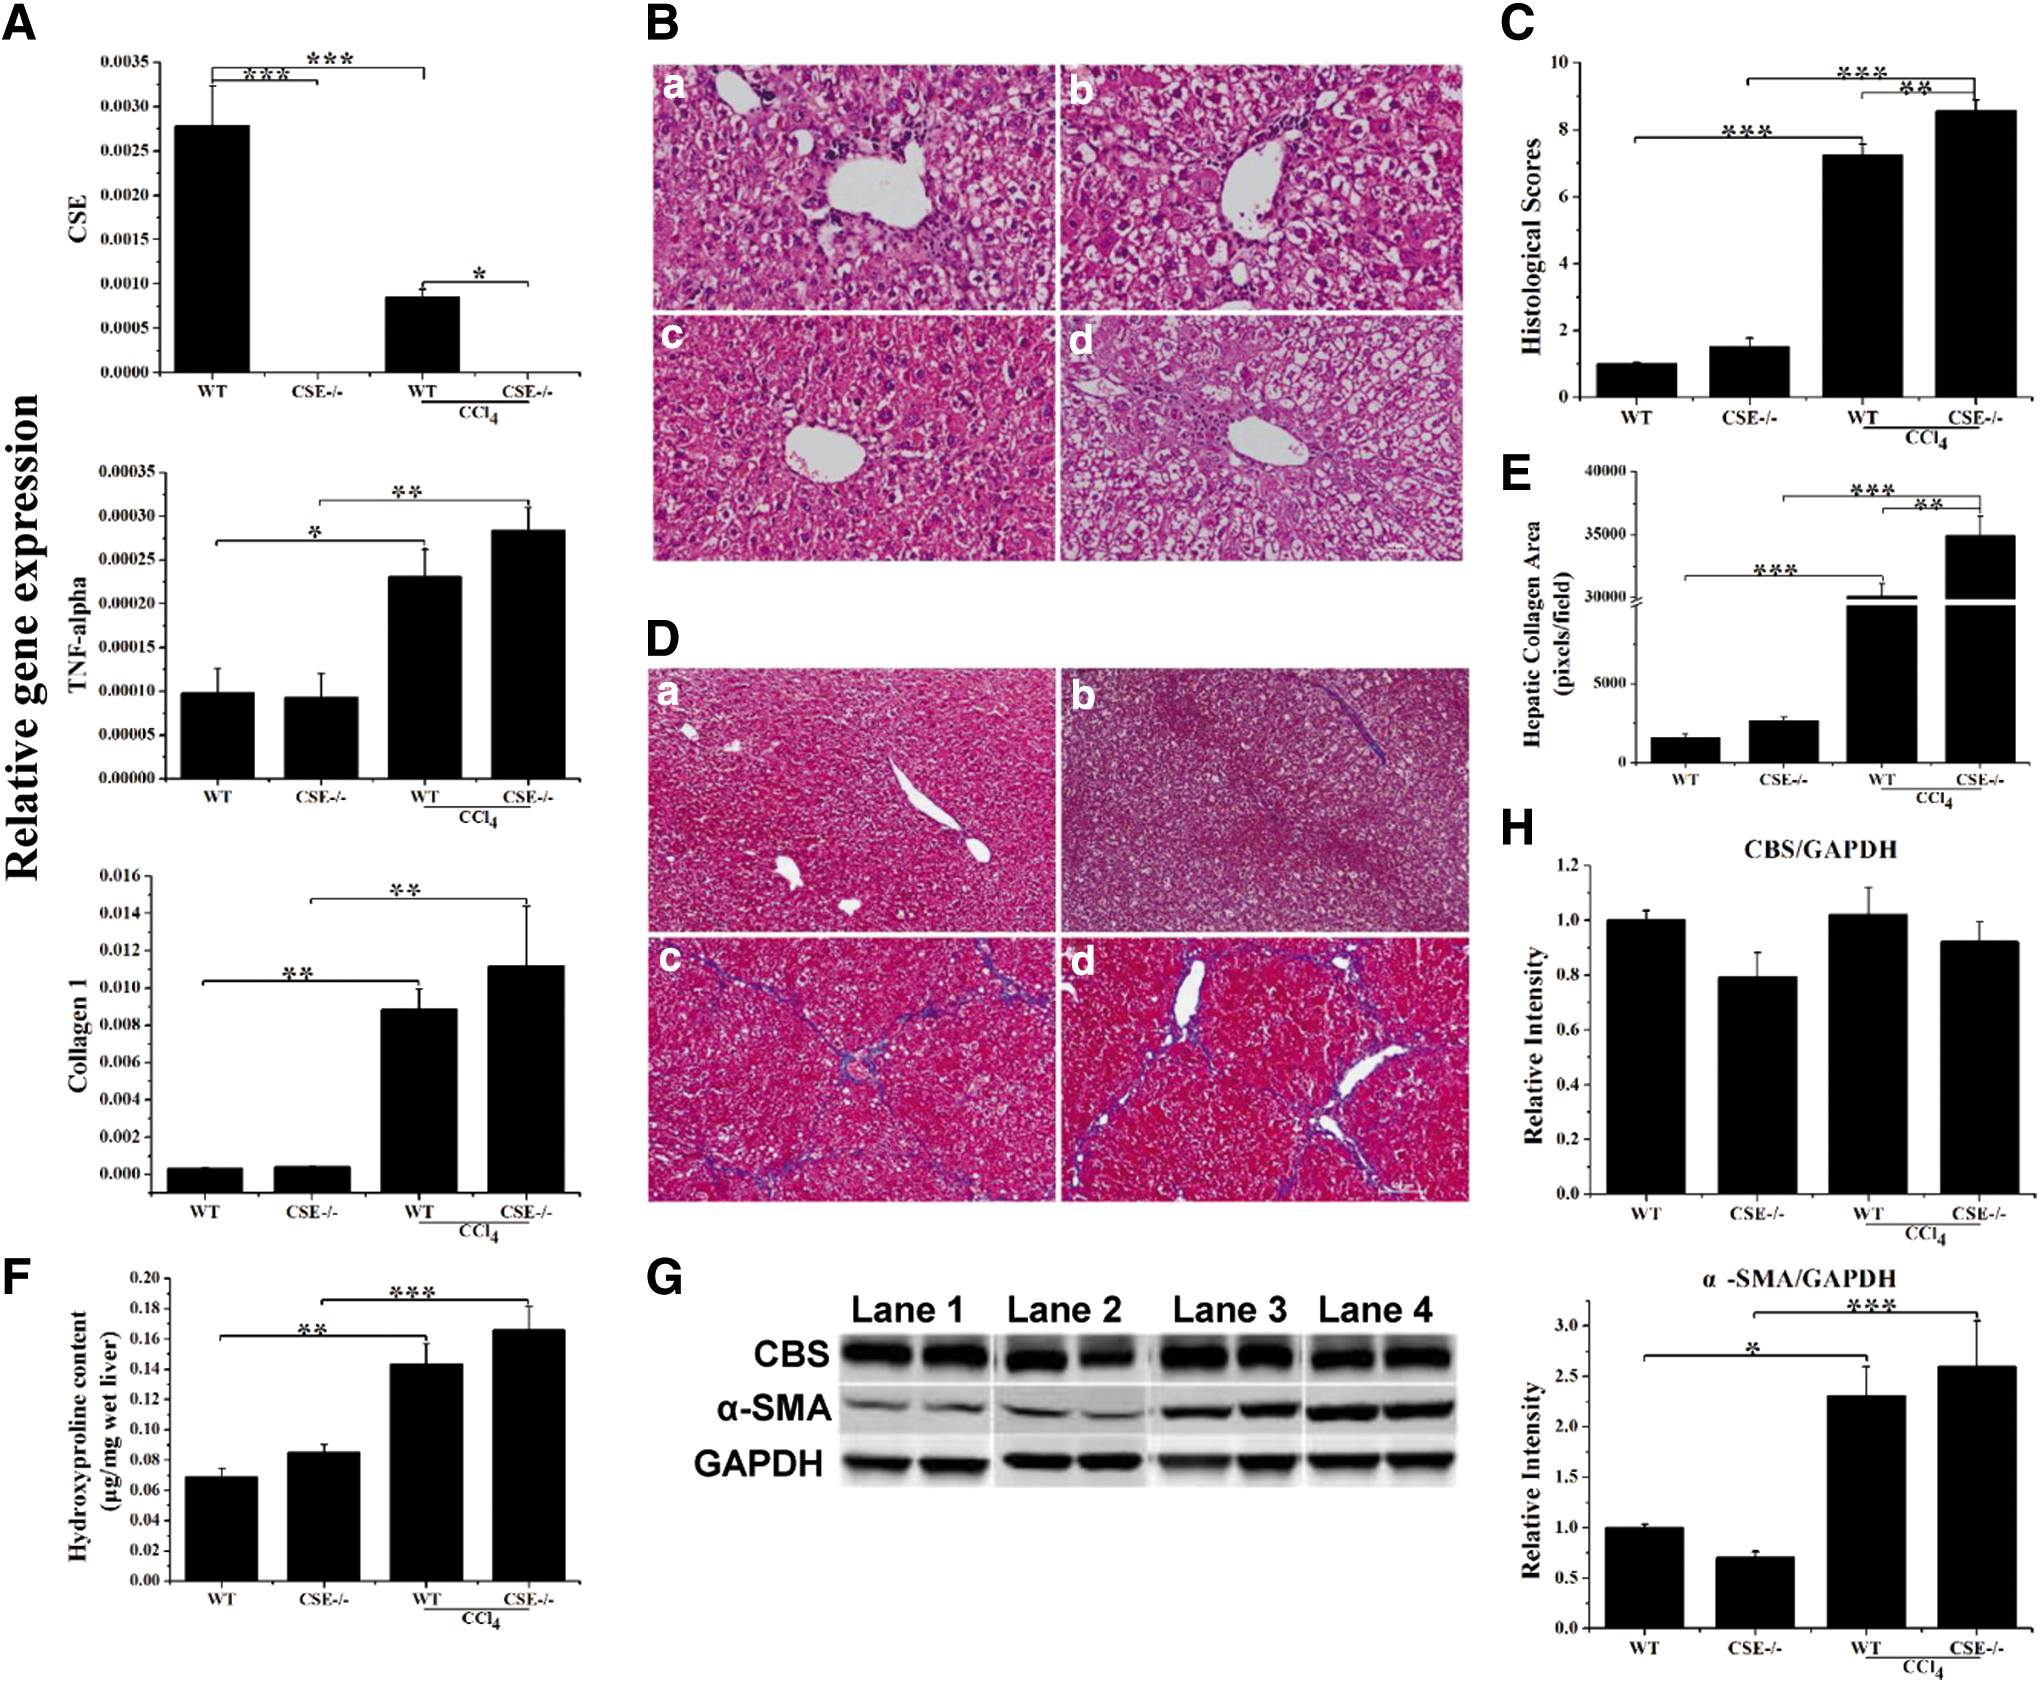
Quantitative analysis showed that areas of collagen were significantly increased in CCl4-induced mice compared with those in control mice, and they were further increased in CSE-deficient mice (Fig. 3E). Collagen deposition was quantified by measuring the hepatic hydroxyproline content, which showed that CSE deficiency stimulated fibrogenesis after CCl4 injection (Fig. 3F). CSE deficiency significantly upregulated α-smooth muscle actin (α-SMA) protein expression in fibrogenesis, indicating enhanced HSCs activation. As in acute liver injury, CSE was downregulated by the CCl4 challenge in WT mice, whereas CBS expression was not affected by CSE deficiency and CCl4 challenge (Fig. 3G, H and Supplementary Fig. S3).
NaHS pretreatment attenuated CCl4-induced liver injury in WT and CSE−/− mice
H2S levels in serum and liver tissues were significantly decreased in CSE-deficient mice (Fig. 4A). To examine whether the low H2S level in CSE-deficient mice was associated with the severity of the phenotype in CCl4-induced acute hepatitis, mice were pretreated with NaHS, the H2S donor (4). NaHS moderately increased serum and liver H2S levels in WT and CSE−/− mice. NaHS slightly increased serum albumin and inhibited the increase of serum ALT and AST in the acute hepatitis groups in both WT and CSE-deficient mice. Meanwhile, NaHS administration eliminated the difference in the levels of albumin, ALT, and AST between WT and CSE-deficient mice after CCl4 challenge (Fig. 4B, C).

These results indicated that H2S had a protective effect on hepatocytes and rescued the mouse phenotype of CSE deficiency. NaHS pretreatment attenuated the CCl4-induced lobular structure disorder with sinusoidal congestion, neutrophil invasion, and ballooning degeneration observed in both WT and CSE-deficient mice (Fig. 4D, E). NaHS pretreatment inhibited IκB-α degradation, downregulated cytokine expression, and attenuated the conversion of LC3-II in the acute liver injury groups in both WT and CSE-deficient mice (Fig. 4F–H and Supplementary Fig. S2).
As in acute hepatitis, NaHS preconditioning significantly inhibited the H2S decline during hepatic fibrogenesis (Fig. 5A, B). NaHS pretreatment inhibited the production of collagen 1 and TNF-α, and the increase in the hepatic hydroxyproline content induced by CCl4. No significant differences in the levels of hepatic collagen 1 and TNF-α or the hydroxyproline content were observed between WT and CSE-deficient mice induced by CCl4 after NaHS treatment (Fig. 5C, D). Moreover, NaHS attenuated CCl4-induced the disruption of hepatic architecture characterized by sinusoidal congestion, neutrophil invasion, and ballooning degeneration, and the increase of collagen areas as well as HSCs activation.

In addition, NaHS administration eliminated the differences in the disruption of hepatic architecture and collagen deposition, as well as the level of α-SMA between WT and CSE-deficient mice after CCl4 challenge (Fig. 5E–J and Supplementary Fig. S3). Finally, NaHS did not affect the expression of CBS in CCl4-induced acute hepatitis and liver fibrosis mice (Supplementary Figs. S2, S3, and S6A–D).
Administration of L-cysteine attenuated CCl4-induced liver injury and increased the H2S levels in WT mice
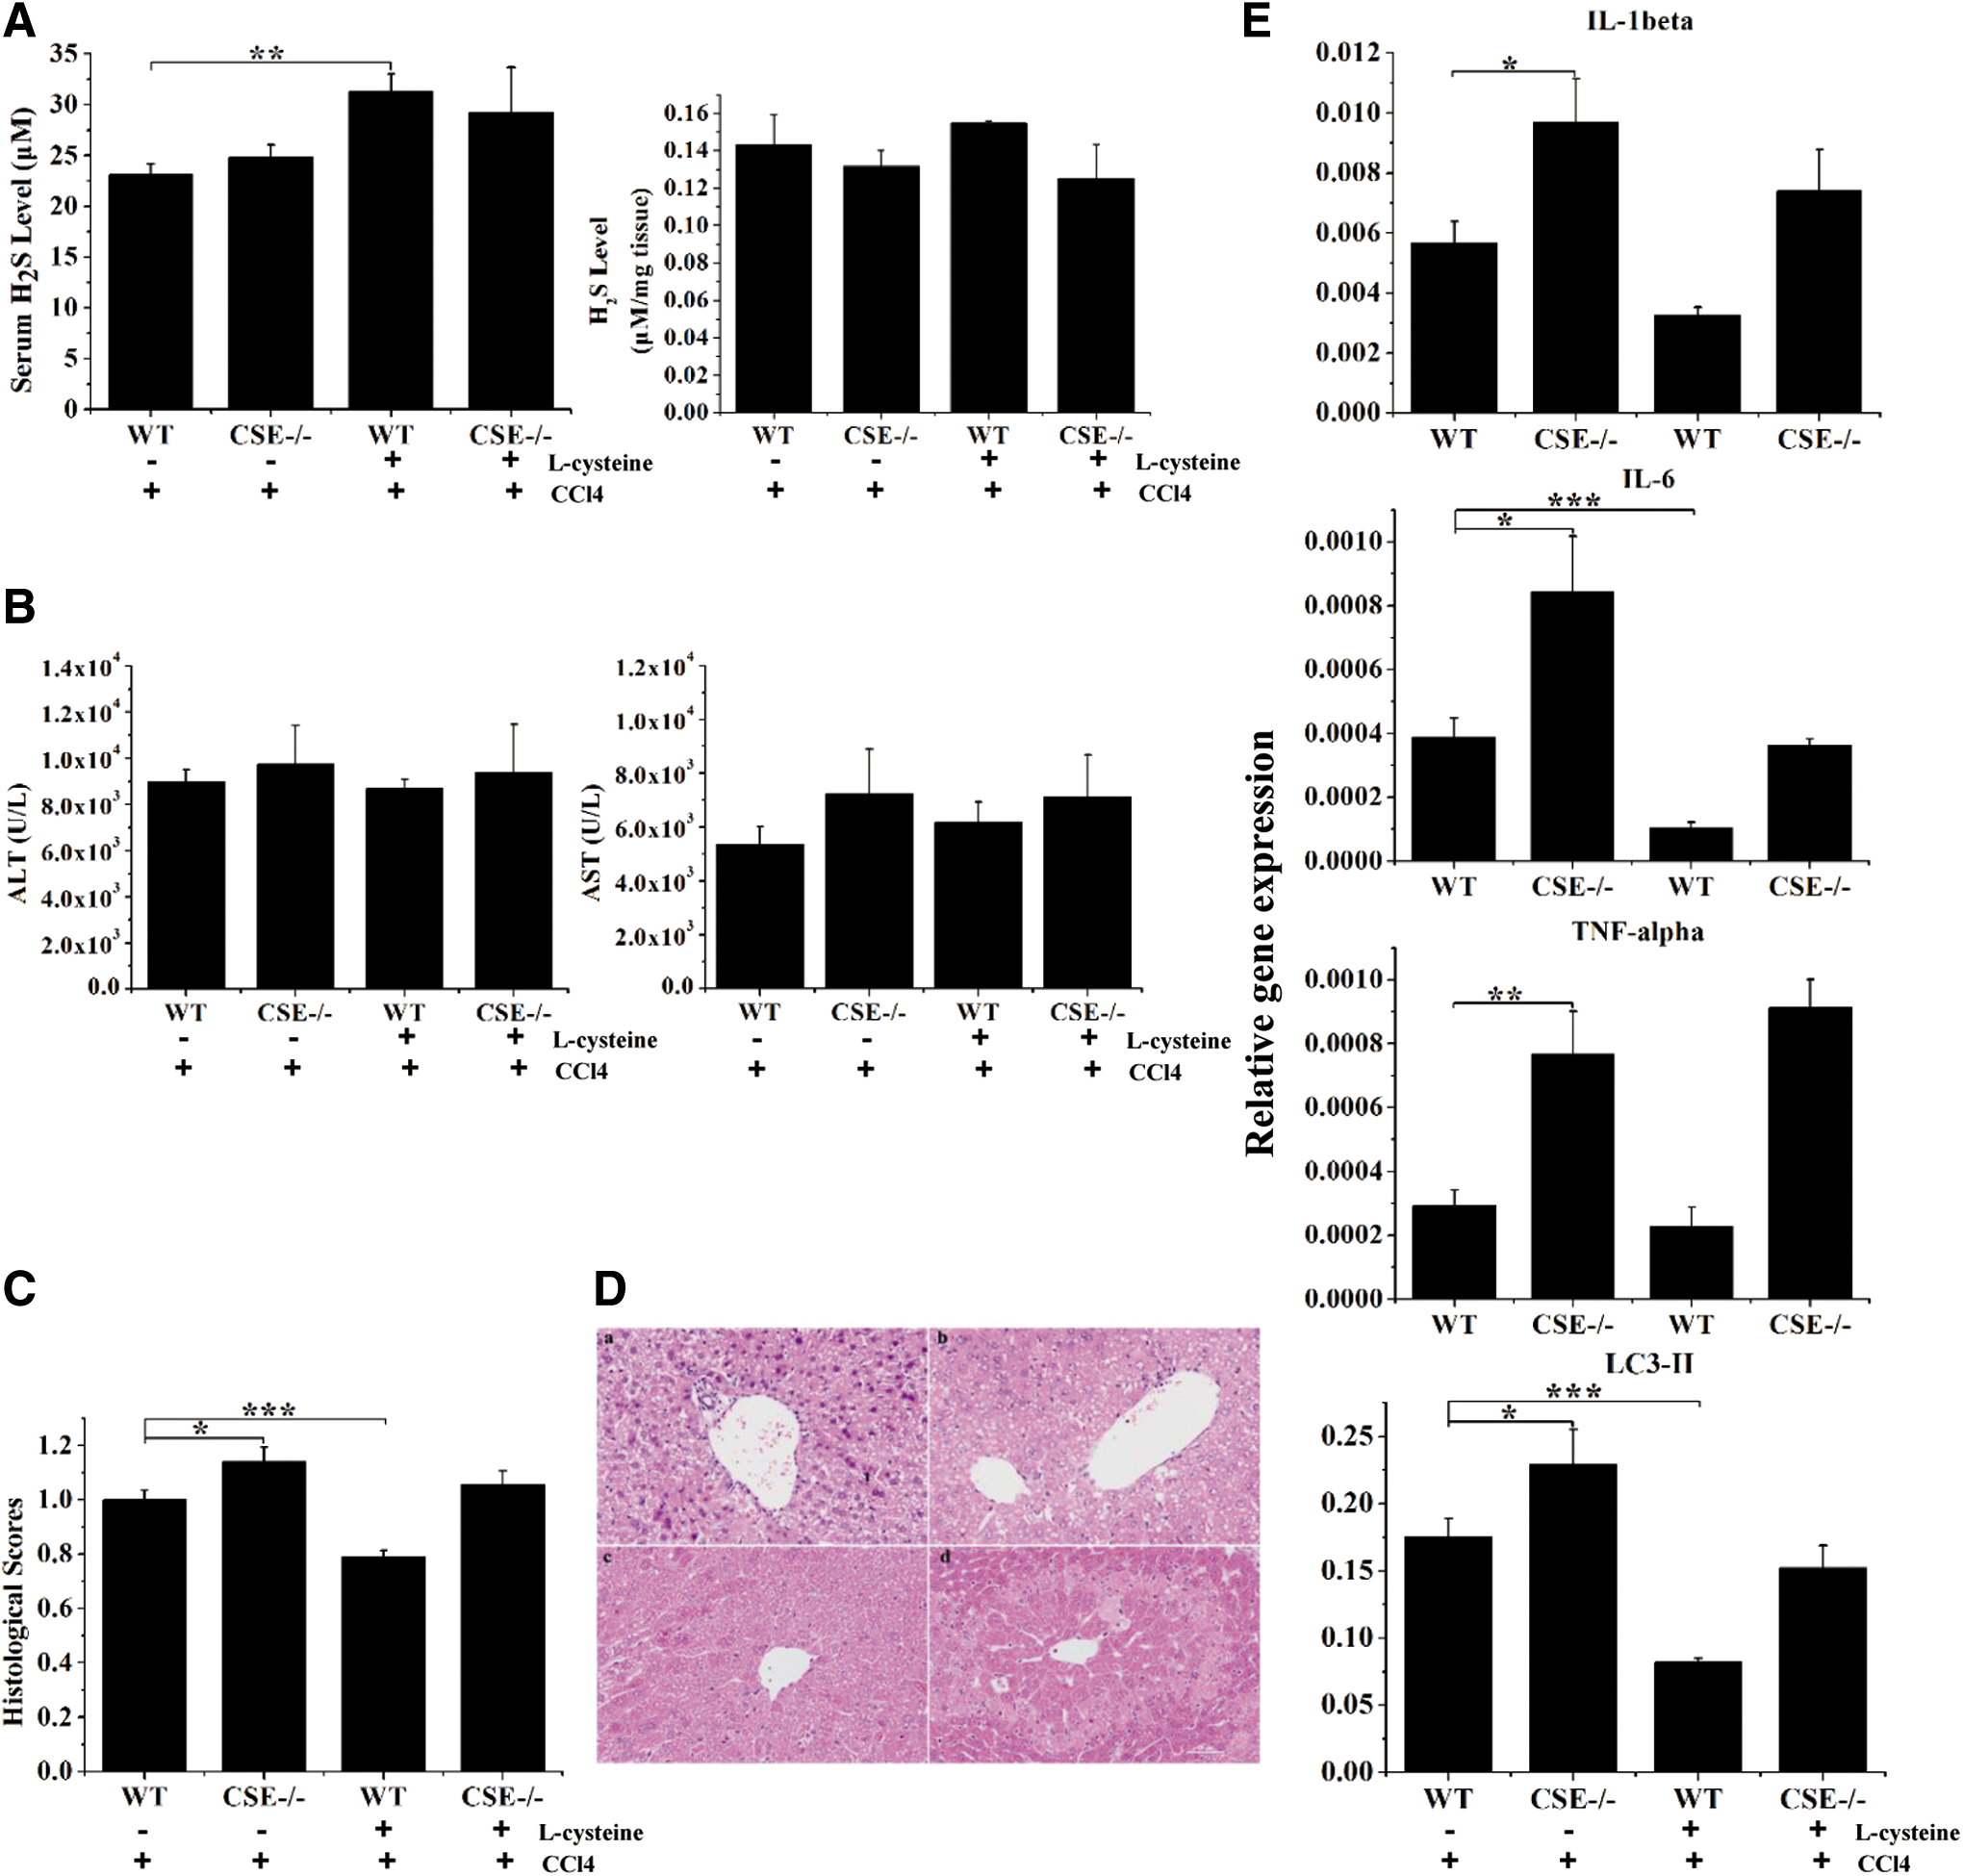
CSE catalyzes the pyridoxal 5′-phosphate-dependent synthesis of H2S from cysteine. To further determine whether the role of CSE in liver injury is mediated by H2S production, CCl4-induced liver injury mice were treated with L-cysteine. Administration of L-cysteine, the substrate of CSE, markedly increased the serum and liver levels of H2S in WT mice, whereas it had no significant effect on H2S levels in CSE-deficient mice (Figs. 6A and 7A). Administration of L-cysteine moderately prevented CCl4-induced increase of serum ALT levels and significantly attenuated CCl4-induced histological liver injury in WT mice. However, the protective effects of L-cysteine were not observed in CSE-deficient mice (Fig. 6B–D). The beneficial effects of L-cysteine in WT mice may be associated with the inhibition of IL-1β, IL-6, TNF-α, and LC3-II expression (Fig. 6E).
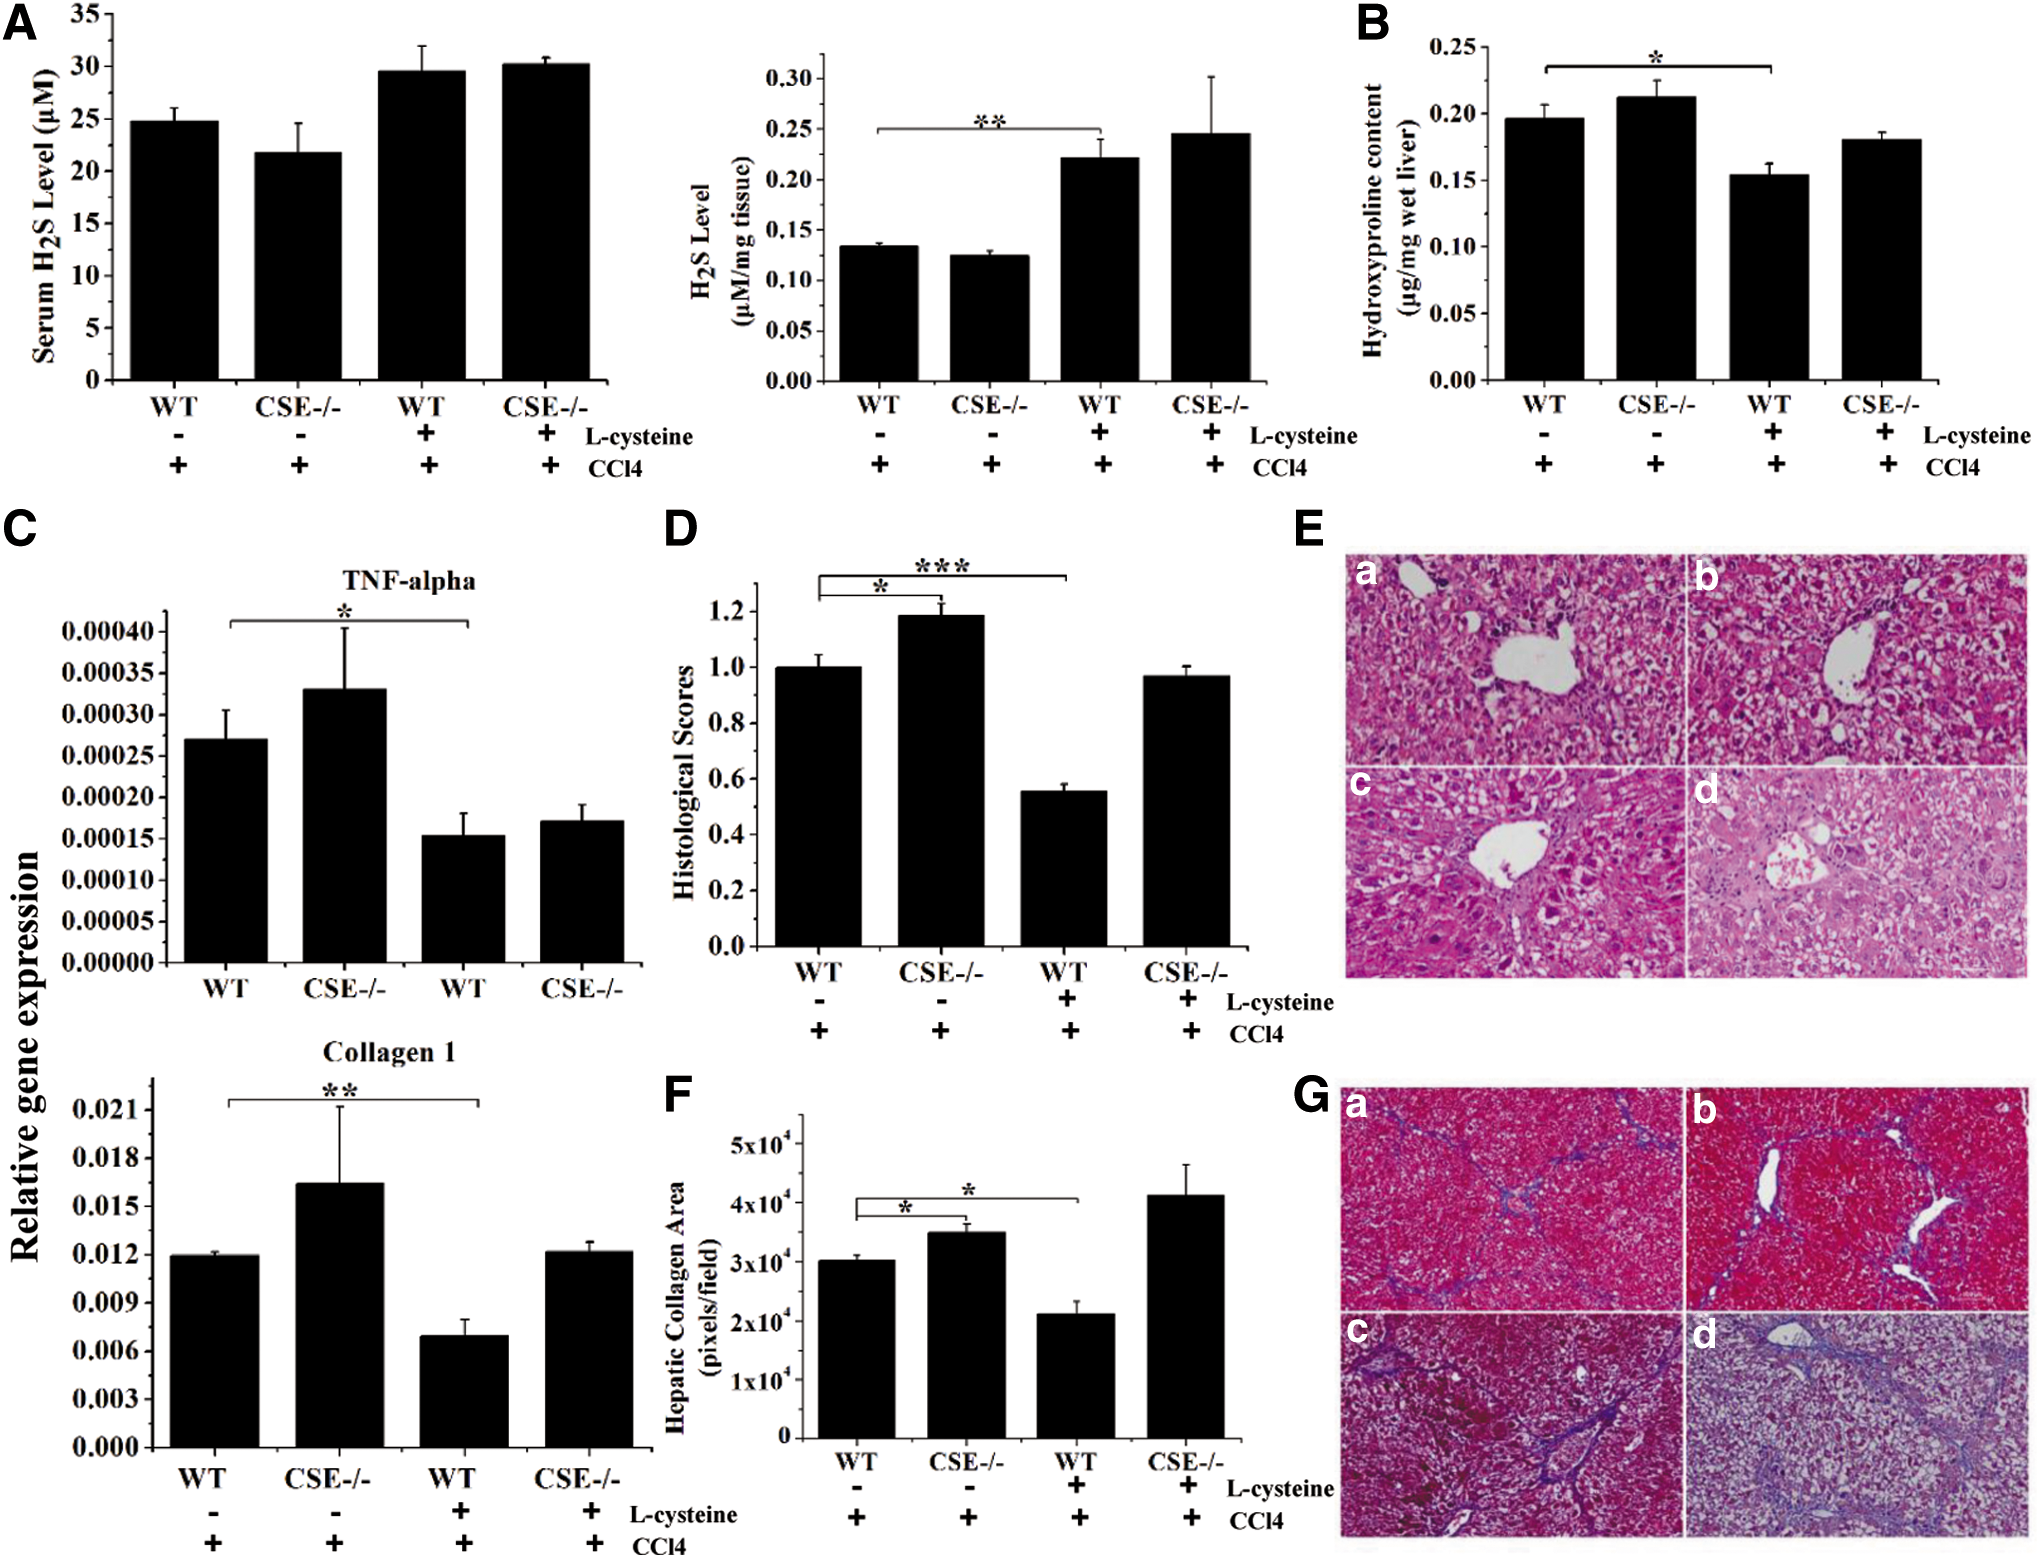
We next examined whether L-cysteine treatment prevented CCl4-induced liver fibrosis in mice. L-cysteine pretreatment significantly inhibited the collagen deposition, as quantified by measuring the hepatic hydroxyproline content in WT mice but not in CSE-deficient mice (Fig. 7B). CCl4-induced TNF-α and collagen 1 levels were significantly inhibited in WT mice after L-cysteine treatment, whereas no significant changes were observed in CSE-deficient mice (Fig. 7C). L-cysteine treatment significantly attenuated CCl4-induced histological liver injury and reduced collagen areas in WT mice, and this effect was not observed in CSE-deficient mice. By contrast, significant bridging fibrosis and fibrous septa were observed in liver sections in CSE-deficient mice treated with CCl4 with or without L-cysteine preconditioning (Fig. 7D–G).
Discussion
A luciferase gene KI and CSE gene knock-out mouse model was established to monitor the endogenous CSE expression and to analyze the function of CSE in liver disease. An in vivo bioluminescence camera system was used to show that luciferase activity was markedly inhibited after an i.p. injection of LPS. The results of ex vivo experiments indicated that LPS inhibited luciferase activity in the heart, liver, kidney, and large intestine. CSE mRNA expression was higher in the liver than in other organs.
The pattern of LPS-mediated inhibition of luciferase activity in CSE KI mice was consistent with the changes of endogenous murine CSE mRNA expression. However, the fold inhibition was not the same for luciferase activity and endogenous CSE mRNA. This result could be attributed to the fact that endogenous CSE mRNA expression is not exactly in linear correlation with protein levels (33). These data demonstrate that CSE KI mice are a sensitive, reliable, and convenient model for monitoring CSE gene expression in vivo in physiological or pathological processes.
The CCl4-induced liver injury model has been used for decades, because the elementary lesions caused by this hepatotoxin mimic most cases of human liver disease (38). In the present study, the luciferase signal was monitored during the liver injury process induced by CCl4 treatment. The pattern of CCl4-mediated inhibition of luciferase activity in CSE KI mice was consistent with the changes of endogenous murine CSE mRNA expression. The transcription factor Sp1 plays a crucial role as activator of CSE gene transcription (34). Our results showed that CCl4 significantly reduced the levels of Sp1, suggesting that the downregulation of CSE may be mediated by the modulation of Sp1 (Supplementary Fig. S7A, B).
The present study showed that CSE deficiency exacerbated CCl4-induced liver injury, whereas NaHS pretreatment increased serum and liver H2S levels and significantly attenuated the damage in both CSE-deficient and WT mice after CCl4 challenge. The only substrate for the generation of endogenous H2S is L-cysteine, and the reaction is catalyzed by three enzymes, CBS, CSE, and 3-mercaptopyruvate sulfurtransferase (3MST) (20, 24). Our results showed that CBS expression was not changed in CCl4-induced liver injury; the relative gene expression of 3MST in WT and CSE−/− mice was not significantly changed, whereas the level of H2S was markedly decreased in CSE−/− mice compared with WT mice, indicating that the 3MST was not involved in the H2S production in the liver (Supplementary Fig. S8A, B).
L-cysteine preconditioning markedly increased the level of H2S and prevented CCl4-induced liver damage in WT mice. However, H2S levels in the serum and liver of CSE-deficient mice were only slightly elevated, and no significant protective effect of L-cysteine on liver damage was observed, indicating that the increase in H2S caused by L-cysteine challenge was mostly associated with CSE activity. These findings were consistent with previous reports (36).
As a gasotransmitter, H2S diffuses freely across cell membranes in a receptor-independent manner and can activate various cellular signals that modulate metabolism, hepatoprotective effects, and homeostasis (8, 23, 37). In acute hepatitis, Kupffer cells (KCs) are tissue resident macrophages in the liver and the first line of defense. Injury stimulations can induce inflammatory activation of KCs, resulting in the cascade release of pro-inflammatory cytokines, including IL-1β, IL-6, and TNF-α.
Our results indicated that H2S had an anti-inflammatory effect on KCs, and NF-κB is a key transcriptional regulator of the inflammatory response and plays an essential role in the regulation of inflammatory signaling pathways in the liver (9, 18). NF-κB, a heterodimer of P50 and P65 subunits, is retained in the cytoplasm via the masking of a nuclear localization signal by the inhibitor IκB-α (31). On activation, IKK phosphorylates IκB-α, which triggers its degradation and results in the expression of various pro-inflammatory cytokines. In this regard, our findings suggested that CSE deficiency activated the NF-κB pathway, whereas H2S pretreatment inhibited the activation in both CSE-deficient and WT mice after CCl4 challenge.
In addition, autophagy is involved in apoptotic cell death (10, 14). The accumulation of LC3-II in autophagosomes and the conversion of LC3-I to LC3-II are important markers of autophagy (13, 27). In the present study, we examined the effect of CSE deficiency on autophagy. The results showed that CSE deficiency markedly increased LC3-II gene expression after CCl4 challenge, whereas H2S pretreatment significantly inhibited the CCl4-induced elevation of LC3-II mRNA.
Finally, oxidative stress plays an important role in liver injury due to excessive production of reactive oxygen species (ROS) and reactive nitrogen species, such as hydrogen peroxide (H2O2) and nitric oxide (NO). ROS is produced by NADPH oxidase (NOX), which is expressed in the liver, and NO is generated by inducible NO synthases (iNOS). Emerging data demonstrate that H2S acts as the scavenger of oxidant species. Along these lines, we found that H2S pretreatment tended to inhibit the gene expression of iNOS (Supplementary Fig. S9A), and NOX1, NOX2, NOX4 (Supplementary Fig. S10A–C), and decrease H2O2 (Supplementary Fig. S11A) in CCl4-induced acute hepatitis mice.
Our experimental results suggest that an H2S donor could be a promising therapeutic drug for CCl4-induced acute hepatitis through the inhibition of autophagy, oxidative stress, KCs, and the NF-κB signaling pathway.
Hepatic fibrosis is a progressive pathological process that involves the accumulation of extracellular matrix proteins such as collagens (19). Mounting evidence from independent groups demonstrates that H2S exhibits protective effects on the ex vivo hepatic fibrosis model and the rat hepatic fibrosis model (3, 6, 7, 39). However, the role of endogenous H2S in liver fibrosis is incompletely explained due to the limited use of chemical inhibitors of H2S-producing enzymes, including DL-propargylglycine (PAG) (5, 26).
In the present study, collagen deposition in the CCl4 group was determined by the increased level of hydroxyproline, collagen 1 mRNA expression, and Masson's trichrome staining, whereas both endogenous and exogenous H2S pretreatment markedly prevented this increase in collagen deposition in WT mice. As previously reported, several pro-inflammatory cytokines, including TNF-α and IL-6, play an important role in the activation of HSCs, which have been identified as major collagen-producing cells in the injured liver (1, 22). Our results showed that CCl4 treatment significantly activated HSCs, as measured by α-SMA expression, especially in CSE-deficient mice, whereas NaHS pretreatment led to a clear impairment of HSC activation. Although CCl4-induced fibrosis had no effect on IL-6 gene expression (data not show), it significantly increased the level of TNF-α, and H2S pretreatment significantly inhibited the increase of TNF-α. We also found that H2S pretreatment inhibited the mRNA expression of iNOS (Supplementary Fig. S9B), and NOX1, NOX2, and NOX4 (Supplementary Fig. S10D–F), and it tended to decrease H2O2 (Supplementary Fig. S11B) in the liver of hepatic fibrosis mice.
In summary, the current data show that CSE plays an important role as an inhibitor of inflammation in the liver by producing H2S from L-cysteine. NaHS and L-cysteine showed protective effects against CCl4-induced liver damage, suggesting their translational potential. CSE KI mice could be used to monitor CSE expression during pathological processes and may be useful in studying the effects of drug therapy.
Materials and Methods
Animals and genotyping
The targeting vector contained 2911 bp of the mouse CSE gene fragment just upstream from the translation initiation codon ATG as the 5′-homology arm, a 4093 bp insertion sequence coding for a floxed firefly luciferase and a neomycin selection cassette (FRT-Neo-FRT), and 2993 bp as a 3′-homology arm derived from the CSE gene just downstream of the translation initiation codon ATG. CSE knock-out and luciferase KI mice in the C57BL/6J background were generated by standard ES cell based gene targeting techniques and verified by PCR and DNA sequencing. Targeted offspring were genotyped from tail genomic DNA by using the triple primer PCR strategy. The position and sequence of P1–7 are described in Supplementary Figure S1A and Supplementary Table S1. Homozygous (CSE−/−) mice, heterozygous (CSE+/−), and WT control (CSE+/+) mice from the same litter were used at 8 and 10 weeks of age.
All animals were housed in a specific pathogen-free environment with a 12 h light/dark cycle with food and water ad libitum. This study was performed in strict accordance with institutional guidelines and approved by the Institutional Animal Care and Use Committee of the Shanghai Research Center for Model Organisms, and the IACUC permit number was 2012-0021-01.
Reagents
Bacterial LPS, NaHS, corn oil, and N-acetyl-L-cysteine (L-cysteine) were purchased from Sigma-Aldrich. CCl4 was purchased from Sinopharm Chemical Reagent Co., Ltd. Potassium Luciferin (Gold Biotechnology) was dissolved in phosphate-buffered saline (PBS) (Beyotime) at 15 mg/ml and stored at −20°C.
Exogenous H2S donor
H2S was administered in the form of NaHS, which was diluted in normal saline.
In vivo imaging
In vivo imaging was performed as previously described by using a lumazone imaging system (Mag Biosystems) (17, 33). Briefly, mice with hair removed were injected 150 μl potassium luciferin intraperitoneally (dissolved in PBS), anesthetized with isoflurane/oxygen, and placed on the imaging stage. At 12 min after luciferin injection, mice were imaged in the dark chamber for 3 min. Photons emitted from specific regions were collected and quantified by using Lumazone software. Luciferase activity was expressed as photon intensity per second.
Acute septic shock model generated by i.p. injection of LPS
The acute septic shock model was produced by an i.p. injection of LPS (3 mg/kg body weight) into CSE heterozygous mice aged 8–12 weeks. Control mice were injected with saline. Luciferase activity was detected by imaging at 0, 1, 3, 6, 10, 12, 24, 30, 48, and 72 h post injection. At the selected time points after the injection, mice were i.p. injected with luciferin and imaged after 12 min with the Lumazone imaging system as described earlier.
Real-time quantitative PCR
Total RNA was isolated from selected mouse tissues by using Trizol (Tiangen) according to the manufacturer's instructions and kept at −80°C before use. Aliquots containing 1600 ng RNA from each sample were reverse transcribed into cDNA by using Quant Reverse Transcriptase (Tiangen). The SuperReal SYBR Green Premix Plus (Tiangen) was used for real-time PCR amplification. Real-time PCR was performed by using the Realplex system (Eppendorf). The reaction conditions were as follows: 95°C/15 min; 40 cycles of 95°C/15 s, X°C/20 s, 72°C/30 s; 95°C/15 s; and 60°C/15 s. Murine β-actin was used as a reference to normalize the targeted gene expression levels. The sequences of specific primers are listed in Table 1.
CSE, cystathionine γ-lyase; IL-1β, interleukin-1 beta; M, mouse; TNF-α, tumor necrosis factor-alpha.
Ex vivo measurement of luciferase activity
Mouse tissues were dissected and lysed with 300 μl lysis buffer (Promega). Luciferase activity was measured by using the Luciferase Assay System (Promega) and a Luminometer (Lumat LB9507, EG&G; Berthold). Protein concentration was estimated by using the BCA Protein Assay Kit (Beyotime).
Animal models of acute hepatitis and liver fibrosis
Acute liver injury in mice was induced by an i.p. injection of CCl4 at the dosage of 1 ml/kg body weight (1:3 diluted in corn oil). The mice in the control group were dosed with an equal volume of corn oil. The 42 mice were assigned to eight groups as follows: WT (n = 5), CSE−/− (n = 4), WT/CCl4 (n = 6), WT/NaHS+CCl4 (n = 6), CSE−/−/CCl4 (n = 6), CSE−/−/NaHS+CCl4 (n = 6), WT/L-cysteine+CCl4 (n = 5), and CSE−/−/L-cysteine+CCl4 (n = 4). The mice received an i.p. injection of NaHS solution (36 μmol/kg) or L-cysteine solution (15 mg/kg) at 1 h before CCl4 treatment. The NaHS solution or L-cysteine solution was administered once per day. Mice were sacrificed on day 1 post-injection.
In the fibrosis experiment, 32 mice were assigned to eight groups as follows: WT, CSE−/−, WT/CCl4, WT/NaHS+CCl4, CSE−/−/CCl4, CSE−/−/NaHS+CCl4, WT/L-cysteine+CCl4, and CSE−/−/L-cysteine+CCl4. An i.p. injection of CCl4 (1 ml/kg, dissolved in corn oil to reach a final concentration of 20%) was administered twice per week for 6 weeks. The mice received an i.p. injection of NaHS solution (36 μmol/kg) every 2 days or L-cysteine solution (15 mg/kg) once daily for up to 6 weeks. The mice were euthanized at the indicated time points. Liver samples were fixed with 10% formalin for histological examination. The same lobe of the liver was snap-frozen in liquid nitrogen and stored at −80°C for hydroxyproline content determination, and RNA and protein extraction. Blood samples were centrifuged at 3000 rpm for 15 min to collect serum.
Measurement of biochemical index and homocysteine concentration in serum
After blood collection, serum was separated by centrifugation at 3000 rpm for 15 min at 4°C. Serum albumin, AST, and ALT levels were measured by using an automated chemistry analyzer (Sysmex). Homocysteine concentration was measured with another automated chemistry analyzer (Hitachi).
Measurement of serum and liver tissue H2S
H2S production was measured as previously described (16, 35).
Histological assessment of liver injury
The degree of inflammation and tissue damage was observed in paraffin sections (5 μm thick) stained with H&E. For fibrosis, liver sections were processed by both H&E and Masson's trichrome staining to assess the architectural alterations and hepatic collagen deposition. Morphometric analysis was then performed on a computerized image analysis system (Image-Pro Plus; Media Cybernetics). The mean of blue stained areas in each section was calculated. The histological severity was graded according to the Suzuki's criteria described by Ke et al., in which sinusoidal congestion, hepatocyte necrosis, and cytoplasmic vacuolization are graded from 0 to 4 (12).
Hepatic hydroxyproline content
To quantify collagen content, a hepatic hydroxyproline assay was performed (Jiancheng Bioengineering Institute). Liver tissues were homogenized in lysis buffer at 95°C for 20 min. The hydrolysates were centrifuged for 10 min at 3500 rpm, the supernatant was removed, and hydroxyproline levels in the hydrolysates were measured at 550 nm.
Western blotting
Proteins were extracted in an RIPA buffer containing protease inhibitor cocktail (Selleck Chemicals) from the left lateral lobe of liver, and an equal number of protein (50 μg) from each sample was separated on 12% SDS-PAGE and transferred onto nitrocellulose membranes (GE Healthcare). Membranes were blocked with PBS containing 5% fat-free milk powder for 1 h at room temperature, and they were then incubated overnight at 4°C with different primary antibodies. After washing, membranes were incubated with fluorescent-conjugated secondary antibody for 1 h (1:10,000; LI-COR Biosciences).
Statistical analysis
Data were expressed as the mean ± SEM. Statistical differences between groups were analyzed by using one-way analysis of variance, followed by Bonferroni post hoc test.
Footnotes
Acknowledgments
This work was supported by grants from the National Key Project (2010CB945501), the Science and Technology Commission of Shanghai Municipality (16DZ2280800).
Author Disclosure Statement
No competing financial interests exist.
Abbreviations Used
References
Supplementary Material
Please find the following supplemental material available below.
For Open Access articles published under a Creative Commons License, all supplemental material carries the same license as the article it is associated with.
For non-Open Access articles published, all supplemental material carries a non-exclusive license, and permission requests for re-use of supplemental material or any part of supplemental material shall be sent directly to the copyright owner as specified in the copyright notice associated with the article.