
Abstract
Aims:
MicroRNAs (miRNAs), one type of noncoding RNA, modulate post-transcriptional gene expression in various pathogenic pathways in type 2 diabetes (T2D). Currently, little is known about how miRNAs influence disease pathogenesis by targeting cells at a distance. The purpose of this study was to investigate the role of exosomal miRNAs during T2D.
Results:
We show that miR-15a is increased in the plasma of diabetic patients, correlating with disease severity. miR-15 plays an important role in insulin production in pancreatic β-cells. By culturing rat pancreatic β-cells (INS-1) cells in high-glucose media, we identified a source of increased miR-15a in the blood as exosomes secreted by pancreatic β-cells. We postulate that miR-15a, produced in pancreatic β-cells, can enter the bloodstream and contribute to retinal injury. miR-15a overexpression in Müller cells can be induced by exposing Müller cells to exosomes derived from INS-1 cells under high-glucose conditions and results in oxidative stress by targeting Akt3, which leads to apoptotic cell death. The in vivo relevance of these findings is supported by results from high-fat diet and pancreatic β-cell-specific miR-15a−/− mice.
Innovation:
This study highlights an important and underappreciated mechanism of remote cell–cell communication (exosomal transfer of miRNA) and its influence on the development of T2D complications.
Conclusion:
Our findings suggest that circulating miR-15a contributes to the pathogenesis of diabetes and supports the concept that miRNAs released by one cell type can travel through the circulation and play a role in disease progression via their transfer to different cell types, inducing oxidative stress and cell injury. Antioxid. Redox Signal. 27, 913–930.
Introduction
R
In oncology, numerous studies have demonstrated both positive and negative associations between miRNAs that are present in biological fluids (blood, urine, etc.) and disease burden. One caveat with these findings is that the authors have not established the definitive source of miRNAs isolated from biological fluids. In theory, these miRNAs may be released from dead cells, live disseminated tumor cells, or circulating vesicles (17, 21, 30, 38). Abundant literature supports the concept that non-neoplastic cells generate and release exosomes that contain miRNAs (4, 15, 52). In an in vitro model, it has been shown that a human mast cell line secretes exosomes containing miRNA, which can be taken up by another cell and, most importantly, can be functional in the recipient cell type (46). The mechanisms governing selective shuttling of miRNAs into exosomes remain an important area of discovery (10). In this study, we explore this novel concept in one of the most common disease conditions, type 2 diabetes (T2D).
In this study we have discovered that miR-15a, produced in pancreatic β-cells, can be detected in circulating exosomes. These exosomes can transport miR-15a to the retina, contributing to the pathogenesis of type 2-diabetes associated retinopathy.
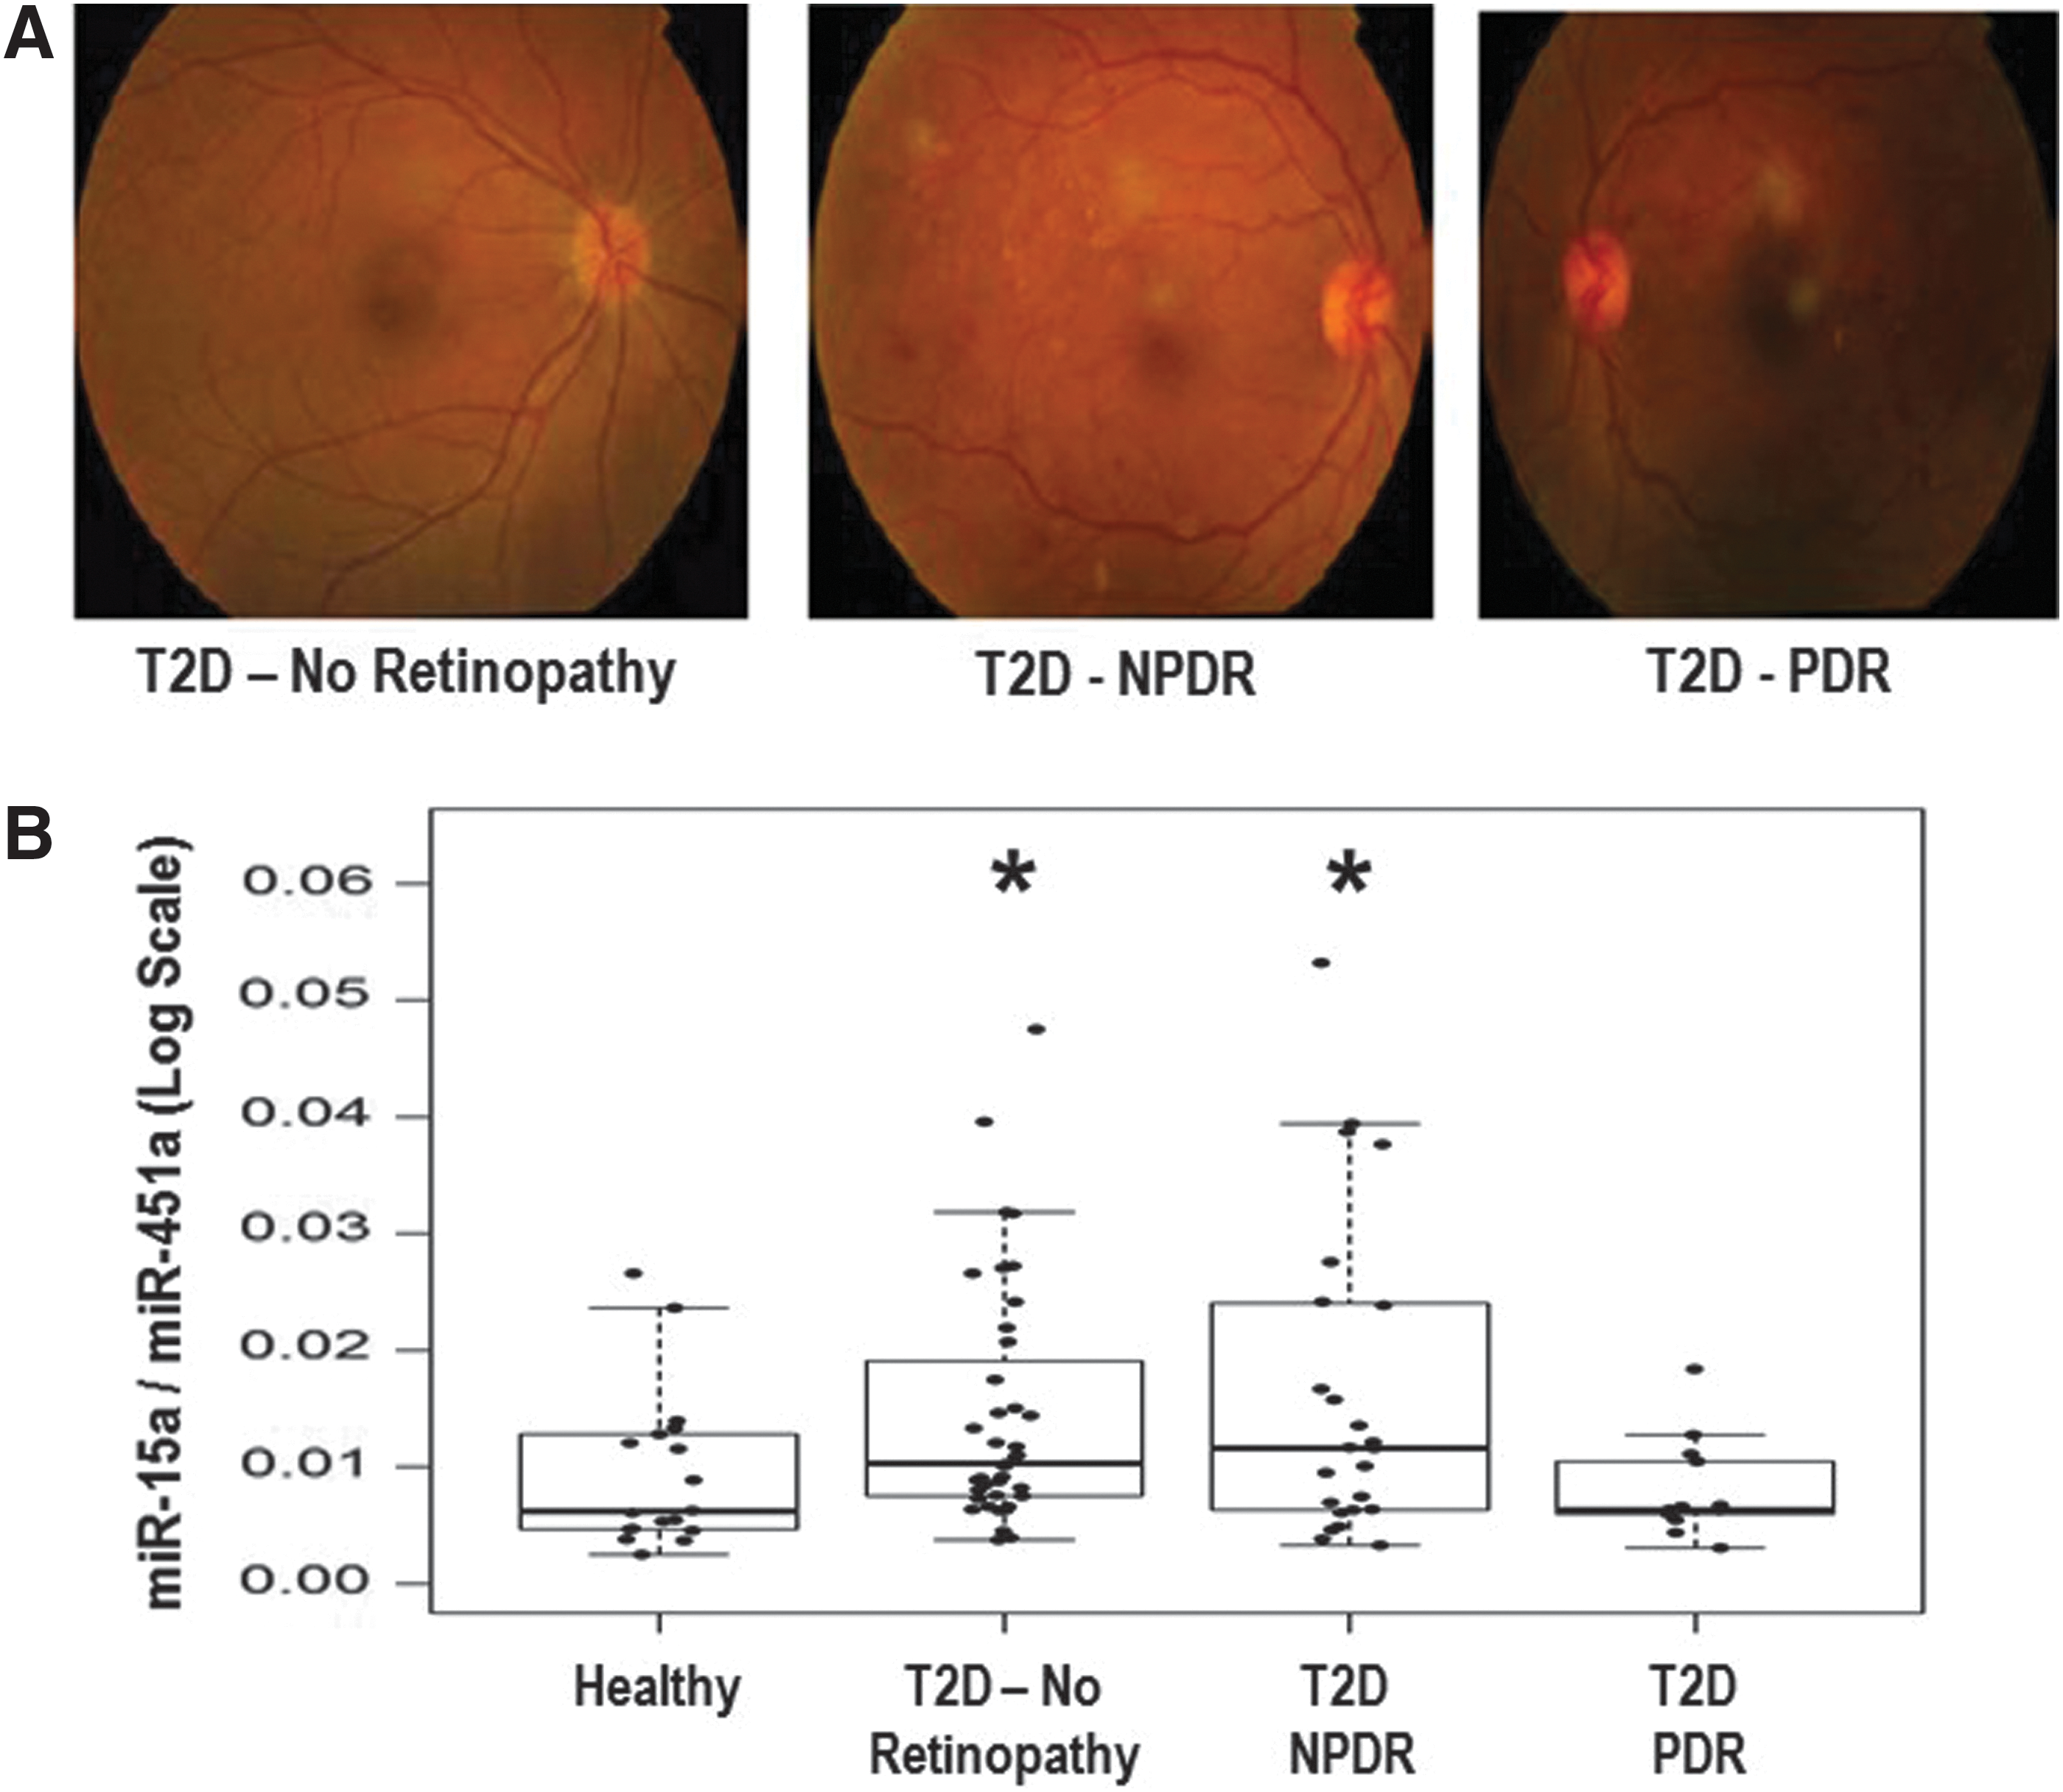
The public health impact of diabetes rests largely on its vascular complications, which include both microvascular (retinopathy, nephropathy, and neuropathy) and macrovascular (ischemic heart disease, cerebrovascular disease, and peripheral vascular disease) processes. In this study, we picked diabetic retinopathy (DR) as by simple imaging (angiogram), we can categorize disease severity. Taking advantage of DR as a readily observable index of diabetic microvascular disease, we can dissect how exosomal transport of miRNA varies during the evolution of T2D. In T2D, initially there is increased insulin production by pancreatic β-cells, an excess of insulin in the circulation, and glucose metabolism is impaired due to insulin resistance. As pancreatic β-cells, the only source of insulin, become injured due to chronic metabolic stress such as obesity, insulin production by pancreatic β-cells eventually progressively decreases (37). Several miRNAs have been demonstrated to influence insulin production by pancreatic β-cells (36). miR-375 (26, 36) and miR-15a (44) are found to be positive regulators of insulin production in pancreatic β-cells by targeting the 3′-UTR of Mtpn and Ucp-2, respectively. There are 73 miRNAs that have been identified in MIN6 cells (a mouse pancreatic β-cell line), and miR-15a is one of the more abundant miRNAs in this cell line (36). Others also found a very high expression of miR-15a in pancreatic β-cells (14), including human pancreatic β-cells (47). There has been some effort to validate miR-375 as a biomarker for T1D using nonobese diabetic and streptozotocin (STZ)-treated C57BL/6 mice (12). However, recently it has been shown that only a small proportion (∼1%) of the total circulating miR-375 originates from β-cells (26). Therefore, we focused on miR-15a. To further investigate the novel concept that exosomes transport miRNA from pancreatic β-cells and deliver the contents to other cell types in different organs, we used a highly sensitive method (Firefly assay) that can detect as low as 200 copies of a transcript (miRNA).
Our focus here is to investigate the underlying mechanism by which a particular miRNA (miR-15a) that is being produced in response to metabolic demands in one particular cell type is shuttled to a different cell type encapsulated within exosomes. We propose that these circulating EVs release their contents into the target cells, modulating gene expression within these cells. We believe a better understanding of this mechanism could lead to a new concept of a pathogenic mechanism in diabetic vasculopathy as well as a more general mechanism of disease pathogenesis. Hence, in this study, we examined whether miR-15a, produced in pancreatic β-cells, can be detected in circulating exosomes that could transport the miRNA to the retina to contribute to the pathogenesis of T2D-induced DR and correlated its expression with the early stage of retinal injury. We also examined the export of miR-15a by collecting exosomes secreted by rat pancreatic β-cells (INS-1) cultured under T2D conditions.
Results
Discovery and validation of circulating miR-15a for T2D
Initially, we wanted to determine which miRNAs are altered in patients with T2D, based on blood glucose and HbA1c, who were not experiencing complications with their disease. We examined differential expression levels of miRNAs from freshly isolated plasma samples from two groups of patients aged 30–65 years: (1) nondiabetic healthy controls (n = 6) and (2) diabetic patients without microvascular complications (n = 8) (without any overt diabetic complications) using a PCR-based microarray (Supplementary Fig. S1; Supplementary Data are available online at
Some of the participants chose not to reveal their smoking history.
DM, diabetes mellitus; DR, diabetic retinopathy; F, female; HDL, high-density lipoprotein; LDL, low-density lipoprotein; M, male; NPDR, nonproliferative diabetic retinopathy; PDR, proliferative diabetic retinopathy; RBC, red blood cell; TG.
miR-15a expression in retinal cells in response to T2D condition
It had been shown that miR-15a is increased in proangiogenic cells (PACs) and in the serum of patients with limb ischemia, which was consistent with the concept that miR-15a is involved in small vessel disease in T2D (43). To explore this further, we evaluated miR-15a expression in two important retinal cell types involved in DR, the human Müller glial cells (MIO-M1) (27, 48, 53) and human retinal endothelial cells (HRECs) (40), under conditions of normal and elevated (five times) glucose concentration (Fig. 2A, B). High glucose did not change miR-15a expression in these cell types, suggesting that higher levels of miR-15a expression in retinal cells in diabetes might be from nonretinal sources (Fig. 2A, B). We have also used human retinal pigment epithelial cells (HRPEs) under the same conditions and found markedly lower miR-15a expression with elevated glucose (Fig. 2C). By looking at the morphology of HRPEs, we have noticed that even though the cells were still attached to the plates, the cells were swollen and globular when grown in 20 mM glucose media. Neither the MIO-M1 cells nor HRECs displayed any morphological changes when cultured under high-glucose conditions. The use of 20 mM glucose in conditioned media only mimics one aspect of diabetes. Thus, we have cultured rat Müller glial cells (rMC-1) with methyl glyoxylate (MG) (30 μM), a well-studied advanced glycation end product (AGE), along with high-glucose conditioned media (20 mM). Quantitative PCR (qPCR) data suggested no statistical significant difference in the expression of miR-15a on exposure to high glucose along with AGE for 48 h (Supplementary Fig. S4). We have also used two different osmotic controls, Mannitol (14.5 mM) and O-methyl glucose (14.5 mM), for the 20 mM glucose we used in our high-glucose culture media. Supplementary Figure S4 shows that there is no difference in miR-15a expression in these different conditions. Thus, we hypothesize that the increase in miR-15a in the retina is not from endogenous sources, but rather due to transfer of miR-15a from the circulation into retinal cells under T2D stress.

Role of miR-15a in DR initiation by activating apoptosis
Using cultured MIO-M1 cells (Fig. 3A, B), we overexpressed hsa-miR-15a (Fig. 3C) and observed significantly lower Akt expression in these cells (Fig. 3D). Akt1 and 3 are the dominant isoforms of Akt in the retina (39). There was no change in Akt1 (Fig. 3E), but significant downregulation of Akt3 (Fig. 3F), when we overexpressed miR-15a. Akt3 has been shown to be a direct target of miR-15a (43). Others have demonstrated that miR-15a/16 directly targets vascular endothelial growth factor A (VEGF-A) in circulating PACs derived from critical limb ischemia patients (43). However, overexpression of miR-15a in MIO-M1 cells did not change the protein expression of VEGF-A, suggesting that in the normoxic retinal Müller cells, miR-15a does not directly bind to the 3′-UTR of VEGF-A messenger RNA (mRNA) (Fig. 3G). It is possible that the mRNA level of VEGF-A is elevated in PACs due to hypoxia and/or other cellular stress, which occurs later during the evolution of PDR, and under these conditions, miR-15a may affect angiogenesis. The 3′-UTR of VEGF-A has an miR-15a binding site. Thus, miR-15a will lower the expression of VEGF-A directly in the PACs. However, the mRNA level of VEGF-A did not change with overexpression of miR-15a in MIO-M1 cells (Fig. 3G). Because miR-15 has been implicated in ischemic stress (19) and apoptosis (8), we looked at MIO-M1 cellular activity after transfecting miR-15a and found a significant increase of reactive oxygen species (ROS) production (Fig. 3H). Even though the role of Akt in oxidative stress is well established in different tissues, in the context of DR, it has been poorly studied. It has been previously shown that treating with NAC (N-acetyl-L-cysteine) is protective in the early phase of DR (49, 50). So, we treated the MIO-M1 transfected cells (both the scramble and miR-15a overexpressors) with an antioxidant, NAC, and observed a significant decrease in ROS release from the miR-15a-overexpressed MIO-M1 cells treated with NAC compared with the non-NAC-treated group (Fig. 3H). These data suggest that with T2D progression, oxidative stress could be increased in the retina as a consequence of progressively higher levels of miR-15a, which may help to explain the pathogenesis of DR.

Akt is an antiapoptotic gene that is involved in an evolutionarily conserved pathway crucial to apoptosis (33, 34). In fact, miR-15a has been demonstrated to induce apoptosis in chronic lymphocytic leukemia cells (8). After overexpressing miR-15a, we examined apoptotic cell death by measurement of cleaved caspase 3 in transfected MIO-M1 cells. Overexpression of miR-15a ultimately resulted in significantly higher levels of apoptosis in MIO-M1 cells compared with scrambled transfected cells (Fig. 3I). Molecular studies have found that apoptotic cell death is a hallmark of the early phases of DR and responsible for pericyte loss and acellular capillaries (32, 39). Our data also indicated that by targeting Akt3, miR-15a plays an important role in the initiation process of DR in MIO-M1 cells.
Pancreatic β-cells are the source of circulating miR-15a
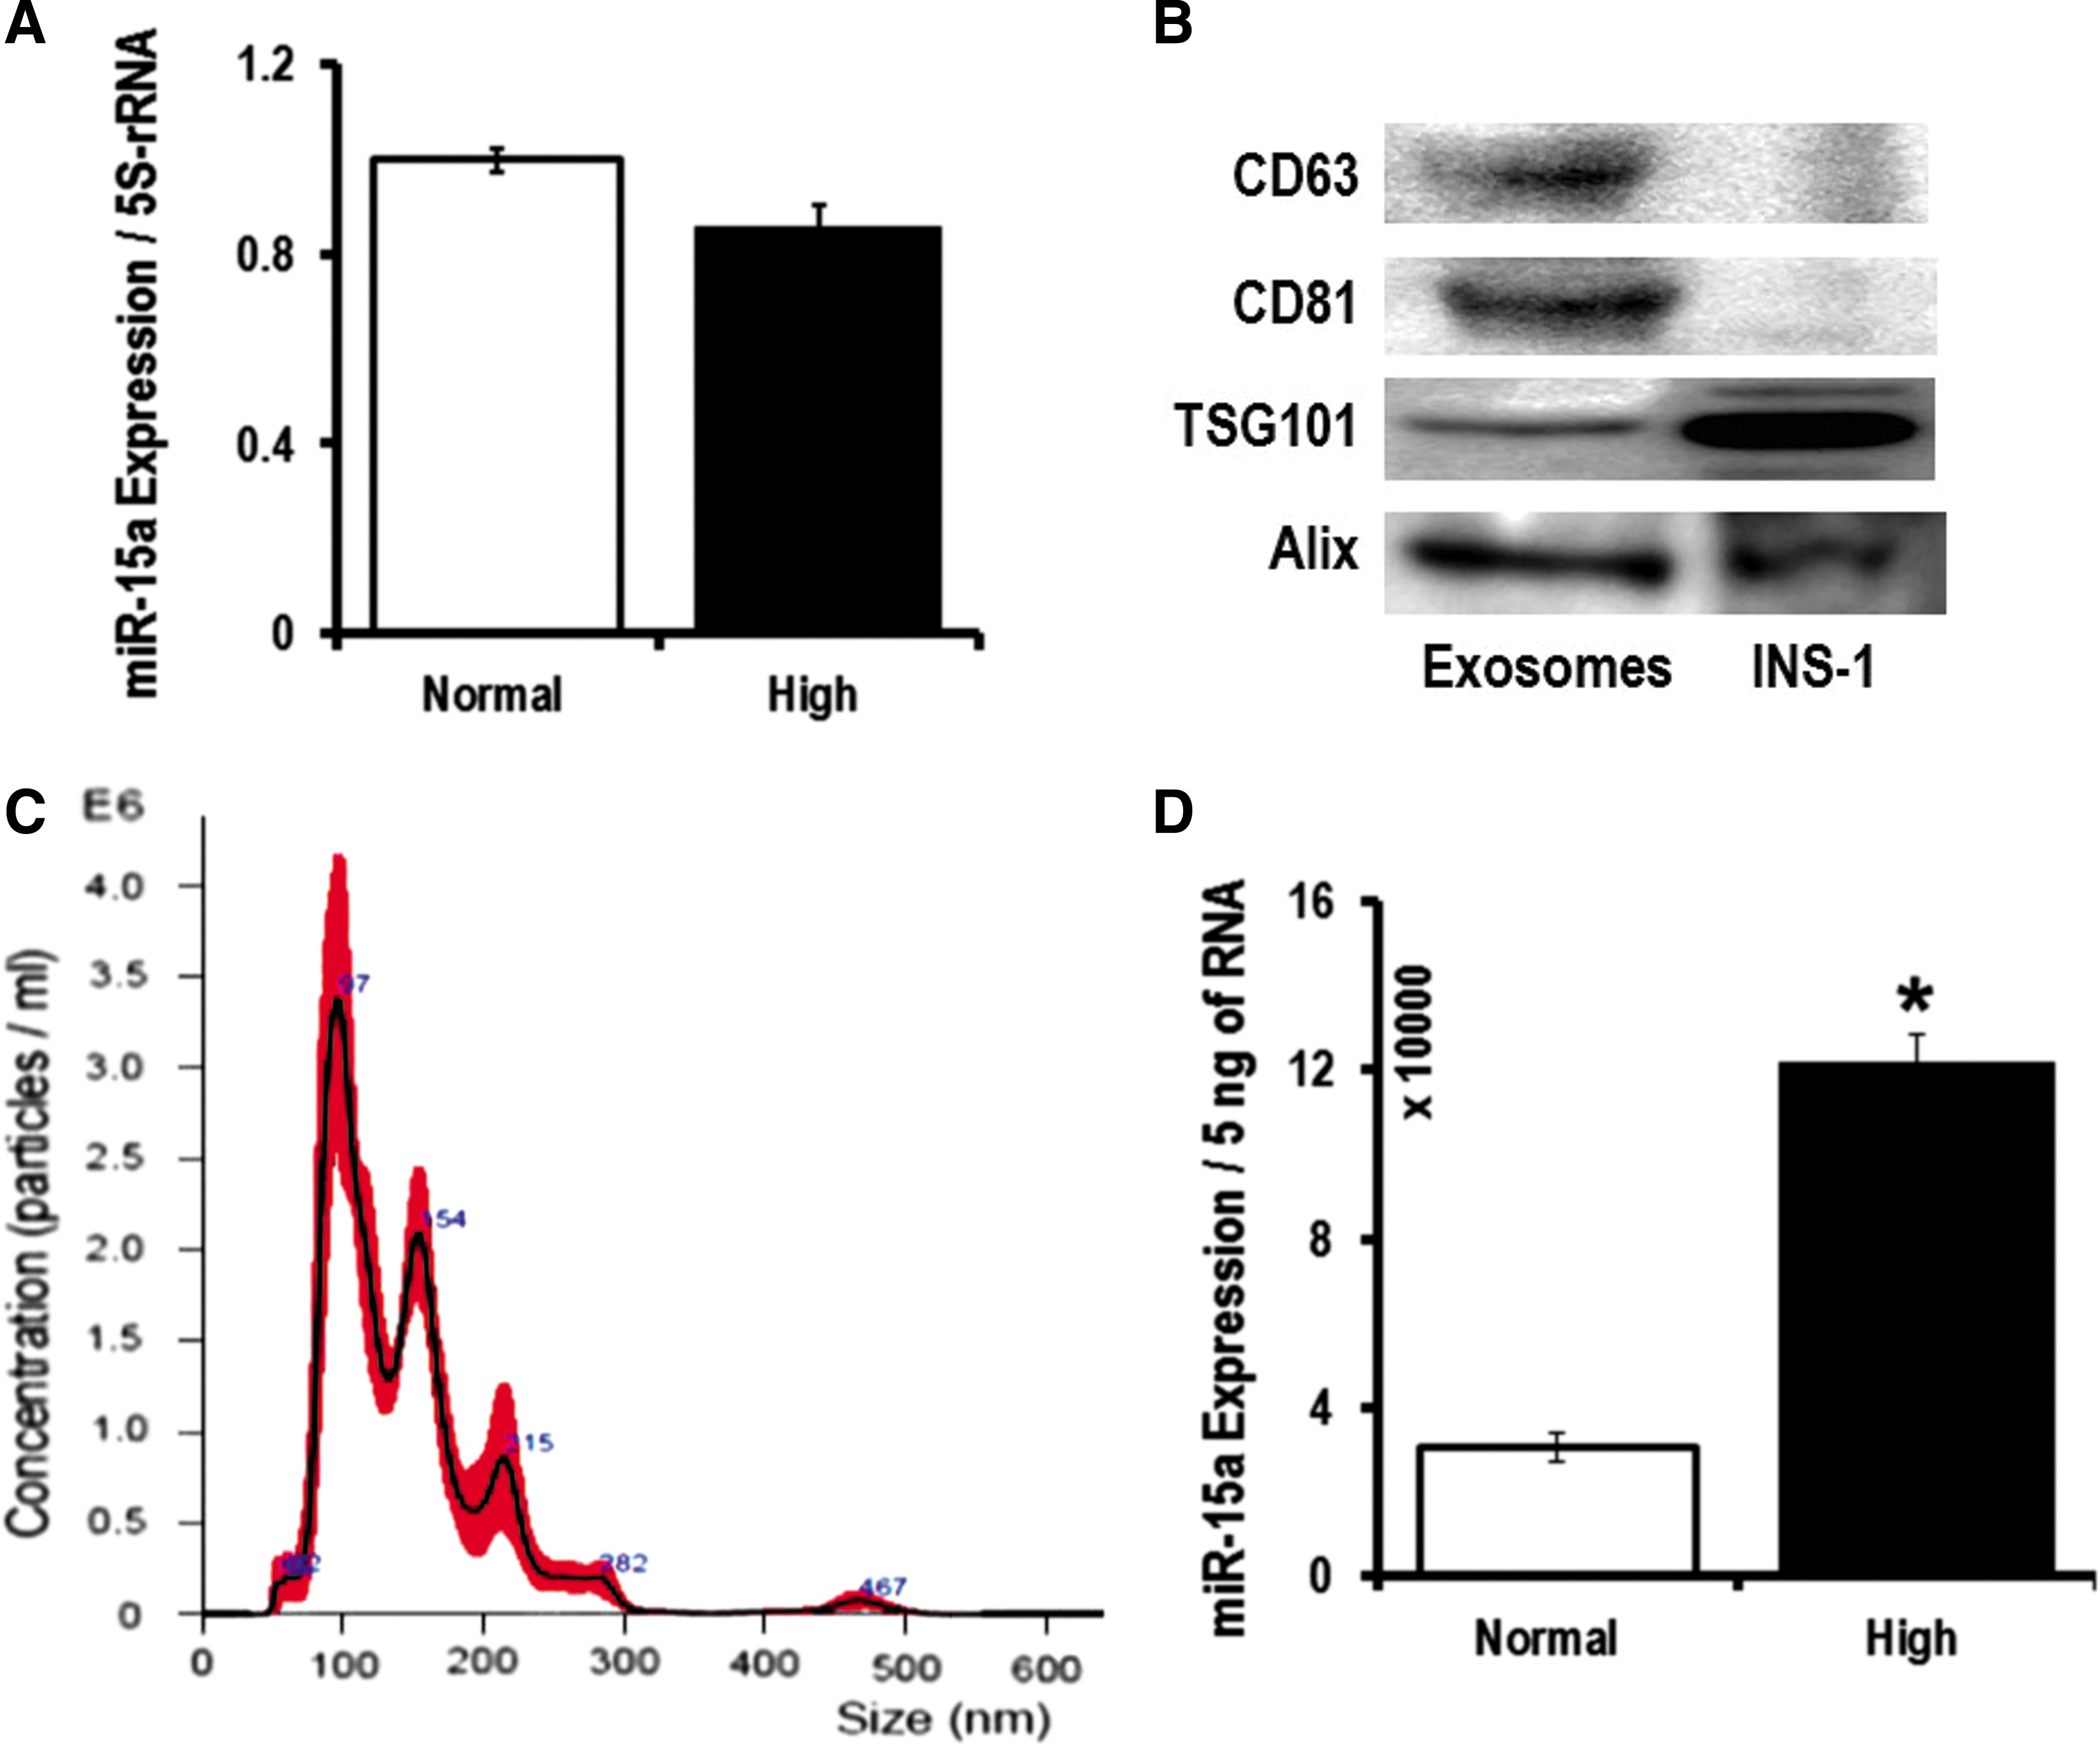
When a cell is activated, early exosomes encapsulate cellular materials that are abundantly expressed (20). Exosomes carry >70% of miRNAs in the blood (45). We hypothesize this to be the source of miR-15a in the blood stream of T2D patients. In our cell culture experiments, we did not see differences in miR-15a expression in different retinal cells when mimicking T2D conditions (Fig. 2). This led us to hypothesize that miR-15a may be entering the retina via exosomes from a nonretinal source. It is known that miR-15a is important in the development of the mouse pancreas and it positively regulates insulin synthesis from pancreatic β-cells (22, 44). Therefore, we decided to explore miR-15a levels in pancreatic β-cells. We have validated the previous report on the positive role of miR-15a on insulin biogenesis, thereby regulating blood glucose (22, 44). We measured blood glucose and insulin in miR-15a−/− mice compared with wild-type (WT) age-matched mice. Consistent with previous findings (44), we also found that miR-15a plays an important role in the biogenesis of insulin in pancreatic β-cells by measuring fasting blood glucose and insulin levels in miR-15a−/− mice (Fig. 4A, B). However, using cultured INS-1, we did not observe any intracellular miR-15a expression difference between the normal and high-glucose conditions (Fig. 5A). We then isolated exosomes from the INS-1 cell culture media from these two different conditions. The exosomes expressed the conventional exosomal markers, such as CD63, CD81, TSG101, and Alix (Fig. 5B). These exosomes do not express CD9 on the surface. Nanoparticle tracking analysis (NTA), using NanoSight, further confirmed that the EVs derived from INS-1 cells are exosomes based on the average size of 145.4 ± 4.3 nm (Fig. 5C). NTA analysis also detected a very high concentration of exosomes in the INS-1 cultured media after 48 h of high-glucose culture: 2.55 × 10¹⁰ ± 1.3 × 10⁷ versus 1.21 × 10⁹ ± 2.56 × 10⁷ (normal glucose). We found an almost fourfold increase in miR-15a in exosomes under high-glucose culture conditions compared with normal glucose conditions (Fig. 5D). These data also support the concept that exosomes contribute to normal homeostasis through packaging of intracellular miRNAs into exosomes, which can be released from the cell (20).

Exosomal transport of miR-15a from pancreatic β-cells to retinal cells
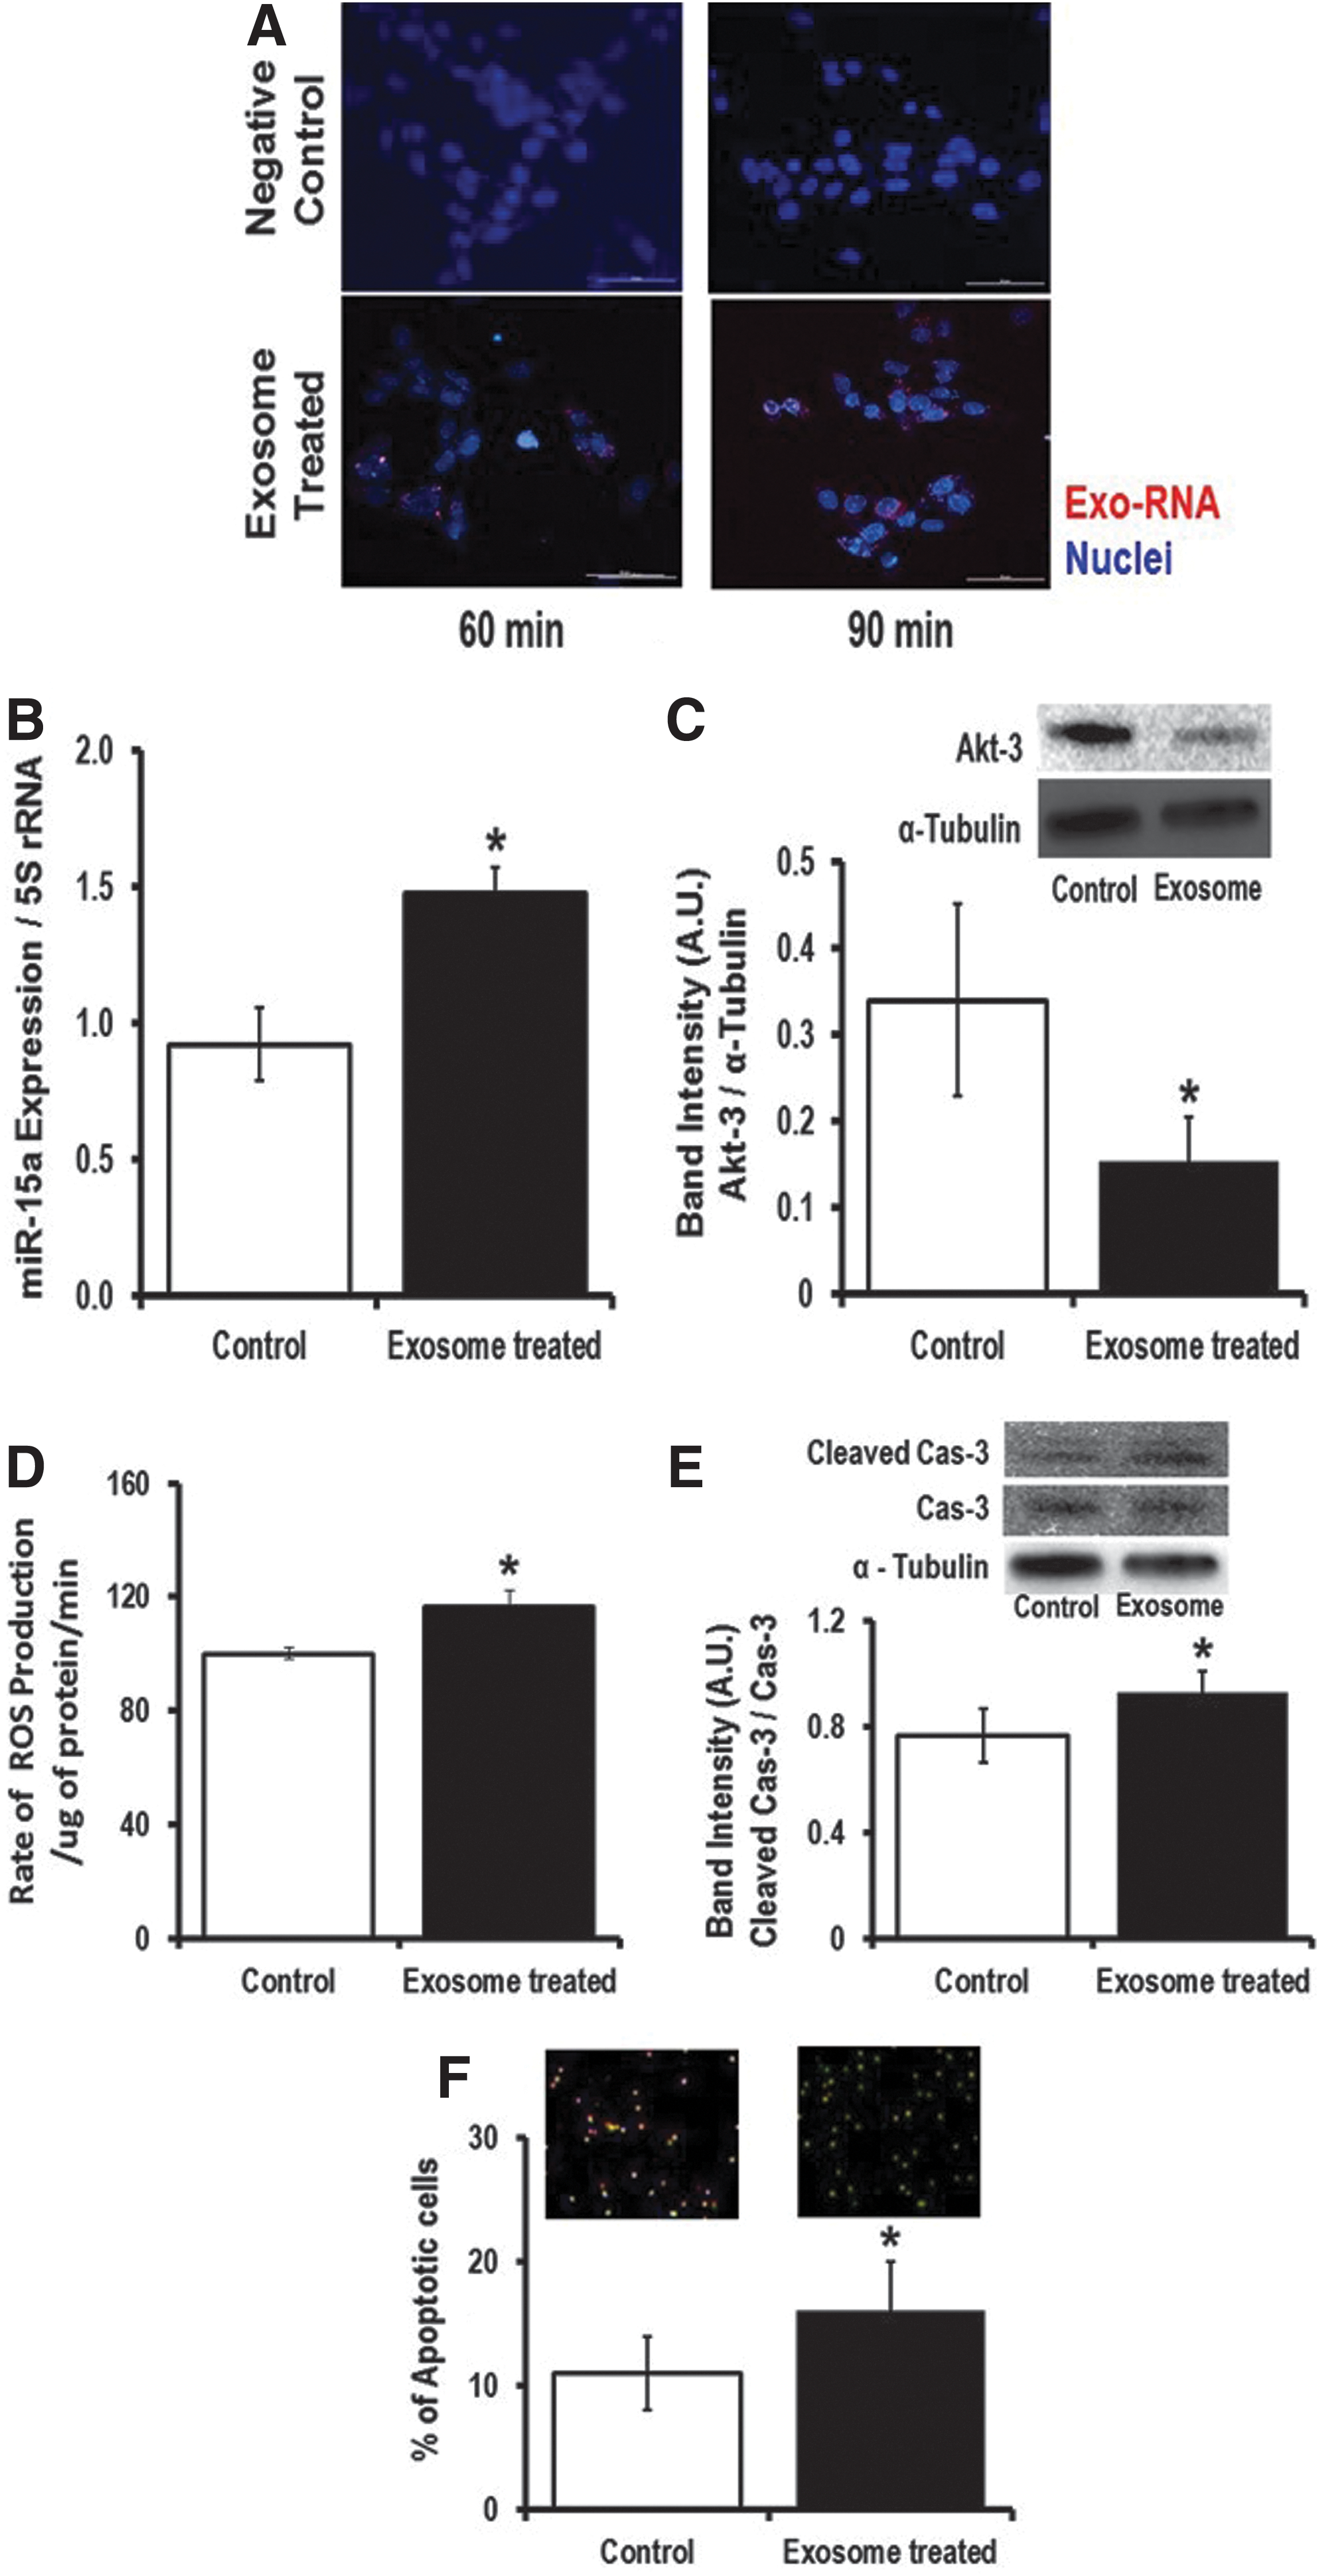
To show that pancreatic β-cell exosomes are taken up by retinal cells, we used the rMC-1 cell line. We added the INS-1 (cultured under high-glucose condition)-derived exosomes into the rMC-1 culture media and studied effective transfer of exosomal RNA into the recipient rMC-1 cells using a time-lapse Nikon Eclipse Ti-E inverted microscope (Nikon Instruments, Inc., Melville, NY). After 30 min of incubation with labeled exosomes, the exo-RNA signals were visible inside the rMC-1 cells, whereas we did not observe any red fluorescent protein (RFP) signals inside rMC-1 cells when we did not incubate INS-1-derived exosomes in the culture media. Similarly, we have also validated that human retinal cells can also internalize exosomal RNA (Supplementary Fig. S5). Incubation for 48 h with INS-1-derived exosomes significantly increased miR-15a expression in rMC-1 cells (Fig. 6B), which ultimately targets Akt3 in rMC-1 cells (Fig. 6C). Consistent with the human MIO-M1 study (Fig. 3), exposure of rMC-1 cells to INS-1-derived exosomal miR-15a (exo-miR-15a) caused increased ROS production in recipient rMC-1 cells (Fig. 6D). The higher ROS production then activates apoptotic cell death as evidenced by higher cleaved caspase 3 content (Fig. 6E) and a significantly higher number of Annexin V-stained rMC-1 cells compared with its control group (Fig. 6F). Hence, we conclude that exo-miR-15a is not only transferred through exosomes from pancreatic β-cells to other cell types (retinal Müller cells) but it also initiates retinal damage by inducing oxidative stress by targeting Akt3.
Transfer of miR-15a from the pancreas to the retina, in vivo
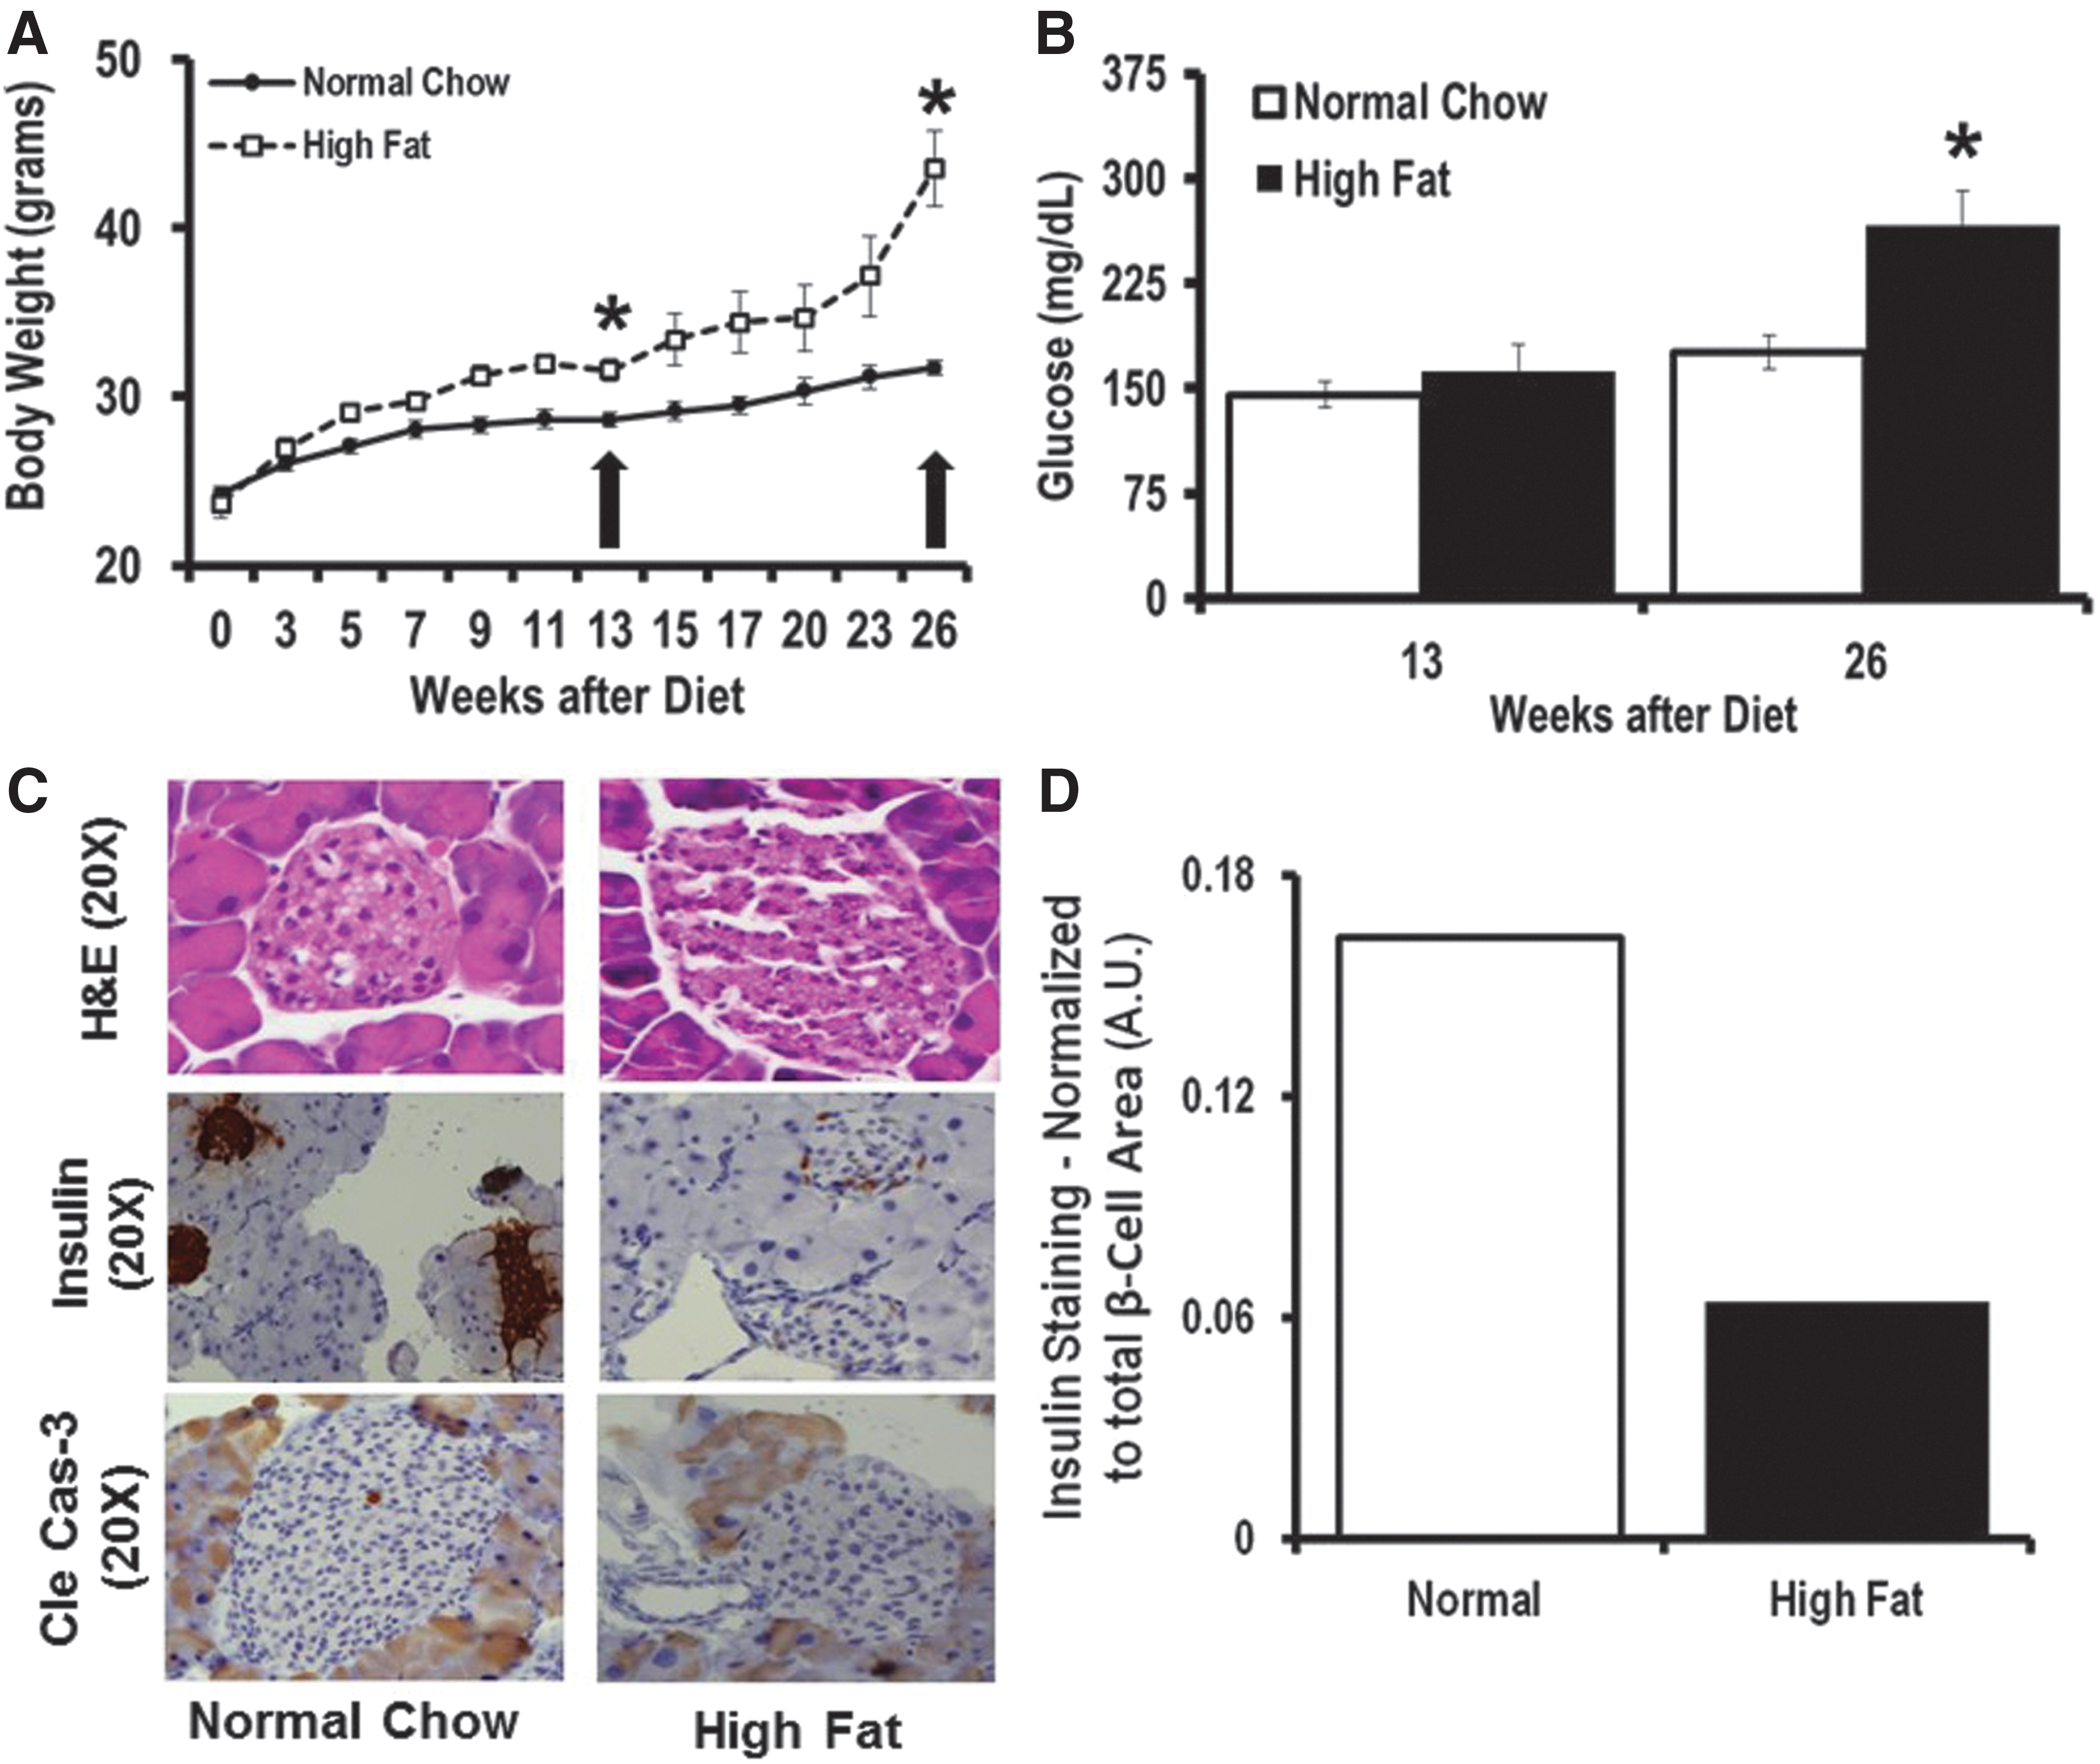
To validate our in vitro findings, we fed C57BL/6 mice a 60% high-fat diet (HFD) to induce T2D (Fig. 7A). We measured their blood glucose level at two time points, at 13 and 26 weeks of HFD (Fig. 7B). Mice were sacrificed 13 weeks after HFD initiation (early T2D phase without DR) and 26 weeks after continuous HFD (more advanced stage of T2D). We used C57BL6 mice from Jackson laboratory and Jackson's diet-induced obesity phenotypic data such as body weight, glucose tolerance test, and insulin level (
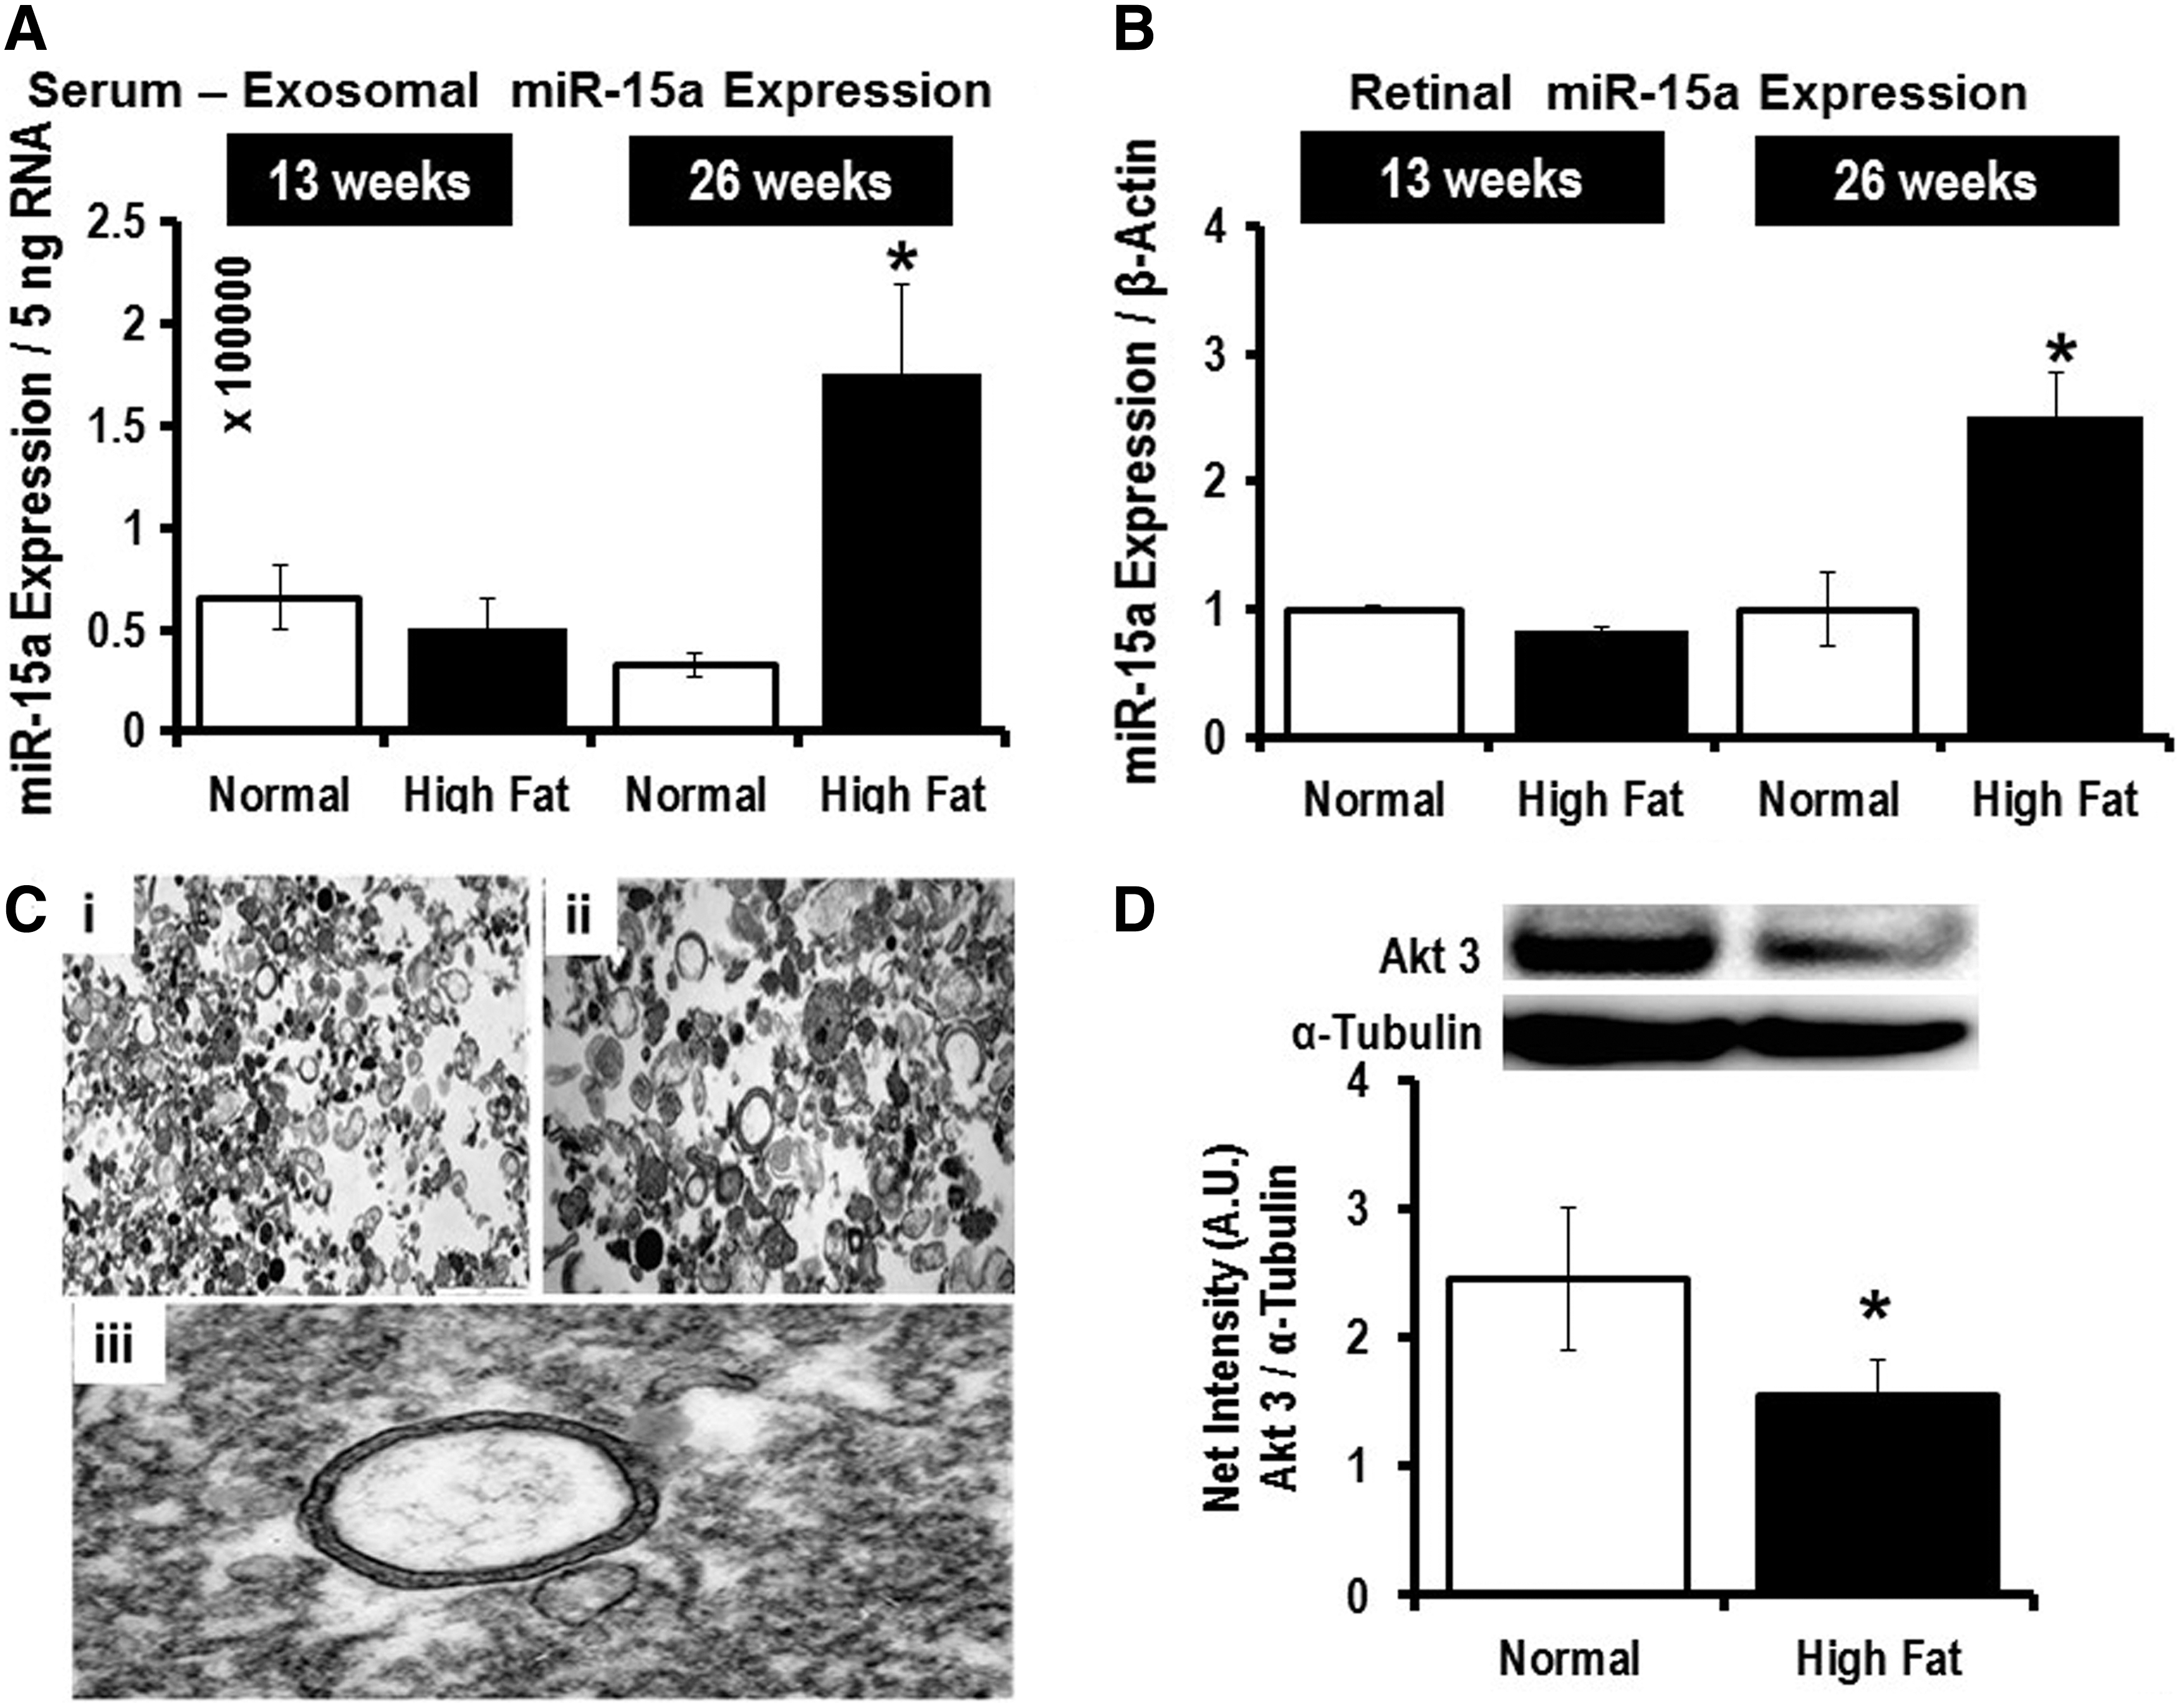
After 26 weeks of HFD, and not after 13 weeks of HFD, we observed significantly higher miR-15a expression in both blood-derived exosomes (Fig. 8A) and in the retina (Fig. 8B). Cells can secrete different types of EVs: microparticles (∼1 μm in size), exosomes (30–200 nm in size), and apoptotic bodies (100 μm or higher in size). Electron microscopy was performed on the EVs isolated from mouse serum samples after 26 weeks of the HFD (Fig. 8C). Using iTEM software, we calculated the average size of the EV to be 140 nm. Furthermore, we employed NanoSight to further validate that the majority of EVs found in the serum samples are exosomes (Supplementary Fig. S6). The in vivo T2D mouse model further supports the concept that the higher miR-15a expression in the retina is likely not attributable to retinal cell activation of miR-15a expression under T2D conditions, but rather may be due to retinal uptake of exosomes from the blood probably secreted by pancreatic β-cells, which are the most affected cell type in T2D. Additionally, we also looked at Akt3 expression in the retina of the mice at the 26-week time point and found significantly lower protein content in the HFD group compared with normal chow-fed mice (Fig. 8D), further validating the in vitro finding that miR-15a directly targets 3′-UTR of Akt3 mRNA in the retina. These in vivo data also confirmed the potential role for miR-15a in the pathogenesis of DR via Akt3 downregulation. Thus, the observations made in tissue culture are recapitulated in the HFD model of T2D.
Exosomal cargo of miR-15a from pancreatic β-cells to the retina during T2D stress
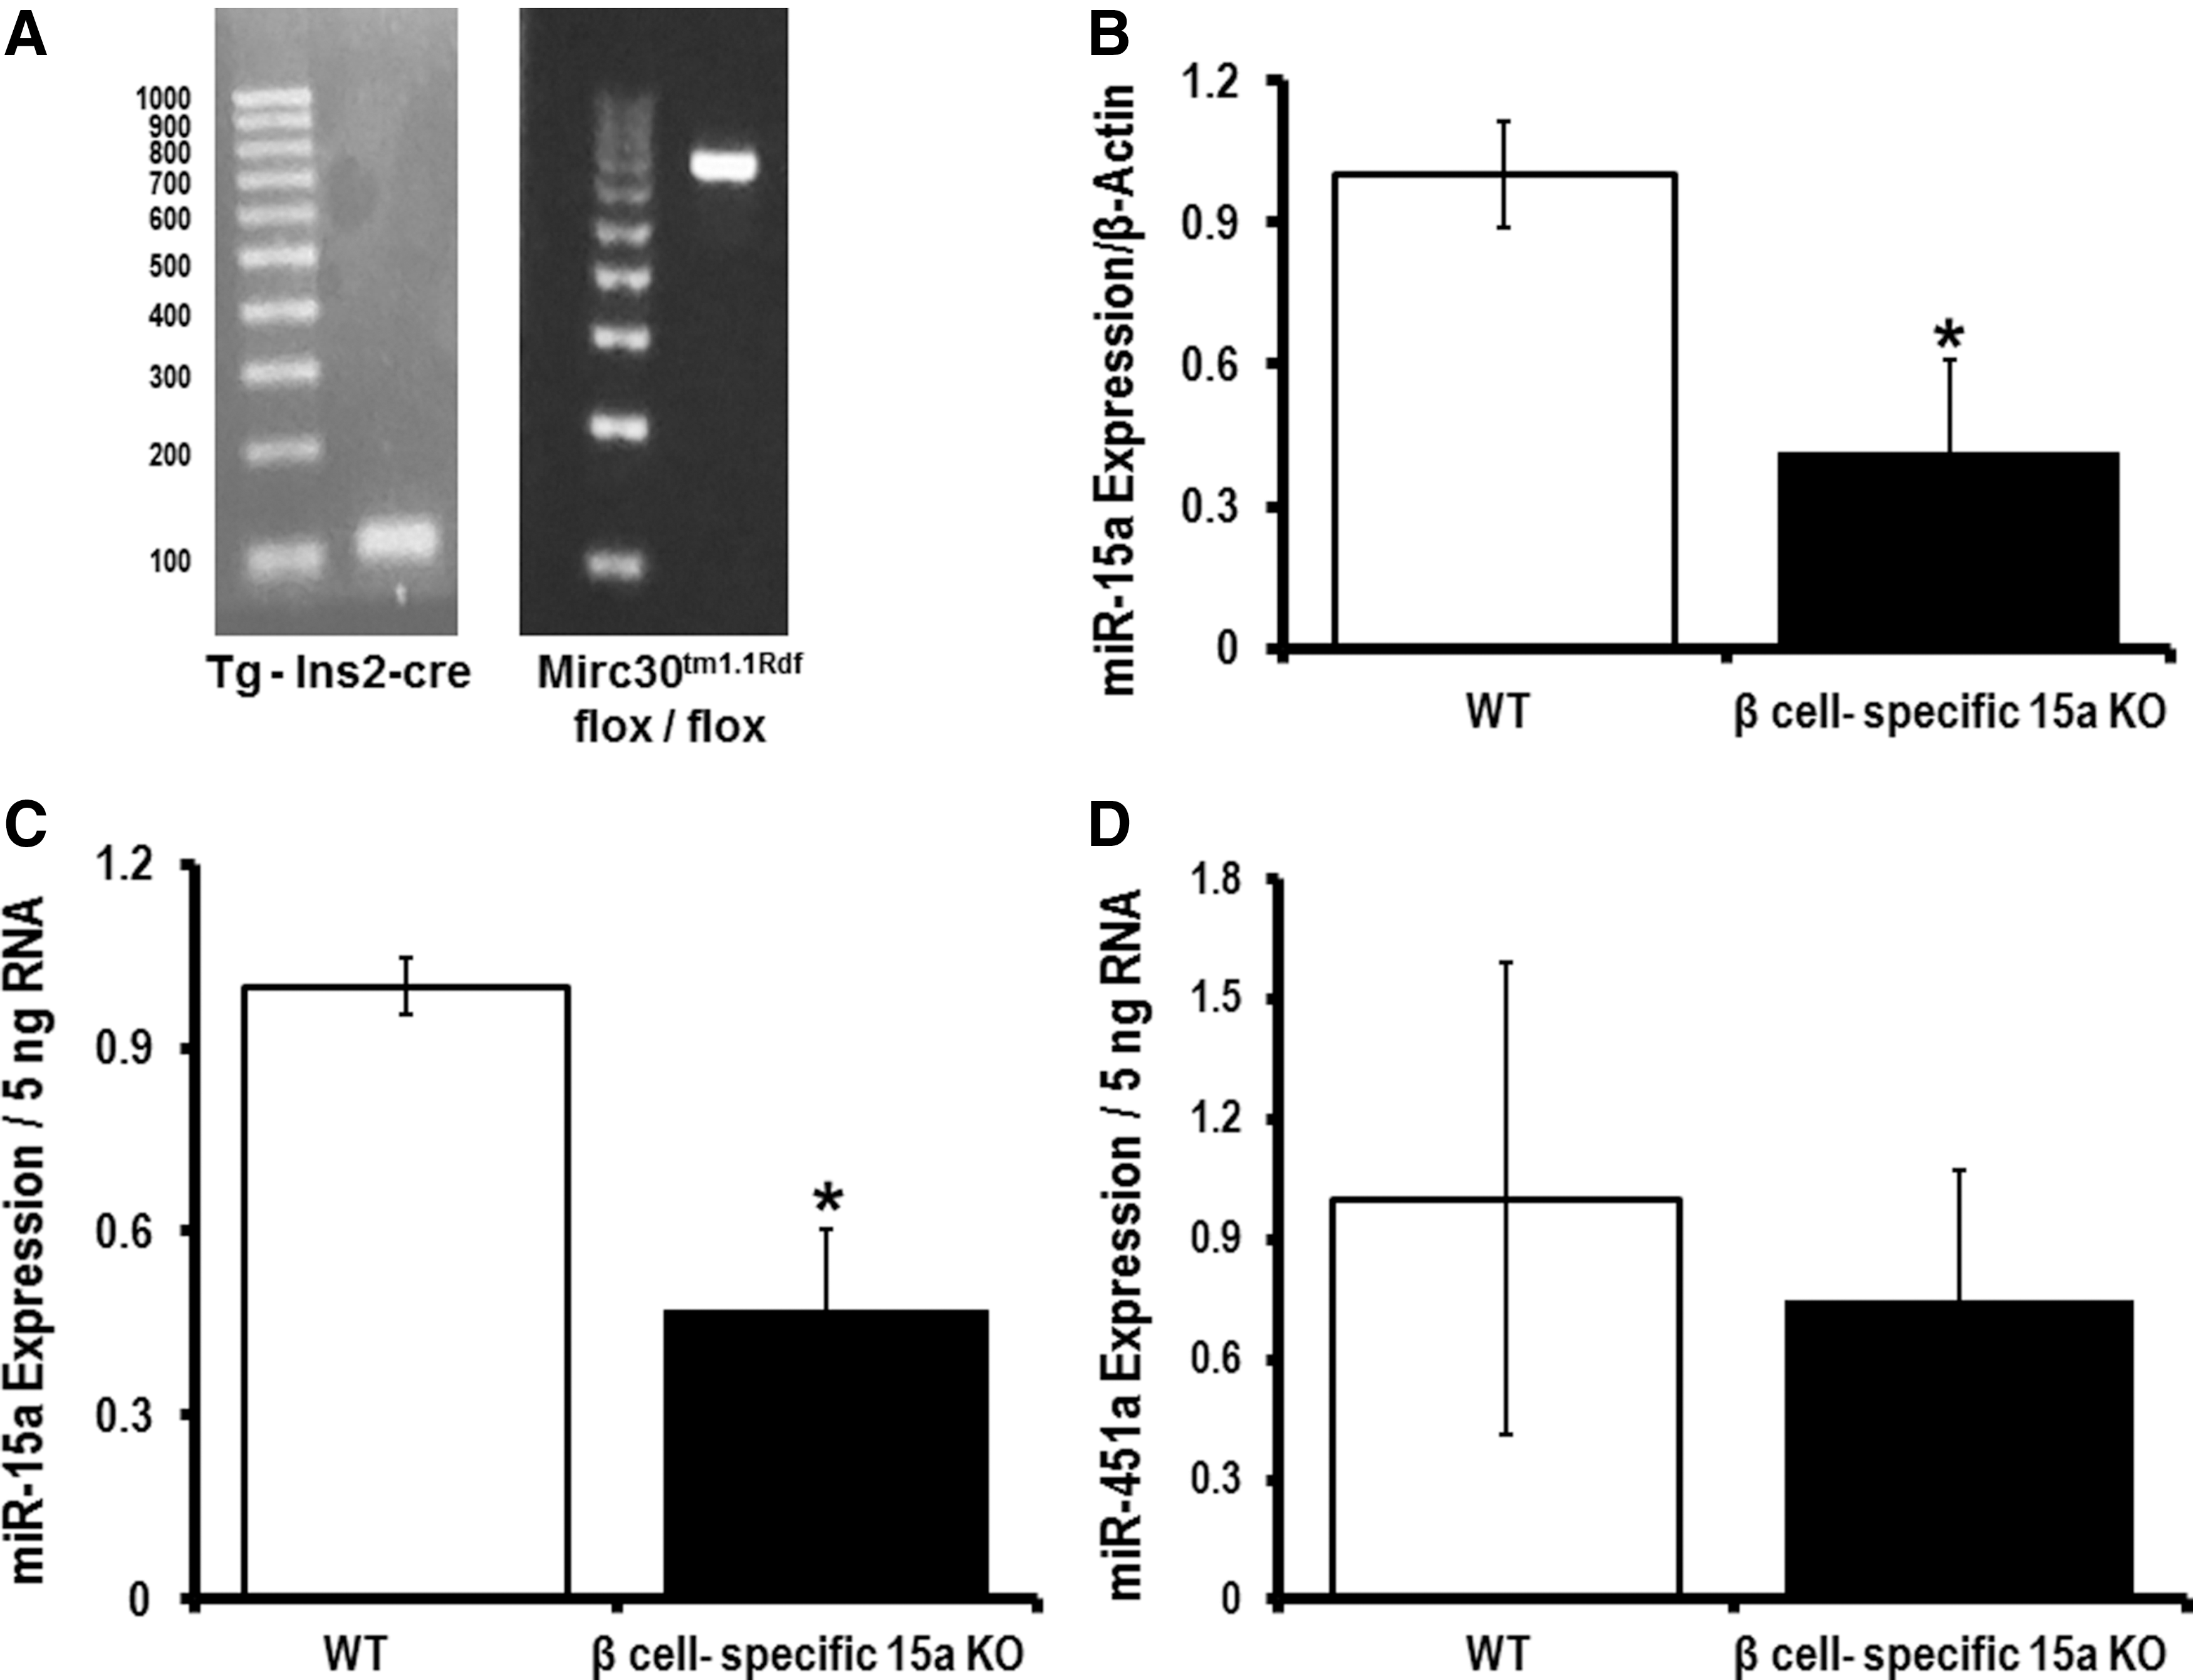
Currently, the available technologies are not sophisticated enough to allow for tracking of pancreatic β-cell-specific exosomes in vivo. Thus, we have generated a pancreatic β-cell-specific miR-15a knockout mouse (Fig. 9A; Supplementary Fig. S7). This mouse allows us to study exosomes secreted by pancreatic β-cells under T2D conditions. We hypothesized that the exosomes from pancreatic β-cells in pancreatic β-cell-specific miR-15a knockout mice will not carry miR-15a when mice are on the HFD and that retinal miR-15a will not increase if the pancreas cannot produce miR-15a since the increase in retinal miR-15a is dependent on the import of pancreatic exosomes containing miR-15a. We used pancreatic β-cell-specific Cre-expressing mice as the WT group. After 18 weeks of the HFD, the pancreatic β-cell-specific miR-15a−/− group of mice showed a significant decrease in miR-15a expression in the retina compared with the corresponding WT mice (Fig. 9B). These data suggest that retinal miR-15a expression during the T2D condition depends on miR-15a release by pancreatic β-cells. To demonstrate that pancreatic β-cells package miR-15a into exosomes, which can be found in the circulation, we isolated the exosomal fraction from serum samples of these two groups of mice: β cell-specific miR-15a−/− and WT. Consistent with the retinal expression data, the β cell-specific miR-15a−/− group showed a significant decrease in exo-miR-15a expression compared with its corresponding WT group. As a negative control, we measured miR-451a expression in the exosomal fraction of serum samples and observed no difference in the exo-miR-451a expression between the two groups.
Discussion
miRNAs have been shown to originate from one cell type and regulate protein expression in recipient cells in a paracrine manner (10). Thus, transported miRNAs encapsulated by exosomes are getting more attention as a cell-to-cell regulatory mechanism in different diseases (1, 10, 35), including diabetes (6, 16, 42). The importance of miRNAs in diabetes is exemplified by the consequences of decreasing miRNA synthesis. Mice with pancreas-specific knockout of DICER have impaired cellular miRNA biogenesis (28) and exhibit a significant decrease in insulin production, which ultimately causes diabetes (29). It has recently been shown that pancreatic β-cells secrete exosomal miRNAs, which play an important role in cell-to-cell communication (16). In this study, we took this concept one step further. Using plasma samples from patients, we have identified miR-15a as incrementally increasing with DR initiation and progression in patients with T2D (Fig. 1B). Our ultimate goal in this study was not only to support the novel concept that miRNAs can be produced in one organ and have an endocrine function by transport in exosomes to remote targets but also to determine the precise role of individual miRNA(s) in the initiation of microvascular disease induced by T2D. This can most easily be accomplished by employing in vitro (high glucose) and animal models (HFD model), investigating the effects of these manipulations on different organs. Individual miRNAs may have different roles in different tissues, while playing no role in other tissues. As these are defined in animal studies, the information can be used to determine whether the same mechanisms are also applicable to patients. In this study, using our in vitro approach, we demonstrate that hyperglycemia is not responsible for the upregulation of miR-15a in retinal cells (autocrine signaling) (Fig. 2). However, using our in vivo HFD animal model, a significant increase in miR-15a levels in the retina was observed after 26 weeks (Fig. 6D). Taken together, these data suggest that increases in miR-15a levels within the retina are the result of miR-15a uptake by retinal cells from the blood, rather than a cell autonomous mechanism of upregulation. Our mouse data further support this conclusion as we have observed higher levels of miR-15a in exosomes circulating in the blood of mice fed an HFD for 26 weeks (Fig. 6C).
One novel aspect of this study was identifying a source of an upregulated miRNA and monitoring its transport through the circulation. Pancreatic β-cells are the only source of insulin, which is essential for maintaining blood glucose levels. It has been shown that miRNAs play an important role in the synthesis of insulin in pancreatic β-cells (29), including miR-15a (44). When there is increased demand for insulin (during T2D), pancreatic β-cells compensate by increasing the production of insulin. During this phase, the transcription of miR-15a increases, resulting in miR-15a production within pancreatic β-cells. Some of the increased miR-15a gets encapsulated by exosomes and is secreted from cells by normal exosomal biogenesis (20). In our study, we have characterized the exosomes secreted by INS-1 cells (Fig. 4B, C). We have also validated that culturing INS-1 in high-glucose media can increase exo-miR-15a secretion by almost fourfold (Fig. 4D). Furthermore, culturing rMC-1 cells with these exosomes resulted in a significant increase in miR-15a expression in the rMC-1 cells (Fig. 5A). Exo-miR-15a then stimulates apoptotic cell death by activating proapoptotic signaling cascades by targeting Akt3 in rMC-1 cells (Fig. 5B–E). Importantly, the results also show that the exosome-mediated transfer of miR-15a is functionally active in retinal cells. Our in vivo data indicate that miR-15a levels are increased in the exosomes derived from the blood of animals fed the HFD (Fig. 6C). With the exception of exosomes, EVs normally bud off from the cell membrane when cells are under stress and dying. In contrast, the biogenesis of exosomes requires adenosine triphosphate and thus cells need to be healthy for this process to occur (20). This concept of pancreatic β-cells secreting exosomes containing miRNAs, which can in turn influence different cell types, has recently been reported (16). To further validate the novel concept that exosomes cargo miR-15a from the pancreatic β-cells to the retina, we used pancreatic β-cell-specific miR-15a knockout mice. After 18 weeks of HFD, we identified a significantly lower expression of miR-15a in both the retina and circulating exosomes in the blood (Fig. 9B, C). We did not observe any difference in the expression of exo-miR-451a in the two groups.
The development of diabetes-induced metabolic injury is greatly influenced by elevated oxidative stress. Animal studies have shown a beneficial effect of various antioxidants on the development of DR (24). The retina has been found to be more susceptible to oxidative stress as it has a very high content of polyunsaturated fatty acids and high O2 uptake and glucose oxidation relative to other tissues (2). Increased superoxide concentration is considered a causal link between elevated glucose and other metabolic abnormalities important in the pathogenesis of diabetic complications (24). Inhibition of the phosphoinositide 3 (PI3)-kinase signaling pathway can produce excess amounts of ROS (34). Akt serves a pivotal role in the retinal insulin receptor signaling pathway as a downstream component of the PI3-kinase pathway (39). At the early stages of DR, the basement membrane thickens, blood flow is altered, and pericytes and endothelial cells undergo accelerated apoptosis, resulting in pericyte ghosts and acellular capillaries (25, 32). Akt has three isoforms, Akt1, Akt2, and Akt3, which share a high degree of structural and sequence homology (23). Using biochemical assays (dual luciferase), it has been shown that miR-15a can directly bind to the 3′-UTR of Akt3 (43). For our retinal cell culture studies, we chose cultured Müller cells because the literature is highly suggestive that Müller cells play a critical role in DR (48, 53). Thus far, there is greater evidence for the role of Müller cells in DR compared with HRPEs or HRECs (48, 53). By targeting Akt3, miR-15a induces ROS accumulation in Müller cells by inhibiting the PI3-kinase pathway (Fig. 3H and 5C). This redox environment then activates proapoptotic signaling in the Müller cells of the retina (Fig. 3I and 5D, E). Our in vitro data suggest that miR-15a overexpression plays an important role early in DR pathogenesis, but may play a different role in the advanced stages of the disease. We have concluded this based on our data demonstrating that miR-15a does not alter VEGF-A expression (Fig. 3G) in the cells.
miR-15a has been shown to have higher expression in the vitreous of eyes with macular hole and in the whole blood of PDR patients (n = 4) (18). Vitreous fluid may play an important role in DR (18). In this study of early diabetic retinal injury, we utilized human plasma samples and found that miR-15a may serve as a molecular biomarker (Fig. 1B). We then moved into in vitro and animal models to understand the underlying mechanism by which transfer of miR-15a occurs from the pancreatic β-cells to retinal cells via exosomes. In the mouse model, increased miR-15a in the exosomes corresponds to the period of increased insulin secretion from the pancreas, but diminishes as the T2D progresses and the pancreatic β-cells become reduced in number. When we analyze the human data with regard to insulin treatment, we find that the average expression of miR-15a in the plasma of the T2D-PDR group is no different than the healthy control group, but analysis of case histories of the T2D-PDR subjects revealed that these patients are on regular insulin treatment, suggesting that pancreatic β-cell insulin secretion is diminished in these subjects (Fig. 1B). More interestingly, there were 8 to 9 patients whose miR-15a normalized expression value in the T2D-NPDR group lowered the statistical p value when compared with the T2D no complication group. Analysis of their clinical data revealed that these patients were also on regular insulin treatment (Fig. 1B). Similarly, in our STZ-induced diabetes mouse model, we did not see any upregulation of miR-15a expression in the exosomes isolated from the serum samples compared with saline-treated mice (data not shown here), suggesting that the source of miR-15a is the pancreatic β-cells under T2D conditions. These two observations indirectly support our hypothesis that during the phase of high insulin production (early T2D), pancreatic β-cells activate miR-15a expression, and the excess miR-15a is released from the β-cells in exosomes. Exosomes cargo the excess miR-15a to the retina, and over the period of T2D, miR-15a accumulates in the retina and stimulates ROS production, which may be part of the mechanism underlying DR.
Taken together, our study not only emphasizes the role of miR-15a in the pathogenesis of DR but also supports the novel concept that miR-15a can be produced in pancreatic β-cells and have a remote function by transport in exosomes to distant microvascular beds. We have also demonstrated that T2D markedly increases exo-miR-15a release from β-cells, which can be taken up by Müller cells, causing oxidant stress and apoptotic cell death due to inhibition of the PI3-kinase signaling pathway. To our knowledge, this is the first evidence demonstrating that as T2D progresses, pancreatic β-cells increase the exosomal cargo of miR-15a in parallel with the increased insulin demand. This increased miR-15a, entering into the blood stream via exosomes, is subsequently transported to remote vascular beds, including the retina, where it contributes to the progression of DR. This unique observation not only highlights the exciting potential for miRNAs as diagnostic biomarkers for impending T2D complications but also may prove to be a new target for therapeutic intervention to prevent DR.
Materials and Methods
Blood collection and storage
This research work received approval from the Medical Ethics Committee, University Malaya Medical Centre (UMMC), Kuala Lumpur (Ref. No. 968.23). Adult volunteers between 30 and 65 years were recruited between November 2012 and July 2013, with their written consent from the Ophthalmology Clinic at UMMC. All volunteers underwent complete eye examination, including dilated fundus examination; in addition, all the healthy controls underwent a screening blood test to exclude diabetes mellitus. Blood samples (∼5 mL) were collected in EDTA tubes. Plasma was separated by centrifugation. We used the miRNeasy Serum/Plasma kit (Qiagen, Valencia, CA) according to the manufacturer's recommended protocol with slight modification to isolate the miRNA-enriched total RNA.
miRNA profiling
For miRNA microarray analysis, we pooled three independent patient blood plasma samples for each group (nondiabetic healthy controls and diabetic patients, without any complications). The miRNA microarray profiling was performed using a qPCR-based microarray (Qiagen) according to the manufacturer's recommended protocol. Complementary DNA was injected into the microarray panels.
Multiplexed miRNA profiling
PAXgene samples were shipped to Firefly BioWorks, Inc., (Abcam, Cambridge, MA) for miRNA profiling using the Firefly™ Cellular miRNA assay. Samples were thawed and diluted to 10 ng/μL in nuclease-free water. The Firefly assay was carried out according to the manufacturer's protocol utilizing a sample input of 45 μL. Assay readout was performed on a guava easyCyte™ 8HT flow cytometer (Millipore).
Quantitative reverse transcription-polymerase chain reaction
After performing the purity and integrity test, the RNA was reverse transcribed using the miScript Reverse Transcription Kit (Qiagen). PCR was performed using the miScript SYBR Green PCR kit (Qiagen) and detected with an iQ5 detector (Bio-Rad, Hercules, CA). All reactions were performed in triplicates. We used human miR-15a, SNO61, and rat 5S-rRNA primers from Qiagen and used mouse β-actin, FWD: 5′-GGCTGTATTCCCCTCCATCG-3′, and REV: 5′-CCAGTTGGTAACAATGCCATGT-3′.
RNA isolation
The whole blood-derived miRNA-enriched fraction was isolated using the PAXgene Blood miRNA Kit (Qiagen) following the manufacturer's instructions. We improved our total RNA yield significantly compared with the miRNA-enriched fraction from patient plasma. The integrity of the isolated miRNA-enriched fraction using PAXgene technology was far better than the miRNA-enriched fraction from plasma.
Total RNA was isolated from exosomal fractions, cultured MIO-M1, rMC-1, INS-1, HRECs, HRPEs, mouse pancreas, and mouse retinal tissues using the miRNeasy kit as per manufacturer's instructions. To avoid genomic DNA contamination, DNase digestion was performed using the RNase-free DNase kit (Qiagen) as per manufacturer's instructions. We used spectrophotometric evaluation using Nanodrop to measure the quality and quantity of total RNA.
Cell culture of MIO-M1, rMC-1, HRECs, HRPEs, and INS-1
The MIO-M1 cell line, rMC-1, and HRPEs (Cat. No. CRL-2302 from ATCC, Manassas, VA) were cultured in Dulbecco's modified Eagle's medium (DMEM) plus 10% fetal bovine serum (FBS) and 1% GlutaMAX-I supplement (Invitrogen, Grand Island, NY). For the normal culture group, we used 5.5 mM of premixed glucose in DMEM. To mimic T2D in vitro, we added 20 mM D-glucose into the culture media. O-methyl glucose (14.5 mM) and mannitol (14.5 mM) were used as osmotic controls in normal media with 5.5 mM glucose (5). Furthermore, to recapitulate T2D, we have also used AGE and MG (30 μM) along with 20 mM glucose in the culture media of rMC-1 cells (11).
HRECs were cultured in EGM-2 plus EGM-2 BulletKit following the manufacturer's instructions (Cat. No. CC-3156 & CC-4176; Lonza, Allendale, NJ). We supplemented 5 mM for normal glucose and 20 mM for high-glucose conditions to grow the cells.
INS-1 cells (passage numbers 95–110) (kindly proved by Dr. Chris Newgard at Duke University) were cultured in RPMI 1640 containing 10 mmol/L HEPES, 11.1 mmol/L glucose, 10% FBS, 100 μU/mL penicillin G, 100 μg/mL streptomycin, 2.0 mmol/L L-glutamine, 1.0 mmol/L sodium pyruvate, and 50 μmol/L 2-mercaptoethanol. For the normal culture group, we used 5.5 mM of premixed glucose in the RPMI 1640. To mimic the T2D, we added d-glucose into the culture media to make the final glucose concentration 20 mM.
The cells are maintained at 37°C in the presence of 5% carbon dioxide in a humidified incubator for all normoxia experiments.
Transfection
Subconfluent MIO-M1 cells were transfected with a universal negative control and miRDIAN mimic human miR-15a-5p (Thermo Scientific, Lafayette, CO) using Lipofectamine 2000 for 48 h. Using this protocol, we could achieve a transfection efficiency of almost 70% (Fig. 5A, B).
ROS production assay
Hydrogen peroxide (H2O2) production from intact NRVMs was measured fluorometrically by measurement of oxidation of Amplex Red to fluorescent resorufin (Life Technologies, Carlsbad, CA). After 48 h of transfection, either with scrambled RNA or miR-15a, MIO-M1 cells were washed and incubated in buffer containing 140 mM NaCl, 3.6 mM KCl, 1.2 mM MgSO4, 2 mM CaCl2, 20 mM HEPES, 1.2 mM K2HPO4, and 11 mM glucose (pH 7.4). All incubations also contained 50 μM Amplex Red and 5 U/mL of horseradish peroxidase. The increase in fluorescence at an excitation of 544 nm and an emission of 590 nm was monitored. Standard curves were generated using known amounts of H2O2.
Western blot
Transfected MIO-M1 cells, mouse pancreas, retina, and the exosome fraction were lysed with RIPA buffer and protein content was measured using the Bradford assay (9). Cell homogenate protein was separated by 1D gel electrophoresis. After transfer to a PVDF membrane, the membrane was incubated with antibodies that recognize proteins, such as Akt (Cat. No. 9272, 1:1250 dilution), Akt1 (Cat. No. 2967, 1:1000 dilution), Akt3 (Cat. No. 3788, 1:1000 dilution), Alix (Cat. No. 2171, 1:1000 dilution), caspase 3 (Cat. No. 9668, 1:1250 dilution), cleaved caspase 3 (Cat. No. 9661, 1:1000 dilution) (Cell Signaling, Danvers, MA); CD9 (Cat. No. 10626D, 1:1000 dilution), CD63 (Cat. No. 10628D, 1:1000 dilution), CD81 (Cat. No. 10630D, 1:1000 dilution) (Thermo Fisher Scientific, Rockford, IL); TSG101 (Cat. No. A303-506A-T, 1:750 dilution) (Bethyl Laboratories, Montgomery, TX); α-tubulin (Cat. No. ab7291, 1:5000 dilution), and VEGF-A (Cat. No. ab183100, 1:1000 dilution) (Abcam) in tris-buffered saline (pH 7.4) with 1% Tween 20 (TBS-T), and 5% bovine serum albumin or nonfat dry milk at 4°C overnight. Membranes were incubated with the appropriate secondary antibody conjugated to horseradish peroxidase IgG in TBS-T with 5% nonfat dry milk for 1 h at room temperature. Immunoreactive protein was visualized using an enhanced chemiluminescence analysis kit (GE HealthCare, Piscataway, NJ).
Apoptosis staining
After 48 h of INS-1-derived exosomal incubation, the rMC-1 cells were stained with Annexin V (Alexa Fluor® 488 Annexin V Kit; Thermo Scientific) according to the manufacturer's protocol. Results were digitalized and analyzed in Countess II (Thermo Scientific).
Exosome isolation
We isolated the exosome fraction from cell line cultured media using the Total Exosome Isolation Reagent for cell culture media (Invitrogen) following the manufacturer's instructions.
We have also isolated the exosome fraction from mouse serum samples using the Total Exosome Isolation Reagent from serum (Invitrogen) following the manufacturer's instructions with slight modifications. Unlike cell culture media, exosomes isolated from serum are a mixture of multiple types of extracellular microvesicles, along with an abundance of protein aggregation. We incubated serum samples with 0.05 volumes of proteinase K at 37°C for 10 min. After incubation, we centrifuged the samples at 10,000 × g for 15 min. Following this modified protocol, we could achieve a relatively pure exosome population from mouse serum samples.
Exosome size and concentration measurement
Exosomes were resuspended in phosphate-buffered saline (PBS) and serially diluted to the optimum dynamic range of the NTA (NanoSight; Malvern Instruments Ltd., Malvern, UK) for measurement of size and particle density. Observed and tracked particles were incorporated into size distribution calculations according to the particles’ Brownian motion. The diffusion constant is then calculated and transferred into a size histogram via the Einstein–Stokes relationship between diffusion constant and particle size. For calculation of exosome concentrations, exosome yield was extracted by analyzing the NanoSight raw data and taking into account the dilution factor.
Exosomal RNA labeling
We used the differential ultracentrifugation method to isolate exosomes from either INS-1 (cultured in high-glucose media) or human embryonic kidney cells (HEK)-293 cells. Forty-eight hours after cell culture, the media were first centrifuged for 10 min at 800 × g, followed by another spin of 2000 × g for 30 min. The supernatant was then centrifuged for 15 min at 10,000 × g. We then performed ultracentrifugation (100,000 × g) for 120 min. Wash the pellet with PBS. Finally, we spun down the exosomal fraction (pellet) by centrifugation for 90 min at 100,000 × g. We stained the RNA/DNA inside the exosomes secreted by HEK-293 cells, using Acridine Orange (AO) chemistry, using the Exo-Glow Kit (System Biosciences, Mountain View, CA). AO is membrane permeable and labels single-stranded RNAs (exo-RNAs) inside the exosomes in red fluorescence. The fluorescently labeled single-stranded RNAs inside of exosomes were precipitated with ExoQuick-TC, followed by centrifugation for 3 min at 14,000 rpm. The pellets were washed with PBS a couple of times. We then incubated the INS-1 (cultured under high-glucose condition)-derived RNA-stained exosomes in the culture media of rMC-1 cells plated in 20-mm coverslip bottom cell culture dishes (1 × 10⁹ exosomes/1.5 × 105 cells). We performed live cell imaging on rMC-1 cells after adding stained exosomes from INS-1 cell culture, using a Nikon Eclipse Ti-E inverted microscope (Nikon Instruments). For exo-RNA detection in rMC-1 cells, we used excitation at 488 nm and emission 650 nm. To detect nuclear staining, we used Hoechst (450 Ex and 650 Em).
To demonstrate that human retinal cells can also uptake exo-RNAs, we used MIO-M1 as recipient cells. We used labeled exo-RNAs derived from HEK-293 cells and incubated them in culture media of MIO-M1 cells. Using fluorescent microscopy, we have detected the RFP signal (Ex 460 nm and Em 650 nm). HEK-293 cell-derived exo-RNAs inside MIO-M1 cells are the source of this RFP signal.
Animals
Male C57BL/6J and male miR-15a/16−/− mice (B6.129S-Mirc30tm1.1Rdf/J) (The Jackson Laboratory, Bar Harbor, ME) were used in this study. We have generated pancreatic β-cell-specific miR-15a/16−/− mice by crossing the floxed mutant mice that possess loxP sites flanking the miR-15a/16-1−/− cluster (B6.129S-Mirc30tm1.1Rdf/J) (The Jackson Laboratory) with pancreatic β-cell-specific Cre mice (B6.Cg-Tg(Ins2-cre)25Mgn/J) (The Jackson Laboratory). All the mice were provided with food and water ad libitum and housed in a light-cycle-controlled facility, 7 am to 9 pm light and rest of the time dark. Mice were treated humanely and all experimental procedures were approved by the Institutional Animal Care and Use Committee of Johns Hopkins University. We used ketamine–xylazine to anesthetize the animal (checked for total anesthesia by toe pinching) before we excised the organs. For the HFD-treated group, we randomly selected 8-week-old C57BL/6 mice and replaced their normal chow with a 60 kcal% fat and 40% protein (OpenSource Diets, New Brunswick, NJ) diet for 13 and 26 weeks.
Blood glucose and insulin measurement
Before the blood glucose and insulin test, the mice were fasted overnight. Glucose levels in the blood were determined using handheld glucose analyzers (Freestyle; TheraSense, Alameda, CA). Blood (20 μL) was collected into heparinized microcentrifuge tubes, centrifuged at 4°C to collect plasma, and stored at −80°C for insulin analysis. Plasma insulin concentration was determined using the rat/mouse insulin ELISA kit (EMD-Millipore, Billerica, MA).
Electron microscopy
For transmission electron microscopy (TEM), the samples were chemically fixed in 3% glutaraldehyde in 0.1 M sodium phosphate buffer (pH 7.3) for 24 h at 4°C, rinsed in 0.1 M sodium phosphate buffer, and postfixed in 1% osmium tetroxide in the same buffer for 1 h at room temperature. The tissues were dehydrated in a graded series of ethanol, transitioned with toluene, followed by infiltration and embedding in epoxy resin EPON 812 (Polysciences). Semithin sections of 500 nm thickness were cut and stained with 1% toluidine blue for visualization by light microscopy. Ultrathin sections of selected areas were cut at a thickness of ∼100 nm (gold interference color) with a diamond knife (DIATOME), placed on 200-mesh copper grids, and dried at 60°C for 10 min. To impart electron contrast, the sections were stained with a saturated solution of uranyl acetate for 10 min, followed by lead citrate for 2 min. The sections were examined with a TEM (Philips CM12 TEM) using a tungsten filament operating at an accelerating voltage of 60 keV. Images were acquired using a Morada 11 megapixel side-mounted TEM CCD camera (Olympus Soft Imaging Solutions).
Immunohistochemical staining
Mouse pancreas tissues were fixed in formalin and embedded in paraffin. Insulin (Cat. No. 3014, 1:100 dilution) and cleaved caspase 3 (Cat. No. 9661, 1:200 dilution) from Cell Signaling (Danvers, MA) and hematoxylin and eosin staining was performed on 5-μm-thick sections of the pancreas.
Digital image analysis
Slides that were stained for insulin were digitized on an Aperio AT system (Leica Biosystems). Using Aperio ImageScope tools, the area of brown pigmented cells was measured. That area was divided by the total area of islets of Langerhans in the same tissue section.
Statistical analysis
The results are presented as mean and standard error of the mean. Firefly miRNA assay was analyzed by using one-way analysis of variance and Bonferroni's correction was used. All other data were analyzed by Student's t-test. p-Value <0.05 was considered as statistically significant.
Study Limitations
This study not only highlighted the role of miR-15a in the pathogenesis of T2D-induced vascular complications but also supports a novel endocrine function for miR-15a, which is produced in pancreatic β-cells and transported into exosomes. However, insulinoma cell lines (such as INS-1 and MIN6) are not truly representative pancreatic β-cells. To detect a true pancreatic β-cell-specific marker(s) on the exosomes, culturing normal pancreatic β-cells is required.
Triglyceride levels may play an important role in exosomal transfer of miRNAs in remote microvascular cells. Further studies are required with higher numbers in the T2D cohort to fully understand the cell–cell miR-15a transfer phenomenon observed in the T2D condition.
Ultracentrifugation is the preferred method to isolate exosome-rich EVs. However, initial attempts to isolate exosomes from the serum samples for this study could not detect any RNA by qPCR. Therefore, we have used the PEG method (Total Exosome Isolation Kit; Thermo Scientific) to increase the quantity of RNA for our study. Furthermore, NanoSight data also suggest that the majority of EVs, which we isolated by the PEG-based method, are within the size range of the exosome category.
The current study provides both in vitro and in vivo datasets, which emphasize the role of miR-15 in retinal cells as being critical in the setting of early stages of DR. However, future in vivo studies would be required to see if pharmacological manipulation of miR-15a levels (e.g., by miR-15a antagomiR treatment) could be therapeutically exploited in the treatment of DR. This is very important as we observed a significant difference in miR-15a expression in the recipient retinal cells when we overexpressed miR-15a in MIO-M1 cells (Fig. 3C) versus high-glucose cultured INS-1 cell-derived exosomal transfer in rMC-1 cells (Fig. 6B). While exosomal transfer represents a more physiologically relevant event than overexpression, it may result in lower levels of miR-15a in the retinal cells and that could affect the results.
Footnotes
Acknowledgments
The authors thank the JHU-UMD Diabetes Research Center and Dr. Mehboob Hussain, Director, Cell Biology Core of Diabetes Research Center of The Johns Hopkins Hospital, for kindly providing the INS-1 cell lines. They thank Drs. Kenneth W. Witwer and Dillion Muth (Molecular and Comparative Pathobiology, Johns Hopkins University School of Medicine, Baltimore, MD) for their generous advice on the Nanoparticle Tracking Analysis using NanoSight. The authors also thank Astrid Limb (Institute of Ophthalmology, UCL, London, UK) for providing the MIO-M1 and Dr. Vijay Sarthy from Northwestern University Feinberg School of Medicine (Chicago, IL) for providing rMC-1 cells. This work was supported by grants from the Ministry of Education, Malaysia (High Impact Research MoE Grant No. H-20001-00-E000056), and University of Malaya (Grant Nos. RP006B-13HTM and RP033-14HTM), the National Institutes of Health HL39752 (C.S.), American Heart Association: 14SDG18890049 (S.D.), and Firefly BioWorks, Inc., Firefly Frontiers Grant (S.D.). B.D. gratefully acknowledges support from the Sister Alma McNicholas Fund from the Notre Dame of Maryland University. The funders had no role in study design, data collection and analysis, decision to publish, or preparation of the article.
Authors’ Contributions
T.A.K. was responsible for patient selection, human blood collection, analysis, and interpretation of the data and drafted the article or revised it critically for important intellectual content. N.K., S.A.Y., and R.C.C. were responsible for patient selection, blood collection, and eye imaging. A.M.D., S.M.K., B.E., Z.X., A.P.F, and S.D. were responsible for the in vitro and animal experiments—sample collection, analysis, and interpretation of the data. E.D., M.K.H., C.S., and S.D. were responsible for collection, analysis, and interpretation of the data; drafted the article or revised it critically for important intellectual content; and were responsible for the conception and design of the experiments. C.S. and S.D. are the guarantors of this work and, as such, had full access to all the data in the study and take responsibility for integrity of the data and accuracy of data analysis.
Author Disclosure Statement
No competing financial interests exist.
Abbreviations Used
References
Supplementary Material
Please find the following supplemental material available below.
For Open Access articles published under a Creative Commons License, all supplemental material carries the same license as the article it is associated with.
For non-Open Access articles published, all supplemental material carries a non-exclusive license, and permission requests for re-use of supplemental material or any part of supplemental material shall be sent directly to the copyright owner as specified in the copyright notice associated with the article.