
Abstract
Aims:
Mitochondrial function is coupled to metabolic and survival pathways through both direct signaling cascades and dynamic changes in mitochondrial morphology. For example, a hyperfused mitochondrial reticulum is activated upon cellular stress and is protective against cell death. As part of a genome-wide small inhibitory ribonucleic acid screen, we identified the central redox regulator, Keap1, as a novel regulator of mitochondrial morphology. Here, we aimed to determine the mechanism through which redox signaling and Keap1 mediate changes in mitochondrial morphology.
Results:
We found that the Nrf2 transcription factor is required for mitochondrial hyperfusion induced by knockdown of Keap1. Nrf2, which is negatively regulated by Keap1, mediates the cell's response to stress by controlling the expression of several hundred genes, including proteasome expression. We next showed that increased proteasome activity, a result of increased Nrf2 activity, is responsible for the degradation of the mitochondrial fission protein Drp1, which occurs in an ubiquitin-independent manner.
Innovation:
Our study described a novel pathway by which Nrf2 activation, known to occur in response to increased oxidative stress, decreases mitochondrial fission and contributes to a hyperfused mitochondrial network.
Conclusion:
This study has identified the Keap1–Nrf2 nexus and modulation of proteasomal activity as novel avenues to inhibit mitochondrial fission. These findings are important, because inhibiting mitochondrial fission is a promising therapeutic approach to restore the balance between fission and fusion, which is attractive for an increasing number of disorders linked to mitochondrial dysfunction. Antioxid. Redox Signal. 27, 1447–1459.
Introduction
M
A variety of cellular stresses can induce a hyperfused mitochondrial network (52), which can produce more energy, less reactive oxygen species, and protect against cell death. We have previously shown that oxidative stress directly stimulates mitochondrial fusion (48). Here we uncover a novel pathway through which oxidative stress reciprocally inhibits fission. Our findings provide a novel approach to inhibit fission, an approach that is gaining traction in a variety of pathologies (46). Adding to this clinical relevance is that fact that modulation of the Nrf2 pathway is currently the basis for a number of clinical trials (39).
The hyperfused response can also be because of post-translational modifications, such as the protein kinase A-dependent phosphorylation of Drp1 (Dnm1l), a dynamin-related guanosine triphosphate hydrolase (GTPase), which blocks its mitochondrial recruitment and activation of fission (18). Importantly, Drp1 is regulated by a number of post-translational modifications (7), including other phosphorylation events (11), ubiquitination (35, 56), SUMOylation (12, 19), S-nitrosylation (36), and O-GlcNacylation (16). These modifications can either positively or negatively influence Drp1 recruitment to mitochondria, oligomeric assembly, GTPase activity, and degradation. Many of these modifications are clustered within the so-called variable domain (or Insert B), which is an unstructured domain (27) previously implicated in Drp1 stability (63). Importantly, Drp1 has also been shown to be ubiquitinated by a number of E3 ligases, including MARCH5 and Parkin (35, 56); however, whether these ligases function in steady state expression of Drp1, or upon specific triggers, remains unclear. Overall, the fact that Drp1 is regulated by such an array of modifications, suggests it acts as a rheostat coordinating mitochondrial morphology and function with cellular conditions.
As part of a previously published genome-wide small inhibitory ribonucleic acid (siRNA) screen (38), we observed a hyperfused mitochondrial network in response to knockdown of Keap1 (Kelch-like ECH-associated protein 1), a redox-regulated adaptor protein that is part of an E3-ubiquitin ligase complex along with Cul3 (Cullin3) and Rbx1 (ring-box 1) (9, 28, 62). The Keap1/Cul3/Rbx1 E3-ligase complex binds and ubiquitinates a number of substrates (20), including the constitutive degradation of the transcription factor Nrf2 (Nfe2l2, nuclear factor, erythroid derived 2, like 2) (24). Upon conditions of stress, Keap1 is inactivated, allowing Nrf2 to accumulate in the nucleus, promoting the transcription of hundreds of genes involved in responding to stress (8, 34, 51), including proteasomal subunits (30). The global stress protection afforded by Nrf2 includes improving mitochondrial metabolism and biogenesis (21, 32, 42); however, mechanistic links to mitochondrial dynamics have not been reported. We present data showing that Nrf2 transcriptional response includes the activation of ubiquitin-independent Drp1 degradation, promoting the hyperfused response.
The proteasome plays an important role in the regulation of protein turnover and cellular homeostasis. The classic ubiquitin-dependent 26S proteasomal degradation pathway mediates the degradation of ubiquitinated proteins and requires ATP. The 26S proteasome comprises the 20S core, which provides the proteolytic activity, and the 19S regulatory particle, which recognizes ubiquitinated proteins and delivers them to the 20S. More recently, it has become apparent that the 20S proteasome on its own can also mediate ubiquitin and ATP-independent degradation of certain proteins (1, 5). This alternative degradation is stimulated by oxidative stress and targets both oxidized proteins and those containing unstructured domains, as we observe for the unstructured, variable domain of Drp1. Therefore, this work identifies Drp1, the central regulator of mitochondrial fission, as a target of the Nrf2 stress response, promoting hyperfusion and survival.
Results
Keap1 siRNA leads to mitochondrial hyperfusion
A genome-wide siRNA screen identified Keap1 as a potential novel regulator of mitochondrial morphology (38). In this screen, knockdown of Keap1 led to a hyperfused mitochondrial network comparable to knockdown of mitochondrial fission factor (MFF), a known regulator of mitochondrial fission (15). We were able to recapitulate the hyperfused mitochondrial network results of the siRNA screen, showing a strong hyperfused mitochondrial phenotype in response to knockdown of Keap1 (Fig. 1A).
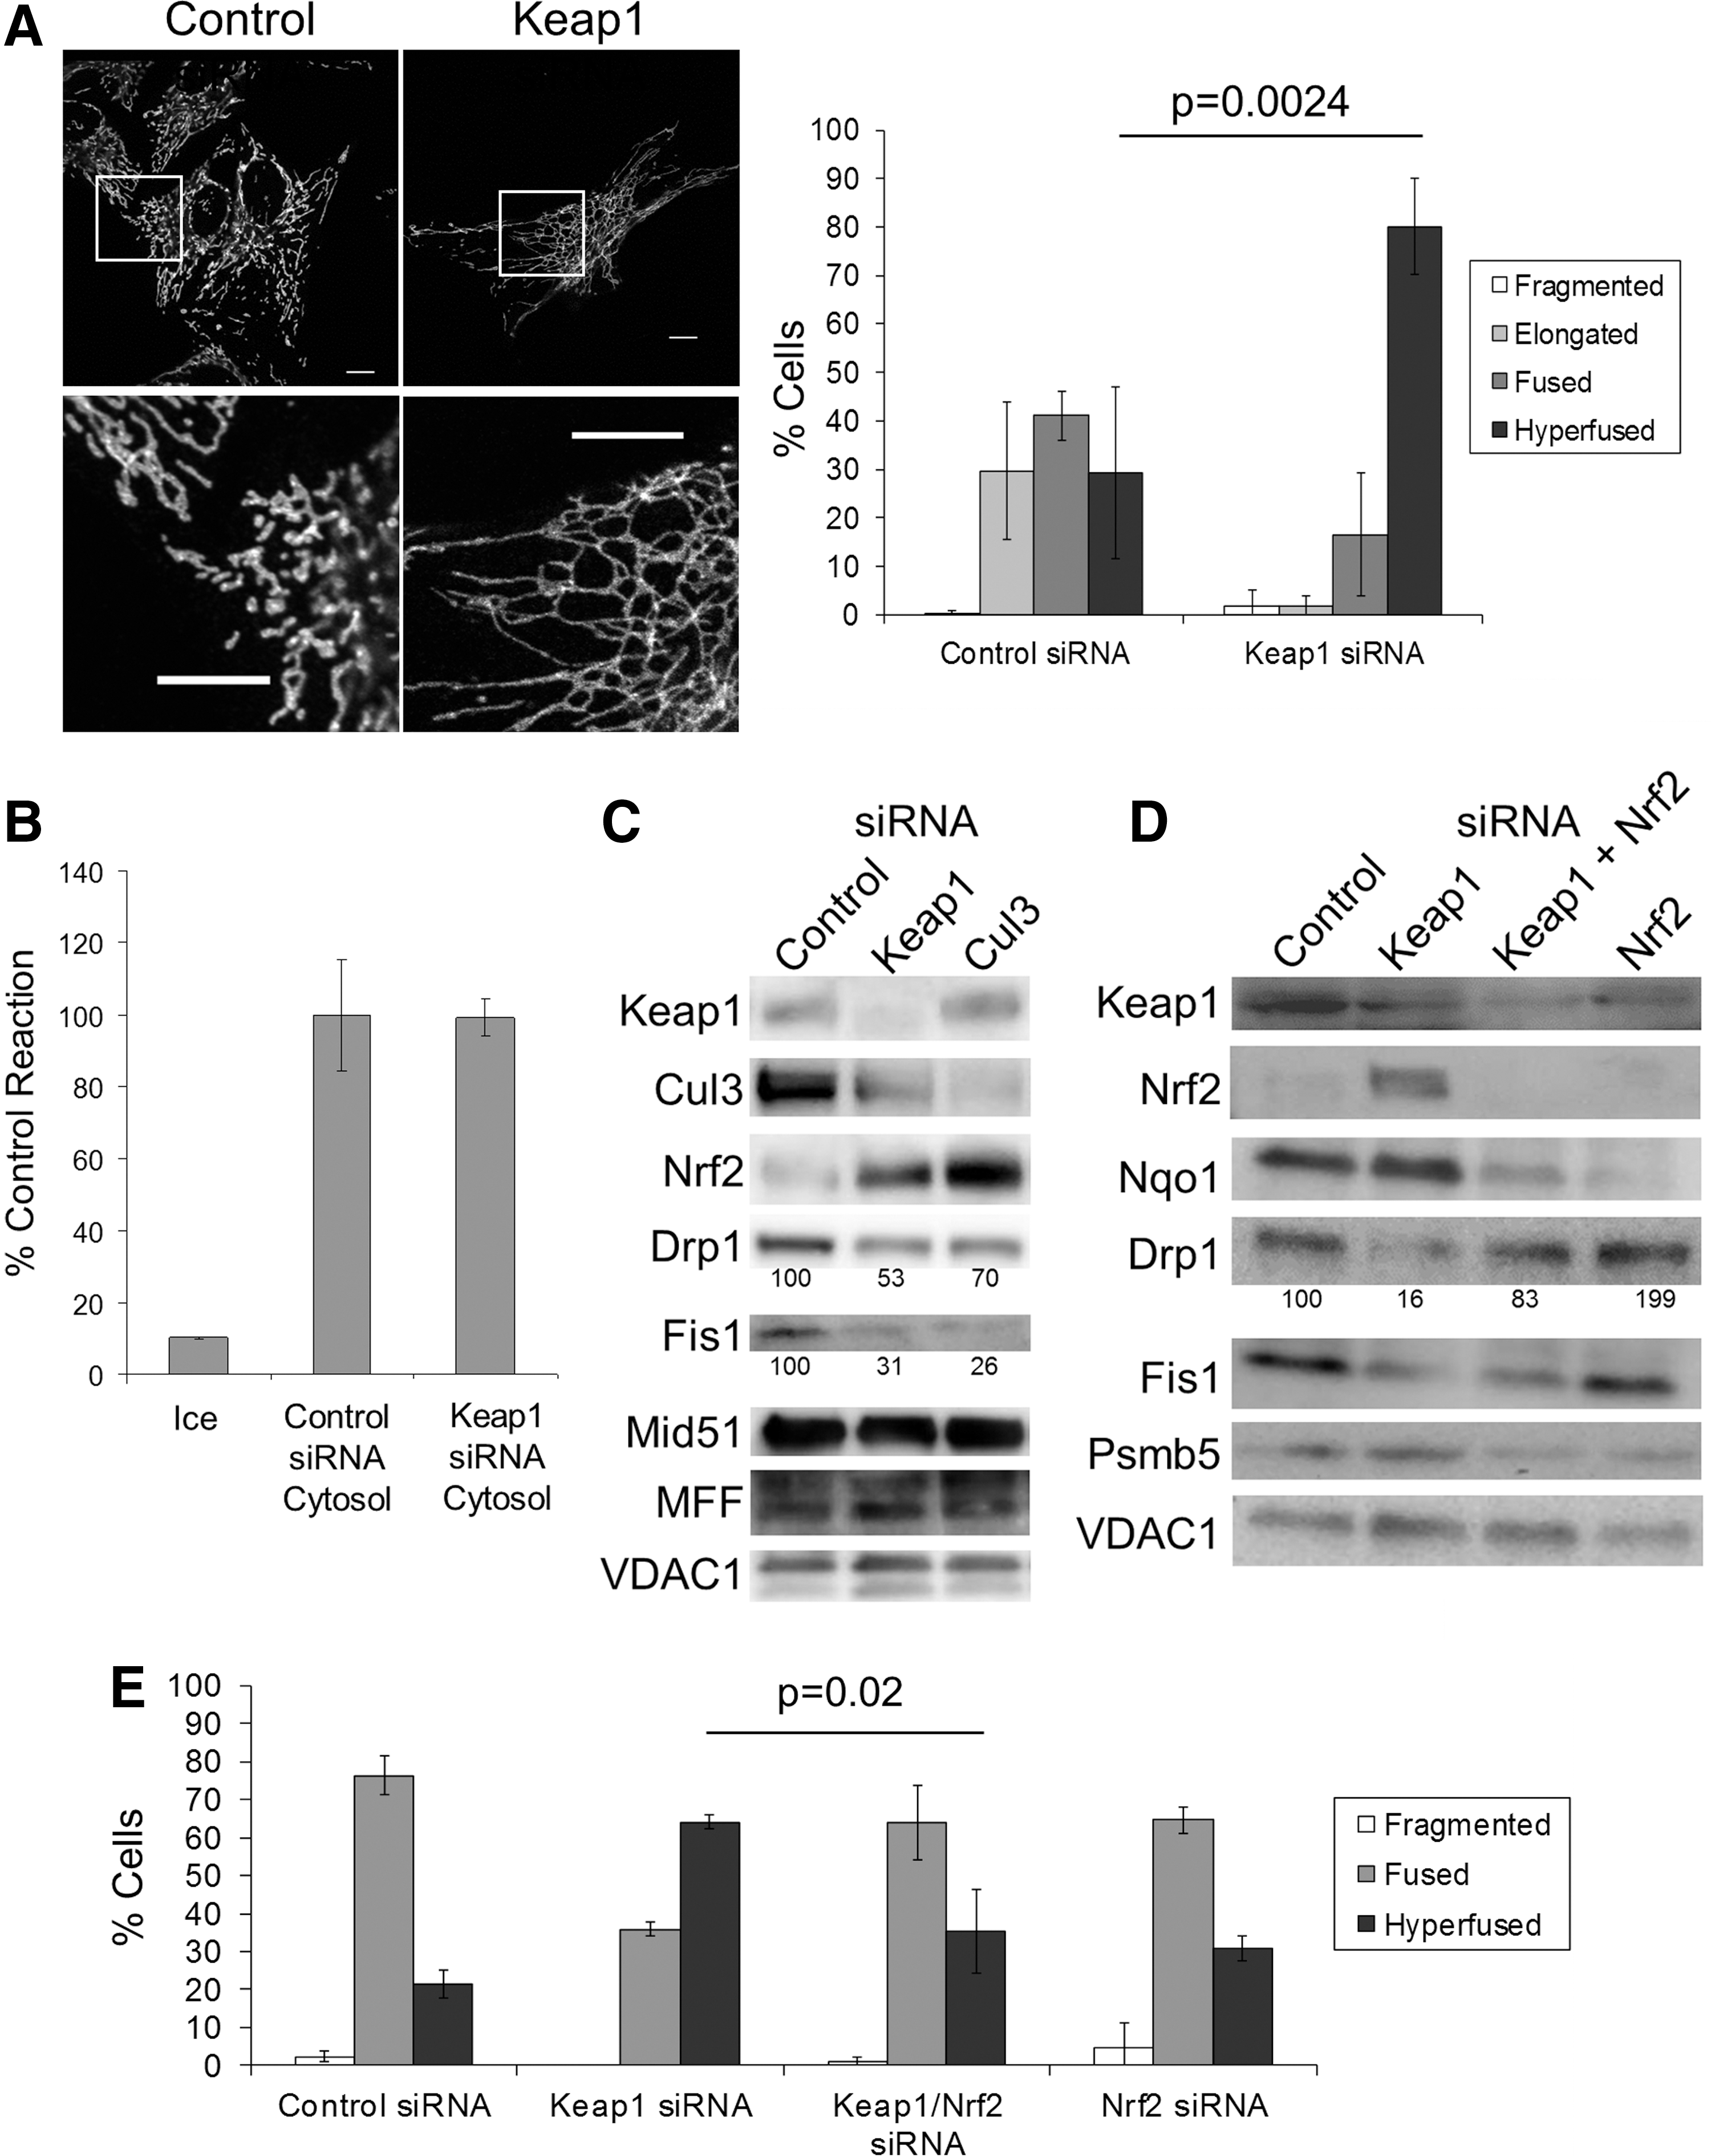
The balance between fusion and fission determines mitochondrial morphology. As such, a hyperfused network can be the result of increased fusion, decreased fission, or both. To test whether loss of Keap1 alters mitochondrial fusion, we used an in vitro mitochondrial fusion assay (47). Addition of cytosols from cells treated with control siRNA or Keap1 siRNA had similar effects on mitochondrial fusion (Fig. 1B), suggesting that cytosolic Keap1 does not directly affect mitochondrial fusion. Furthermore, knockdown of Keap1 did not increase the expression of known mitochondrial fusion proteins (Supplementary Fig. S1; Supplementary Data are available online at
To determine whether mitochondrial fission was influenced, we examined the levels of known mitochondrial fission proteins in response to Keap1 siRNA. Drp1 is the primary protein involved in mitochondrial fission, whereas Fis1, MFF, and Mid51 are thought to be involved in recruiting Drp1 to sites of fission (11). After knockdown of Keap1, we observed an ∼50% decrease in protein levels of the Drp1 and Fis1 (Fig. 1C), although Mid51 and MFF appear unaffected. Together, these results suggest that mitochondrial hyperfusion due to of loss of Keap1 is a result of decreased fission as opposed to increased mitochondrial fusion. Notably, we were able to phenocopy the results of Keap1 siRNA, by knocking down the E3-ligase component Cul3 (Fig. 1C and Supplementary Fig. S2), implicating the E3-ubiquitin ligase activity in the observed mitochondrial hyperfusion. As expected, knockdown of either Keap1 or Cul3 results in increased levels of the stress-activated transcription factor Nrf2, the most well-characterized Keap1 target (Fig. 1C).
Nrf2 is necessary for Keap1 siRNA-mediated mitochondrial hyperfusion
Given the established links between stress and mitochondrial dynamics (48, 52), we wanted to test whether Nrf2 was necessary for hyperfusion after Keap1 siRNA. To this end, we knocked down Nrf2 on top of Keap1 and observed a reversion to the normal Drp1 protein levels and mitochondrial morphology (Fig. 1D, E). Notably, knockdown of Nrf2 on top of Cul3 also returned mitochondrial morphology back to normal (Supplementary Fig. S2). Interestingly, Fis1 protein levels were not restored when Nrf2 was knocked down on top of Keap1 (Fig. 1D), suggesting that Keap1 may be regulating Fis1 levels through an alternative pathway. Nonetheless, since normal mitochondrial morphology was restored, this suggests that Fis1 is not the key regulator of the morphology changes we observe with Keap1 knockdown. Altogether, these results directly implicate Nrf2 in regulating mitochondrial morphology through modulation of Drp1 levels.
Nrf2 induction is sufficient for mitochondrial hyperfusion
Next, we inquired whether Nrf2 activation alone was sufficient for mitochondrial hyperfusion, even in the absence of Keap1 siRNA. We specifically avoided using stress-induced activation of Nrf2, which would complicate any interpretation on mitochondrial morphology as stress also activates fusion (48, 52). As with Keap1 siRNA, when Nrf2 is overexpressed we observed decreased Drp1 protein levels along with hyperfused mitochondria. However, there were no changes in Fis1 levels, in line with the notion that Fis1 is not regulated by Nrf2 (Fig. 2A). We also observed increased oxygen consumption after Nrf2 overexpression (Supplementary Fig. S3), consistent with other reports that Nrf2 activation increases mitochondrial activity (21, 32, 42).

Since increased expression of other Keap1 target proteins can stabilize Nrf2 through competition for a limited number of Keap1 binding sites (6, 20, 29, 33), we wanted to eliminate the possibility that Nrf2 overexpression was preventing Keap1 from binding and degrading another protein that may play a role in mitochondrial morphology. To test this idea, we overexpressed Nrf2 lacking the ETGE domain required for efficient binding by Keap1 (53). Overexpression of the Nrf2–ΔETGE deletion also leads to mitochondrial hyperfusion and decreased Drp1 protein levels (Fig. 2B, C), suggesting that the effect of Nrf2 on mitochondrial morphology occurs independently of its interaction with Keap1. This does not, however, preclude a role for other Keap1 targets in modulating mitochondrial morphology in parallel with Nrf2.
A limitation of overexpressing Nrf2 is the fact that high levels of transfection efficiency are difficult to achieve. Typically, 40–70% transfection efficiency is observed, as measured by Nrf2 immunofluorescence. Although the stark contrast in mitochondrial morphology is emphasized when comparing transfected and untransfected cells, the low efficiency can mask differences in our Western blot analysis, which is performed on the pool of transfected and untransfected cells.
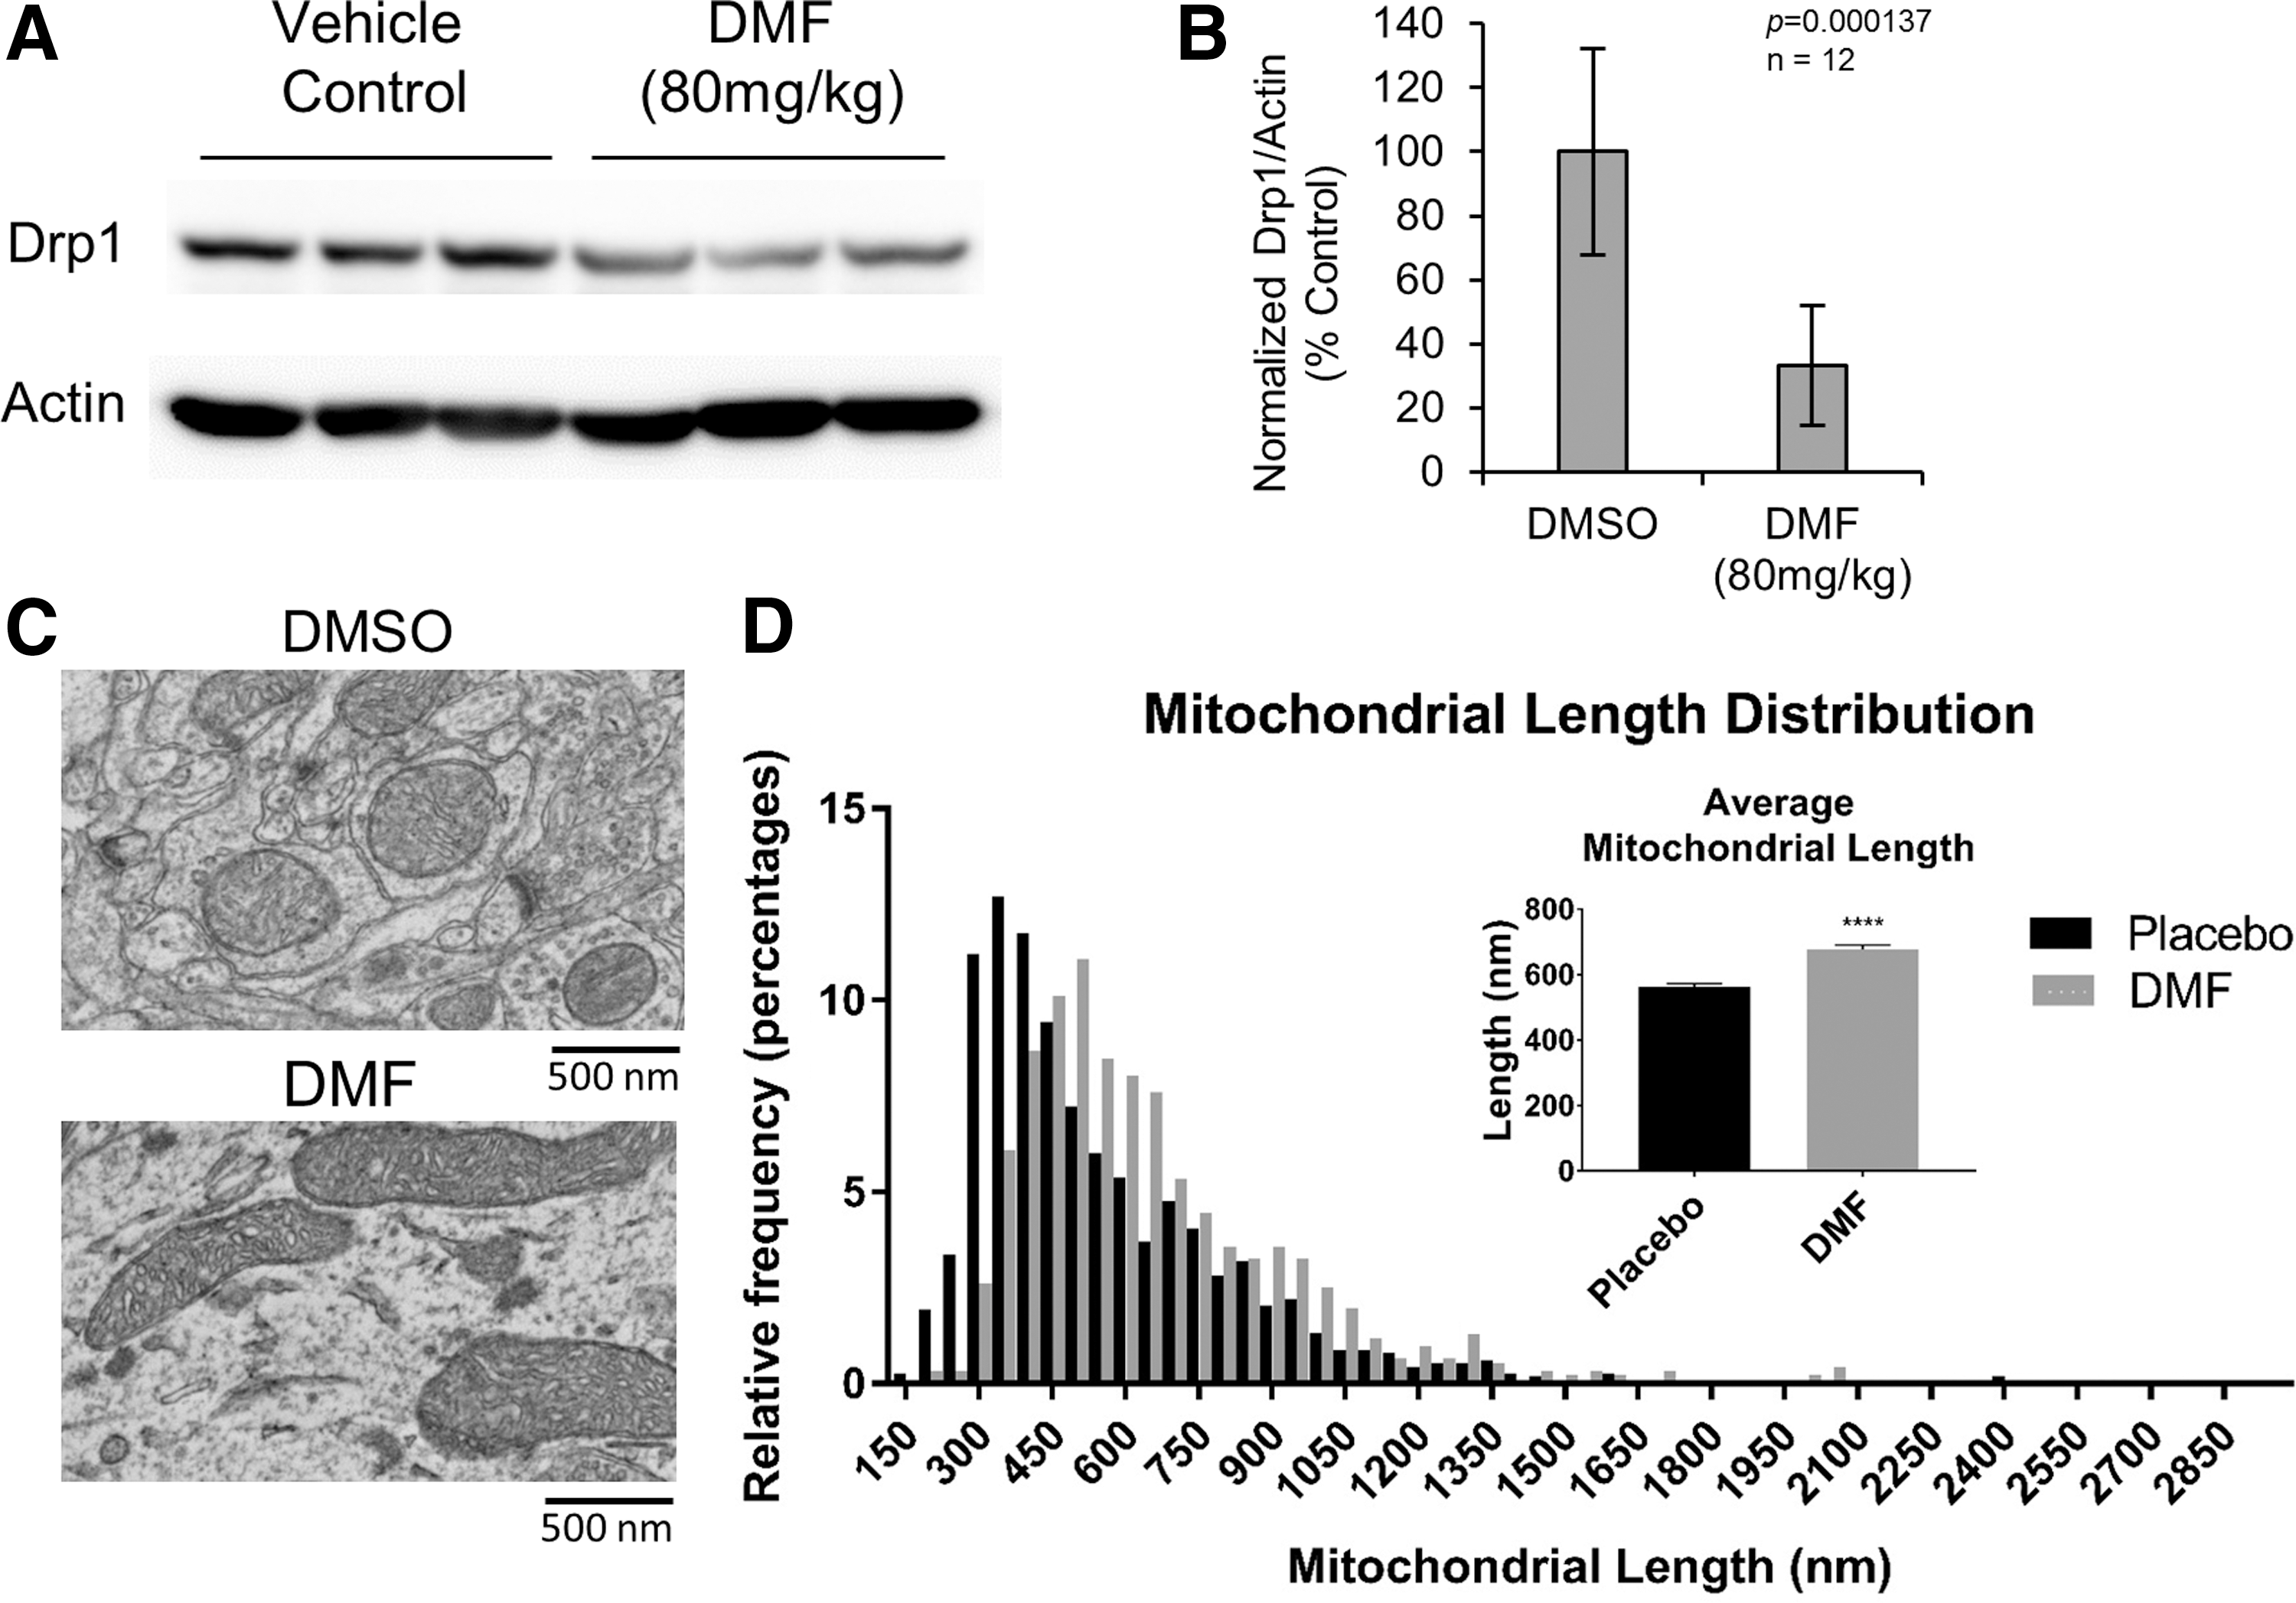
As a way to activate Nrf2 in all cells, we tested the effects of sulforaphane and dimethyl fumarate (DMF), two established Nrf2 activators (Supplementary Figs. S4 and S5). As expected, we observed hyperfused mitochondrial morphology in fibroblasts and primary neuronal cultures after pharmacological activation. Finally, to test whether pharmacological Nrf2 activation is a viable approach to modulate mitochondrial morphology in vivo, we examined the hippocampus of rats treated with DMF, as this compound is clinically approved for multiple sclerosis (44). Consistent with our previous results, we observed increased mitochondrial size and decreased Drp1 protein levels (Fig. 3).
Nrf2 transcription factor activity is required for mitochondrial hyperfusion
To determine the mechanism through which Nrf2 activation leads to decreased Drp1 protein levels, we returned to Hela cells, which are more tractable. The first question we addressed was whether the transcriptional activity of Nrf2 is required for its effects on mitochondrial hyperfusion. Thus, we used an Nrf2 deletion mutant lacking the carboxyl terminal 16 residues required for deoxyribonucleic acid (DNA) binding and known to be essential for transcription factor activity (Nrf2–ΔC16) (37). Overexpression of the Nrf2–ΔC16 mutant does not induce mitochondrial hyperfusion, nor does it affect Drp1 protein levels (Fig. 2B, C), implicating the transcription factor activity of Nrf2 in the observed mitochondrial hyperfusion phenotype. Furthermore, since Nrf2–ΔC16 retains its ability to bind Keap1, this provides additional evidence that competitive binding of Keap1 does not lead to hyperfusion, consistent with deletion of the ETGE motif.
Nrf2 regulates Drp1 degradation via the proteasome
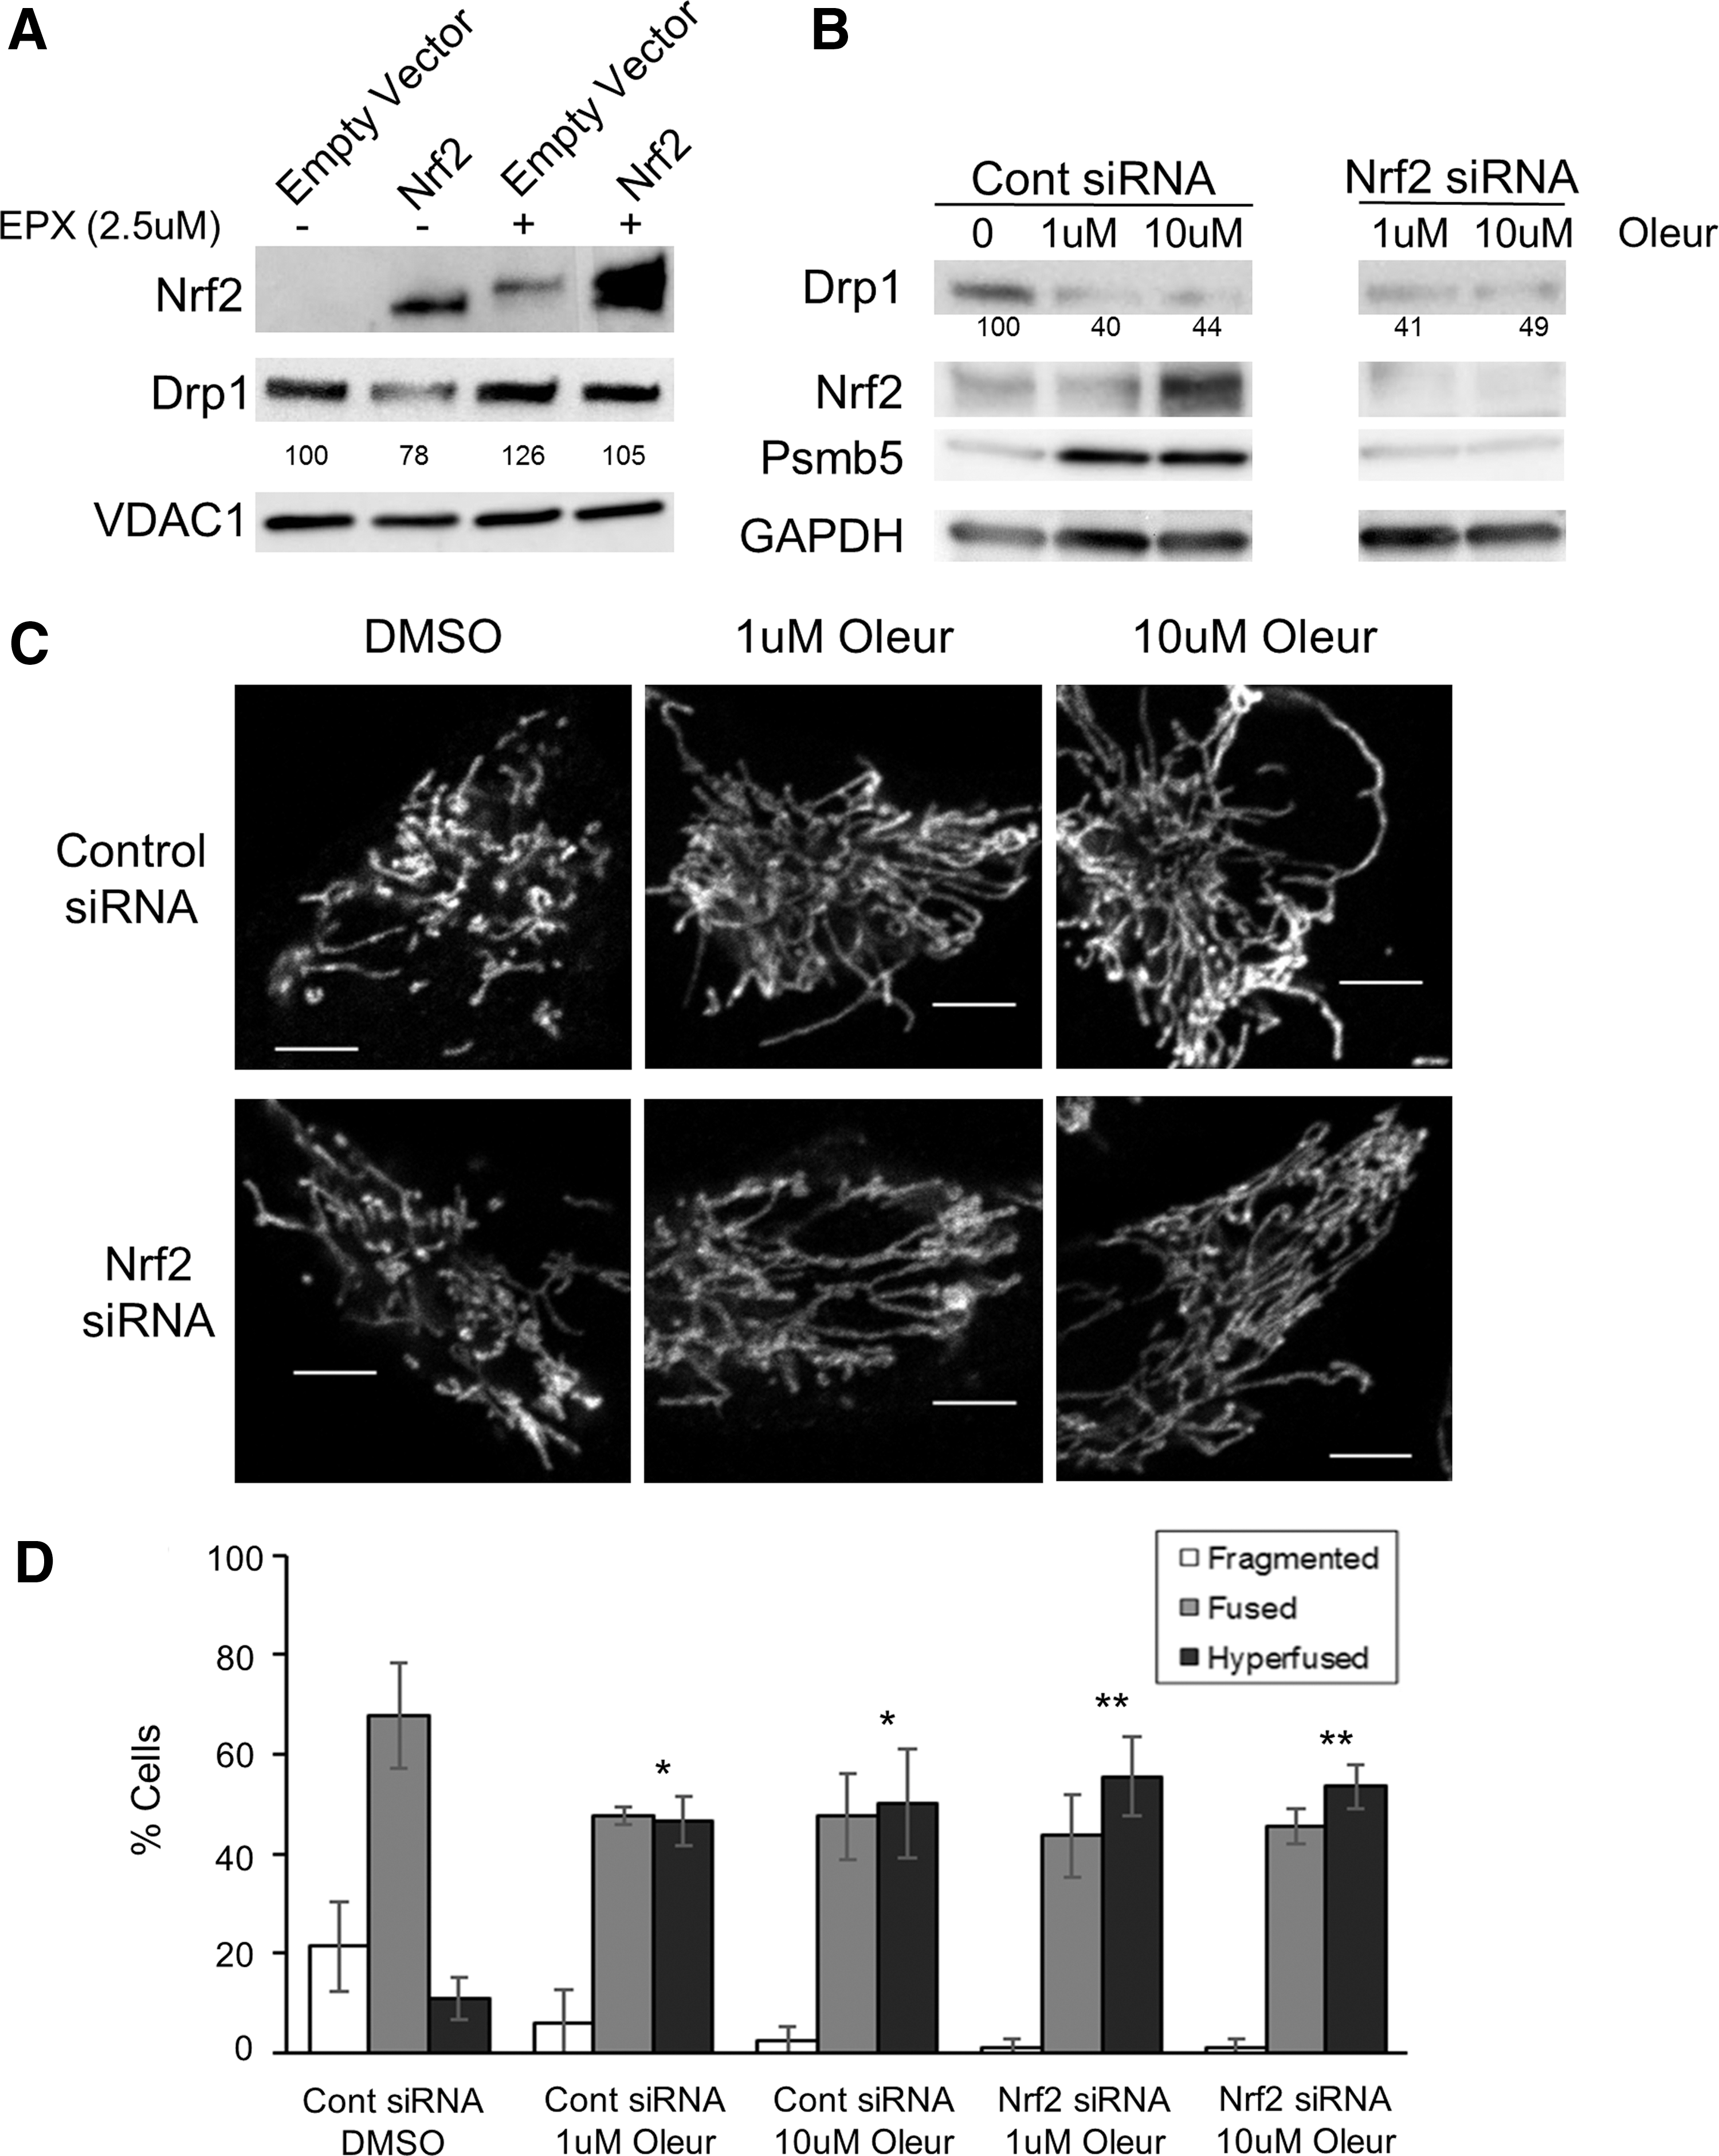
Given that Nrf2 is a transcription factor, we wanted to determine whether it was altering the levels of Drp1 and Fis1 messenger ribonucleic acid (mRNA). As transcript levels after silencing of Keap1 or overexpression of Nrf2 were unchanged (Supplementary Fig. S6), we investigated Drp1 protein stability in cells overexpressing Nrf2 by treating them with the specific proteasomal inhibitor epoxomicin (Epx). We observed a rescue of Drp1 protein levels, even though Nrf2 levels were also increased (Fig. 4A). These results indicate that Nrf2 upregulation decreases the stability of the Drp1 protein through proteasomal degradation. Notably, Nrf2 has been previously shown to upregulate proteasomal activity (30, 43), a phenotype we recapitulated after silencing of Keap1 or overexpression of Nrf2 (Supplementary Fig. S7). Thus, we speculated that increased proteasomal activity in response to Nrf2 activity might explain the observed decrease in Drp1 protein stability ultimately resulting in mitochondrial hyperfusion.
Increased proteasomal activity correlates with decreased Drp1 protein levels and mitochondrial hyperfusion
Next, we wanted to determine whether increased proteasomal activity alone is enough to degrade the Drp1 protein in the absence of Nrf2 signaling. Thus, we treated cells with the natural compound oleuropein (Oleur), which has been demonstrated to increase proteasomal activity both in vitro and in vivo (25). We also observed the same trend for Oleur stimulating proteasomal activity (Supplementary Fig. S7). After Oleur treatment, we observed a decrease in Drp1 protein levels and an increase in hyperfused mitochondria in HeLa cells (Fig. 4B, C). We also observed mitochondrial hyperfusion in fibroblast and neuronal cultures treated with Oleur (Supplementary Figs. S4 and S5). One caveat with Oleur treatment is that we also observed an increase in Nrf2 protein levels, consistent with reports that higher levels of Oleur treatment increase Nrf2 expression (40). This observation is supported by increased expression of the proteasomal subunit Psmb5, an Nrf2 target, and support our previous results that increased Nrf2 leads to decreased Drp1 protein levels. To eliminate the confounding effect that Oleur increases Nrf2 levels, we silenced Nrf2 via siRNA treatment and then treated cells with Oleur (Fig. 4B). Despite the fact that Nrf2 and Psmb5 are not upregulated, we still see decreased Drp1 protein levels, which we ascribed to the direct effect of Oleur in stimulating proteasomal activity.
Drp1 turnover occurs through ubiquitin-independent proteasome degradation and depends on the unstructured variable domain
Interestingly, we did not observe an accumulation of ubiquitinated Drp1 protein, even after the addition of Epx (Fig. 4A), which suggested to us that Drp1 turnover may be occurring in an ubiquitin-independent manner. To test whether ubiquitination is involved in the turnover of Drp1, we used the dominant-negative ubiquitin K48R mutant that prevents the generation of K48-ubiquitin chains required for 26S proteasomal turnover. When we overexpressed the ubiquitin K48R protein in cells overexpressing Nrf2, we still observed a decrease in Drp1 protein levels (Fig. 5A). This observation is consistent with the idea that Drp1 turnover can occur in an ubiquitin-independent manner, although we cannot eliminate the possibility that ubiquitin-dependent degradation also plays a role. Although Nrf2 overexpression alone did not significantly decrease Drp1 levels in this experiment, this is likely because of poor transfection efficiency, as we see a clear decrease in other experiments (Figs. 2A, C and 4A). Furthermore, the fact that Drp1 levels are lower when the K48R ubiquitin mutant is overexpressed suggests that this treatment might actually stimulate ubiquitin-independent 20S proteasome activity.

To further test a role for ubiquitin-independent proteasome turnover of Drp1, we performed an in vitro degradation assay (Fig. 5B). When purified 20S proteasomes were added to cytosolic extracts containing Drp1 protein, we observed a rapid degradation of Drp1 while the levels of other cytosolic proteins, including the Drp1 homolog Dynamin I, remain unchanged. Addition of epoxomycin inhibited this degradation, confirming that the turnover is mediated by the proteasome. Notably, there was no significant degradation of Drp1 without the addition of 20S proteasome (Supplementary Fig. S8)
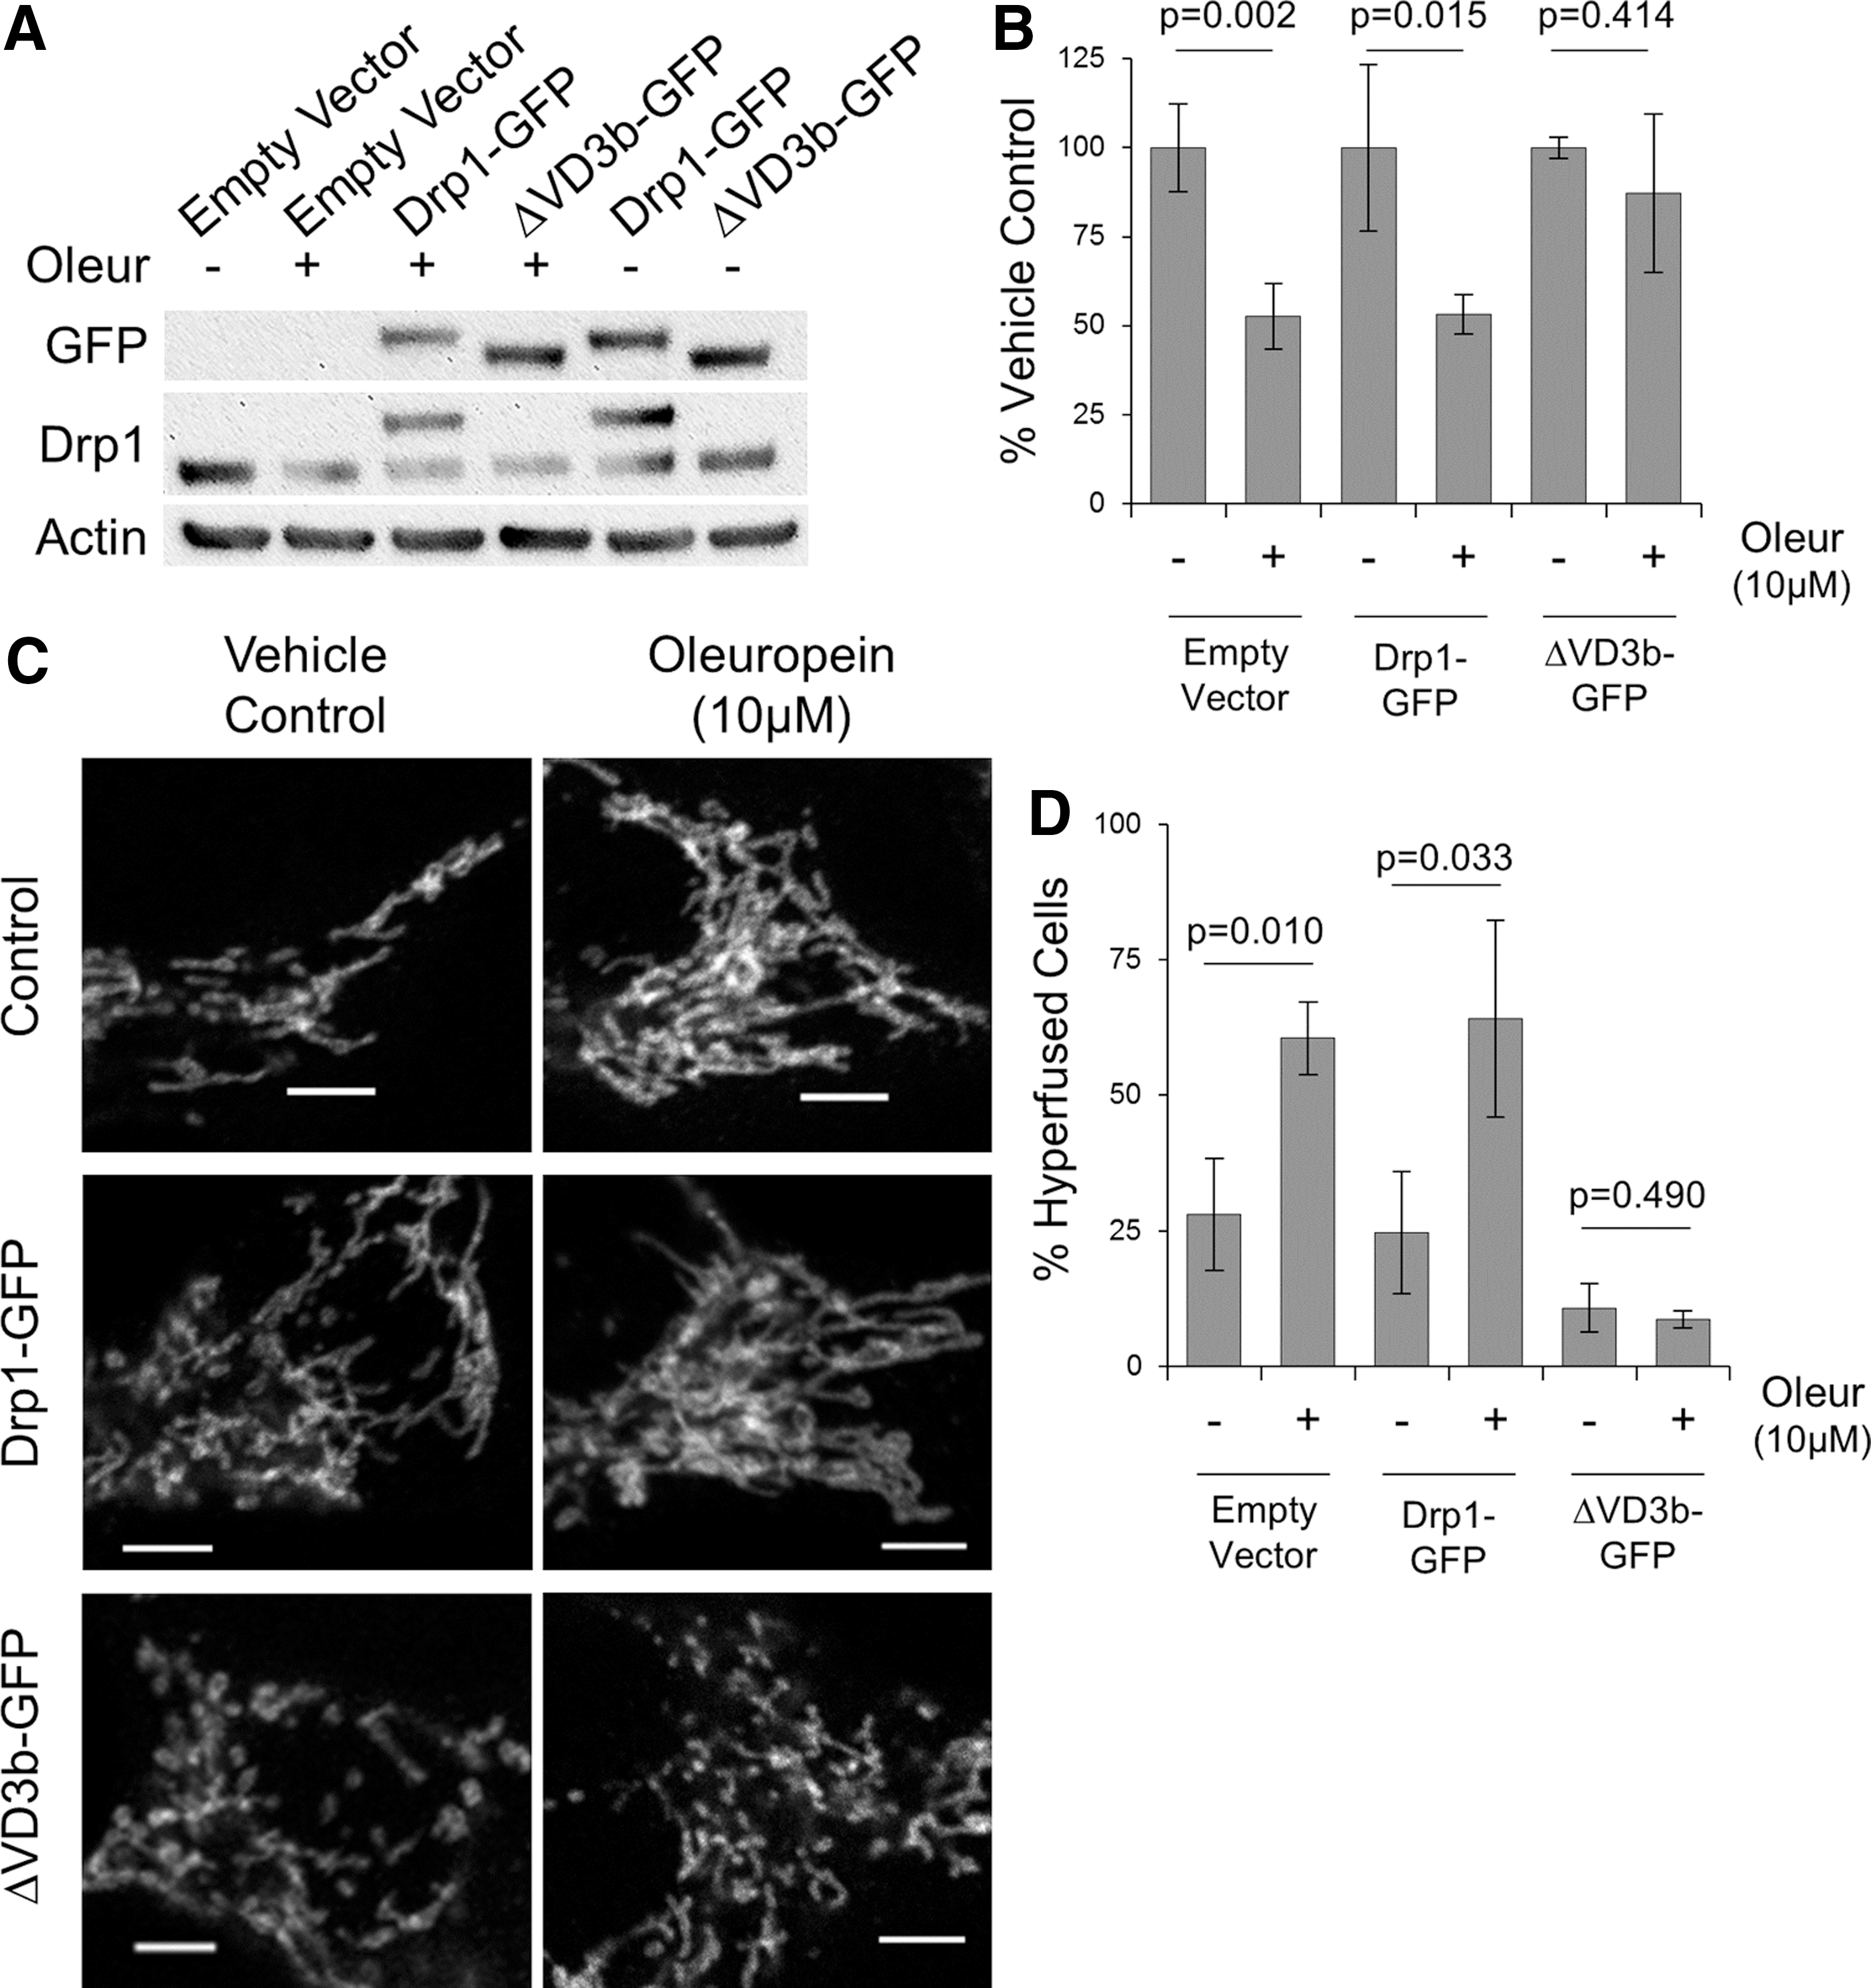
We were also intrigued by the specificity through which Drp1 protein levels were decreased while other proteins remained stable. Given that Drp1 contains an unstructured domain and the preference of the 20S proteasome for substrates with unfolded domains (2, 4), we used a Drp1 construct lacking the variable domain (ΔVD3b) (49) to test the role of this unstructured domain in mediating the degradation of Drp1. We repeated our in vitro degradation assay, adding 20S proteasomes to cytosols from cells overexpressing either wild-type Drp1-green fluorescent protein (GFP) or mutant ΔVD3b-GFP. As predicted, we see that wild-type Drp1 is rapidly degraded, while the ΔVD3b mutant was stable (Fig. 5C).
To confirm these results, we treated cells with Oleur and observed decreased levels of overexpressed wild-type Drp1 protein, but not of ΔVD3b mutant (Fig. 6A, B). Mitochondrial morphology in cells overexpressing Drp1-GFP or ΔVD3b-GFP constructs also behaved differently in response to Oleur: cells expressing wild-type Drp1 exhibited mitochondrial hyperfusion, whereas mutant ΔVD3b expressing cells remained fragmented (Fig. 6C, D).
Discussion
Although we have previously shown that redox stress can directly activate mitochondrial fusion in a matter of minutes (48), it was unknown whether fission was also reciprocally regulated. Here, we uncover a novel pathway through which the stress-activated Nrf2 transcription factor leads to increased proteasomal activity and selective degradation of the mitochondrial fission protein Drp1. This degradation occurs in an ubiquitin-independent manner and depends on the unstructured variable domain of Drp1. This pathway occurs on a timescale of hours to days, presumably to maintain a hyperfused mitochondrial network, whereas the redox switching mechanism activating the mitofusins occurs acutely.
Drp1 protein turnover has previously been linked to autophagy (45) and ubiquitin-mediated proteasomal degradation (35, 56). The E3 ubiquitin ligase Parkin has been shown to regulate ubiquitination and proteasomal degradation of Drp1 (56), which is consistent with the observation that hearts from Parkin knockout mice have elevated levels of Drp1 (22). However, a separate study did not find any evidence for Parkin-mediated ubiquitination of Drp1 (17). Regardless, this work was performed in HeLa cells, which do not express the Parkin protein, thus we do not expect Parkin to be contributing to the proteasomal degradation of Drp1 reported here. Another E3 ubiquitin ligase, MARCH5 (MITOL), has also been reported to bind and ubiquitinate Drp1, but this ubiquitination has not been linked to proteasomal degradation and has only been reported when MARCH5 is overexpressed (35). Moreover, siRNA or knockout of MARCH5 does not affect Drp1 protein levels (23, 61), raising questions about the physiological role of MARCH5 in the regulation of Drp1. It is also possible that the reported discrepancies in Drp1 turnover may be, in part, because of the novel ubiquitin-independent proteasomal degradation reported here.
Consistent with our understanding of how the 20S proteasome regulates the degradation of proteins with unstructured domains (5), our findings indicate a novel role for the variable domain in Drp1 turnover. The fact that proteins with unstructured domains are inherently susceptible to proteasomal degradation (2, 4, 50) helps explain the specific loss of Drp1 in response to increased proteasome activity. Transient post-translational modifications of target proteins often occur within disordered domains and affect their stability (3). Interestingly, the variable domain contains several phosphorylation and SUMOylation sites, with SUMOylation in particular known to stabilize the Drp1 protein (19). Therefore, the highly regulated variable domain not only modulates Drp1 function but also regulates protein stability and turnover, and contributes to Drp1’s ability to act as a rheostat coordinating cellular signals and mitochondrial function.
A key finding of this work is that activation of Nrf2, through variety of means (Keap1 siRNA, Nrf2 overexpression, or pharmacological activators), leads to mitochondrial hyperfusion. Importantly, we see this hyperfusion in a number of cell types as well as in vivo. Modulation of mitochondrial fission and fusion can influence cell death versus survival, ATP production and generation of reactive oxygen species, and as such is an attractive therapeutic approach for many pathologies (31). For example, inhibition of mitochondrial fission is protective in many instances, including myocardial infarction (10), glaucoma (26), traumatic brain injury (13, 59), and anesthesia (60). Understanding the different mechanisms through which mitochondrial fission is regulated provides new opportunities for therapeutic interventions. The novel proteasome-mediated turnover of Drp1 reported here is of particular interest, as the Keap1–Nrf2 nexus is a druggable pathway (57), which also promotes cellular antioxidant, detoxification and anti-inflammatory pathways. Thus, this work adds inhibition of mitochondrial fission as another benefit associated with the Keap1–Nrf2 pathway.
Materials and Methods
siRNA screen
The genome-wide siRNA screen searching for novel factors involved in mitochondrial morphology is described in detail elsewhere (38). In brief, HeLa cells were reverse transfected with 18,255 SMARTpool siRNA duplexes (Dharmacon). After 72 h of knockdown, cells were fixed and stained with an anti-TOMM20 antibody and Hoechst to observe mitochondria and nuclei, respectively. Cells were observed using an automatic Cellomics Vti microscope and a length:width aspect ratio was calculated as a measure of mitochondrial morphology.
Cell culture
HeLa cells were grown in high-glucose Dulbecco's modified Eagle's medium (DMEM) (Gibco®), supplemented with 10% fetal bovine serum (Gibco) and NEAA (Gibco). Dermal fibroblasts from a control subject were grown in MEM (Gibco) supplemented with 10% fetal bovine serum (FBS) (Gibco), 2 mM
Primary hippocampal cultures
Primary hippocampal cultures, containing mixed populations of neuronal cell types (MAP2-positive neurons, GFAP-positive glial cells, and other neuronal cells), were prepared from whole hippocampi of P0 BTBR mice. In brief, hippocampi were dissected and dissociated with papain for 30 min triturated with decreasing pore size pipettes. Cells were plated in growth media (33 mM glucose, 2 mM glutamine, 10 mM HEPES, 1 mM sodium pyruvate, 1 × B27, 50 U/ml penicillin–streptomycin, and 4% FBS) on no. 1.5 glass coverslips precoated with poly-
Plasmids
The expression vector containing myc-tagged Nrf2 was obtained from Addgene (plasmid 21555). The ΔETGE and ΔC16 mutations were introduced into this vector by polymerase chain reaction (PCR) and confirmed by DNA sequencing. All open reading frames were then cloned into the pcDNA3.1 vector. As an empty vector control, pcDNA3.1 was used. Drp1 WT and ΔVD3b constructs, which contain an N-terminal GFP tag and silence endogenous Drp1 via shRNAs (49), were kindly provided by Dr. Stefan Strack (University of Iowa Carver College of Medicine). The Ub-K48R vector was obtained from Addgene (plasmid 17604).
Immunoflourescence microscopy
HeLa cells, grown on glass coverslips under the indicated conditions, were fixed with 4% paraformaldehyde, permeabilized with 0.1–0.2% Triton X-100, and labeled with indicated primary antibodies and appropriate Alexa Fluor®-labeled secondary antibodies (Life Technologies). Mitochondria were labeled as indicated against TOMM20 (FL-145; Santa Cruz Biotechnologies) and Cytochrome C (556432; BD Pharmingen). Nrf2 expression was observed with antibodies against Nrf2 (C-20; Santa Cruz Biotechnology) or myc (9E10). Neurons and glia were observed with antibodies against MAP2 (M9942; Sigma) and GFAP (ab4694; Abcam), respectively. Cells were imaged with the appropriate lasers using a confocal scanning microscope (either an Olympus FV1000 or a Zeiss LSM 700). At least 50 cells from each condition were counted from multiple independent experiments and scored by eye for morphology into the indicated classes. Morphology was evaluated by blinded investigators as fragmented, intermediate or hyperfused, by comparing the mitochondrial morphology to a set of standard images (Supplementary Fig. S9).
Western analysis
Cells for Western analysis were harvested via trypsin digestion and washed in PBS. Proteins for immunoblotting were isolated in RIPA buffer (with protease and phosphatase inhibitors added) and resolved by sodium dodecyl sulfate-polyacrylamide gel, transferred to polyvinylidene difluoride membrane, and probed with indicated antibodies; Keap1 (K3144; Sigma-Aldrich), Cullin3 (A301-109A; Bethyl Laboratories), Nrf2 (C-20; Santa Cruz Biotechnology), and (D1Z9C; Cell Signaling), Drp1 (611112; BD Transduction Laboratories™), Fis1 (ALX-210-1037; ENZO Life Sciences), MFF (17090-1-AP; Proteintech), Mid51 (20164-1-AP; Proteintech), VDAC1 (MSA05; MitoSciences), Psmb5 (PW8895; ENZO LifeSciences), GFP (ab6556; Abcam), Dynamin I (C-16; Santa Cruz Biotechnology), and Actin (A5316; Sigma). Full uncropped blots are appended (Supplementary Figs. S10–S12).
Densitometry analysis
Densitometric analysis of protein band intensities was performed using ImageJ (U.S. NIH, Bethesda, MD;
In vitro mitochondrial fusion assay
The in vitro mitochondrial fusion assay was performed as previously described (47, 48). In brief, desalted cytosol extracts obtained from control siRNA or Keap1 siRNA-treated cells were added to the fusion assay to a final concentration of 1 μg/μL, mitochondria were incubated for 20 min at 37°C, and luciferase activity measuring mitochondrial fusion was determined using the Renilla Luciferase Assay System (Promega, WI) and Glomax Luminometer (Promega, WI), according to the manufacturer's protocol.
Animals protocol and DMF treatment
Experiments involving animals were approved in accordance with the Canadian Council of Animal Care and approved by the University of Calgary Conjoint Faculties Research Ethics Approval Board. Twelve male Sprague–Dawley rats (Charles-River, MA) were received at P53 ± 1 day to allow for 7 days of acclimatization to the environment, reduce stress, and prepare for P60 injections. Upon arrival, rats were housed in groups of two in a room set to a 12:12 h light:dark cycle with temperature control (21°C). Animals had access to food and water ad libitum and were handled daily to acclimatize them to the experimenter and reduce stress. At P60, animals were randomly split into two experimental groups to receive either 80 mg/kg intraperitoneal injection of DMF (242926; Sigma) dissolved in DMSO (n = 6) or DMSO alone (n = 6). Injections took place once daily at the same time each day for 3 days (P60–P62). On P62, animals were sacrificed 5 h after the final DMF injection. Brains were extracted and the hippocampus prepared for either Western blot or transmission electron microscopy (EM).
Preparation of hippocampal protein samples
Approximately 5 mg of hippocampal tissue was homogenized in 500 μl of RIPA buffer (Product #89901; Thermo Fisher Scientific) containing a protease inhibitor cocktail (Product #CA97063-010; VWR) and phosphatase inhibitors including 250 mM sodium fluoride (Product #11003-06; Alfa Aesar), 50 mM sodium orthovanadate (Product #J60191-AD; Alfa Aesar), 50 mM sodium pyrophosphate (Product #J62052-AE; Alfa Aesar), and 50 mM beta-glycerophosphate (Product #CAAAJ62121-AE; VWR). Samples were agitated for 2 h at 4°C followed by centrifugation at 12,000 rpm for 20 min at 4°C. The supernatant was removed and used for Western blotting.
Preparation for transmission EM
For transmission EM, hippocampal tissue sections were immersed in 2% paraformaldehyde and 2.5% glutaraldehyde in 0.1 M cacodylate buffer at pH 7.4 for 2 h at 4°C. After washing three times with the same buffer, the samples were postfixed in 1% osmium tetroxide buffered with 0.1 M cacodylate for 1 h at room temperature, dehydrated through a graded series of acetone, and embedded in Epon resin. Ultrathin sections were cut in a Leica EM UC7 ultramicrotome using a diamond knife and stained with 2% aqueous uranyl acetate and Reynolds's lead citrate. The sections were observed in a Hitachi H7650 transmission electron microscope at 80 kV with images taken through an AMT600 digital camera mounted on the microscope.
Transmission EM image and statistical analysis
Transmission EM images were analyzed for length using ImageJ. Statistics were performed using GraphPad Prism 7. Using the D'Agostino and Pearson (Omnibus-K2) normality test, the data were found to have a nonparametric distribution. Thus, the Mann–Whitney test was used to evaluate significant differences existing between the two groups.
Drp1 degradation assay
Cytosolic preparations from HeLa cells were prepared as described previously (48). Then 10 nM 20S Human Proteasome (E-360; R&D Systems) was added and reactions were incubated at 37°C for the indicated periods. The proteasomal inhibitor Epx was added at 2.5 μM where indicated.
Proteasomal activity assay
Crude proteasome extracts were purified from control and treated cells. Cells were diluted to 2 × 10⁷ cells/ml in lysis buffer (50 mM HEPES (pH 7.5); 5 mM EDTA; 150 mM NaCl; 1% Triton X-100; 2 mM ATP) and incubated for 30 min on ice. After centrifugation in a microcentrifuge (15,000 rpm for 15 min at 4°C), the supernatant containing proteasomes was aliquoted and stored at −80°C. Proteasomal activity was monitored by measuring UV-induced fluorescence after the cleavage of artificial proteasome substrate Suc-LLVY-AMC (UBP-Bio), added to 100 μM.
Mitochondrial bioenergetic analysis
To examine the effect of Nrf2 overexpression on mitochondrial function, the Seahorse XF-24 extracellular flux analyzer (Seahorse Biosciences) was used as described previously (58). In brief, HeLa cells were seeded on XF 24-well cell culture microplates (Seahorse Bioscience) at 1.0 × 10⁴ cells/well in 200–500 μl growth medium (DMEM supplemented with 10% FBS) and incubated at 37°C/5% CO2 for 24 h. Cells were subsequently transfected (Lipofectamine 3000) with an empty vector control or myc-Nrf2 constructs for 48 h. Changes in oxygen consumption rates and relative ATP production were assays on intact cells upon exposure to oligomycin (1 μg/ml), carbonyl cyanide 4-(trifluoromethoxy) phenylhydrazone (FCCP, 1 μM), and antimycin-A (1 μM) diluted in assay medium supplemented with
Quantitative reverse transcription PCR
RNA was extracted from 1 × 10⁶ cells using Trizol, then reversed transcribed using the QuantiTect RT-Kit (Qiagen) according to the manufacturers protocol. cDNA samples were then diluted one in five, and 2 μl was used for qPCR using quantitative reverse transcription PCR (qRT-PCR) with SYBRgreen (Roche) and appropriate primers. Relative expression was determined using ΔΔCT versus GAPDH. The following primers were used for qRT-PCR analysis:
TS-qrt-1; Fis1—forward: 5′-TGACATCCGTAAAGGCATCG-3′
TS-qrt-2; Fis1—reverse: 5′-CTTCTCGTATTCCTTGAGCCG-3′
TS-qrt-3; Drp1—forward: 5′-TTCCATTATCCTCGCTGTCAC-3′
TS-qrt-4; Drp1—reverse: 5′-CATCAGTACCCGCATCCATG-3′
TS-qrt-5; GAPDH—forward: 5′-ACATCGTCAGACACCATG-3′
TS-qrt-6; GAPDH—reverse: 5′-TGTAGTTGAGGTCAATGAAGGG-3′
Statistical analysis
Results are expressed as mean ± standard deviation from at least three independent replicates. Unless otherwise indicated, statistical significance of differences between indicated conditions was assessed by Student's t-test. p values <0.05 were considered significant.
Footnotes
Acknowledgments
We would like to thank Dr. Stefan Strack (University of Iowa Carver College of Medicine) for generously sharing the wild-type Drp1-GFP and mutant ΔVD3b-GFP constructs. We would also like to thank Younghee Ahn and Lucas Scott for their technical assistance with Seahorse analysis and growing neuronal cultures, respectively.
Author Disclosure Statement
No competing financial interests exist
Abbreviations Used
References
Supplementary Material
Please find the following supplemental material available below.
For Open Access articles published under a Creative Commons License, all supplemental material carries the same license as the article it is associated with.
For non-Open Access articles published, all supplemental material carries a non-exclusive license, and permission requests for re-use of supplemental material or any part of supplemental material shall be sent directly to the copyright owner as specified in the copyright notice associated with the article.