
Abstract
Aims:
Nitric oxide (NO) is involved in the upregulation of endogenous neurogenesis in the subventricular zone and in the hippocampus after injury. One of the main neurogenic pathways activated by NO is the extracellular signal-regulated kinase (ERK)/mitogen-activated protein kinase (MAPK) pathway, downstream of the epidermal growth factor receptor. However, the mechanism by which NO stimulates cell proliferation through activation of the ERK/MAPK pathway remains unknown, although p21Ras seems to be one of the earliest targets of NO. Here, we aimed at studying the possible neurogenic action of NO by post-translational modification of p21Ras as a relevant target for early neurogenic events promoted by NO in neural stem cells (NSCs).
Results:
We show that NO caused S-nitrosylation (SNO) of p21Ras in Cys118, which triggered downstream activation of the ERK/MAPK pathway and proliferation of NSC. Moreover, in cells overexpressing a mutant Ras in which Cys118 was replaced by a serine–C118S–, cells were insensitive to NO, and no increase in SNO, in ERK phosphorylation, or in cell proliferation was observed. We also show that, after seizures, in the presence of NO derived from inducible nitric oxide synthase, there was an increase in p21Ras cysteine modification that was concomitant with the previously described stimulation of proliferation in the dentate gyrus.
Innovation:
Our work identifies p21Ras and its SNO as an early target of NO during signaling events that lead to NSC proliferation and neurogenesis.
Conclusion:
Our data highlight Ras SNO as an early event leading to NSC proliferation, and they may provide a target for NO-induced stimulation of neurogenesis with implications for brain repair. Antioxid. Redox Signal. 28, 15–30.
Introduction
N
Nitric oxide (NO) has the ability to modify cysteine residues by S-nitrosylation (SNO), changing protein activity. Neural stem cells (NSC) proliferate in response to injury, stimulating endogenous neurogenesis. NO has been shown to upregulate neurogenesis after injury, which may enhance neuronal repair. We show that SNO of Cys118 of Ras, a GTPase involved in proliferation signaling, is essential for the proliferation of isolated NSC, and occurs in the hippocampus after brain injury, so it can be an early mediator of the NO effect on NSC proliferation and neurogenesis after a lesion to promote brain repair.
Moreover, our group showed that NO stimulates the proliferation of NSCs from the SVZ, by activating the extracellular signal-regulated kinase (ERK)/mitogen-activated protein kinase (MAPK) pathway (6, 7). The ERK/MAPK pathway, critical for cell proliferation and survival, involves a signaling cascade, beginning at the epidermal growth factor receptor (EGFR) that has p21Ras, c-Raf1, mitogen-activated protein kinase kinase (MEK) 1/2, and ERK1/2 as major effectors upstream of transcription factors, thus activating gene expression. In this pathway, NO seems to act downstream of the EGFR and upstream of c-Raf1, suggesting that it could be the first target of NO in this pathway (6, 12, 15, 30, 38).
NO signaling occurs through several molecular mechanisms, which include non-classical signaling mediated by covalent NO-induced post-translational modification of proteins that may result in a change of their function (25, 26, 44, 47). S-nitrosylation (also called S-nitrosation; SNO), the covalent incorporation of an NO group to protein cysteine thiols to form a nitrosothiol, stands out among those NO-induced modifications as it represents a paradigmatic localized reversible modification of redox-sensitive cysteine residues (25, 27, 29, 35). Several mechanisms have been proposed for nitrosothiol formation in the cell environment [reviewed in refs. (5, 25)]. A direct reaction of NO with the cysteine residue is only plausible when the thiyl radical (P–S•) has been formed
whereas the oxygen-dependent formation of N2O3 is a very effective nitrosating mechanism
Additional mechanisms include metal-catalyzed nitrosation, enzymatic assistance (2), and transnitrosation, the transfer of the modification from one thiol to another, which is an easy and fast reaction in cells
It is accepted that denitrosylation is a very fast process for most nitrosothiols, as SNO is a labile modification and there are systems in the cell that actively catalyze the breakdown of the modification; among these, the most important are the thioredoxin system and the combination of glutathione and S-nitrosoglutathione reductase [reviewed in refs. (2, 4, 25)].
The functional role of SNO of several proteins in critical cysteine residues has been recently addressed, including its implication in physiological and pathological events in the brain, such as neurogenesis (37, 44) and synaptic plasticity (25, 44), as well as in neuronal degeneration (35). In fact, several proteins lead to neuronal cell death when S-nitrosylated, and they may be involved in the pathogenesis of neurodegenerative diseases that are associated with an increase in the levels of NO or radical nitrogen species (35). Although the involvement of SNO in both neurogenesis and neuronal cell death remains unclear, several mechanisms have been proposed (35). For instance, SNO of the myocyte enhancer factor 2 (MEF2) transcription factors results in cell death and disrupts neurogenesis, whereas non-S-nitrosylated MEF2 stimulates neurogenesis, thus suggesting the existence of a molecular switch that, depending on the levels of NO, may stimulate neurogenesis or induce cell death (36). Therefore, the identification and targeted mutation of key cysteine residue(s) involved in cell death may become a therapeutic strategy against the SNO-induced cell death present in several neurodegenerative conditions.
Ras proteins, or p21Ras, participate in several transduction pathways that are mainly related to cell proliferation, including the ERK/MAPK pathway. These proteins belong to the superfamily of small GTPases, the molecular switches that are active when GTP is bound and inactive after GTP is hydrolyzed and GDP remains bound. Almost 20 years ago, p21Ras was shown to be activated in the presence of NO, which correlated with the formation of a nitrosothiol (21). Further work showed that, in the presence of NO, Ras can be S-nitrosylated in Cys118, thus increasing the exchange of GDP for GTP and activating Ras transiently (20). Cys118 is conserved in the three main isoforms of Ras, but specificity of the modification can be achieved by precise subcellular colocalization of Ras isoforms and endogenous NO sources (3, 16), reviewed in Hernansanz-Agustin et al. and Martínez-Ruiz et al. (14, 25). In fact, the mutation or Cys118 in the K-Ras isoform was shown to prevent development of tumors in mice, suggesting a role for Cys118 in the activation of this protooncogene (15).
Here, we show that Ras is S-nitrosylated in NSC from the SVZ, as well as in the dentate gyrus after seizures. SNO of Ras activates downstream elements of the MAPK pathway and enhances NSC proliferation. Further, we show that Ras SNO is temporally linked with the stimulation of injury-induced neurogenesis in the hippocampus after seizures, highlighting the role of Ras modification by NO in injury-induced neurogenesis.
Results
Ras is S-nitrosylated on Cys118 after exposure of NSC to NO
We have previously shown that activity of Ras GTPase is rapidly increased after treatment with 10 μM NOC-18 (an NO donor) for 1 h (6). Here, to study whether Ras is oxidized in those conditions, we overexpressed WT H-Ras in NSCs obtained from C57BL/6J mice. Two-dimensional electrophoresis (2-DE) analysis showed a differential spot compatible with Ras pI and molecular mass (Fig. 1A, red circle). This spot was digested and analyzed by liquid chromatography-tandem mass spectrometry assay (LC-MS/MS), identifying H-Ras (Uniprot number Q61411; Sequest Score 63.41; 39% coverage; seven peptides with high confidence, see Table 1). Then, NSCs overexpressing H-Ras were treated with 100 μM S-nitroso-
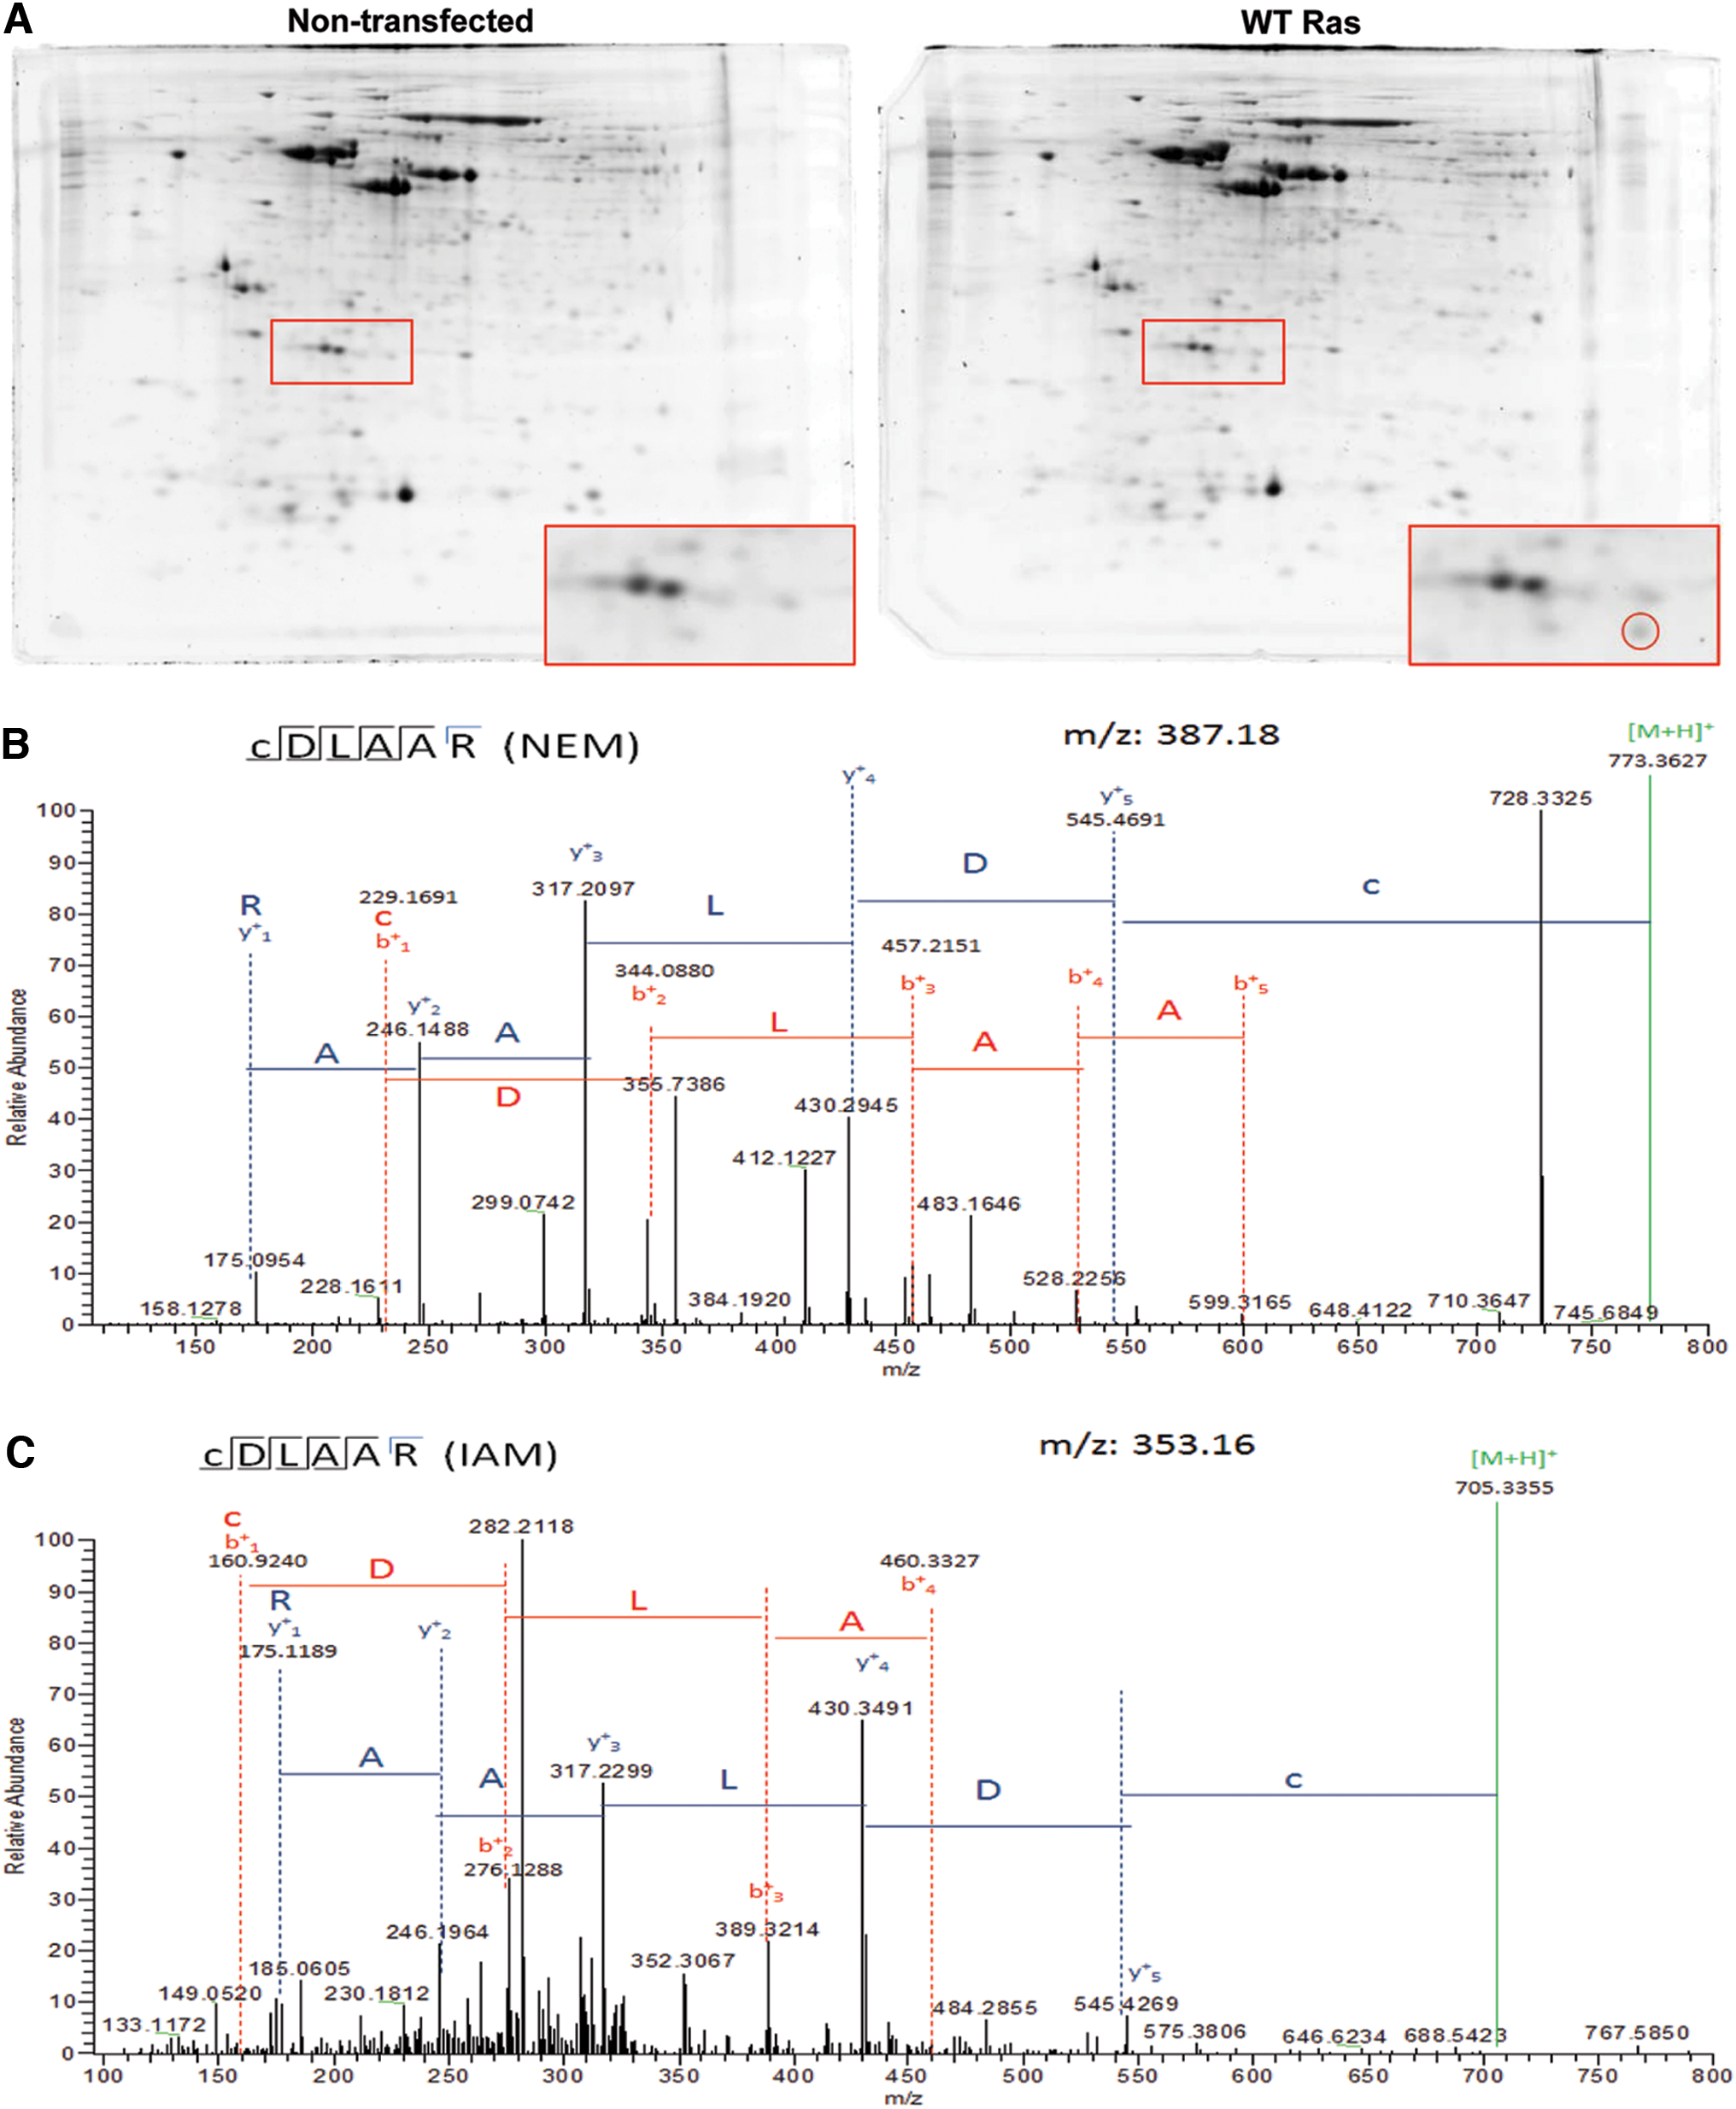
MH+, protonated monoisotopic mass; m/z, mass-to-charge ratio; # PSMs, number of peptide to spectrum matches; RT, retention time; XCorr, raw cross-correlation score of the top PSM.
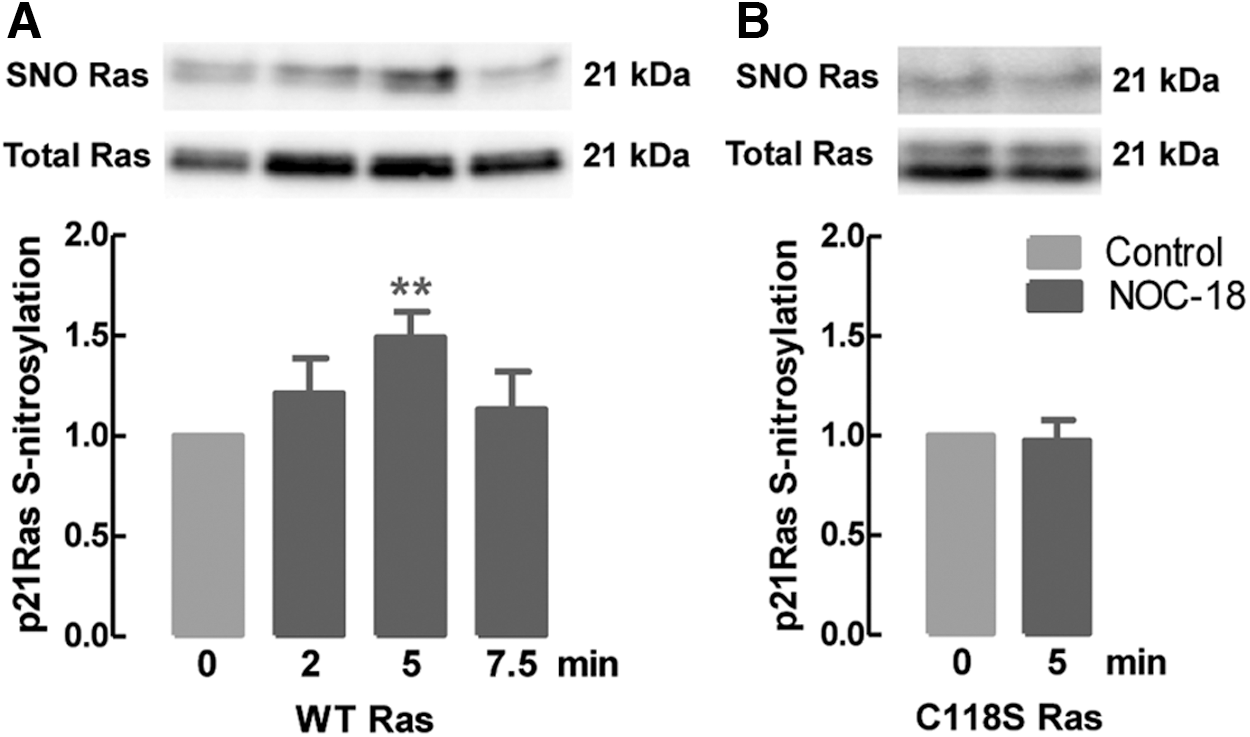
To evaluate whether Ras is S-nitrosylated in those conditions, NSCs overexpressing WT Ras were exposed to 10 μM NOC-18 for different times and SNO was assessed by the ascorbate-reducing biotin switch assay. Protein extracts were subjected to the biotin switch technique, and the biotinylated proteins were purified with an avidin resin, followed by elution with 2-mercaptoethanol and detection by Western blot. SNO of Ras increased shortly after exposure to NOC-18, with a peak at 5 min of treatment (Fig. 2A, 2 min: 1.21 ± 0.2, p > 0.05; 5 min: 1.49 ± 0.1, p < 0.01; 7.5 min: 1.13 ± 0.2, p > 0.05), as compared with untreated WT Ras-overexpressing cells (1.00). However, when cells overexpressed C118S Ras, there was no increase in Ras SNO after 5 min of exposure to 10 μM NOC-18 (Fig. 2B, 0.98 ± 0.1, p > 0.05 compared with control). In this assay, the mutation of the Cys118 to an Ser abolished SNO of Ras, thus supporting that Cys118 is the primary site of SNO in Ras at short times of exposure to low concentrations of an NO donor. The levels of WT Ras and C118S Ras were similar in transfected cells and approximately four-fold higher than in non-transfected cells, demonstrating that transfection with these constructs is effective in increasing Ras expression (Supplementary Fig. S1; Supplementary Data are available online at
NO induces activation of the ERK/MAPK pathway through Ras SNO
To study the ability of NO to modify Cys118 of Ras and activate the ERK/MAPK pathway, we assessed the phosphorylation of ERK1/2 after exposure to NO. NSCs were transfected with WT Ras or C118S Ras and treated with 10 μM NOC-18, for 20 min. To inhibit ERK phosphorylation, we used the MEK1/2 inhibitor, U0126 (1 μM).
As shown in Figure 3, in cells overexpressing WT Ras, treatment with NOC-18 increased phosphorylation of ERK (1.96 ± 0.2% of p-ERK positive area; p < 0.01; Fig. 3B), in comparison with untreated cells (1.24 ± 0.1%; Fig. 3B). Moreover, treatment with U0126 prevented the NO-induced phosphorylation of ERK (0.74 ± 0.1% of p-ERK positive area; p < 0.001; Fig. 3B), in comparison with NOC-18 treated cells, exhibiting values of p-ERK positive area similar to U0126 alone (0.49 ± 0.1%; Fig. 3B). Further, NOC-18 also increased phosphorylation of ERK in non-transfected NSCs (2.73 ± 0.3% of p-ERK positive area; p < 0.05; Fig. 3D), to the same extent as in cells overexpressing WT Ras (2.07 ± 0.2%; Fig. 3D). Treatment with U0126 also prevented the NO-induced phosphorylation of ERK in these cells (1.26 ± 0.2% of p-ERK positive area; p < 0.05; Fig. 3D), in comparison with NOC-18 treated cells, exhibiting values of p-ERK positive area similar to U0126 alone (0.82 ± 0.1%; Fig. 3D).
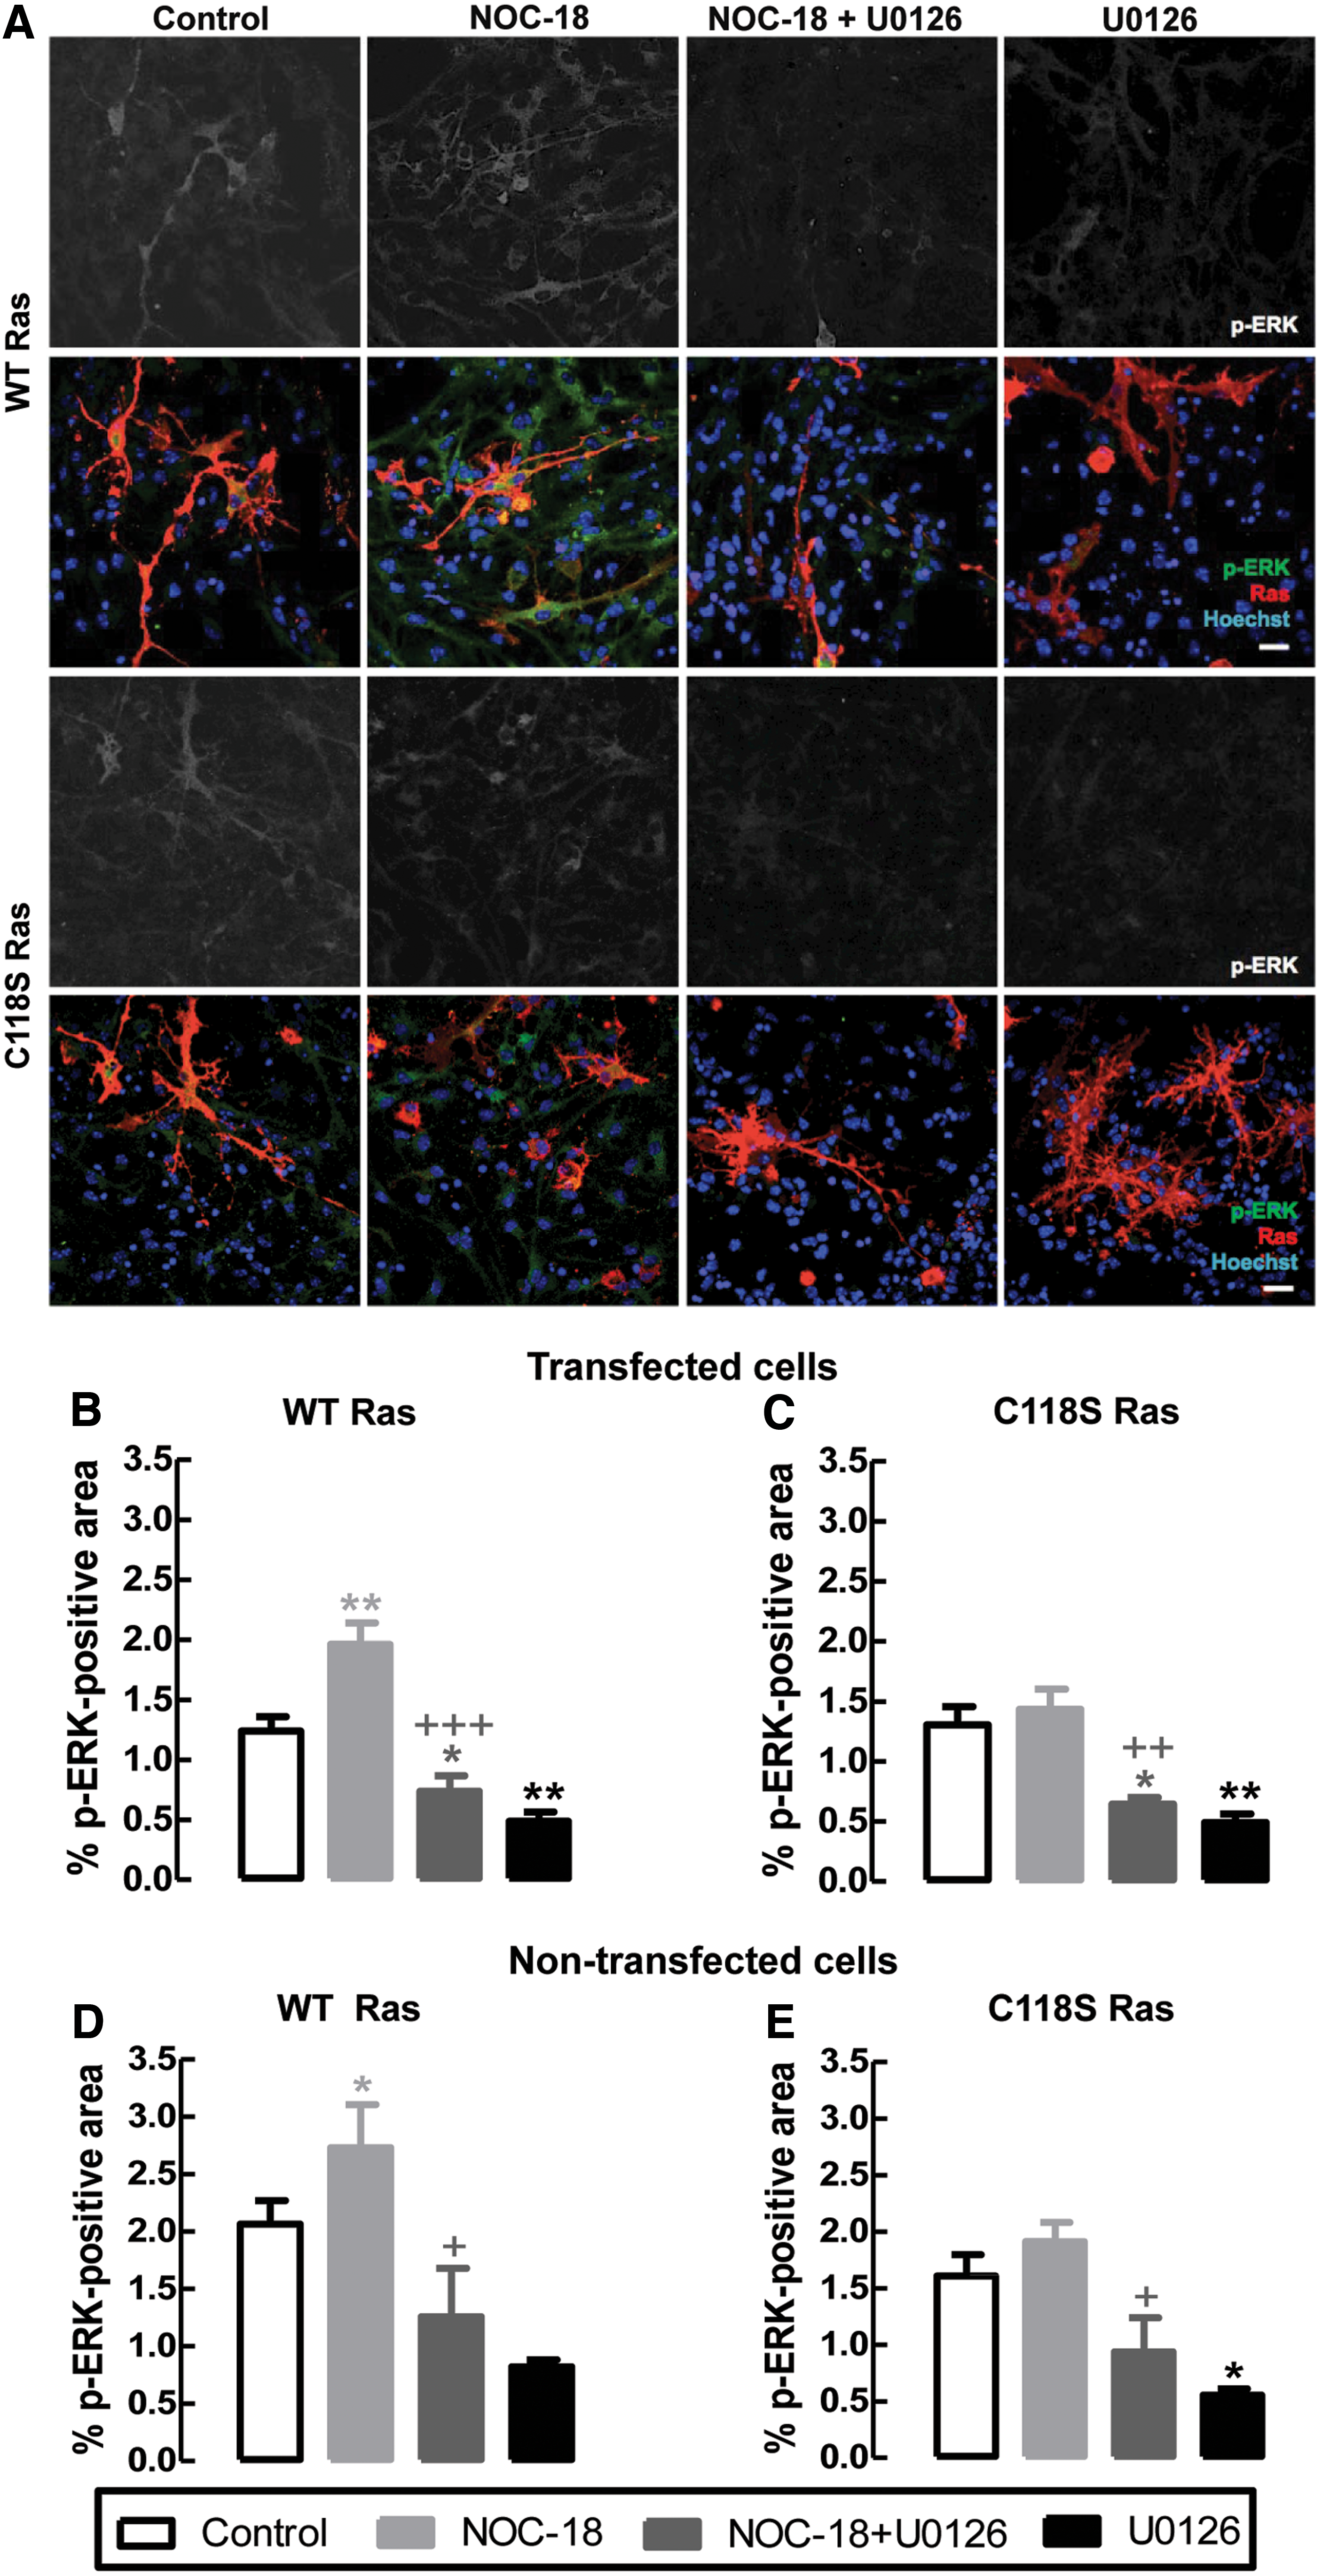
However, in cells overexpressing C118S Ras, exposure to NO did not increase phosphorylation of ERK (1.43 ± 0.2% of p-ERK positive area; p > 0.05; Fig. 3C), in comparison with control (1.30 ± 0.2%; Fig. 3C). Treatment of cells overexpressing the NO-insensitive construct with U0126 also prevented basal phosphorylation of ERK both in NOC-18 treated cells (0.64 ± 0.1% of p-ERK positive area; p < 0.05 and p < 0.01; Fig. 3C) and in control cells (0.49 ± 0.1%; Fig. 3C). Surprisingly, NOC-18 did not seem to increase the number of cells positive for p-ERK in cells that do not appear to be transfected with the C118S Ras construct; this could be attributed to cells that could have been transfected with a lower amount of Ras plasmid.
We appreciate that there is a basal p-ERK signal without NO treatment, which is inhibited by U0126 treatment. However, it is clear that the increase observed with NOC-18 in Ras-transfected cells is dependent on the presence of Cys118.
To show that the C118S Ras construct is insensitive to NO, whereas p21Ras remains functional with this modification, WT Ras- or C118S Ras-overexpressing cells were treated with the EGFR ligand, EGF (20 ng/ml), for 20 min, either alone or with the EGFR inhibitor, AG1478 (200 nM). Although there is some basal p-ERK signal, a large increase in the phosphorylation of ERK was observed after exposure to EGF in both WT Ras (Supplementary Fig. S3B, 0.25 ± 0.2%, p < 0.001) and C118S Ras cells (Supplementary Fig. S3C, 0.77 ± 0.6%, p < 0.05) in comparison with control (Supplementary Fig. S3B, WT Ras: 1.01 ± 0.1%; Supplementary Fig. S3C, C118S Ras: 1.04 ± 0.1%). This increase in phosphorylation was abolished by EGFR inhibition with AG1478 (Supplementary Fig. S3B, WT Ras: 0.75 ± 0.1%, p < 0.001; Supplementary Fig. S3C, C118S Ras: 0.83 ± 0.2%, p < 0.01), thus demonstrating that C118S Ras is insensitive to NO while remaining sensitive to the EGFR ligand, which is upstream of Ras in the pathway.
SNO of Ras enhances proliferation of NSC derived from the SVZ
Next, we evaluated the proliferation of SVZ-derived NSCs transfected with WT Ras or C118S Ras constructs. Cells were treated with 10 μM NOC-18 for 1 h, the same conditions that were previously shown to induce proliferation, without altering cell viability (6). Cell proliferation was assessed by the incorporation of 5-ethynyl-2′-deoxyuridine (EdU), detected in a fluorescence microscope in cells expressing the green fluorescent protein signal, corresponding to the overexpression of the Ras construct.
As shown in Figure 4A–D, cell proliferation was significantly enhanced in cells overexpressing WT Ras after treatment with NOC-18 (18.96 ± 0.8%, p < 0.001; Fig. 4D), when compared with untreated WT Ras-transfected cells (10.99 ± 0.9%). Conversely, after exposure to NOC-18, the incorporation of EdU in C118S Ras-transfected NSCs was lower (6.84 ± 0.5%; Fig. 4D), similar to the values of proliferation in untreated C118S Ras cells (4.80 ± 0.7%, p > 0.05), suggesting that, in the presence of NO, SNO of Ras Cys118 was the trigger for cell proliferation.
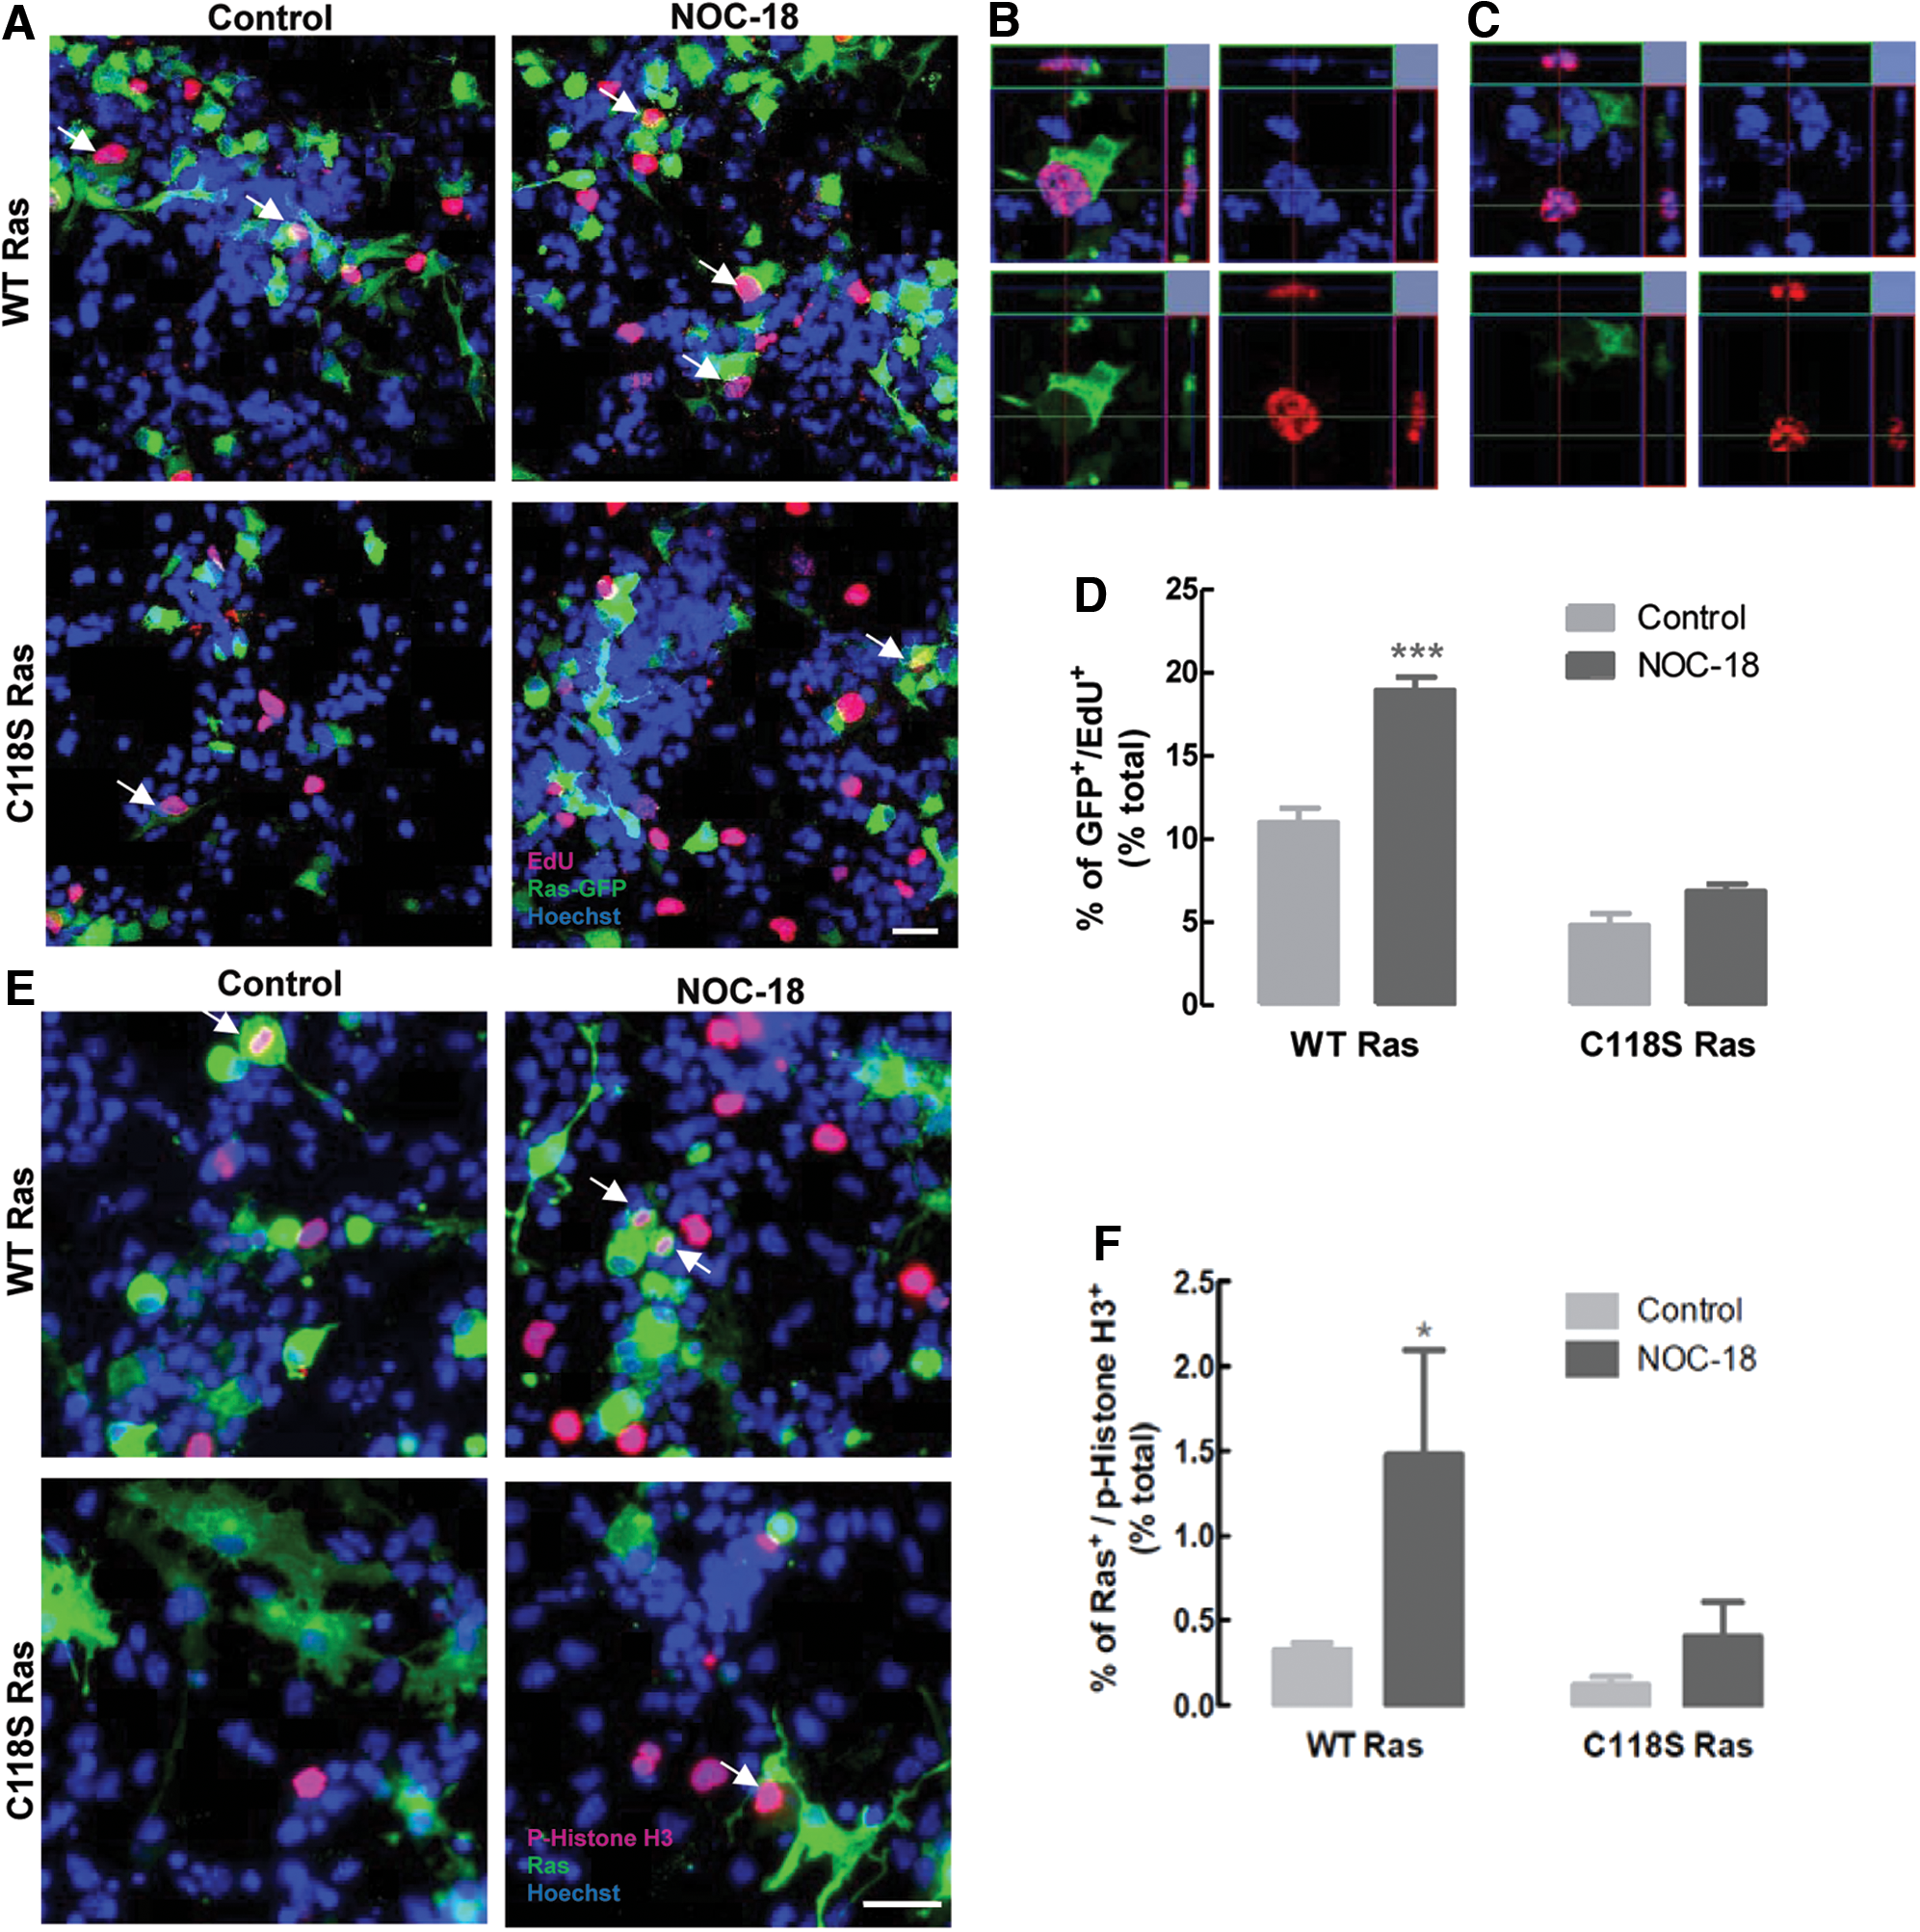
Further, cell proliferation was also assessed through the fluorescent detection of the proliferation marker phospho-histone H3 in cells transfected with WT Ras or C118S Ras (Fig. 4E, F). Likewise, treatment with 10 μM NOC-18 significantly increased the percentage of WT Ras-transfected cells that expressed the phospho-histone H3 marker (1.47 ± 0.6%, p < 0.05; Fig. 4F), when compared with untreated cells (0.33 ± 0.04%), whereas no differences were observed in C118S Ras-overexpressing cells (Control: 0.12 ± 0.05%; NOC-18: 0.40 ± 0.2%, p > 0.05; Fig. 4F).
NOC-18 did not enhance the formation of 3-nitrotyrosine
To rule out the possible tyrosine nitration mediated by the possible formation of peroxynitrite from NOC-18, which could negatively affect the neurogenic potential of NO so far described, we assessed the formation of 3-nitrotyrosine (3-NT) by Western blot. Our results demonstrated that in NSCs derived from the SVZ, either non-transfected or transfected with WT Ras or C118S Ras, there was no production of 3-NT, as compared with the positive controls used in this study, 1 mM peroxynitrite and nitrated bovine serum albumin (BSA) (Supplementary Fig. S4A). Moreover, similar results were observed in in vivo samples of the dentate gyrus of saline-treated or kainic acid (KA)-treated inducible nitric oxide synthase (iNOS)+/+ and iNOS−/− animals, in which no expression of 3-NT was detected in these samples, nor an increase was observed in animals treated with KA, when compared with positive controls (Supplementary Fig. S4B).
Further characterization of the expression of the different nitric oxide synthase (NOS) isoforms showed that none of the NOS isoforms was detected by Western blot in SVZ-derived NSCs that were either non-transfected or transfected with WT Ras or C118S Ras (Supplementary Fig. S5A), whereas neuronal and endothelial NOS were detected in in vivo samples of the dentate gyrus of saline-treated iNOS+/+ or iNOS−/− mice (Supplementary Fig. S5B).
iNOS-derived NO induces SNO of p21Ras after seizures
We previously characterized the production of iNOS-derived NO after seizures, which increases neurogenesis in the dentate gyrus; NO stimulates the proliferation of NSC in the dentate gyrus, starting at 2 days after the onset of seizures and peaking at 5 days, an effect that is completely lost in iNOS knockout mice (6). To study whether p21Ras is modified by NO released after brain injury, seizures were induced in WT mice or in mice lacking iNOS by the administration of 25 mg/kg of KA. Animals were sacrificed and the dentate gyrus was dissected 1, 2, 3, or 5 days after treatment with KA or saline solution (control comparison group). Oxidation of Ras was detected by the redox biotin switch (17). This technique allows the detection of several reversible oxidative cysteine modifications, including SNO, with high sensitivity in tissue samples, in which sensitivity can be an issue.
Our results showed a significant increase in the reversible cysteine oxidation of Ras in WT mice 2 days after seizures (2 days: 103.73 ± 7.1, p < 0.001, Fig. 5A), and a decrease 3 days after seizures (3 days: 26.49 ± 4.4, p < 0.05, Fig. 5A), but no significant differences were observed 1 and 5 days after seizures (1 day: 57.56 ± 5.2, p > 0.05; 5 days: 27.15 ± 6.8, p > 0.05, Fig. 5A), in comparison with saline-treated mice (1 day: 34.92 ± 5.1; 2 days: 57.17 ± 8.1; 3 days: 56.02 ± 13.4; 5 days: 33.26 ± 7.1). However, in mice lacking iNOS, no significant differences in Ras oxidation were observed after seizures in any of the times studied here (1 day: 53.10 ± 12.5; 2 days: 57.08 ± 23.4; 3 days: 32.99 ± 3.8; 5 days: 80.67 ± 30.9, p > 0.05; Fig. 5B), when compared with saline-treated mice (1 day: 40.01 ± 10.7; 2 days: 52.97 ± 11.0; 3 days: 53.99 ± 13.8; 5 days: 48.57 ± 20.5).
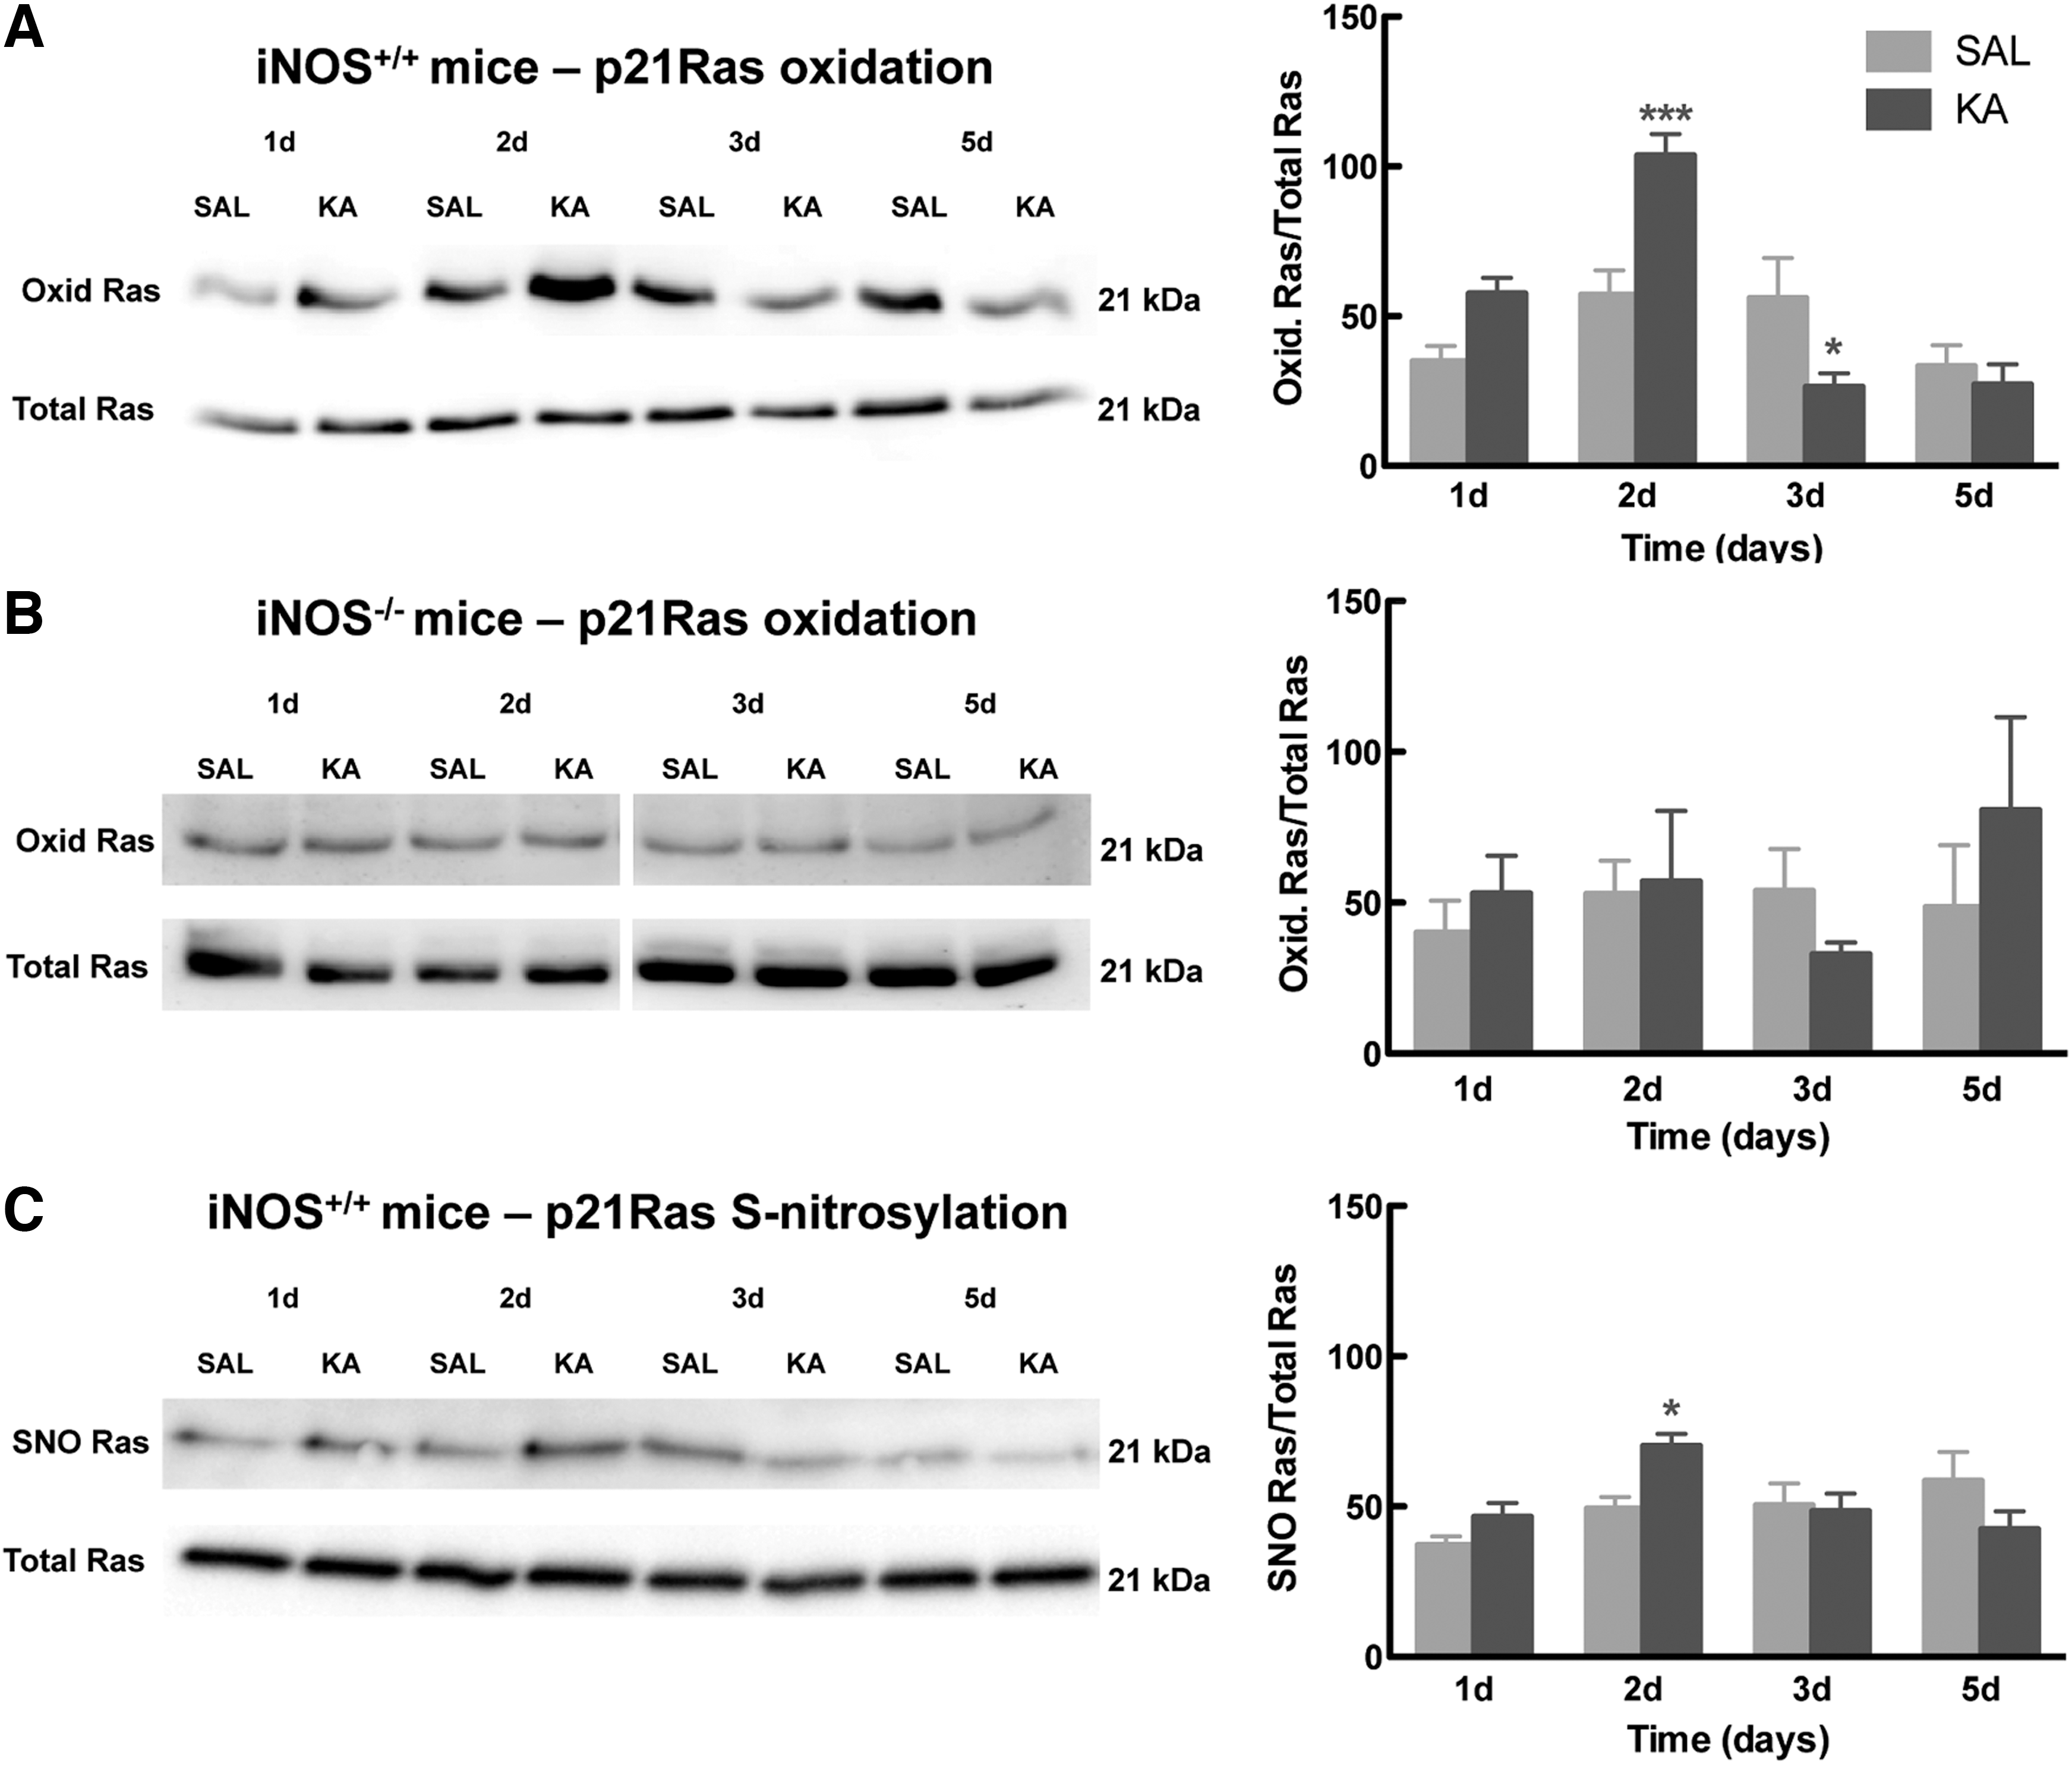
In addition, to confirm that the differences observed in Ras oxidation in WT mice after seizures corresponded to differences in SNO, we performed a classical biotin switch assay (with ascorbate as reducing agent; it is specific for SNO, but provides less sensitivity than the redox biotin switch) in samples of the dentate gyrus obtained from seizured WT mice and respective saline-treated controls. Consistently, we observed an increase in Ras SNO 2 days after seizures (2 days: 70.24 ± 3.9, p < 0.01; Fig. 5C), but not 1, 3, and 5 days after seizures (1 day: 46.51 ± 4.7, p > 0.05; 3 days: 48.42 ± 5.8, p > 0.05; 5 days: 42.38 ± 6.1, p > 0.05; Fig. 5C), in comparison with saline-treated mice (1 day: 37.02 ± 2.9; 2 days: 49.13 ± 3.9; 3 days: 50.37 ± 7.1; 5 days: 58.43 ± 6.1). These findings show that NO produced by iNOS after seizures modifies Ras by SNO, thus suggesting Ras as an important mediator for the neurogenic upregulation observed in the hippocampus after seizures.
Discussion
Redox modulation of proteins is crucial in several cell signaling events involving reactive species, particularly NO. Similar to other post-translational modifications, cysteine SNO in critical residues may modulate protein function. Previous studies identified the Cys118 of Ras as a target of SNO by NO, which increased Ras activity (20). In the data presented here, we identified Ras, on its Cys118, as a direct target of the neurogenic effect of NO in NSCs.
Our findings show that Ras is rapidly modified by SNO in the Cys118 when NSCs are treated with a low amount of NO, since no increase in SNO was observed when cells overexpressing the NO-insensitive C118S Ras were exposed to NO. We have also found an increase in the proliferation of NSCs in cells overexpressing WT Ras, but not in C118S Ras cells. Our current results are in agreement with our previous work, in which we showed that the EGFR was not the first target of NO in the ERK/MAPK pathway (6).
Further, contrary to the report of the other group in which the authors showed that the EGFR is S-nitrosylated and, consequently, loses its tyrosine kinase activity, here we show that EGFR activity seems to be maintained as treatment with EGF activates the downstream ERK/MAPK pathway (34). In addition, Moraes et al. recently showed that SNO of the EGFR stimulates the receptor activity and, subsequently, enhances cell proliferation and angiogenesis in endothelial cells after exposure to bradykinin (30). In that work, they also showed that NO-mediated activation of the ERK/MAPK pathway leads to ERK1/2-mediated phosphorylation of specific Thr residues of the EGFR, preventing EGFR internalization and resulting in sustained signaling (30); thus, there can be upstream effects that are mediated by downstream components of the EGF-Ras-ERK pathway. Moreover, we observed the activation of the downstream elements of Ras, including c-Raf1 and ERK1/2, suggesting that p21Ras could be the first protein to be activated by NO (6).
In addition, we show that the phosphorylation of ERK induced by NO depends on the Cys118 of Ras, highlighting the role of the NO modification of this cysteine residue. However, in cells that overexpress the NO-insensitive Ras, the phosphorylation of ERK by other mechanisms, such as the activation of the EGFR with EGF, is preserved. Thus, there is no loss of function of Ras in the ERK pathway and the lack of effect of NO in Ras C118S cells is caused by the inability to modify Cys118 and not by a non-functional Ras. Taken together, our findings point out Ras as one of the first targets of NO in the ERK/MAPK pathway in the NO-induced proliferation of NSCs in the SVZ, as suggested in Figure 6.

Although classical effects of NO, such as its vasodilating properties, occur through an interaction with soluble guanylyl cyclase, other signaling events are independent of cGMP and based on post-translational modifications (26). For instance, in endothelial cells, SNO of Ras at Cys118 is the trigger for the stimulation of cell proliferation via activation of the ERK/MAPK pathway (3). Also, activation of the ERK/MAPK pathway was described in T cells, being important for its activation and development (16). Moreover, our findings do not exclude the activation of other pathways by NO through cGMP-dependent or -independent mechanisms, and the interaction between effectors of different pathways. In fact, we previously reported the activation of the sGC/cGMP/PKG pathway by NO, in addition to the ERK/MAPK pathway, in the stimulation of NSC proliferation (7). In that work, we showed that the activation of both pathways by NO is biphasic: an initial activation of the ERK/MAPK pathway and, in longer periods, activation of the sGC/cGMP/PKG pathway (7). Moreover, the involvement of the PI3K/Akt pathway in the proliferative effect of NO in human endothelial cells is also suggested by other studies (3).
SNO of several proteins involved in neurogenesis has been reported [reviewed in ref. (44)]. In some proteins, such as p21Ras, SNO stimulates neurogenesis; whereas in other proteins, SNO is described as anti-neurogenic. For example, MEF2 is a positive regulator of neurogenesis in physiological conditions, but, in the presence of increased levels of NO, as in some neurodegenerative conditions, MEF2 is S-nitrosylated at Cys39, resulting in an inhibition of neurogenesis and stimulating neurodegeneration (36). Also, SNO of the EGFR in two Cys residues was suggested to be involved in the antiproliferative role of NO in the SVZ (34). Hence, the evidence that SNO of Ras is able to positively regulate neurogenesis makes Ras a possible therapeutic target for conditions in which neurogenesis is impaired. Further, Ras is an upstream protein of the ERK/MAPK pathway, one of the main signaling pathways in the cell, whose activation results in the activation of several transcription factors, including cAMP response element-binding protein, c-Fos, Elk-1, and c-Myc (6). Hence, through the activation of this pathway, cells can achieve signal amplification and a more pronounced effect on proliferation.
One of the hallmarks of several acute and chronic neurodegenerative diseases is the overproduction of NO in the brain, which favors protein SNO (35). NO of an inflammatory origin in the brain is derived from iNOS, which is mainly expressed in activated microglial cells. In this study, we used a well-described seizure model of acute excitotoxic brain injury (45), characterized by neuronal loss in the hippocampus accompanied by activation of microglia and neuroinflammation, which presents an increase in the proliferation of NSCs (starting 2 days after seizures) and neurogenesis in the dentate gyrus of WT mice after seizures (6). We observed increased levels of oxidized Ras, specifically S-nitrosylated Ras, in the dentate gyrus of WT mice 2 days after seizures. These data point to a temporal overlap between Ras SNO (2 days after seizures) and cell proliferation (also increases significantly at 2 days after seizures and peaks at 5 days) in this seizure model, as shown in Supplementary Figure S6. In fact, the peak of Ras SNO observed 2 days after seizures precedes the peak in cell proliferation (5 days) previously observed after seizures in mice (6). A similar pattern was observed in SVZ cultures, on a different time scale: The increase in cell proliferation observed at 60 min after exposure to NO in NSCs follows the peak of Ras SNO at 5 min (Supplementary Fig. S6).
Moreover, in iNOS−/− mice, in which NSC proliferation and neurogenesis after seizures are impaired (6), modification of Ras was not observed, suggesting that iNOS-derived NO is responsible for Ras oxidation/SNO. Although in this study we have focused on the effect on cell proliferation, our previous study show that NO produced in this injury context was shown to be essential for the proliferation of the early-born NSC, migration of neuroblasts, and distribution of newborn cells in the dentate gyrus after seizures (8). We show here that Ras SNO is an early critical event in the timeline of the stimulation of hippocampal neurogenesis by NO.
Altogether, our findings help in better understanding the role of SNO of Ras in cell proliferation both in vitro and in vivo, in the context of an acute excitotoxic lesion that affects neurogenesis in the hippocampus. We identified Ras SNO as one of the first targets of NO in NSC, and as a possible therapeutic target for NO-based therapeutic approaches aiming at the stimulation of neurogenesis for repairing brain injury.
Materials and Methods
Reagents and chemicals
Dulbecco's modified Eagle's medium (D-MEM)/F-12 with 2 mM GlutaMAX TM-I, B27, Penicillin-Streptomycin (10,000 U/ml), Lipofectamine® LTX, Optimem® Reduced Serum Medium, Click-iT® EdU Alexa Fluor® 594 HCS Assay kit, immunoglobulin Gs (IgGs) conjugated with Alexa Fluor 488, 594, or 633, and Hoechst 33342 were purchased from Life Technologies (Carlsbad, CA). Amaxa® Mouse NSC Nucleofector® Kit was from Lonza (Basel, Switzerland). EGF and basic fibroblast growth factor (bFGF) were from Peprotech (London, United Kingdom). KA was obtained from Ocean Produce (Charlottetown, Canada). NOC-18 was purchased from Alexis Biochemicals (San Diego, CA), and AG1478 was from Tocris Bioscience (Bristol, United Kingdom). U0126 and horseradish peroxidase (HRP) secondary anti-mouse antibody conjugate were purchased from Cell Signaling (Danvers, MA). Mouse anti-Ras antibody and nitrated BSA were from Millipore (Darmstadt, Germany). N-[6-(Biotinamido)hexyl]-3′-(2′-pyridyldithio)propionamide (Biotin-HPDP) and Ultralink immobilized neutravidin resin were obtained from Thermo Fisher Scientific (Waltham, MA), and streptavidin-peroxidase was from Calbiochem (San Diego, CA). NEM, sodium ascorbate, DTT, IAM, mouse anti-α-tubulin antibody, and poly-
Animals
C57BL/6J newborn mice and 12-week-old C57BL/6J (iNOS+/+) male mice were obtained from Charles River (Barcelona, Spain). Twelve-week-old B6.129P2-Nos2tm1Lau /J (iNOS−/−) male mice were purchased from The Jackson Laboratory (Bar Harbor, ME). All the animals were kept in our animal facilities with food and water ad libitum in a 12 h dark:light cycle. The weight of the animals varied between 20 and 30 g. All experiments were performed in accordance with NIH and European guidelines (2010/63/EU) for the care and use of laboratory animals. The animals were housed in the Centre for Neuroscience and Cell Biology, Coimbra, Portugal, a licensed animal facility (International Animal Welfare Assurance number 520.000.000.2006).
SVZ NSC cultures
NSC cultures were obtained from the SVZ of 0–3 day C57BL/6J mice and maintained as previously described (1, 6). NSCs grown as floating neurospheres in D-MEM:F-12 nutrient mixture (D-MEM/F-12 with 2 mM GlutaMAX™-I [
Plasmids and transfection
WT Ras (H-Ras isoform, human sequence, identical to the mouse amino acid sequence) and C118S Ras constructs were a kind gift by Dr. Kenneth K. Teng (20). In the C118S Ras plasmid, the cysteine 118 was replaced by a residue of serine, an NO-insensitive form of p21Ras that cannot be S-nitrosylated. For analysis of EdU incorporation, NSCs were transfected with the Amaxa Mouse NSC Nucleofector Kit (Lonza) and for the other experiments, Lipofectamine LTX (Life Technologies) was used.
For nucleofection, neurospheres with 3–5 passages were harvested, pelleted, and dissociated and the cells were counted. Overall, 2–4 × 10⁶ cells were used per nucleofection sample. Cells were pelleted, and the supernatant was completely removed. Five micrograms of DNA (WT Ras or C118S Ras) plus 2 μg of pmaxGFP® vector were added to 100 μl of Mouse NSC Nucleofector Solution. The cell pellet was resuspended in the solution with the DNA and transferred to the cuvette. The program A-033 of the Nucleofector II Device (Lonza, Basel, Switzerland) was used. The suspension containing the transfected cells was plated onto poly-
For Lipofectamine transfection, neurospheres were dissociated and plated onto poly-
2-DE and MS
For the identification of S-nitrosylated Ras, NSCs were treated with 100 μM CysSNO for 15 min, prepared as previously described (19). Cells were lysed; proteins were separated by 2-DE using 7-cm pI 4–7 immobilized pH gradient strips and 10% sodium dodecyl sulfate (SDS)-polyacrylamide gel electrophoresis (PAGE), and they were stained with Sypro Ruby, as previously described (17, 49). Spots were picked, digested, and analyzed by LC-MS/MS in the Proteomics Unit of the Centro de Biología Molecular Severo Ochoa (CBMSO) as detailed below.
In-gel digestion
After drying, gel spots were destained in acetonitrile:water (ACN:H2O, 1:1) and digested in situ with sequencing-grade trypsin (Promega, Madison, WI) as described by Shevchenko et al. (46) with minor modifications (40). The gel pieces were shrunk by removing all liquid by using sufficient ACN. ACN was pipetted out, and the gel pieces were dried in a speedvac. The dried gel pieces were re-swollen in 50 mM ammonium bicarbonate pH 8.8 with 12.5 ng/μl trypsin for 1 h in an ice bath. The digestion buffer was removed, and gels were covered again with 50 mM ammonium bicarbonate pH 8.8 and incubated at 37°C for 12 h. Digestion was stopped by the addition of 1% trifluoroacetic acid. Whole supernatants were dried down and then desalted onto ZipTip C18 Pipette tips (Millipore) until the mass spectrometric analysis.
Reverse-phase LC-MS/MS assay in SMIM mode
The desalted protein digest was dried, resuspended in 10 μl of 0.1% formic acid, and analyzed by reverse-phase LC-MS/MS in an Easy-nLC II system coupled to an ion trap LTQ-Orbitrap-Velos-Pro mass spectrometer (Thermo Fisher Scientific). The peptides were concentrated (on-line) by reverse-phase chromatography by using a 0.1 mm × 20 mm precolumn Acclaim PepMap C18, 5 μm, 100 Å (Thermo Fisher Scientific), and they were then separated by using a 0.075 mm × 25 cm column Acclaim PepMap C18, 3 μm, 100 Å (Thermo Fisher Scientific) operating at 0.3 μl/min. Peptides were eluted by using a 60-min gradient from 5% to 40% solvent B (Solvent A: 0.1% formic acid in water; solvent B: 0.1% formic acid, 80% ACN in water). Electrospay ionization was done by using a Nano-bore emitters Stainless Steel ID 30 μm (Proxeon) interface (31).
The Orbitrap resolution was set at 30,000. Peptides were detected in survey scans from 400 to 1600 amu (1 μscan), followed by selected MS/MS ion monitoring (SMIM) events when necessary (the number of events depends on the peptides to be monitored) plus 10 data-dependent MS/MS scans, using an isolation width of 2 U (in mass-to-charge ratio units), normalized collision energy of 35%, and dynamic exclusion applied during 30 s periods.
To find peptides in a directed way, the mass spectrometer was operated in the selected MS/MS ion monitoring mode (SMIM mode) (18). In this mode, the LTQ-Orbitrap-Velos-Pro detector was programmed to perform, along the same entire gradient, a continuous sequential operation in the MS/MS mode on the doubly or triply charged ions corresponding to the peptide/s previously selected from the theoretical prediction.
Peptide identification from raw data was carried out by using the SEQUEST algorithm (Proteome Discoverer 1.4; Thermo Fisher Scientific). A database search was performed against the handmade database. The following constraints were used for the searches: tryptic cleavage after Arg and Lys, up to two missed cleavage sites, and tolerances of 20 ppm for precursor ions and 0.8 Da for MS/MS fragment ions and the searches were performed, allowing optional Met oxidation, Cys carbamidomethylation, and Cys NEM modification. Search against the decoy database (integrated decoy approach) was carried out by using a false discovery rate <0.01.
To confirm the identification of peptides monitored, the MS/MS spectra were manually analyzed by assigning the fragments to the candidate sequence, after calculation of the series of theoretical fragmentations, according to the nomenclature of the series as previously described (42).
Cell lysates for biotin switch assay
For the assessment of Ras SNO, NSCs overexpressing WT Ras or C118S Ras were treated for 2, 5, or 7.5 min with 10 μM NOC-18, the concentration previously used to stimulate proliferation of NSCs from the SVZ (6). After treatment, cells were washed with cold 0.9% NaCl, and they were then scraped and lysed in TENT pH 6.0 (50 mM Tris-HCl, 1 mM ethylenediaminetetraacetic acid [EDTA], 0.1 mM neocuproine, 1% Triton X-100, pH 6.0) supplemented with 50 mM NEM to block the free thiols, and protease inhibitors (freshly added), protected from light. Four 2-s sonication cycles were applied. To complete the blocking reaction, 2% SDS was added to the lysate and incubated for 30 min at 37°C. Protein concentration was determined by the bicinchoninic acid assay method.
Administration of KA
Adult male wild-type C57BL/6J and iNOS-deficient mice of 12 weeks of age were treated with KA solution that was injected subcutaneously (25 mg/kg) and the respective controls were treated with a sterile saline solution (0.9% NaCl in water, pH 7.4), as previously described (6). All animals that received KA developed grade five seizures or higher in the 1972's Racine's six-point scale modified for mice (45). In animals injected with saline solution alone, no seizures were observed and they were used as controls. The mice were maintained for 1–5 days after the first generalized seizure. At least three animals survived in each experimental group.
Dissection of the dentate gyrus and lysates
The dentate gyrus of each animal was dissected in Hanks' Balanced Salt Solution and mechanically lysed with a tissue homogenizer in TENT pH 6.0 (50 mM Tris-HCl, 1 mM EDTA, 0.1 mM Neocuproine, 0.5% Triton X-100, pH 6.0) supplemented with 50 mM NEM to block the free thiols, and protease inhibitors. Four 2-s sonication cycles were applied. Two percent SDS was added to the lysate, and it was incubated for 30 min at 37°C to complete the blocking reaction. Protein concentration was determined by the bicinchoninic acid assay method.
Biotin switch assay
Determination of SNO by the biotin switch assay and of reversible Cys oxidation by the redox biotin switch assay was performed as described in Izquierdo-Alvarez et al. and Martinez-Ruiz and Lamas (17, 28), both in in vivo samples and in in vitro treated cell extracts after thiol blocking.
For the assessment of Ras SNO in transfected NSC, 200 μg of protein was used, and for in vivo assessment of Ras oxidation and SNO, 500 and 1000 μg of protein were used, respectively. Lysates were precipitated with acetone, and the pellet was resuspended in TENS pH 7.2 (50 mM Tris-HCl, 1 mM EDTA, 0.1 mM neocuproine, 1% SDS, pH 7.2); 2.5 mM DTT or 100 mM sodium ascorbate was added to reduce oxidized thiols or specifically nitrosothiols, respectively. The reduced thiols were labeled with 1 mM biotin-HPDP for 1 h. Until this point, all operations were carried out in the dark. Samples were precipitated with acetone and resuspended in HENS (250 mM Hepes pH 7.7, 1 mM EDTA, 0.1 mM neocuproine, 1% SDS); then, a neutralization buffer (20 mM Hepes pH 7.7, 1 mM EDTA, 100 mM NaCl, 0.5% Triton) was added, followed by centrifugation at 13,400 rpm for 1 min. One hundred microliter of the supernatant was saved as the Input fraction (total Ras), and the rest was added to the pre-equilibrated Ultralink immobilized neutravidin resin. Samples were incubated with the resin for 1 h at RT with agitation. After washing, 100 μl of elution buffer was added (20 mM Hepes pH 7.7, 100 mM NaCl, 1 mM EDTA +100 mM 2-mercaptoethanol) and incubated for 20 min at 37°C for elution of the proteins that bound to the resin. Then, the mixture was centrifuged for 1 min, at 14,500 rpm and the supernatant was saved as the eluted fraction (oxidized/SNO proteins).
For Ras analysis by Western blot, the eluted fraction and respective input samples were denatured at 95°C for 5 min with a reducing Laemlli buffer and then subjected to an electrophoresis in 12% SDS/PAGE gels, transferred to PVDF membranes, blocked with 5% low-fat dry milk, and finally incubated with the primary antibody (mouse anti-Ras, 1:2000; Millipore) overnight, at 4°C. After incubation with the HRP secondary anti-mouse antibody conjugate (1:2000), membranes were incubated with the Clarity Western ECL Substrate (Bio-Rad Laboratories), and immunoreactive bands were visualized in the Molecular Imager® ChemiDocTM XRS+ Imaging System (Bio-Rad Laboratories). Image bands were analyzed with the ImageLab software version 5.1 (Bio-Rad Laboratories).
Analysis of cell proliferation by EdU incorporation
SVZ-derived NSCs were treated for 1 h with 10 μM NOC-18, and proliferation was assessed by incorporation of EdU by using the Click-iT® EdU Alexa Fluor® 594 HCS Assay kit (Life Technologies) as previously described (33, 43). Ten micromolar EdU was added to the SVZ cultures at the time of the treatment (1 h). Nuclei were stained with Hoechst 33342 (2 μg/ml) for 5 min. Images were acquired in an epifluorescence microscope (Axioskop 2 Plus; Zeiss, Jena, Germany). Cells were counted in 8–9 different images per condition, corresponding to a minimum of 1000 live cells per condition. Results of labeled cells are expressed as percentage of total live cells. Representative images were acquired in a laser confocal microscope Zeiss LSM 710 (Zeiss).
Analysis of ERK phosphorylation
NSCs transfected with WT Ras and C118S Ras constructs were treated for 20 min with 10 μM NOC-18 or 20 nM EGF and for 30 min with the MEK1/2 inhibitor, 1 μM U0126, or with the EGFR inhibitor, 1 μM AG1478. After treatment, cells were fixed with 4% paraformaldehyde/4% sucrose in phosphate-buffered saline (PBS), for 20 min. Fixed cells were permeabilized with 1% Triton X-100 in PBS for 5 min, and the non-specific binding was blocked with albumin solution (3% BSA and 0.2% Tween-20 in PBS) for 1 h. For evaluation of ERK phosphorylation, the incubation with primary antibodies (rabbit anti-phospho-ERK1/2, 1:1000 [Cell Signaling], and mouse anti-Ras, 1:1000 [Millipore] in 3% albumin solution) was performed overnight, at 4°C. After rinsing with PBS, the cells were exposed to the appropriate secondary antibodies, anti-mouse or anti-rabbit IgGs conjugated with Alexa Fluor 594 or 488, respectively, 1:200, in 3% albumin solution, for 90 min, at RT. Nuclei were stained with Hoechst 33342 (2 μg/ml) for 5 min. Controls with mock transfection and without primary antibody were also performed (not shown).
Images were acquired in a laser confocal microscope Zeiss LSM 710 (Zeiss). Results of labeled cells are expressed as percentage of the phospho-ERK fluorescent area of the transfected cells of seven independent experiments. Ten images per condition were analyzed by using Image J software (version 1.44; NIH, Bethesda). In each image, the entire area corresponding to transfected cells was selected and the percentage of p-ERK positive area was calculated by the p-ERK positive area in the transfected cells in function of the total area of the image (45,177 μm2), as previously described (6).
Analysis of cell proliferation by immunofluorescence
NSCs transfected with WT Ras and C118S Ras constructs were treated for 1 h with 10 μM NOC-18. Cells were fixed, permeabilized, and blocked as detailed earlier. The primary antibodies rabbit anti-phospho-histone H3 and mouse anti-Ras, 1:1000 (Millipore), were incubated for 90 min, at RT. After rinsing with PBS, the cells were exposed to the appropriate secondary antibodies, anti-mouse or anti-rabbit IgGs conjugated with Alexa Fluor 488 or 594, respectively, 1:200, in 3% albumin solution, for 90 min, at RT. Nuclei were stained with Hoechst 33342 (2 μg/ml) for 5 min.
Images were acquired in an epifluorescence microscope (Axioskop 2 Plus; Zeiss). Cells were counted in 8–9 different images per condition, corresponding to a minimum of 1000 live cells per condition. Results of labeled cells are expressed as percentage of total live cells.
Characterization of WT Ras-transfected SVZ cultures
NSCs transfected with WT Ras construct were fixed, permeabilized, and blocked as detailed earlier. The primary antibodies mouse anti-nestin, 1:30, goat anti-Sox 2, 1:30, goat anti-Sox 2, 1:200 (R&D Systems), rat anti-GFAP, 1:500 (Novex), mouse anti-Tuj1, 1:500 (Covance), rabbit anti-Ras, 1:200 (Abcam), and mouse anti-Ras, 1:1000 (Millipore), were incubated for 90 min, at RT. After rinsing with PBS, the cells were exposed to the appropriate secondary antibodies, anti-mouse, anti-rabbit, anti-goat, or anti-rat IgGs conjugated with Alexa Fluor 488, 594, or 633, 1:200, in 3% albumin solution, for 90 min, at RT. Nuclei were stained with Hoechst 33342 (2 μg/ml) for 5 min.
Images were acquired in a laser confocal microscope Zeiss LSM 710 (Zeiss), and around 10 images per condition, corresponding to ∼1000 live cells, were manually counted. Results of labeled cells are expressed as percentage of live cells transfected with WT Ras of three independent experiments.
Western blotting for detection of Ras overexpression, NOS isoforms, and 3-NT
Treated cells were washed with PBS 0.01 M, scraped, and lysed in 50 mM Tris-HCl pH 7.5, 2 mM MgCl2, 10 mM ethylene glycol-bis(2-aminoethylether)-N,N,N′,N′-tetraacetic acid, and 1% Triton X-100, supplemented with protease inhibitors (cOmplete mini; Roche), phosphatase inhibitors (PhosSTOP; Roche), and 1 μM DTT, at 4°C. Three freezing/thawing cycles followed by five 5-s sonication cycles were applied, and total extracts were obtained. Protein concentration was determined by the bicinchoninic acid assay method. Then, 6 × concentrated sample buffer was added and samples were denatured at 95°C for 5 min. Samples were analyzed by Western blot.
Samples were electrophoresed in SDS-PAGE by using MiniPROTEAN® 3 systems (Bio-Rad Laboratories). Gels were composed by 6% (for NOS) or 12% (for Ras and 3-NT) SDS-PAGE gels. Equal amounts of protein were applied on each lane of the SDS-PAGE gels submerged in a running buffer. Proteins were separated by electrophoresis, until proper band separation was reached. A molecular ladder was used to control separation according to molecular mass. Proteins were electrophoretically transferred to PVDF membranes by using the Trans-Blot Turbo apparatus (Bio-Rad Laboratories).
Membranes were blocked by a 1 h incubation at RT with Tris-buffered saline containing 0.1% Tween-20 (TBS-T) and 3% BSA (for 3-NT) or 5% low-fat dry milk. Incubation with the primary antibodies: mouse anti-Ras, 1:1000 (Millipore), rabbit anti-3-NT, 1:500 (Millipore), mouse anti-neuronal NOS, 1:500, mouse anti-endothelial NOS, 1:500, and rabbit anti-iNOS, 1:500 (BD Transduction), in TBS-T containing 1% blocking solution was performed overnight, at 4°C. After rinsing with TBS-T, incubation with the appropriate HRP secondary antibody conjugates (1:2000 in TBS-T containing 1% blocking solution) was performed at RT for 1 h. After extensive washing in TBS-T followed by the incubation of the membranes with the Clarity Western ECL Substrate (Bio-Rad Laboratories), immunoreactive bands were visualized in the Molecular Imager ChemiDocTM XRS+ Imaging System (Bio-Rad Laboratories). Image bands were analyzed with the ImageLab software version 5.1 (Bio-Rad Laboratories).
Data analysis
Data are expressed as means ± standard error of the mean. Statistical significance was determined by using t-test for a comparison of two population means or one-way or two-way analysis of variance followed by Bonferroni's or Dunnett's post-tests, as appropriate and indicated in the figure legends and in the text. Differences were considered significant when p < 0.05. The software used was GraphPad Prism 5.0 (GraphPad Software, La Jolla, CA).
Footnotes
Acknowledgments
The authors thank Dr. Kenneth K. Teng for kindly providing them with the constructs for Ras; Lorena Vega Piris and Francisco Rodríguez Salvanés, from the Methodology Unit of the Instituto de Investigación Sanitaria Princesa (IP), for their helpful advice on statistical analysis; Manuel Gómez from the Methodology Unit of IP for English language revision; and Pedro Vilela for help with digital artwork. A.I.S. and A.S.L. were supported by the Foundation for Science and Technology (FCT, Portugal; fellowships SFRH/BD/77903/2011 and SFRH/BD/79308/2011) and are PhD students of the PhD programme in Biomedical Sciences of the University of Algarve. A.M.-R. is supported by the I3SNS programme (ISCIII, Spanish Government, partially funded by FEDER/EDRF). I.M.A. is supported by FEDER/EDRF funds via Programa Operacional Factores de Competitividade (COMPETE), by the FCT (grants PTDC/NEU-OSD/0473/2012, UID/BIM/04773/2013, UID/NEU/04539/2013). This work was supported by the COST action BM1005 (ENOG: European Network on Gasotransmitters), by the Spanish Government (ISCIII grants PS09/00101, PI12/00875, and PI15/00107; cofinanced by FEDER/EDRF), and by the Spanish-Portuguese Integrated Action grant PRI-AIBPT-2011-1015/E-10/12. The Proteomics Service of the CBMSO is a member of Proteored (PRB2-ISCIII), and it is supported by grant PT13/0001/0024 of the Spanish Government (cofinanced by FEDER/EDRF).
Author Disclosure Statement
No competing financial interests exist.
Abbreviations Used
References
Supplementary Material
Please find the following supplemental material available below.
For Open Access articles published under a Creative Commons License, all supplemental material carries the same license as the article it is associated with.
For non-Open Access articles published, all supplemental material carries a non-exclusive license, and permission requests for re-use of supplemental material or any part of supplemental material shall be sent directly to the copyright owner as specified in the copyright notice associated with the article.