
Abstract
Aims:
Hemangiomas are endothelial cell tumors and the most common soft tissue tumors in infants. They frequently cause deformity and can cause death. Current pharmacologic therapies have high-risk side-effect profiles, which limit the number of children who receive treatment. The objectives of this work were to identify the mechanisms through which standardized berry extracts can inhibit endothelial cell tumor growth and test these findings in vivo.
Results:
EOMA cells are a validated model that generates endothelial cell tumors when injected subcutaneously into syngeneic (129P/3) mice. EOMA cells treated with a blend of powdered natural berry extracts (NBE) significantly inhibited activity of multidrug resistance protein-1 (MRP-1) compared to vehicle controls. This resulted in nuclear accumulation of oxidized glutathione (GSSG) and apoptotic EOMA cell death. When NBE-treated EOMA cells were injected into mice, they generated smaller tumors and had a higher incidence of apoptotic cell death compared to vehicle-treated EOMA cells as demonstrated by immunocytochemistry. Kaplan–Meier survival curves for tumor-bearing mice showed that NBE treatment significantly prolonged survival compared to vehicle-treated controls.
Innovation:
These are the first reported results to show that berry extracts can inhibit MRP-1 function that causes apoptotic tumor cell death by accumulation of GSSG in the nucleus of EOMA cells where NADPH oxidase is hyperactive and causes pathological angiogenesis.
Conclusions:
These findings indicate that berry extract inhibition of MRP-1 merits consideration and further investigation as a therapeutic intervention and may have application for other cancers with elevated MRP-1 activity. Antioxid. Redox Signal. 26, 1009–1019.
Introduction
E
This work presents a novel therapeutic strategy to kill oxidant-rich tumor forming cells, that is, inhibition of the cellular oxidized glutathione (GSSG)-efflux mechanism multidrug resistance protein-1 (MRP-1). Furthermore, a standardized natural berry extract is recognized as being effective in managing endothelial cell tumor in vivo by inhibition of MRP-1. The inhibition of MRP-1 may have the added benefit of reducing cancer cell chemoresistance and identifies an important potential role of phytochemicals as an adjunctive treatment to improve the effectiveness of chemotherapy.
We have reported highly elevated levels of Nox-4 expression in human hemangiomas and using a validated murine (EOMA) model for hemangioendothelioma have shown that tumor development is dependent on elevated levels of Nox-4-derived H2O2 (4, 17). We also reported that perinuclear Nox-4 protein in EOMA cells causes elevated levels of nuclear H2O2 and that increased multidrug resistance protein-1 (MRP-1) activity with efflux of oxidized glutathione (GSSG) out of the nucleus is critical to EOMA cell survival (4, 17, 20). MRP-1 is a membrane-bound transport protein that effluxes many types of chemotherapeutic agents, including vinca alkaloids, which are the type of agents used to treat endothelial cell tumors (12, 30). Thus, the increased levels of MRP-1 activity necessary to maintain EOMA cell survival may also render it less susceptible to the effects of chemotherapy. There are previous reports of phytochemicals inhibiting MRP-1, but the mechanisms have not been clearly elucidated and none of the phytochemicals was tested on in vivo endothelial cell tumor models (43, 44). The objectives of this work were to determine whether treatment of EOMA cells with standardized powdered natural berry extracts (NBE) can inhibit MRP-1, decrease hemangioendothelioma size, and improve survival in a murine model.
Results
The in vitro model was designed to provide continuous low-level exposure to NBE that simulates the way treatment would be delivered in a clinical setting. Toxicity effects were observed starting at 12 days of continuous exposure. This was taken as the inflection point at which selection for NBE-resistant cells and homeostasis was overcome and NBE treatment effects observed. NBE treatment for 12 days at 50 μg/ml resulted in a significant loss of viability in EOMA cells, which was not observed in murine aortic endothelial (MAE) cells (Fig. 1A). Thus, NBE at 50 μg/ml and 12 days of continuous exposure was chosen as the treatment dose for subsequent experiments, unless otherwise indicated.

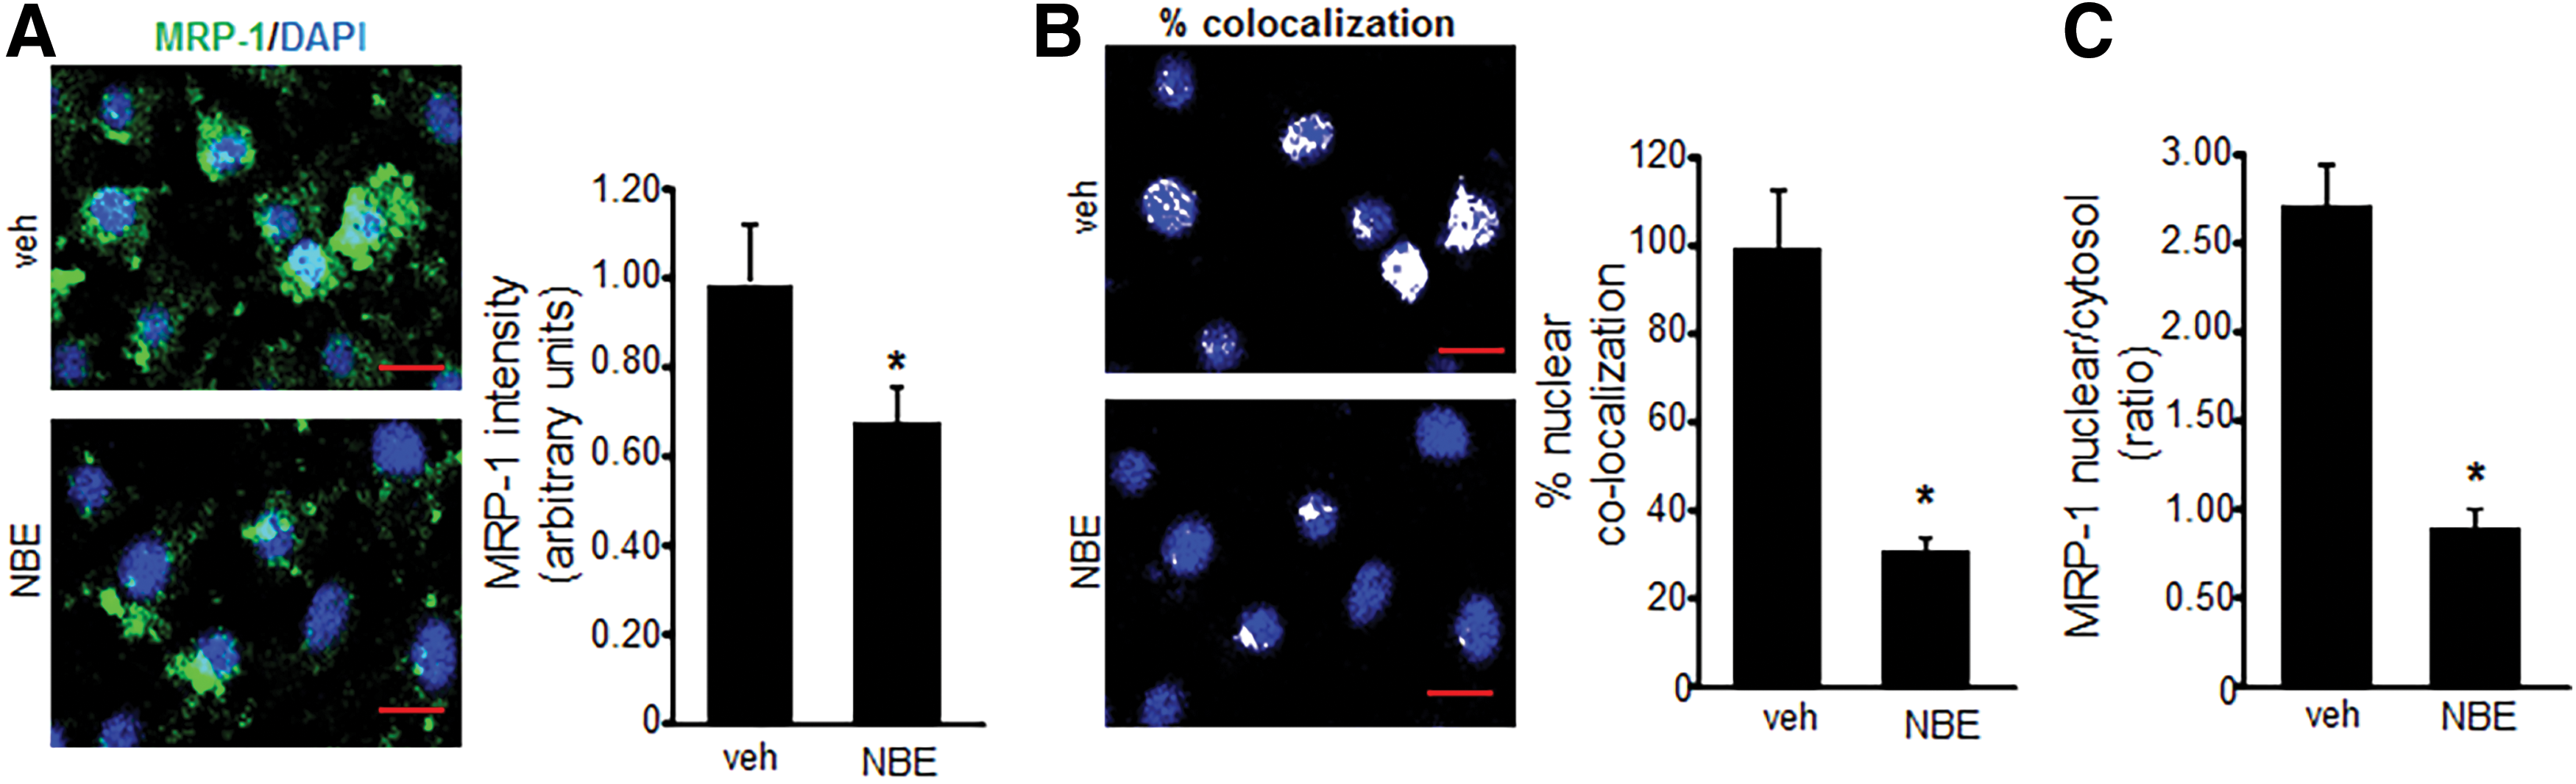
To determine whether NBE treatment could inhibit MRP-1 activity, a calcein exclusion test was performed on MAE and EOMA cells treated with NBE or vehicle control. MRP-1 activity in EOMA cells was inhibited in a dose-dependent manner, while MAE cells showed no loss of MRP-1 activity except at an excessive 100 μg/ml dose (Fig. 1B).The loss of MRP-1 activity in MAE cells at that dose may be due to NBE toxicity as shown by lactate dehydrogenase (LDH) assay. The loss of MRP-1 activity in EOMA cells may be attributable to NBE-mediated inhibition of MRP-1 transcription (Fig. 1C) and translation (Fig. 1D). Immunocytochemistry (ICC) was used to confirm decreased levels of MRP-1 expression in EOMA cells treated with NBE (Fig. 2A). The levels of MRP-1 detected by ICC were quantified by pixel densitometry and were significantly decreased in response to NBE treatment (Fig. 2A). Interestingly, we observed that NBE treatment significantly decreased nuclear localization of MRP-1 (Fig. 2B), with cytoplasmic staining for MRP-1 almost threefold higher than nuclear staining (Fig. 2C). FV10-ASW 3.0 software (Olympus) was used for post hoc image analysis of the MRP-1 ICC to identify colocalization of green MRP-1 and blue DAPI pixels with the overlapping colors shown as white pixels.
To test whether NBE caused nuclear accumulation of GSSG, EOMA cells were treated with either NBE or 1,3-bis (2-chloroethyl)-N-nitrosourea (BCNU), an inhibitor of glutathione reductase that blocks the reduction or recycling of GSSG to reduced glutathione (GSH). Treatment with BCNU was expected to increase cellular levels of GSSG and thus was used as a positive control. Whole cell lysates of EOMA cells treated with NBE or BCNU had significantly elevated levels of GSSG compared to vehicle controls (Fig. 3A). However, GSH levels in whole cell lysates were the same across all three treatment groups (Fig. 3B). The rise in GSSG in NBE- or BCNU-treated EOMA cells without a corresponding decrease in GSH indicated cellular GSSG accumulation. A significant increase in GSSG/GSH ratio for NBE- and BCNU-treated groups compared to vehicle controls (Fig. 3C) pointed toward a compromised GSH redox state within the cell. Such fate was followed by cell death in both NBE- and BCNU-treated groups (Fig. 3D).

Analysis of subcellular compartments revealed that cytosolic GSSG levels were essentially the same for all three treatment groups, while NBE- and BCNU-treated cells had significantly higher levels of nuclear GSSG compared to vehicle controls (Fig. 3E). There were no differences between the treatment groups for cytosolic or nuclear GSH levels (Fig. 3F), indicating nuclear GSSG accumulation. The ratio of GSSG/GSH is commonly used as an indicator of oxidative stress. Comparison of these ratios in EOMA cells indicates that the nucleus of all three groups was under significant oxidative stress compared to the cytosolic fractions. In addition, the oxidative stress in the nucleus was significantly worse in the NBE- and BCNU-treated groups compared to vehicle controls (Fig. 3G). The relative magnitude of oxidative stress for the nuclear compared to the cytosolic compartment was analyzed by comparing the GSSG/GSH ratios. The magnitude was quite impressive for all three groups and especially for the NBE treatment with nuclear ratios 12 times higher than cytosolic (Fig. 3H).
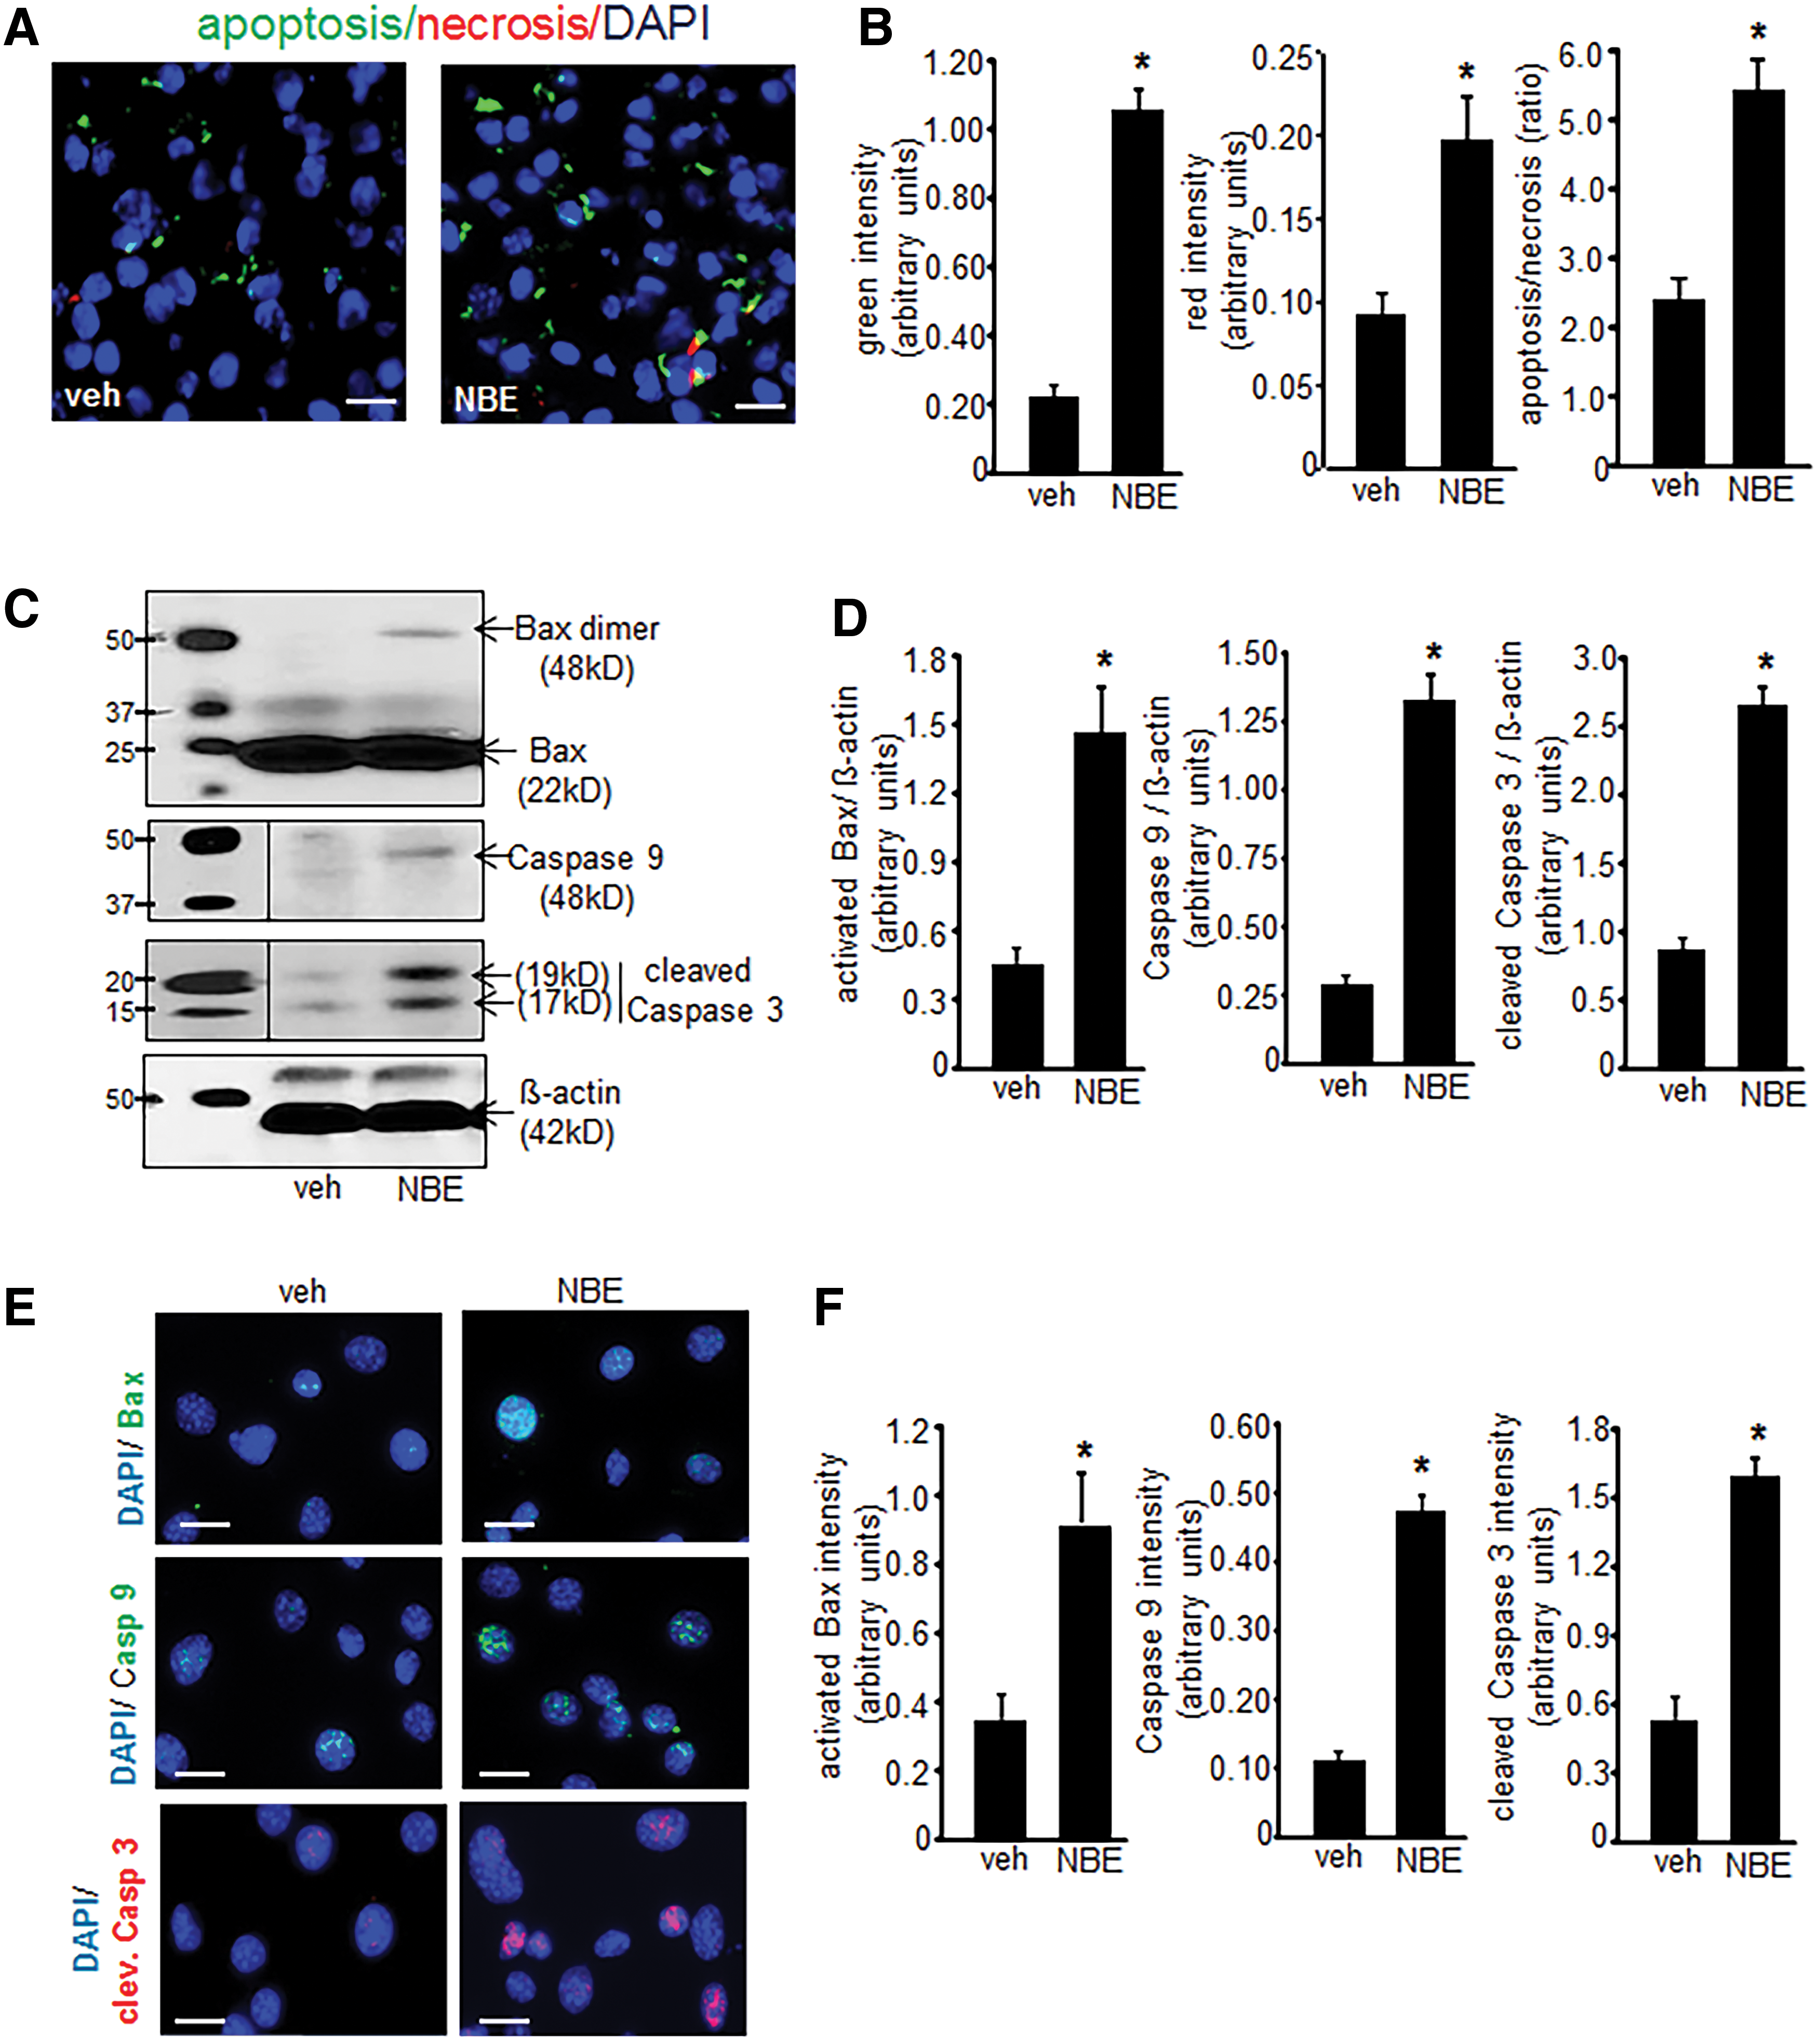
Elevated GSSG is known to induce apoptotic cell death (13, 49). Thus, experiments were performed to determine whether treatment with NBE induced EOMA cell apoptosis. These experiments were performed on cells after 10 days of NBE/vehicle treatment before loss of cell viability. A screening assay that compared apoptosis to necrosis showed that apoptosis was the predominant mechanism of cell death and that it was significantly elevated in NBE-treated cells compared to vehicle controls (Fig. 4A, B). Activation of the intrinsic pathway was hypothesized as the mechanism driving apoptosis. This was confirmed by Western blot detection of activated/dimeric Bax, caspase 9, and cleaved caspase 3 to indicate functional activation of the apoptotic pathway (Fig. 4C). All three of these apoptotic proteins were elevated in response to NBE treatment compared to controls (Fig. 4D). These findings were verified by ICC detection of the same 3 proteins (Fig. 4E) and all were significantly elevated compared to controls (Fig. 4F).
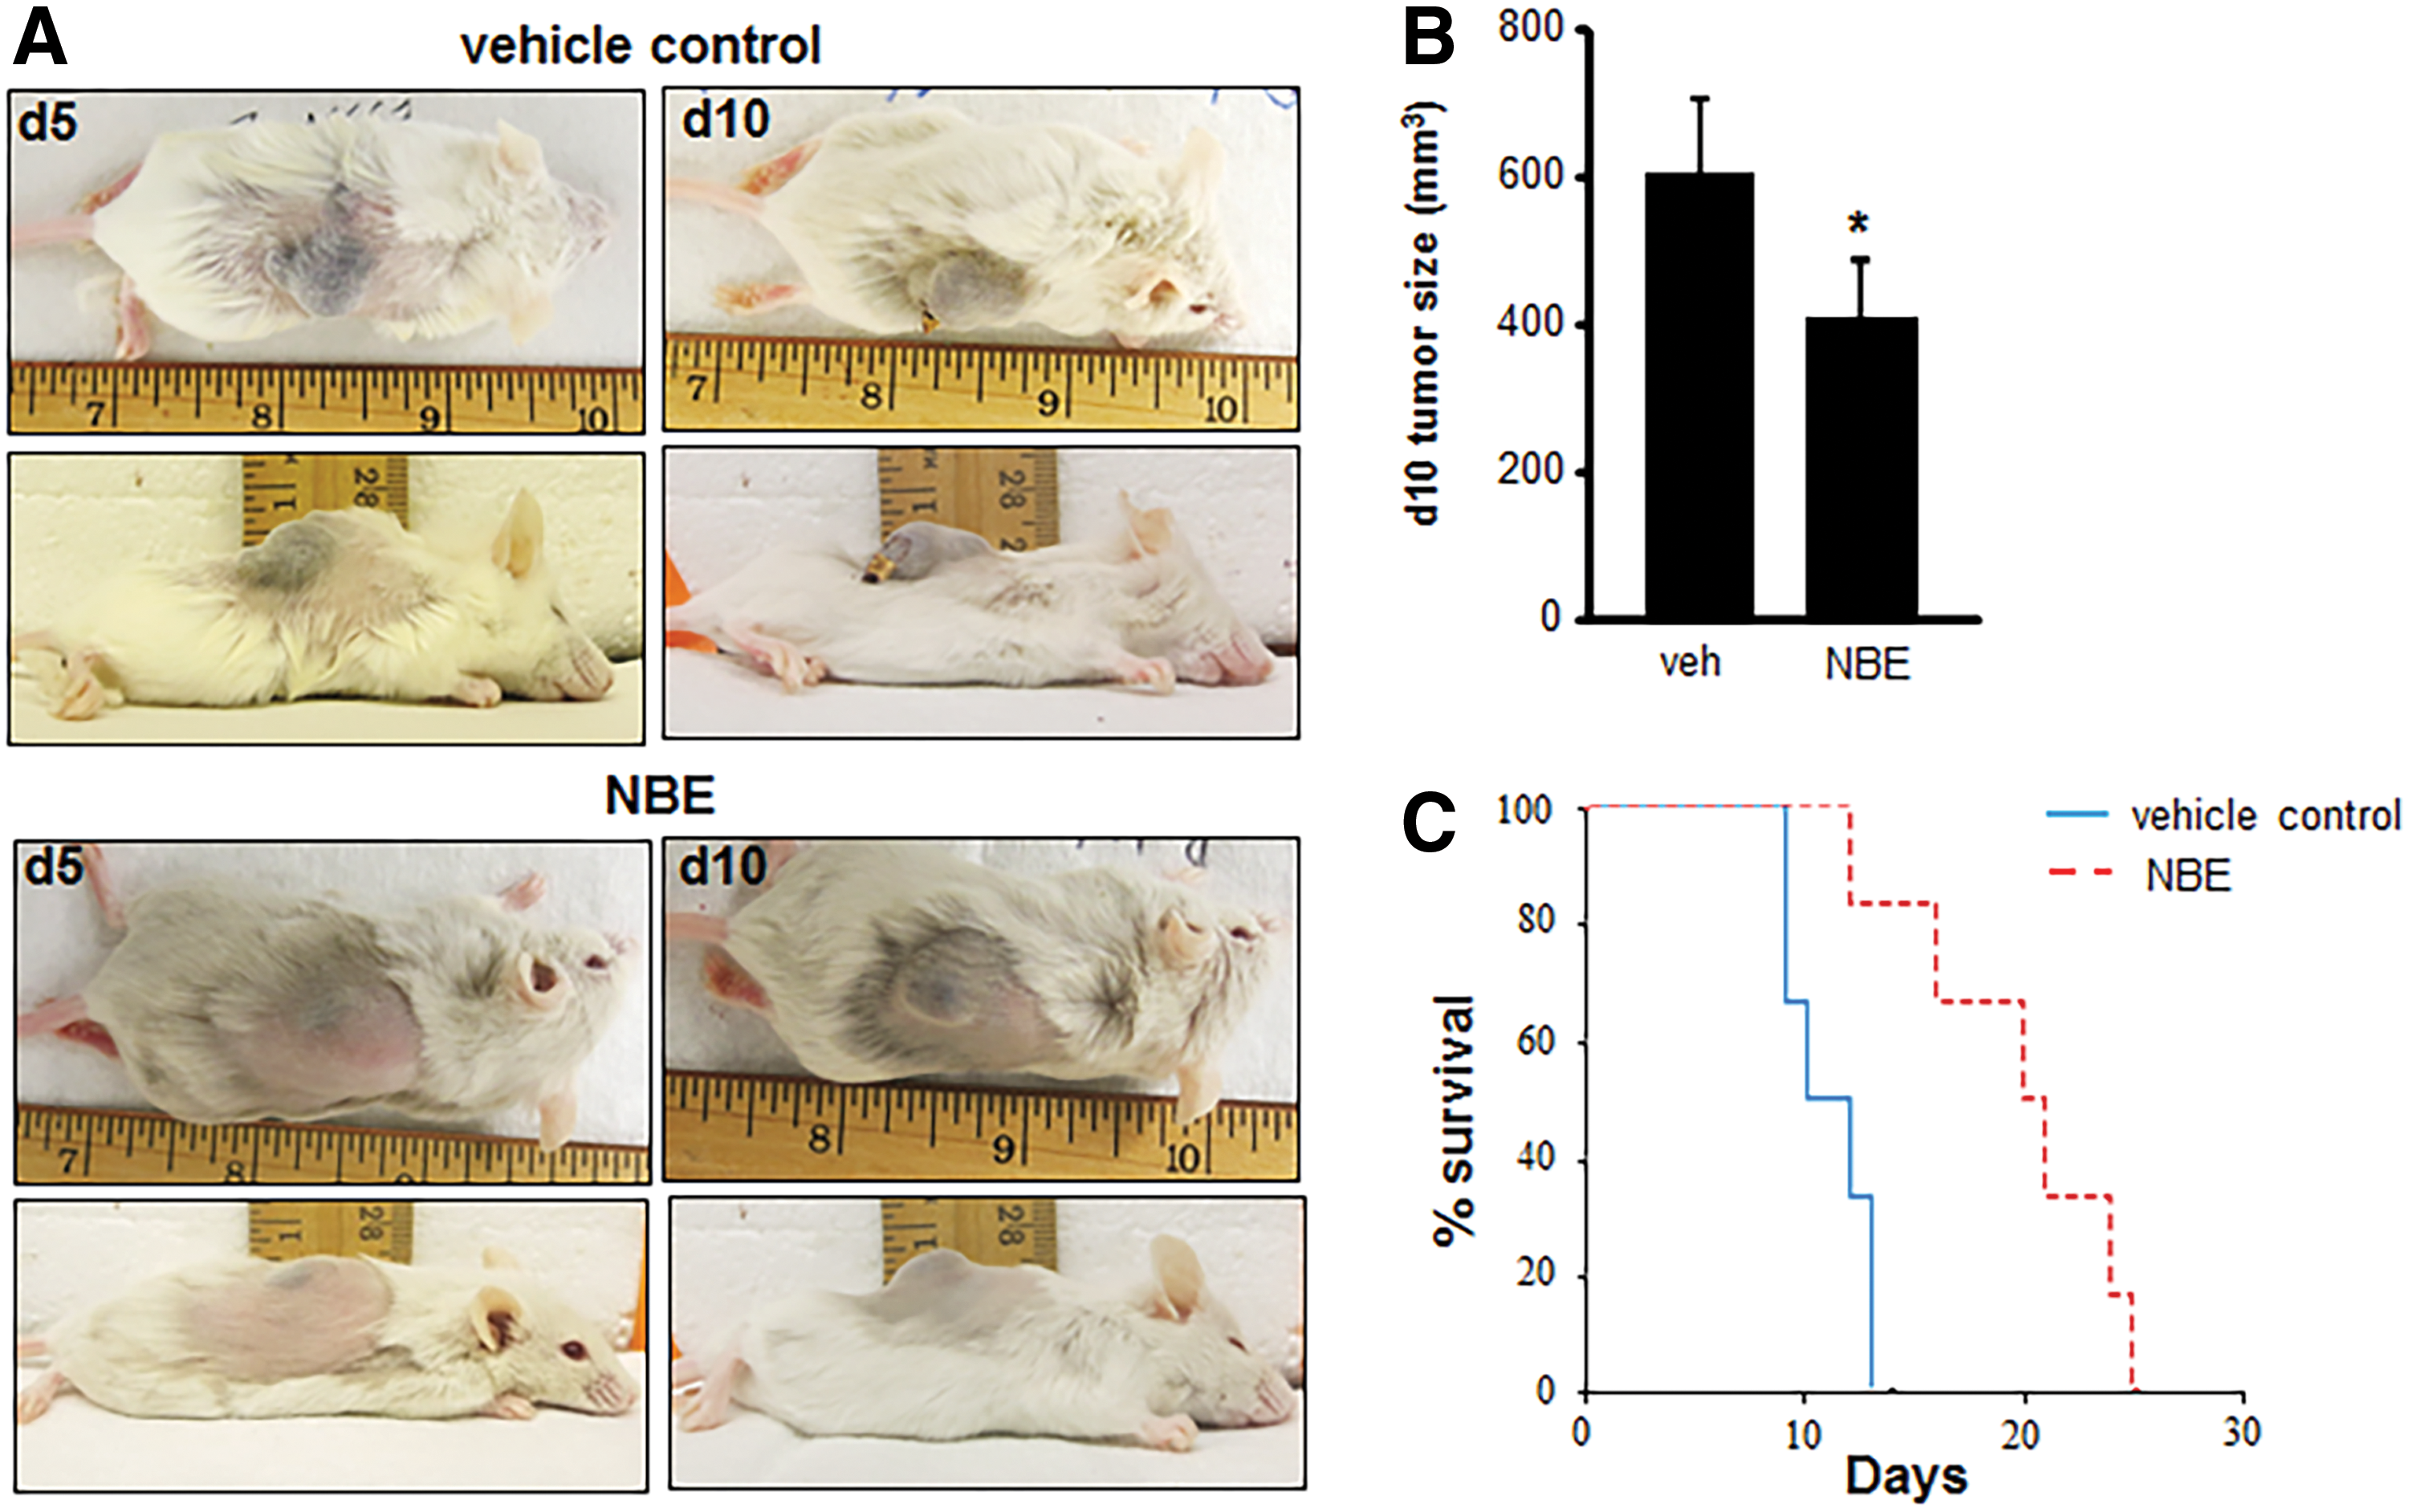
To test the clinical relevance of these findings, mice received a subcutaneous injection of EOMA cells treated with 12 days of NBE (n = 6) or vehicle control (n = 6) before injection and tumor growth and survival measured. No treatment interventions were done after EOMA cell injections. This experimental approach mimics the continuous drug exposure that would occur in a clinical setting and ensures drug delivery to tumor-forming EOMA cells to support proof of concept studies. Representative pictures of the tumors are shown in Figure 5A. At 10 days postinjection, tumors from NBE-treated EOMA cells were significantly smaller than those generated by vehicle-treated EOMA cells (Fig. 5B). Measurements were done at the 10-day time point to ensure an adequate number of mice in the vehicle control group as they start to die from the Kasabach–Merritt phenomenon (sequestration of red blood cells and platelets in the tumor) by day 7 (24). Kaplan–Meier survival curves showed a significant survival advantage in mice injected with NBE-treated EOMA cells (Fig. 5C).
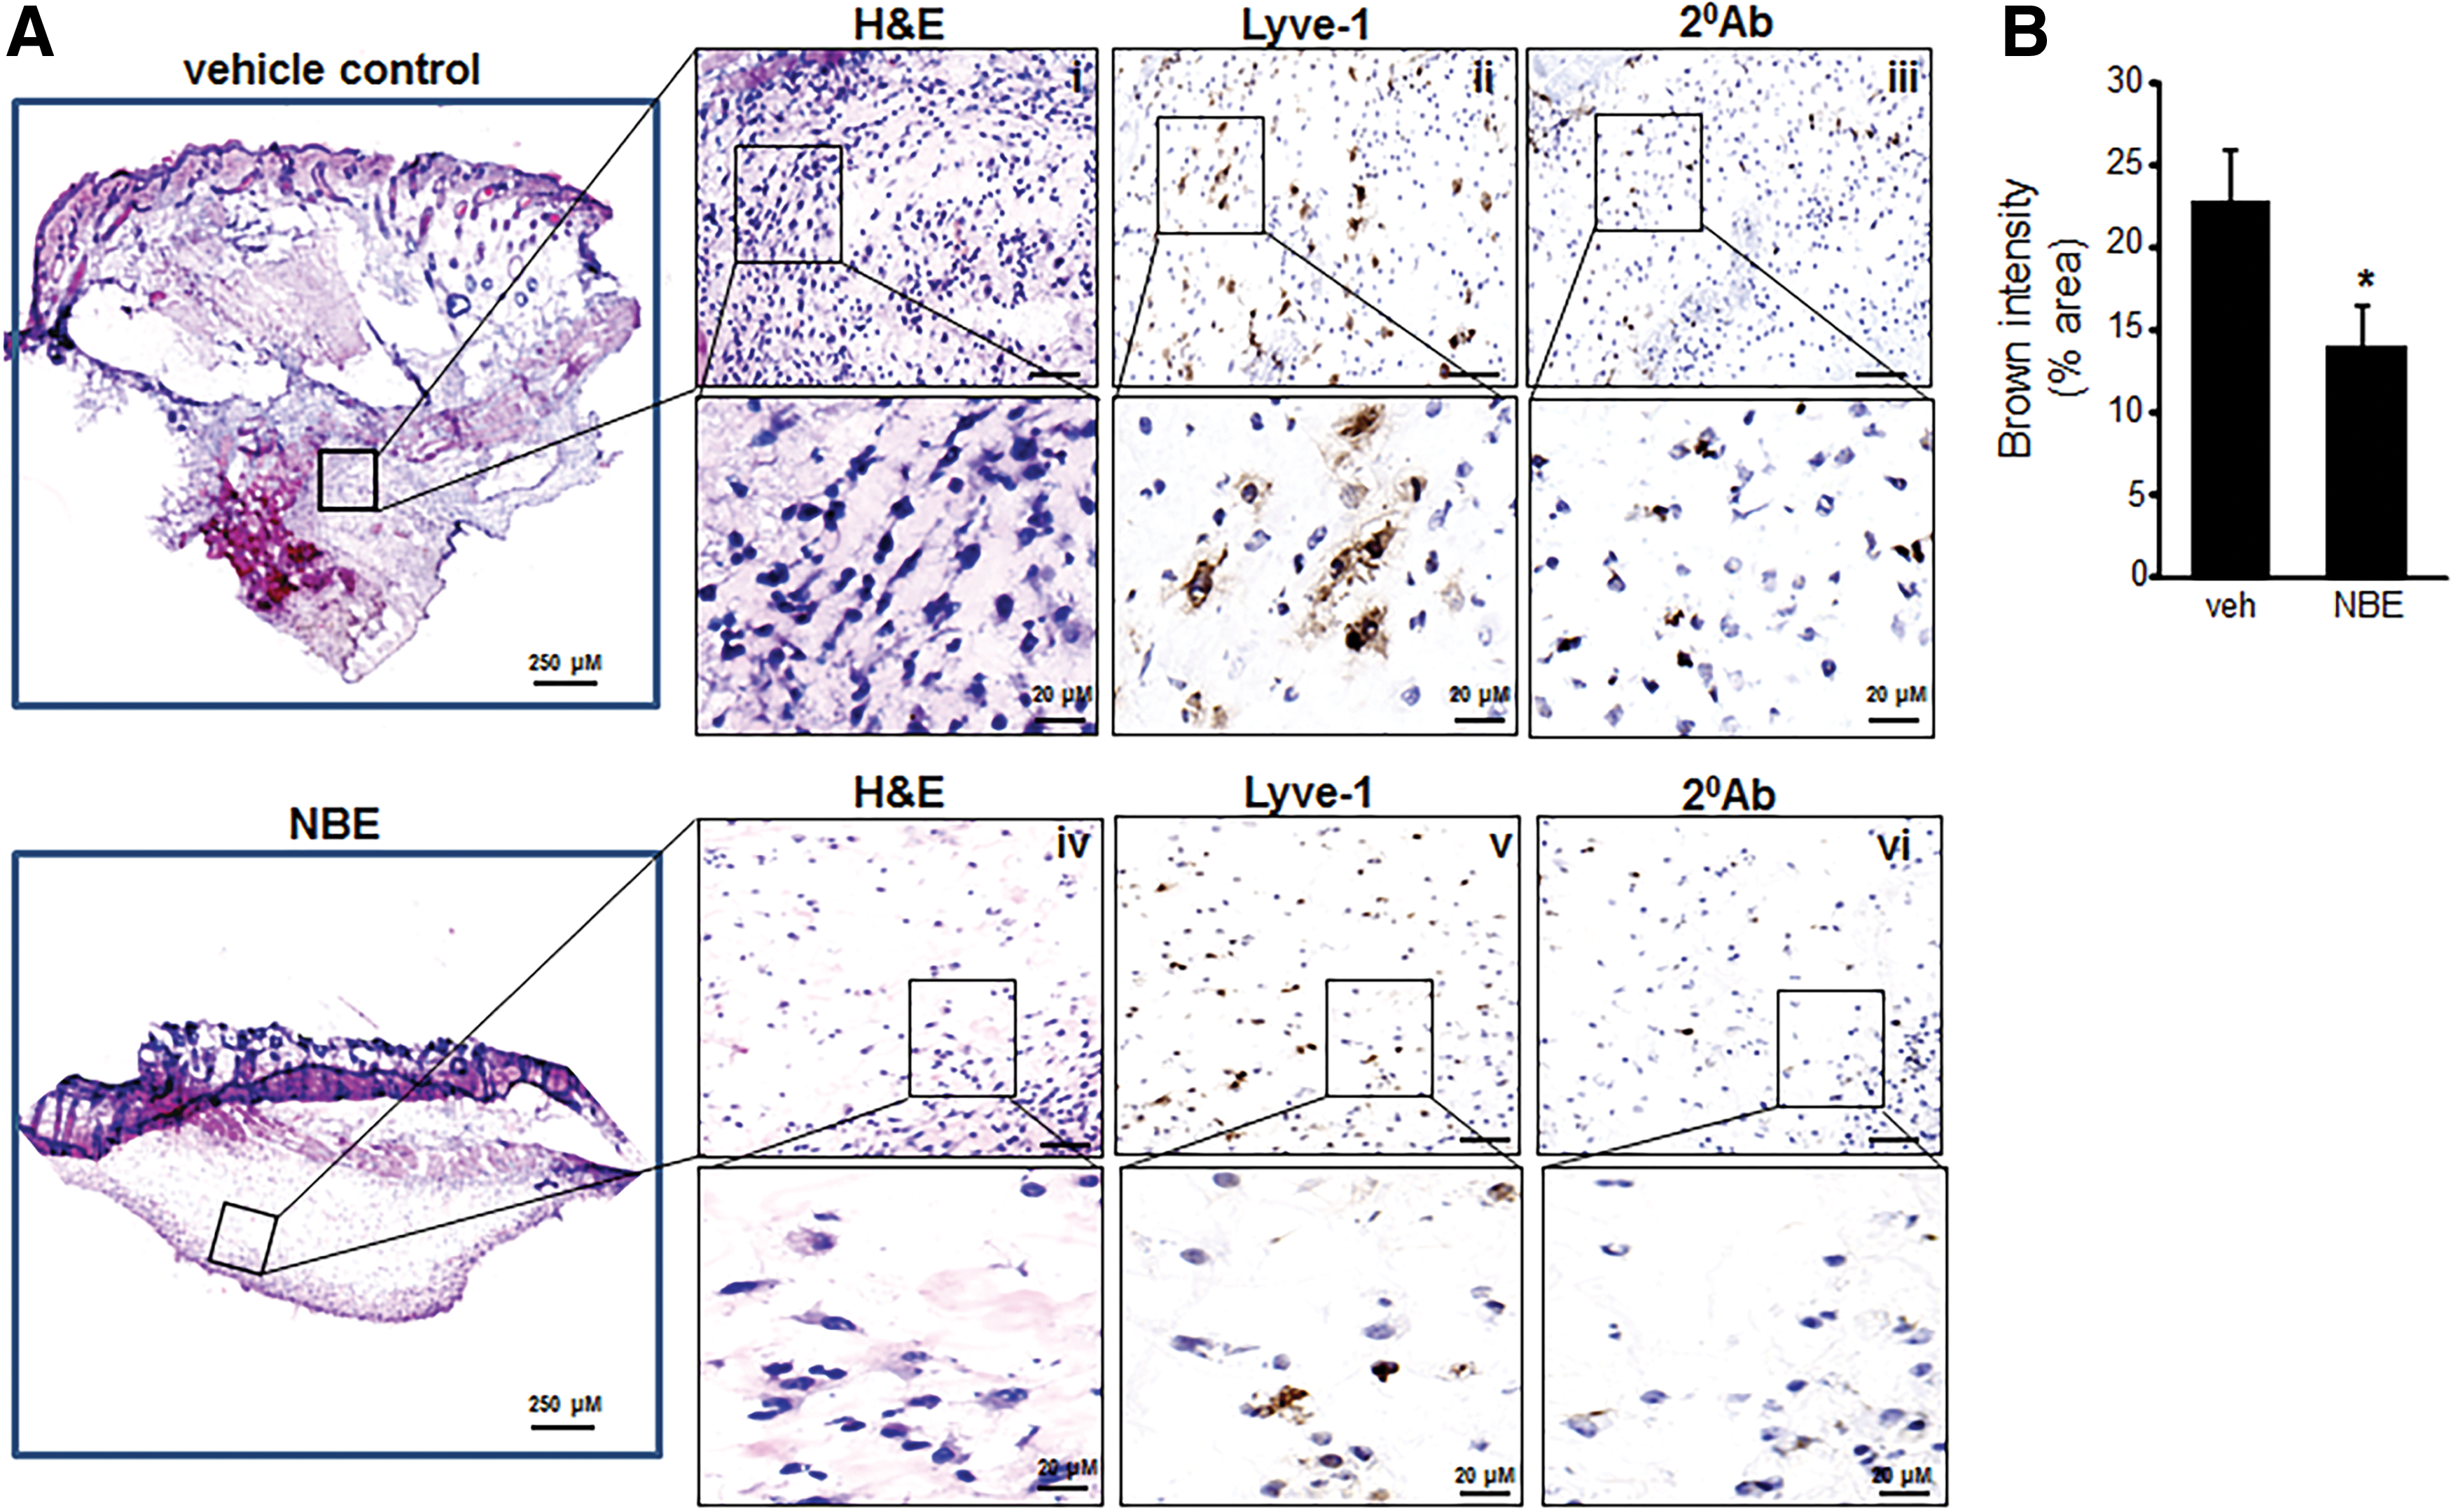
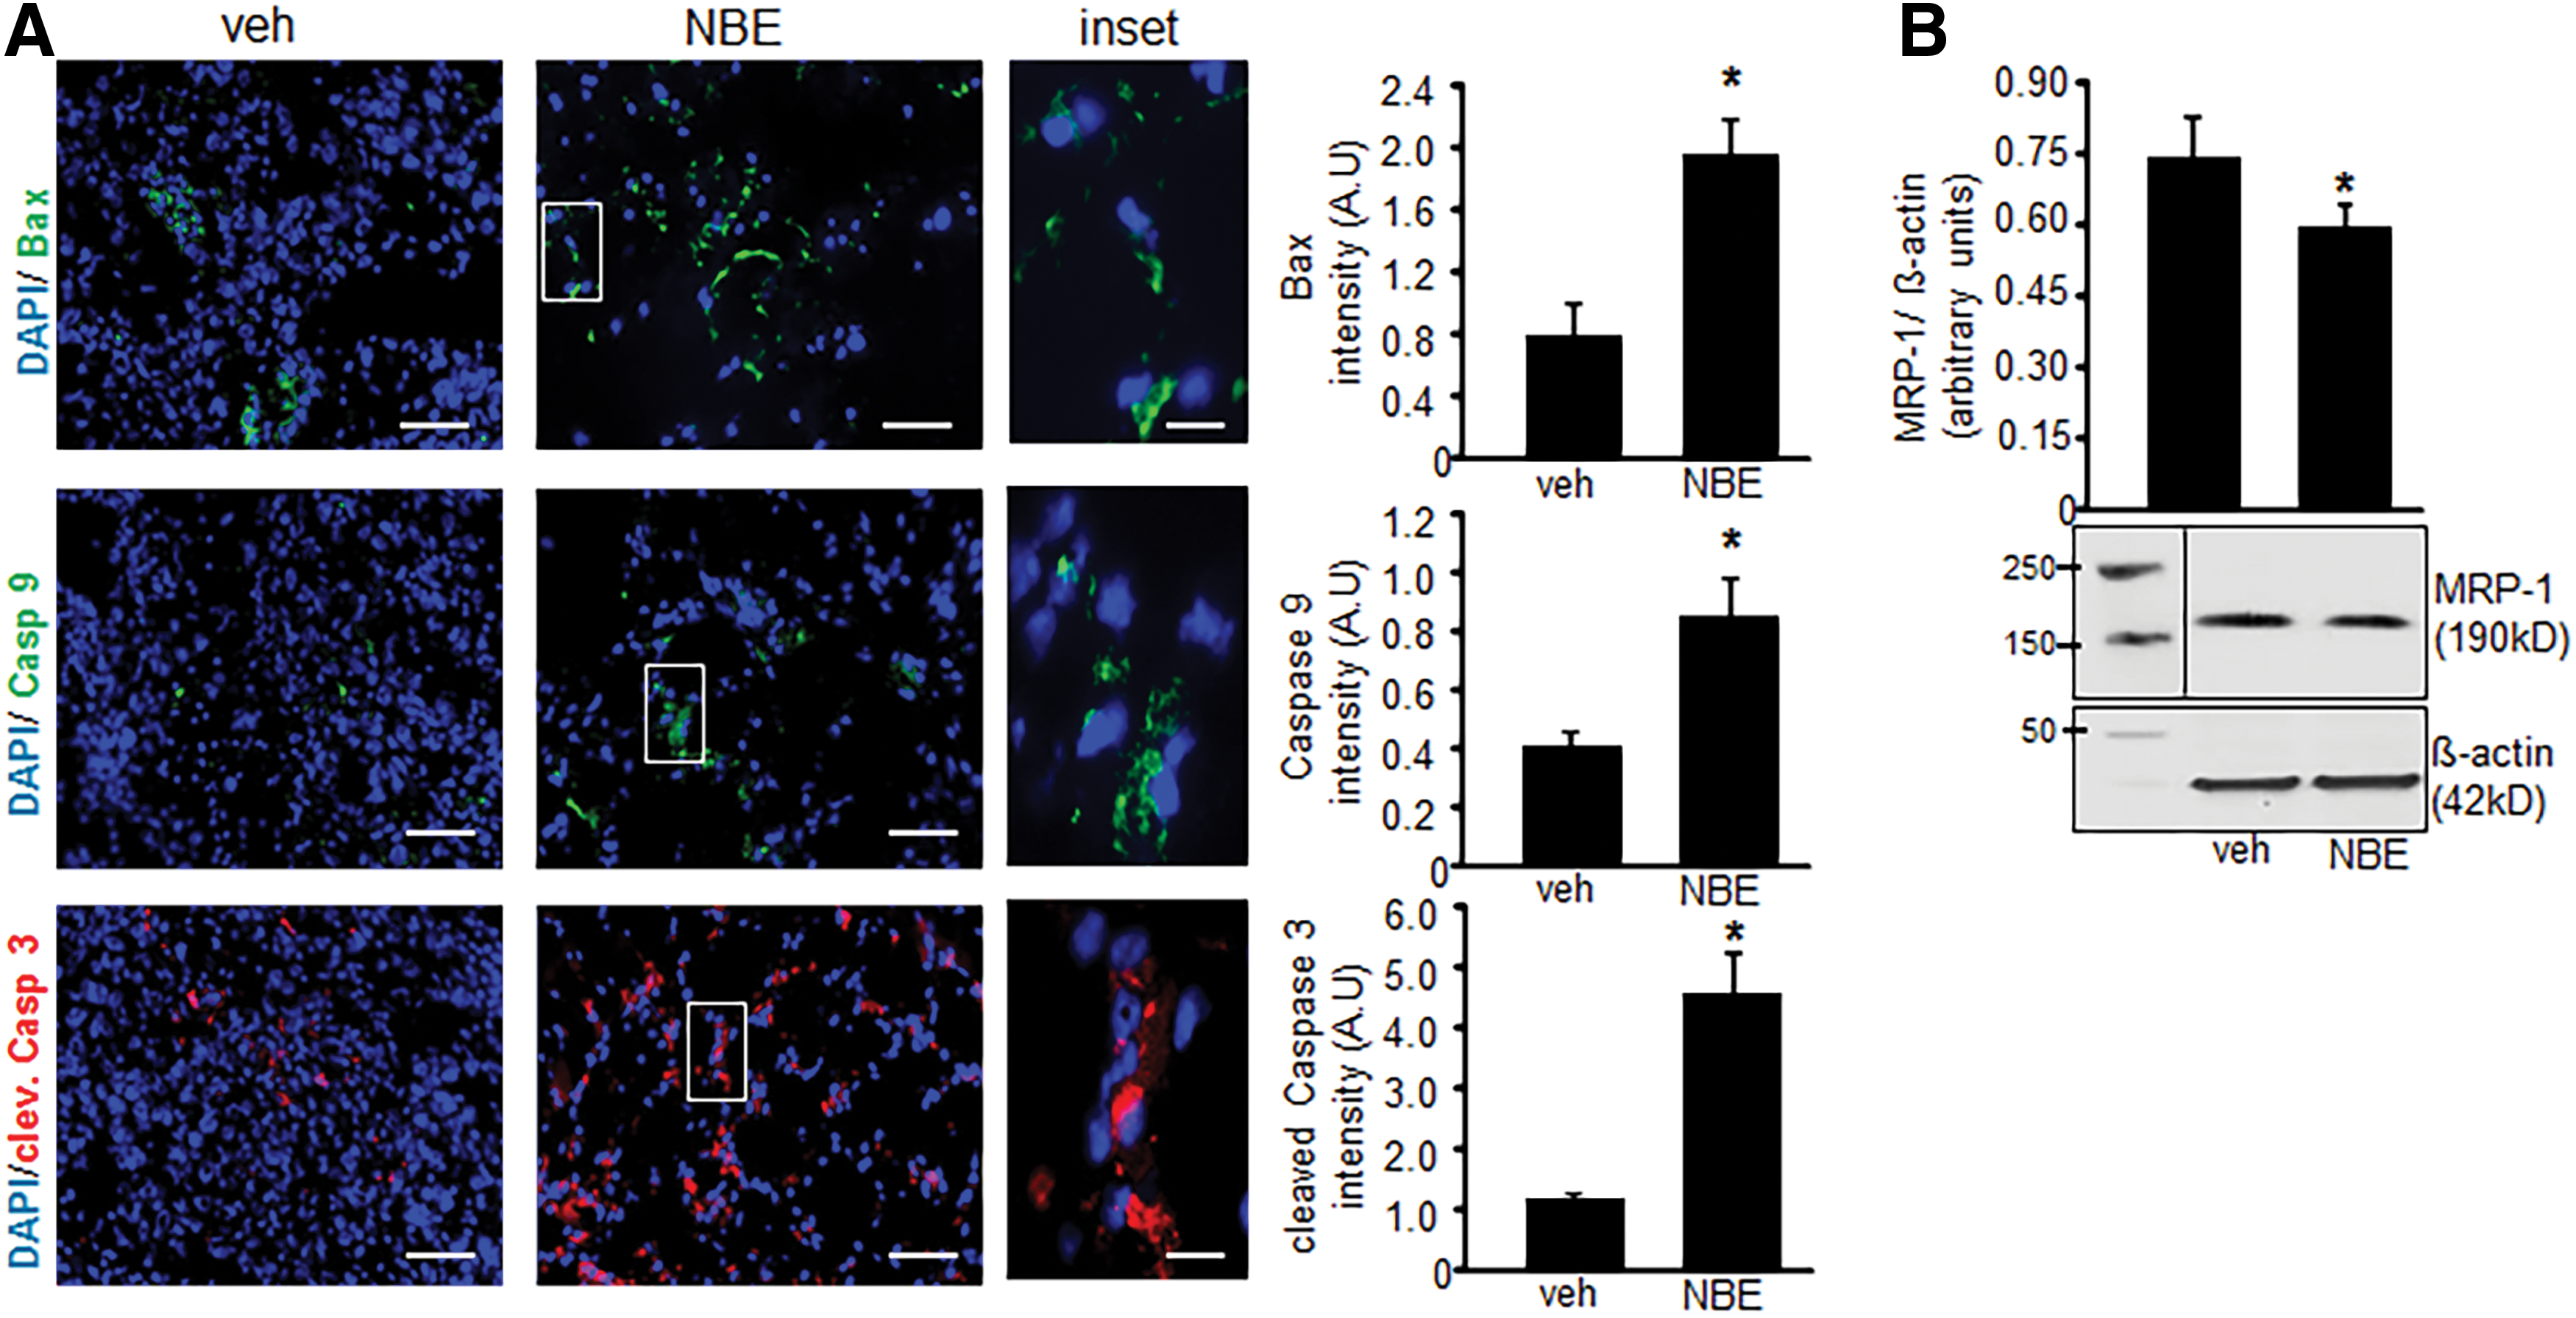
Tumor specimens collected at 10 days after EOMA cell injection were subject to microscopic analysis. Hematoxylin and eosin (H&E) staining done on representative whole tumor sections confirmed that tumors generated by NBE-treated cells were smaller in size. In addition, there was decreased cellularity in the NBE-treated tumors. Lymphatic vessel endothelial receptor 1 (Lyve) staining detects EOMA cells (9, 10, 32). Immunohistochemistry showed a decrease in the number of the tumor-forming Lyve+ EOMA cells within the tumor stroma (Fig. 6A). Quantitative analysis using pixel densitometry showed that the difference in EOMA cell numbers was statistically significant (Fig. 6B). Thus, smaller tumors in the NBE-treated group may be a result of decreased number of tumor-forming endothelial cells driving tumor growth. ICC was also performed on tumor sections obtained at 10 days post-EOMA cell injection to see if NBE treatment induced apoptosis in vivo. The same three proteins, activated/dimeric Bax, caspase 9, and cleaved caspase 3, were imaged to confirm in vitro results observed in Figure 4. All three protein markers of apoptosis were significantly elevated in NBE tumors compared to vehicle control tumors as quantified by pixel densitometry of ICC images (Fig. 7A). MRP-1 expression was also found to be reduced at day 10 tumor tissue in the NBE group compared to control (Fig 7B). The increase in tumor apoptosis along with reduced MRP-1 expression in mice receiving EOMA cells treated with NBE would explain the smaller tumors and prolonged survival in this group.
Discussion
MRP-1 is overexpressed in many different types of cancer, including breast (1), lung (11), prostate (56), and childhood neuroblastoma (42). The overexpression of MRP-1 has been shown to be a negative prognostic indicator for patients with childhood neuroblastoma and soft tissue sarcomas highlighting the clinical significance of this protein (23, 38, 47). The use of phytochemical compounds to inhibit MRP-1 has been previously described, but the vast majority of this work has been done in vitro (5, 35, 41). These are the first reported results demonstrating that NBE can inhibit MRP-1 in vitro and endothelial cell tumor growth in vivo.
This work identified a new mechanism through which MRP-1 inhibition may induce tumor cell death. MRP-1 is widely expressed in healthy human and mouse tissue (14, 37). Oxidative stress is a hallmark of malignant transformation that is not present in healthy cells (27, 36). The lethal effects of MRP-1 inhibition through the accumulation of GSSG means that cells with oxidative stress would be susceptible to these effects, but not healthy cells, that is, no off target effects. The significance of GSH as a substrate for conjugation by other molecules to facilitate MRP-1 efflux has been previously described (3, 26), but the concept of MRP-1 as a critical regulator of oxidative homeostasis is novel (49). These are the first reported results that a phytochemical product that inhibits MRP-1 can increase intracellular oxidative stress through the accumulation of GSSG.
The increase in MRP-1 activity as a defense mechanism to compensate for the pathologically induced oxidized conditions of the nucleus in untreated EOMA cells has recently been explored in detail (20). This work builds upon that prior effort by demonstrating the effects of NBE treatment on the pathologic adaptations that facilitate tumorigenesis. Untreated EOMA cells have significant depletion of GSH and a significant increase in glutathione reductase and thioredoxin reductase compared to nontumor-forming MAE cells. This elevated thiol reductase activity was necessary for EOMA cell survival as shown by loss of viability with BCNU and Auranofin treatment (20). The inherently low levels of GSH and elevated levels of thiol reductase necessary to achieve a minimum threshold level of GSH to maintain viability may explain why there was no change in GSH levels observed with NBE or BCNU treatment in this work. In that same work on untreated EOMA cells, we reported that nuclear translocation and function of MRP-1 in EOMA cells were dependent on the cooperative effects of the transcription factor Y box-1 (YB-1) and ape/ref-1 for MRP-1 nuclear localization and function (20). We have shown that Nox-4 induces expression of ape/ref-1 in EOMA cells and expression of Y box-1 is also known to be induced under conditions of genotoxic stress (4, 8). Thus, oxidative events in EOMA cells drive MRP-1 activity. The loss of MRP-1 nuclear localization and activity may be attributable to the antioxidant properties of the NBE inhibiting oxidant-inducible expression of ape/ref-1 and YB-1.
Elevated intracellular levels of GSSG are known to trigger apoptotic cell death (49). These are the first reported results to causally link a phytochemical treatment with MRP-1 inhibition and tumor apoptosis. A striking finding was that significantly elevated levels of all three apoptosis proteins were present in the hemangioendothelioma specimens 10 days after the last exposure to NBE. Presumably, the effects of NBE would be lost as EOMA cells multiplied during tumor development. This finding merits further investigation to uncover the mechanisms behind these persistent effects. Like others, we have reported that berry therapy can prevent tumor growth through inhibition of oxidant-sensitive transcription factors activator protein 1 (AP-1) and NF-κB that promote tumor growth (2, 16). The accumulation of GSSG and apoptotic cell death represents an additional new mechanism for phytochemicals to alter the oxidative status of the cancer cells to inhibit tumor growth. We have reported that EOMA cells survive at GSSG/GSH ratios that are generally not compatible with survival because of the compensatory effects of MRP-1-mediated GSSG efflux (20). It may be that the inhibitory effects of NBE on MRP-1 are enough to overwhelm the compensatory effects that permit EOMA cell survival. The lack of safe pharmacologic therapies to treat the most common type of endothelial cell tumors (39, 46) makes this work critically important, where NBE is recognized as a safe and effective potential therapeutic option for the management of endothelial cell tumors in children. Future studies are needed to show that mice receiving NBE supplementation develop smaller hemangioendothelioma compared to control mice.
Materials
The following materials were obtained from the source indicated: dimethyl sulfoxide, GSSG, and GSH (Sigma). For cell culture, Dulbecco's modified Eagle's medium (DMEM), fetal calf serum (FCS), penicillin, and streptomycin were purchased from Invitrogen. Culture dishes were obtained from Nunc. EOMA cells (ATCC) and MAE cells were a gift from Charles G. Orosz (the Ohio State University).
Methods
Cell culture
EOMA and MAE cells were maintained under the same conditions as previously described (18). In brief, cells were maintained in DMEM supplemented with 10% FCS and 1% penicillin/streptomycin (complete media), and incubated at 37°C and 5% CO2. Continuous treatment of different doses of NBE (25, 50, 100 μg/ml) and vehicle control (1% dimethyl sulfoxide) was carried out in cell culture media up to six passages. NBE is a proprietary mix of powdered berry extracts (PediaBerry™; NutrimiR). Cells were split/passed every other day and all the experiments were done using cells treated with NBE or vehicle control for 12 days, unless specified. BCNU, an inhibitor of GSSG reductase, was treated (10 μM) for 24 h in both vehicle control and NBE-exposed EOMA cells as previously described (20).
In vivo studies
All animal protocols were approved by the Institutional Animal Care and Use Committee (IACUC) of the Ohio State University, Columbus, Ohio. Mice were maintained under standard conditions at 22°C ± 2°C with 12:12 dark:light cycles with access to food and water ad libitum. 129P/3 mice (6–8 weeks, female; Jackson Laboratories) were subcutaneously injected with vehicle- and NBE-treated EOMA cells, as previously described (18). Trypan blue exclusion staining is done to ensure that each aliquot of cells for injection contains the same number of live cells. Tumor volume was determined by using calipers to measure length × width × height of each tumor, and the mass was determined by draining the blood from the tumor and weighing the residual solid tumor mass dissected free from any surrounding soft tissue as previously described (17, 18, 21).
Preparation of nuclear and cytosolic extracts
EOMA cells were seeded in 12-well plates at 1 × 10⁵ cells/well. Nuclear and cytosolic extracts were isolated using a Nuclear Extraction Kit (Trans AM kit; Active Motif Corp.) as per the manufacturer's instructions. Protein concentrations were measured by the bicinchoninic acid (BCA) protein assay reagent (Pierce Biotechnology), and the extracts were stored at −80°C until analyzed. The purity of the nuclear and cytoplasmic fractions was confirmed as previously described (4, 20).
GSH and GSSG assay
GSH and GSSG were measured in NBE/vehicle cell lysates using a commercially available GSH/GSSG detection kit (Abcam; ab138881). In brief, cells were seeded in 12-well plates at 1 × 10⁵ cells/well. Cells were harvested combining three wells for each sample. For preparing whole cell lysate, cells were washed with cold phosphate-buffered saline (PBS), scrapped, and centrifuged (500 g) for 5 min at 4°C. Pellets were then treated with 5% wt/v m-phosphoric acid (final concentration) and immediately snap-frozen and stored in liquid nitrogen (6, 20). Samples were quickly thawed on ice and centrifuged (12,000 g, 5 min) at 4°C for protein precipitation and for use in the GSSG/GSH kit. Supernatants were collected and filtered through a 0.2-μm filter. The filtrate was pH adjusted to 4–6 by using NaHCO3 drop by drop. GSH and GSSG standard curve, along with samples, was run according to the kit protocol (40). Nuclear and cytosolic protein pellets were processed for GSSG/GSH measurement similar to the whole cell lysates.
Determination of cell viability
The viability of cells in culture was assessed by measuring leakage of LDH from cells into media using an In Vitro Toxicology Assay Kit from Sigma-Aldrich. LDH toxicity testing was performed to identify the appropriate experimental NBE dose for EOMA cells. Nontumor-forming MAE cells were included as treatment controls. LDH data were performed every other day on cells cultured in NBE or vehicle control (data not shown). This protocol has been described in detail in our previous reports (29, 49). Cell viability was also determined by incubating cells with propidium iodide (2.5 mM) in phosphate-buffered saline for 15 min at 37°C and with 5% CO2. Fluorescence intensity was determined by FACS in FL2 region using an Accuri C6 flow cytometer (Accuri) at 530-nm excitation with a sample size of 10,000 cells (4, 51).
MRP-1 activity assay
Calcein clearance assay was used to measure MRP-1 activity. Calcein-AM (25 nM) (Thermo Fisher Scientific) was loaded to the cells for 15 min at 37°C. Cells were washed with PBS, collected, and analyzed using the Accuri C6TM (Accuri cytometers) flow cytometer. MRP-1 activity was measured on the basis of intracellular calcein retention (20, 50).
Western blot
Immunoblotting was performed using different cell lysates and the protein concentration determined using a BCA protein assay. Samples (15–20 μg of protein/lane) were separated using 4–12% sodium dodecyl sulfate–polyacrylamide gel electrophoresis and probed with the mouse monoclonal anti-MRP-1 antibody (1:750 dilution, Cat. No. ab24102, Lot No. GR203008-5; Abcam) (20, 52), rabbit polyclonal anti-caspase 9 antibody (1:750 dilution, Cat. No. ab63488, Lot No. NA; Abcam) (54), rabbit polyclonal anti-Bax antibody (1:1000 dilution, Cat no. ab 7977, Lot no. GR219328-2; Abcam) (53, 54), rabbit anti-cleaved caspase 3 (Asp175) antibody (1:10,000 dilution, Cat. No. 9661S, Lot. No. 73; Cell signaling), and anti-mouse β-actin (1:10,000 dilution, Cat No. A5441, Lot. No. 055K4854; Sigma) (45, 55). Bands were visualized by using horseradish peroxidase-conjugated donkey anti-rabbit-IgG (1:2000, Cat. No. NA934 V, Lot No. 9583369; Amersham Biosciences) and anti-mouse-IgG (1:2000, Cat. No. NA931 V, Lot No. 6652622; Amersham Biosciences) (4, 19, 20) and the enhanced chemiluminescence assay (Amersham Biosciences) according to the manufacturer's instructions. Pixel densitometry for individual bands was done using ImageJ software.
Analysis of gene expression
The cells were seeded in a 12-well plate at a density of 1 × 10⁵ cells/well. For detection of mRNA, total RNA from cells was extracted using the mirVana miRNA Isolation Kit according to the manufacturer's protocol (Ambion, Life Technologies). For mRNA expression studies, cDNA synthesis was achieved by a SuperScript™ III first-strand synthesis system (Applied Biosystems, Life Technologies). The abundance of mRNA for genes of interest was quantified by using real-time polymerase chain reaction. The following primer sets (Invitrogen) were used:
m_MRP1_F, 5′-GGT CCT GTT TCC CCC TCT ACT TCT T-3′ and
m_MRP1_R, 5′-GCA GTG TTG GGC TGA CCA GTA A-3′;
m_GAPDH_F, 5′-ATG ACC ACA GTC CAT GCC ATC ACT-3′ and
m_GAPDH_R, 5′-TGT TGA AGT CGC AGG AGA CAA CCT-3′;
Immunohistochemistry and ICC
Immunohistochemistry was performed on cryosections from mouse tumor samples using specific antibody as described previously (20, 21). In brief, tissue specimens were snap-frozen in optimum cutting temperature compound (Miles). Frozen tissues were sectioned at 10–12 μm thickness, fixed for 5 min in acetone at 4°C, and staining was carried out using H&E (15) and also using DAB peroxidase (HRP) substrate kit (4), 3,3′-diaminobenzidine (Vector Laboratories). The anti-rabbit Lyve-1 monoclonal antibody (Epitomics) was used at 1:100 dilution. Negative control sections were stained using the biotinylated goat anti-rabbit secondary antibody to test primary antibody specificity. Tissue sections were counterstained with hematoxylin. Images were obtained under 20 × magnification and intensity (Lyve-1, brown) quantitation was performed using the auto measure tool in Axiovision 4.6 software, (Axiovert 200M; Zeiss). For immunofluorescence detection, sections are incubated with a primary antibody overnight in a moist chamber with following dilutions indicated in parentheses: anti-caspase 9 (1:100), anti-caspase 3 (1:200), and BAX antibody (1:200). Next day, sections were washed and incubated with the Alexa- fluor 488 goat anti-rabbit antibody (1:200 dilution; Invitrogen) and Alexa- fluor 568 goat anti-rabbit antibody (1:200 dilution; Invitrogen) for 1 h at room temperature. After incubation, the cells were mounted in Gelmount containing DAPI (aqueous mount; Vector Laboratories). Images were obtained under 10 × magnification and color intensity quantitation was performed using the auto measure tool in AxioVision 4.6 software (Axiovert 200M; Zeiss). For ICC, cells (0.1 × 10⁶ cells/well) were seeded on a coverslip placed in 12-well plates for 48 h. Cells were washed with PBS × 3, then fixed, permeabilized, and blocked for nonspecific signal. Next, cells were stained with the same antibody dilution as mentioned earlier. The cells were then washed and incubated with the same secondary antibody used for tissue section for 1 h at room temperature. After incubation, the cells were mounted in Gelmount containing DAPI (aqueous mount; Vector Laboratories). The images were captured by confocal microscopy and fluorescent intensity, and a colocalization study was quantified using FV10-ASW 3.0 software (Olympus).
Apoptosis/necrosis staining assay
Cellular apoptosis/necrosis was detected from NBE/vehicle treatment using an Apoptosis/Necrosis Detection Kit (Abcam; ab176749). In brief, cells cultured for 10 days in NBE/vehicle were seeded (0.1 × 10⁶ cells/well) on a coverslip placed in 12-well plates for 48 h. Cells were then stained with Apopxin Green Solution to detect phosphatidylserine as an indicator of apoptosis, 7-AAD a membrane impermeable dye to detect necrosis, and CytoCalcein Violet 450 to detect cell viability and incubated for 1 h at room temperature as per the kit protocol (7). After washing, images were obtained under 10 × magnification and color intensity quantitation was performed using the auto measure tool in Axiovision 4.6 software, (Axiovert 200M; Zeiss).
Statistical methods
All experiments were conducted at least three times in duplicate unless otherwise specified in the figure legend. Two-sided two-sample t-test was used to compare the difference between two groups. The survival functions for mice that received treatments were generated by the Kaplan–Meier method, and compared between two groups using the log-rank test. All bar graphs represent the mean with error bars indicating one standard deviation. A p-value of <0.05 was considered statistically significant.
Footnotes
Acknowledgments
This project was supported by Award Number Grant UL1TR001070 (to G.M.G.) from the National Center for Advancing Translational Sciences, R01 GM095657 (to G.M.G.) and partly supported by GM108014 (to C.K.S.) from the National Institutes of General Medical Sciences. PediaBerry was supplied as a gift from Dr. Cameron Rink on behalf of NutrimiR, Inc.
Author Disclosure Statement
Chandan K. Sen is a shareholder in NutrimiR LLC, which supplied the NBE product. For all other authors, no competing financial interests exist.