
Abstract
Aims:
Stem cells exposed to pathological levels of reactive oxygen species (ROS) at wound sites fail to regenerate tissue. The molecular mechanism underlying differential levels of ROS-mediated regulation of stem cells remains elusive. This study elucidates the mechanistic role of catalase at 10 μM H2O2-induced proliferation of mouse bone marrow stromal (BMSC) and hematopoietic (HSPC) stem/progenitor cells.
Results:
BMSCs and HSPCs depicted an increased growth rate and colony formation, in the presence of 10 μM but not 100 μM concentration of H2O2, an effect that was perturbed by Vit. C. Mechanistically, JNK activation–FOXO3a nuclear translocation and binding of FOXO3a to catalase promoter at 10 μM H2O2 led to an increased expression and activity of anti-oxidant gene, catalase. This was followed by an increased proliferative phenotype via the AKT-dependent pathway that was perturbed in the presence of catalase-inhibitor, 3-aminotriazole due to an increased ROS-mediated inactivation of AKT. Preclinically, 10 μM H2O2-mediated preconditioning of BMSCs/HSPCs transplantation accelerated wound closure, enhanced catalase expression, and decreased ROS levels at the wound site. Transplantation of male donor cells into female recipient mice or GFP-labeled BMSCs or HSPCs depicted an increased engraftment and proliferation in preconditioned cell transplanted groups as compared with the wound control. Wound healing occurred via keratinocyte generation and vascularization in preconditioned BMSCs, whereas only neo-vascularization occurred in the preconditioned HSPCs transplanted groups.
Innovation and Conclusion:
Our study suggests a distinct role of catalase that protects BMSCs and HSPCs from low ROS and promotes proliferation. Transplantation of preconditioned stem cells enhanced wound tissue regeneration with a better antioxidant defense mechanism—as a therapeutic approach in stem cell transplantation-mediated tissue regeneration. Antioxid. Redox Signal. 28, 1047–1065.
Introduction
O
Bone marrow-derived bone marrow stromal stem/progenitor cells (BMSCs) and hematopoietic stem and progenitor cells (HSPCs), when exposed to 10 μM concentration of H2O2, regulate the survival signaling mechanisms, thereby increasing proliferation, an effect that was perturbed by exogenous antioxidants. Mechanistically, an activation of JNK-FOXO3a signaling led to an increased expression and activity of catalase that, in turn, regulated the AKT activation-mediated proliferative phenotype of these cells. Transplantation of preconditioned BMSCs/HSPCs with 10 μM concentration of H2O2 efficiently regenerated wound tissue via enhanced engraftment, proliferation, re-epithelization, and angiogenesis. This study offers a therapeutic approach for improved wound healing by preconditioning the stem cells, which equips them with a better antioxidant defense system.
Usually, cells generate H2O2 by the mitochondrial respiratory chain and NADPH oxidase, which is regulated by the glutathione system. Adult stem cells of bone marrow such as bone marrow stromal stem/progenitor cells (BMSCs) and hematopoietic stem/progenitor cells (HSPCs) are often exposed to different physiological levels of ROS such as H2O2. The low concentration of H2O2 in adult stem cells promotes their stemness and self-renewal capability (31). In contrast to HSPCs, myeloid committed progenitor cells are known to have a higher level of H2O2 (31). Thus, cellular response to H2O2 differs from cell to cell. However, the molecular mechanisms of cellular defense system against H2O2 in these adult stem cells are not yet clearly defined.
In our recent study, we extensively characterized bone marrow-derived BMSCs and HSPCs by using colony-forming efficiency (CFU) assays, differentiation assays, and expression of pluripotency and stem cell genes and proteins that were comparable with embryonic stem cell lines as well as with bonafide MSCs (8). In this study, we investigated the role of low oxidative stress in modulation of the antioxidant defense system in BMSCs and HSPCs. Our results depicted that low (10 μM) but not high (100 μM) concentrations of H2O2-induced oxidative stress significantly increased proliferation in BMSCs and HSPCs. Equimolar concentration of Vit. C and its metabolized product, dehydroascorbate (DHA) could revert the molecular and cellular changes caused by 10 μM H2O2. Further mechanistically, an activation of the JNK-FOXO3a signaling pathway along with antioxidant–catalase expression and activity was observed in these cells when exposed to 10 μM H2O2. Finally, GFP-expressing BMSCs or HSPCs preconditioned with 10 μM H2O2 when transplanted at the wound site in vivo resulted in improved engraftment, increased proliferation and catalase expression with a concomitant reduction in ROS along with enhanced keratinocyte formation and vascularization-mediated tissue regeneration.
Results
Low oxidative stress promotes proliferation of BMSCs and HSPCs
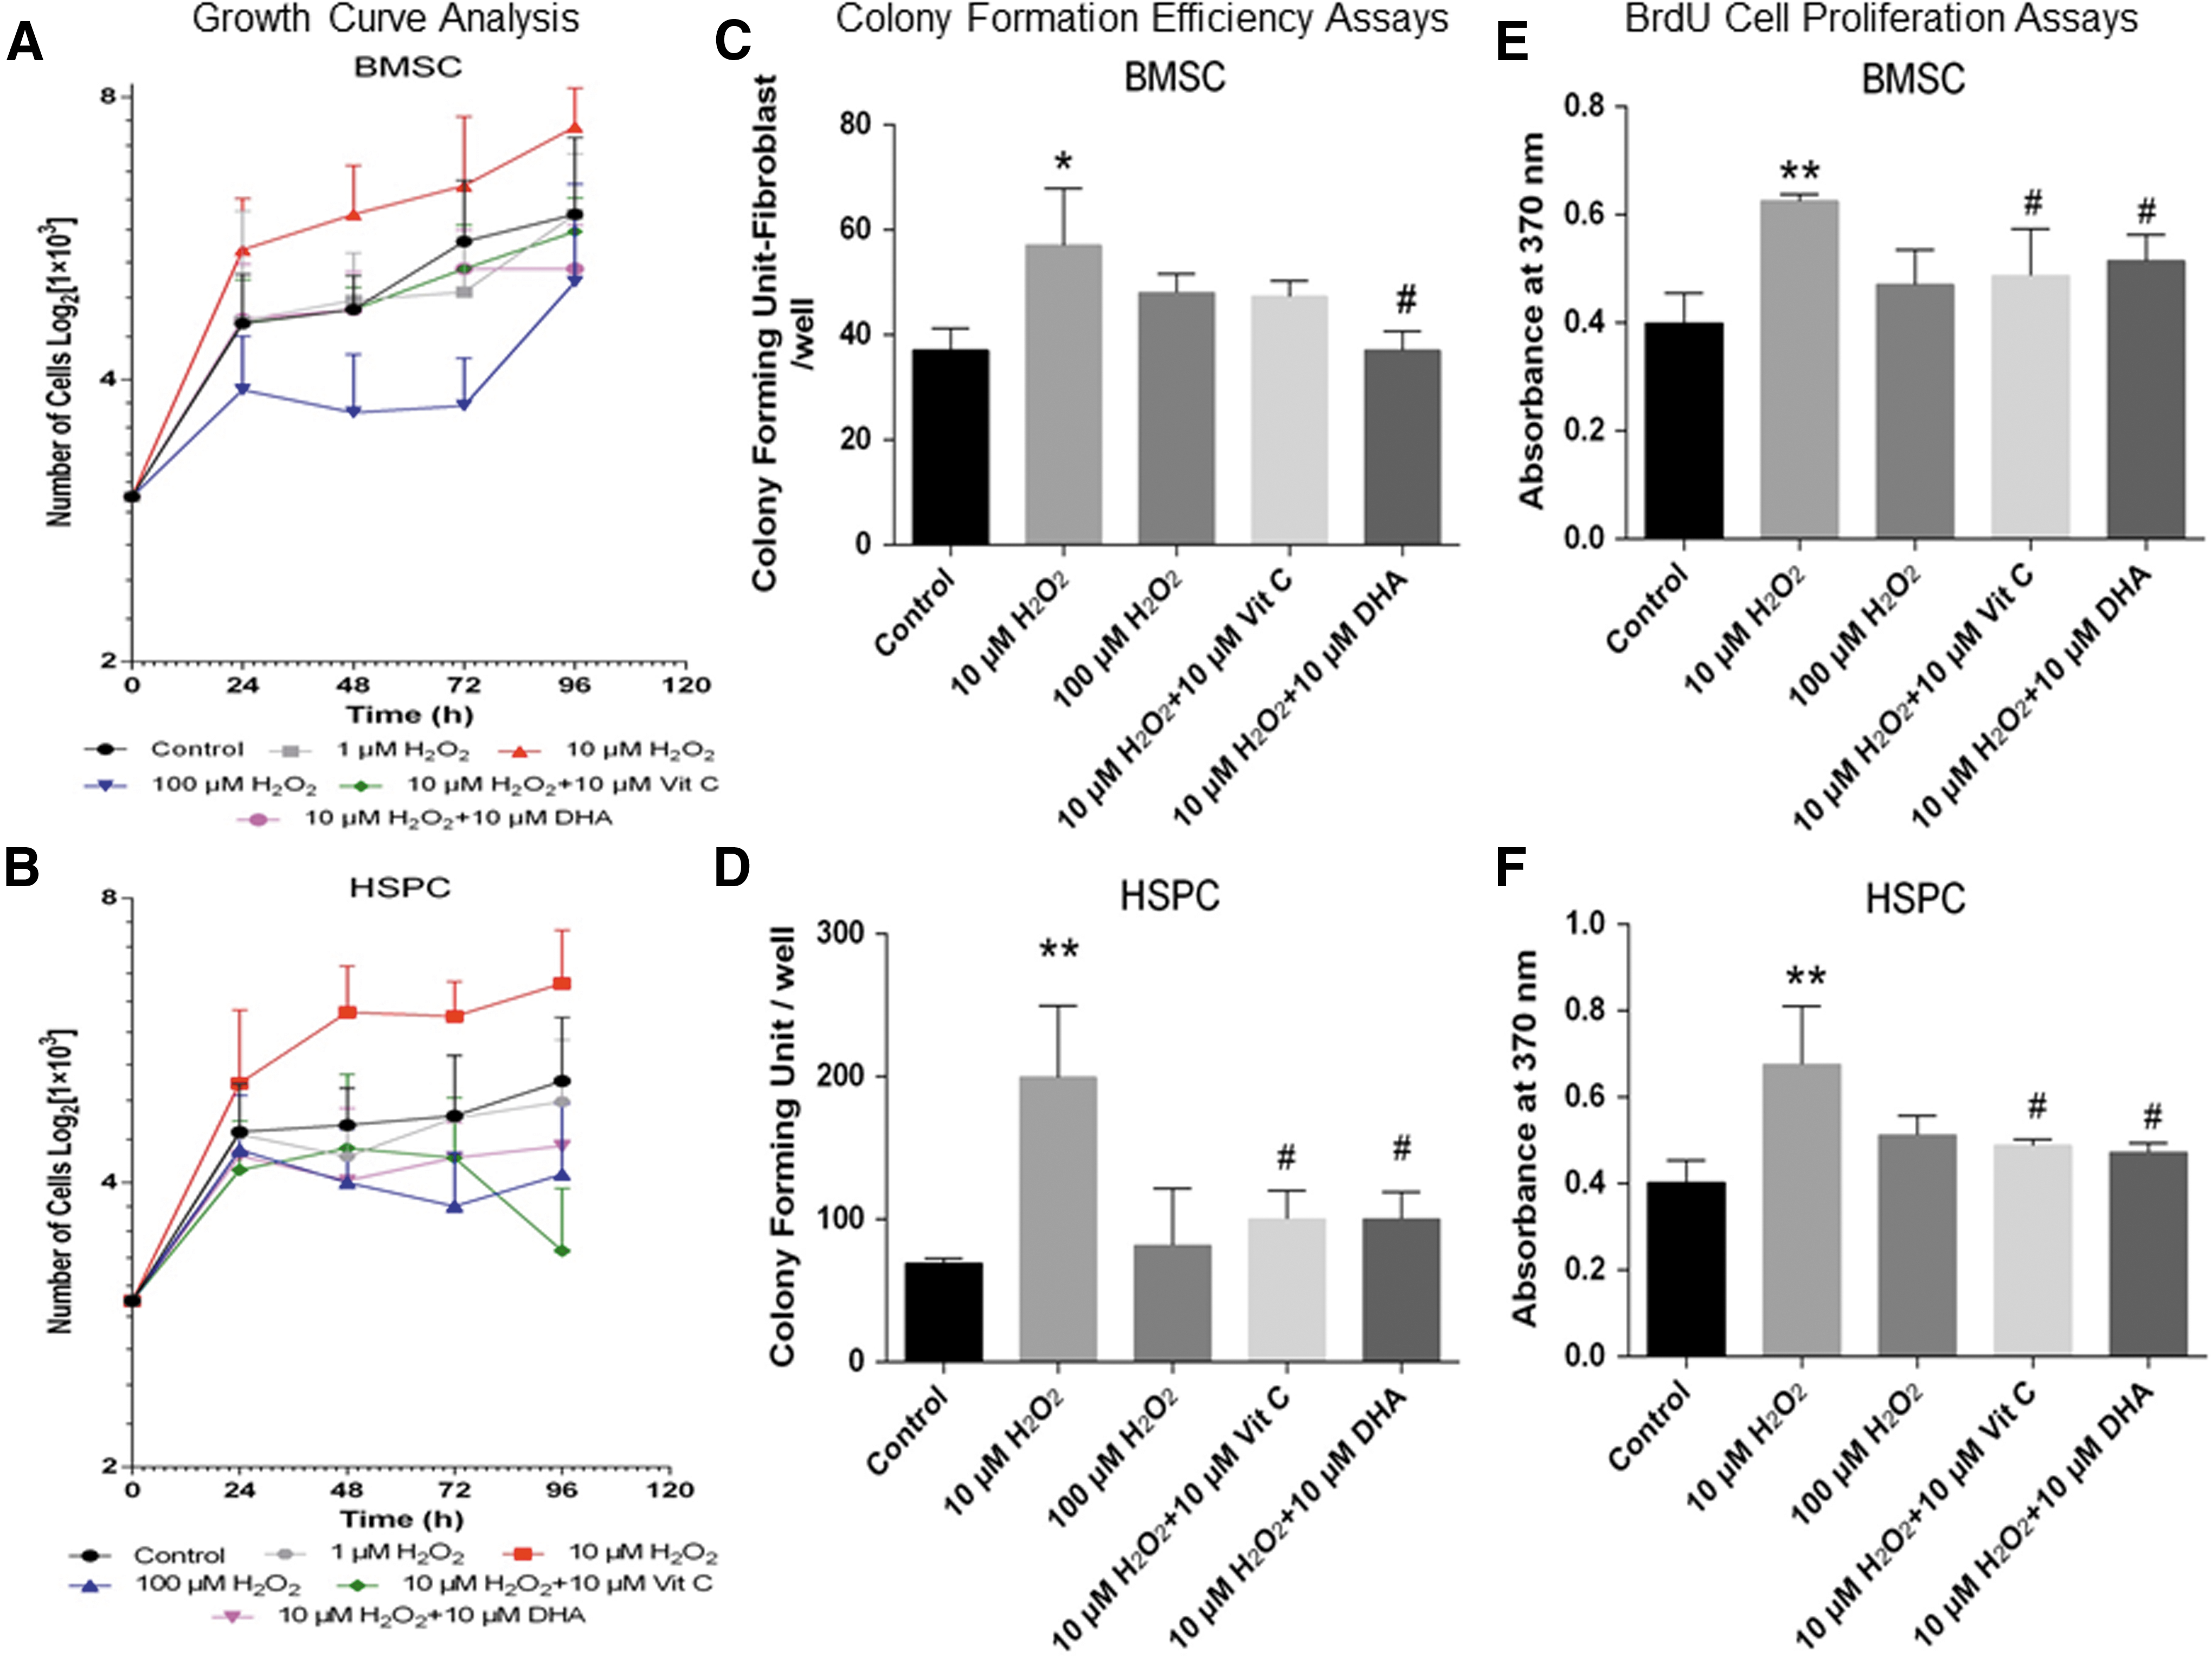
To evaluate the growth pattern of BMSCs and HSPCs in the presence of H2O2, the cells were treated for a maximum period of 96 h as previously described (11). Cells were harvested at a regular interval, and cell count was determined. Both BMSCs (Fig. 1A) and HSPCs (Fig. 1B) depicted a noticeable increase in cell growth, with a reduction in doubling time to 48 h when treated with 10 μM H2O2 as compared with their respective controls (≥96 h). At higher concentrations of H2O2 (100 μM), growth rates of both BMSCs (Fig. 1A) and HSPCs (Fig. 1B) were markedly decreased. Vit. C or DHA at an equimolar concentration could revert the low H2O2-induced increased growth rate of both BMSCs (Fig. 1A) and HSPCs (Fig. 1B). Further to corroborate the growth pattern of BMSC and HSPC, CFU and bromodeoxyuridine (BrdU) cell proliferation assays were performed. As observed in growth curve kinetics of 10 μM but not 100 μM concentration of H2O2, a significant increase in CFU and BrdU incorporation was depicted in both BMSCs (Fig. 1C, E) and HSPCs (Fig. 1D, 1). Equimolar concentration (10 μM) of Vit. C or DHA could rescue the effect of H2O2. These results clearly suggest that the specificity of H2O2-mediated oxidative stress promotes the proliferative potential of BMSCs and HSPCs that could be perturbed by the exogenous supplementation of antioxidants.
Low oxidative stress promotes cell cycle progression in BMSCs and HSPCs
The earlier observation of 10 μM H2O2-induced proliferation incited us to explore the cell cycle status of these sorted bone marrow cell populations. Ten micromolar H2O2 significantly increased cell populations in S and G2/M phases of the cell cycle that was perturbed in the presence of Vit. C (Supplementary Fig. S1A; Supplementary Data are available online at
Cellular redox status in H2O2-treated BMSCs and HSPCs
To evaluate the intracellular and extracellular ROS levels along with glutathione (GSH) content in sorted BMSCs and HSPCs exposed to H2O2, DCFH-DA staining, amplex red assay, and glutathione assay were performed. Significantly high concentration-dependent intracellular ROS levels were observed after 24 and 48 h post-treatment of H2O2 in BMSCs (Supplementary Fig. S2A) and HSPCs (Supplementary Fig. S2B) that was attenuated by Vit. C or DHA. The extracellular ROS level (H2O2 concentration) depicted a concentration-dependent significant increase that was overturned by addition of Vit. C or DHA as compared with control at 24 h. Further at 48 h post-treatment, the extracellular ROS level decreased and was comparable to the control group, indicating the utilization of H2O2 by BMSCs (Supplementary Fig. S2C) and HSPCs (Supplementary Fig. S2D). In line with the H2O2-induced increased ROS production, a concentration-dependent significant decrease of cellular GSH content was restored in BMSCs (Supplementary Fig. S2E) and HSPCs (Supplementary Fig. S2F) by addition of Vit. C or DHA as compared with the control at 48 h post-treatment. These data suggest that even 10 μM H2O2 causes significant oxidant perturbation in BMSCs and HSPCs that can, subsequently, activate downstream signal transduction pathways.
Low oxidative stress-induced activation of molecular signal transduction pathways in BMSCs and HSPCs
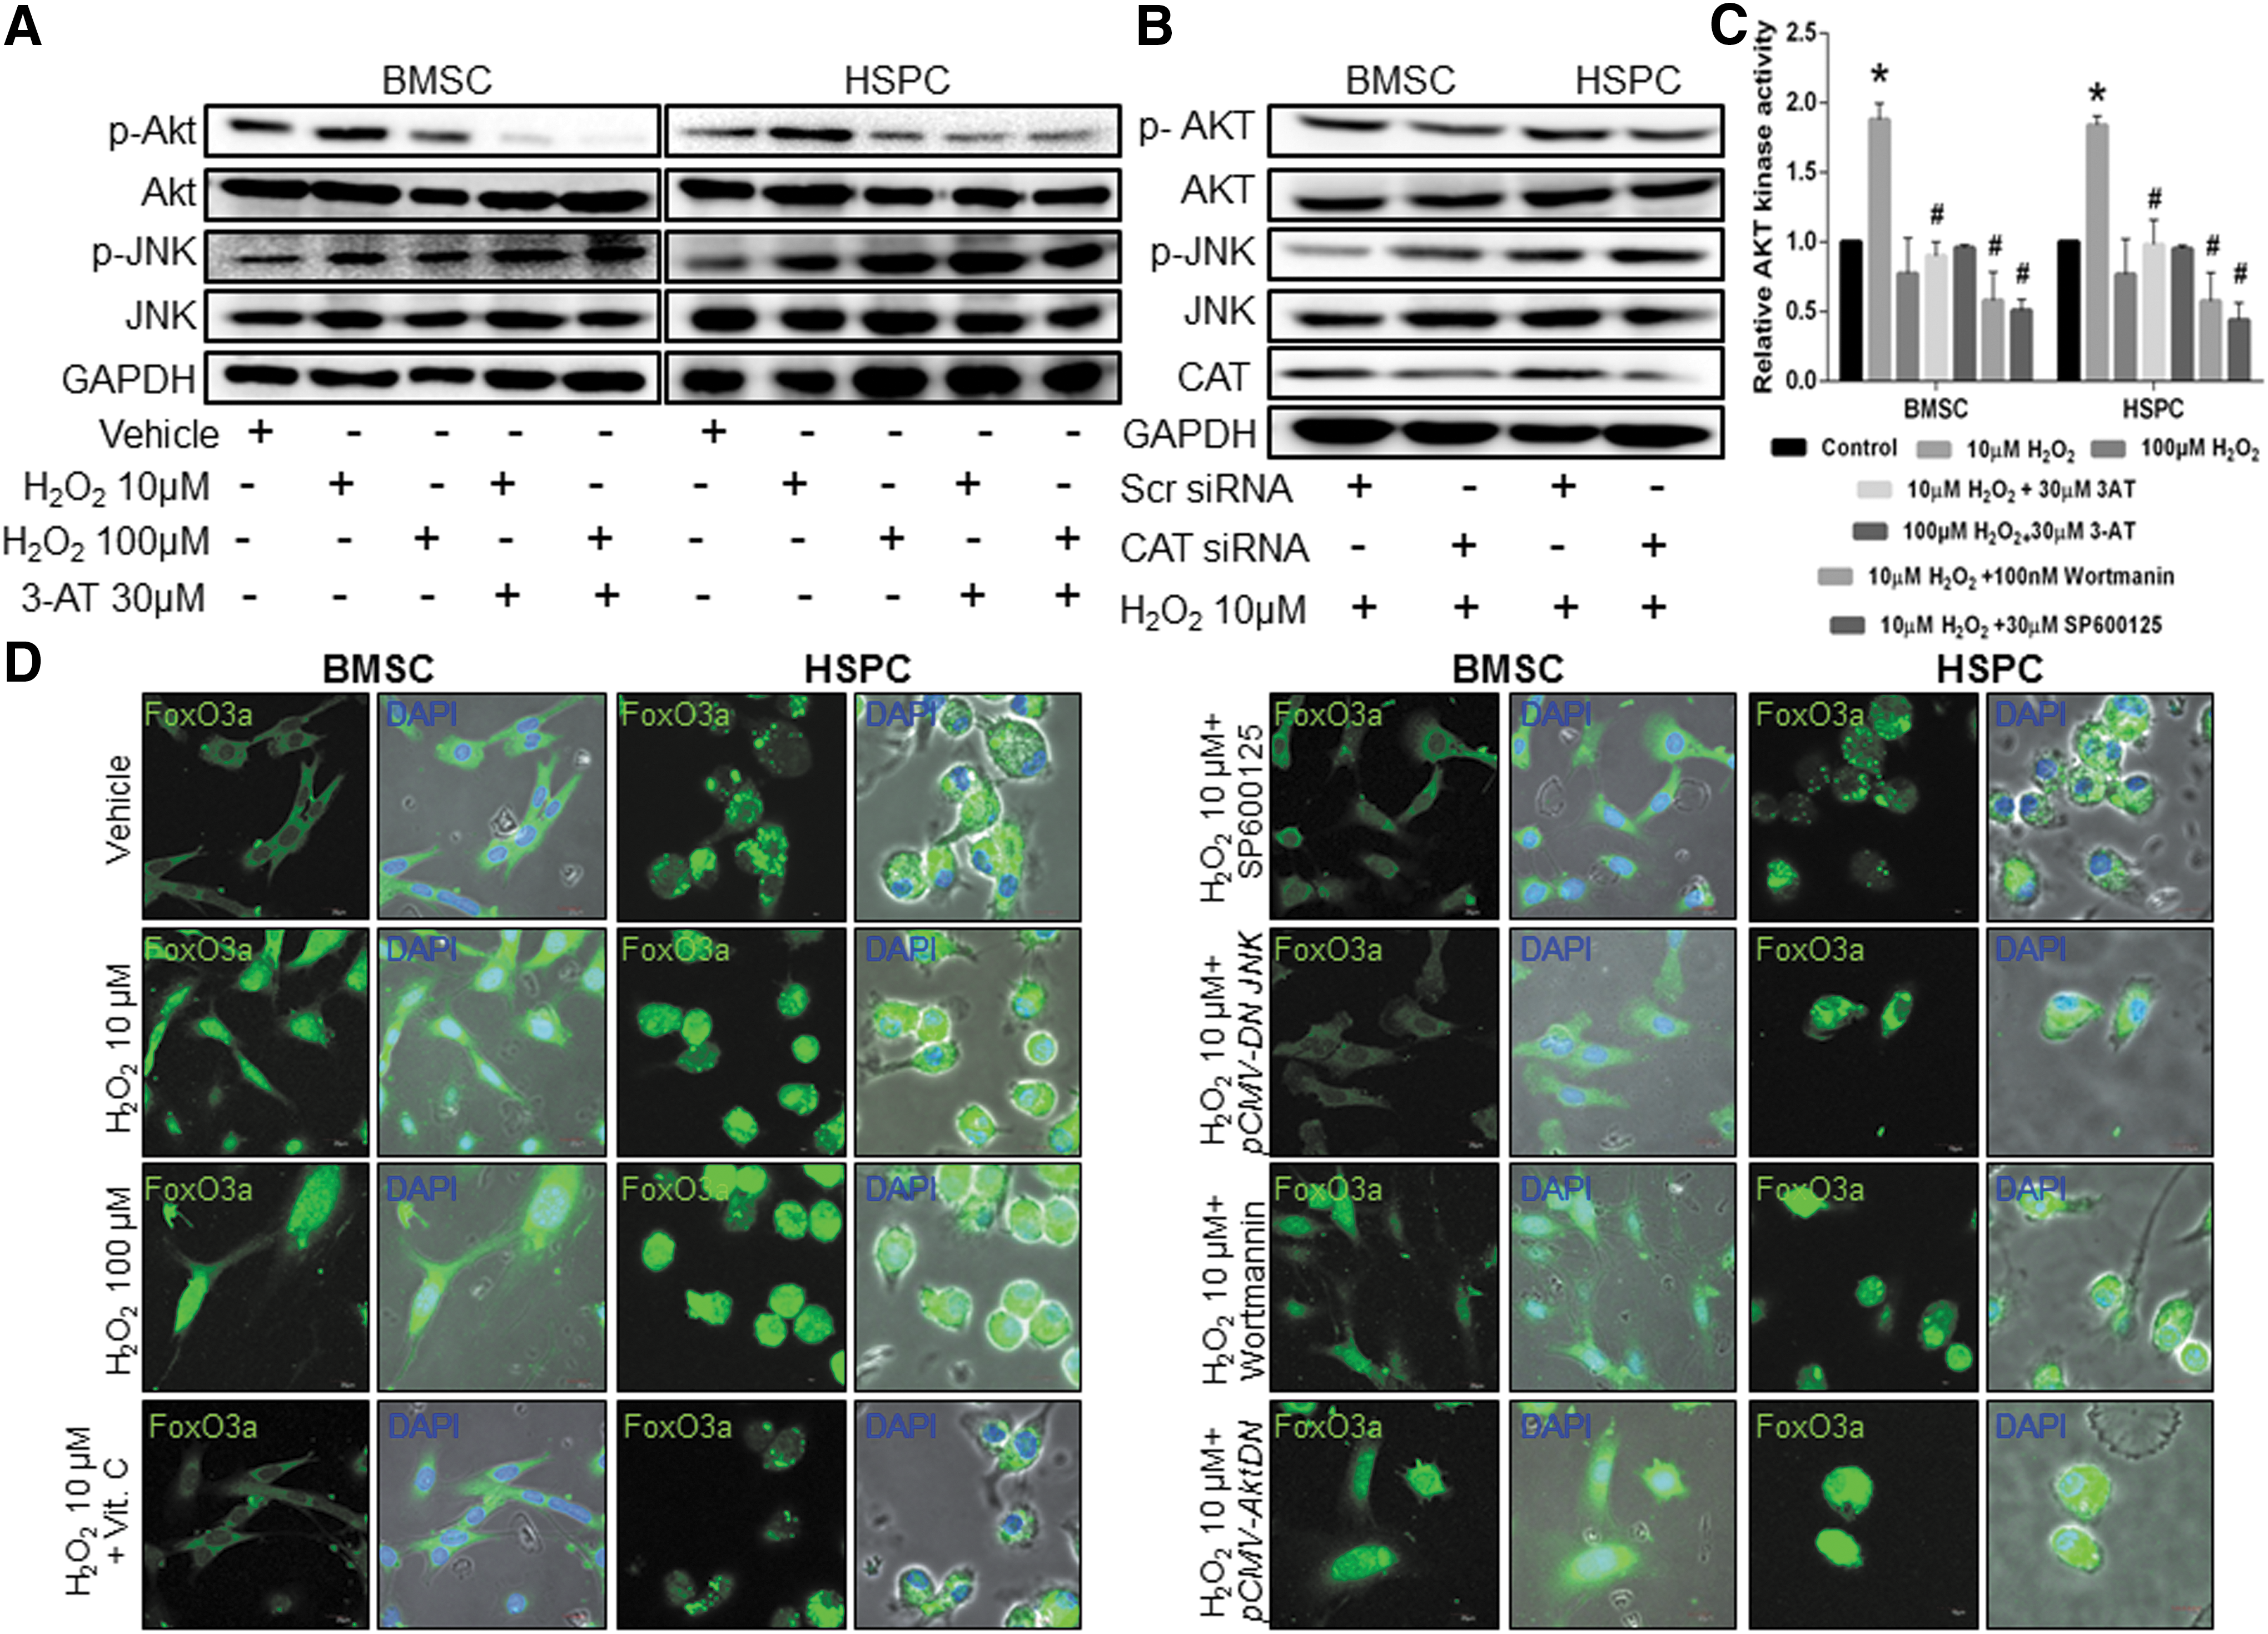
We evaluated the role of oxidative stress on growth-promoting and proliferative signal transduction pathways in BMSCs and HSPCs using immunoblot analysis. Ten micromolar H2O2 treatment in these cells led to an increased phosphorylation of AKT and JNK (Fig. 2A). Further, a sub-lethal or high concentration of H2O2 (100 μM) could phosphorylate JNK but not AKT, indicating a selective activation of JNK stress kinase (Fig. 2A), which was further confirmed by densitometric analysis (BMSCs-Supplementary Fig. S3A and HSPCs-Supplementary Fig. S3B). In addition, activation of ERK1/2 and p38 MAPK under similar conditions yielded insignificant change of these signaling mediators in both BMSCs and HSPCs. To confirm whether the earlier observation holds true, we treated HSPCs and BMSCs with H2O2 in both the presence and absence of inhibitors such as Wortmannin (AKT), SP600125 (JNK), PD98059 (ERK1/2) (48), and SB203580 (p38 MAPK) (12). Indeed, wortmannin and SP600125 at 100 nM and 30 μM, respectively, could significantly decrease the H2O2-induced proliferation in BMSCs (Fig. 2B) as well as HSPCs (Fig. 2C) as observed in both growth curve analysis and BrdU cell proliferation assays (Fig. 2D), suggesting pathway specificity. These observations indicate that 10 μM H2O2-induced proliferation is mediated by concerted action of both AKT and JNK signaling pathways.

Cellular antioxidants facilitate BMSC and HSPC proliferation at low oxidative stress
Further, we investigated the status of the redox genes that are essential to detoxify the H2O2 as well as its effect on the downstream cell signaling. Among the different isoforms of mammalian SODs, an H2O2-mediated concentration-dependent increase in the expression of SOD2, the mitochondrial isoform was observed in both BMSC and HSPC populations, which were decreased by an equimolar concentration of Vit. C (Supplementary Fig. S4A). Similarly, the expression of GPx2 (mitochondrial isoform of GPx) depicted a 2.9-fold high in both BMSCs and HSPCs as compared with the control in the presence of H2O2, which was not abrogated by an equimolar concentration of Vit. C (Supplementary Fig. S4B). Expression of catalase was 3.75-fold higher in BMSCs and 3.9-fold higher in HSPCs than the respective control at 10 μM exposure of H2O2, which was mitigated in the presence of an equimolar concentration of Vit. C, indicating that low oxidative stress induces its expression (Fig. 3A). However, at sub-lethal H2O2 concentration, catalase expression was decreased in both BMSCs and HSPCs, which substantiates with the existing literature that H2O2 at a high concentration downregulates catalase expression by epigenetic regulation via methylation of CpG islands (35).
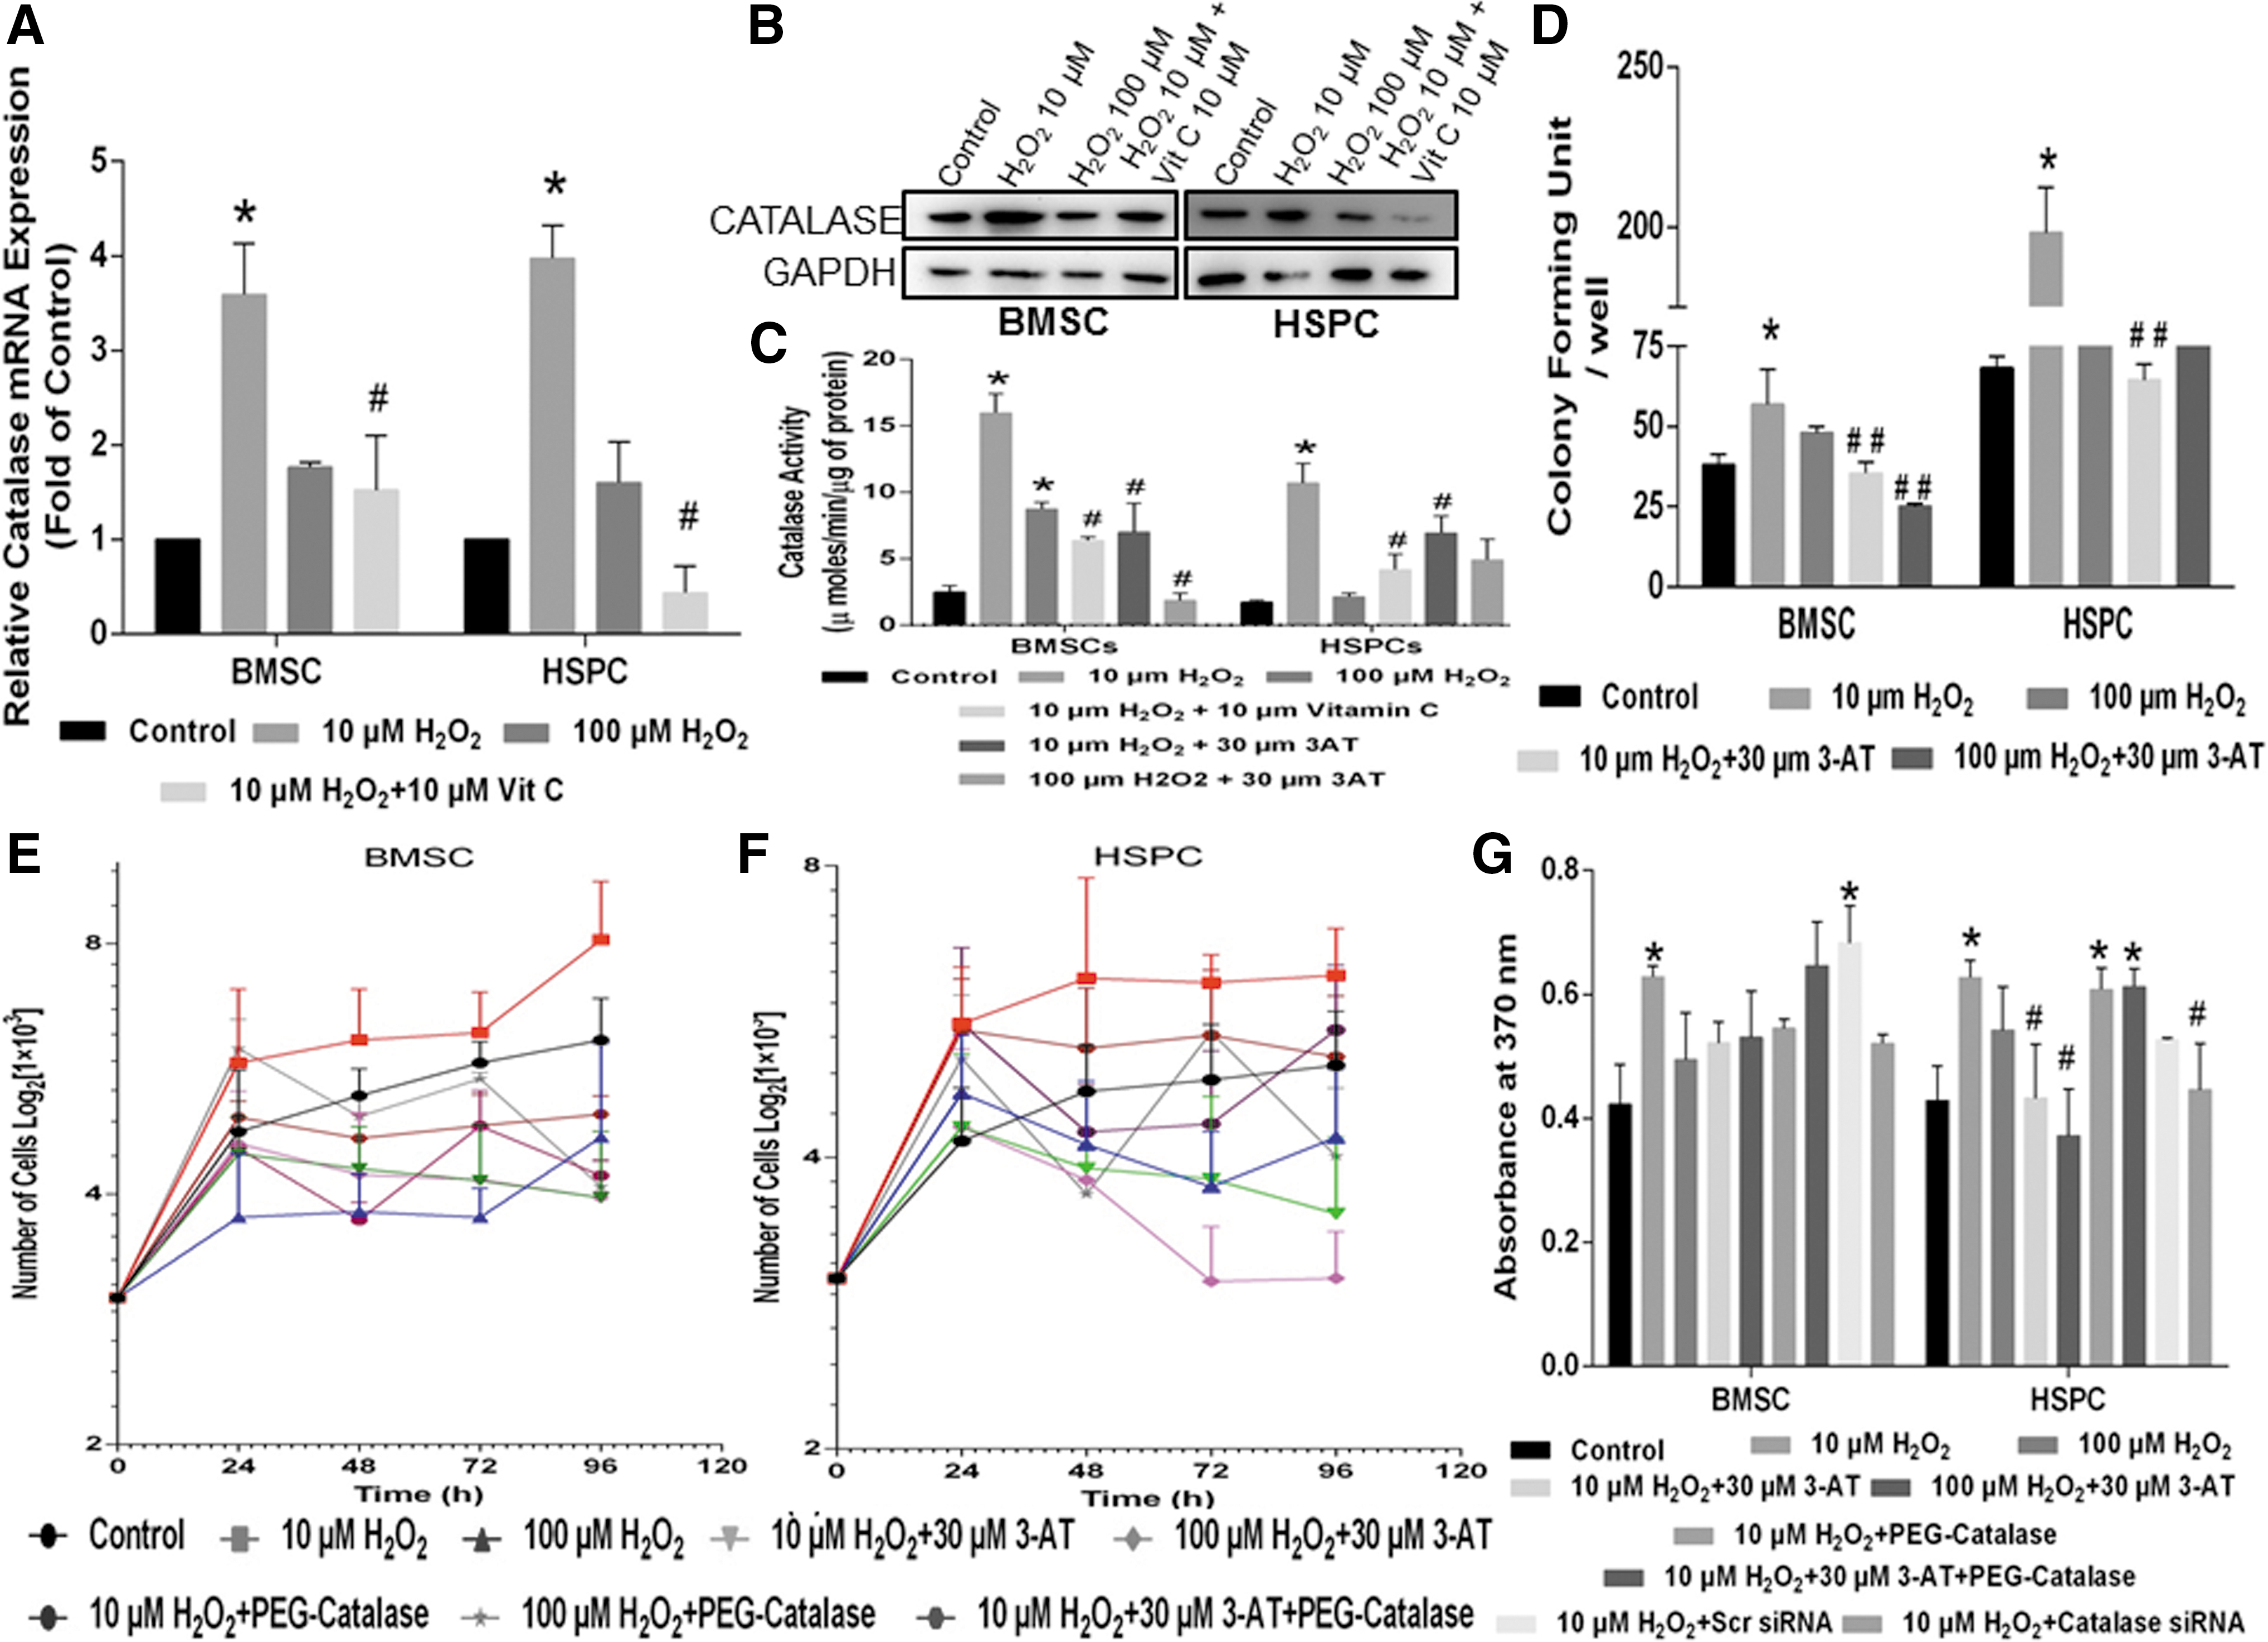
Further, in parallel with their transcript levels, we also evaluated the activity of these antioxidant enzymes SOD, GPx, and catalase in cell extracts. Although a concentration-dependent increase in activity of SOD was observed in HSPCs and BMSCs treated with H2O2, an equimolar concentration of Vit. C could not reverse the H2O2-induced increase in total SOD activity (Supplementary Fig. S4C). Similarly, total GPx activity depicted an insignificant change in BMSCs (Supplementary Fig. S4D) but in HSPCs a significant increase was observed only at a high concentration (100 μM) of H2O2 (Supplementary Fig. S4D). Increased expression of catalase translated equally with increased protein expression (Fig. 3B) and increased biochemical activity at 10 μM H2O2 that was reversed by exogenous antioxidants in BMSCs and HSPCs (Fig. 3C). These observations clearly indicate the role of the antioxidant enzyme, catalase in regulating the oxidative stress caused due to 10 μM H2O2 in BMSCs and HSPCs, thereby modulating cellular proliferation.
Catalase inhibition sensitizes BMSCs and HSPCs to low oxidative stress
To further investigate the role of catalase in low oxidative stress-induced cell proliferation, a pharmacological inhibitor of catalase, 3-Aminotriazole (3-AT) was used (41). A low concentration of H2O2-stimulated cell proliferation was significantly decreased by 3-AT (30 μM), as depicted by a decrease in the percent cell population in S-G2/M phase of the cell cycle (Supplementary Fig. S5A). At a biochemical level, catalase enzyme activity was also observed to be significantly decreased in BMSCs and HSPCs treated with 10 μM H2O2 and 3-AT (Fig. 3C). Next, colony formation (Fig. 3D) and growth curve assays also depicted a decrease in cell number when treated with 10 μM H2O2 in combination with 30 μM 3-AT in both BMSC (Fig. 3E) and HSPC (Fig. 3F). A similar outcome was observed in BrdU cell proliferation assay (Fig. 3G), although 3-AT treatment alone did not depict any significant difference in cell proliferation (Supplementary Fig. S5B). The pharmacologic administration of PEG catalase rescued the inhibitory effect on cell proliferation imparted by 3-AT (Fig. 3E–G). Catalase siRNA transfection of both BMSCs and HSPCs resulting in gene silencing (Supplementary Fig. S5C) led to a decrease in 10 μM H2O2-induced cell proliferation (Fig. 3G). These results clearly suggest that an increased cell cycle progression and expansion of BMSCs and HSPCs in the presence of 10 μM H2O2 but not at higher 100 μM H2O2 is correlated with increased catalase expression and activity.
To determine the effects of catalase inhibition on proliferative signaling mechanisms of AKT and JNK activation, we treated both BMSCs and HSPCs with 3-AT in the presence/absence of 10 μM or 100 μM concentration of H2O2. Catalase inhibition in these cell types depicted a downregulation of the AKT but not JNK signaling pathway (Fig. 4A), as evident from the densitometric analysis (Supplementary Fig. S5D). This observation suggests that in the absence of active catalase, even 10 μM concentration of H2O2 sensitizes the cells by inducing JNK stress kinases alike a sub-lethal (100 μM) concentration of H2O2 (Supplementary Fig. S5D). Similarly, decreased AKT activation whereas increased JNK activation was observed with silencing of catalase using CAT-siRNA at molecular level (Fig. 4B) and densitometric analysis or repeated blots (Supplementary Fig. S5E). To confirm AKT activation only at 10 μM H2O2 in both BMSC and HSPC with active catalase, we evaluated the AKT kinase activity in the presence/absence of 3-AT (10). Significantly high AKT kinase activity was observed in the presence of 10 μM H2O2 that was inhibited by 3-AT or wortmannin (positive control) (Fig. 4C). Interestingly, JNK inhibition also decreased AKT activation, indicating an existence of signaling crosstalk (Fig. 4C). Further, at molecular level, JNK (23) and AKT (47) dominant negative (DN) mutants could also decrease the 10 μM H2O2-induced AKT activity (Supplementary Fig. S6A). Next, we evaluated the levels of intracellular ROS in the presence of catalase inhibition. Significantly similar high intracellular ROS levels were observed in both BMSC (Supplementary Fig. S6B) and HSPC (Supplementary Fig. S6C) treated with 10 μM or 100 μM H2O2 along with 3-AT administration, suggesting an increased ROS-mediated AKT inactivation. Ten micromolar H2O2-induced increased AKT activation (phosphorylation) was perturbed by molecular inhibition using AKT and JNK DN mutants in both BMSC (Supplementary Fig. S6D) and HSPC (Supplementary Fig. S6E) along with cell proliferation (Supplementary Fig. S6F). Interestingly, molecular inhibition of JNK also led to decreased cell proliferation, indicating its involvement via catalase downregulation-mediated effect.
FOXO3a nuclear translocation induces transcriptional upregulation of catalase at low oxidative stress
In the JNK stress signaling cascade, activated JNK is known to translocate FOXO3a, a transcription factor to the nucleus for transcriptional upregulation of FOXO3a target genes (25). Therefore, we determined the concentration-dependent effect of H2O2-induced activation of JNK on FOXO3a nuclear translocation. As expected, 10 μM and 100 μM H2O2 depicted a concentration-induced nuclear translocation of FOXO3a (Fig. 4D and Supplementary Fig. S7A–C) whereas Vit. C led to FOXO3a retention in the cytoplasm (Fig. 4D, Supplementary Fig. S7A). Pharmacological (Fig. 4D and Supplementary Fig. S7A) as well as molecular (Fig. 4D and Supplementary Fig. S7A–C) inhibition of JNK inhibited the nuclear translocation of FOXO3a, whereas a similar inhibition of AKT did not have any effect on FOXO3a nuclear translocation (Fig. 4D and Supplementary Fig. S7A–C). Although activation of AKT is known to impart an inhibitory effect on FOXO3a nuclear translocation, recent studies suggest that a simultaneous JNK activation overrides AKT signaling, thereby dominating the FOXO3a nuclear translocation (4). Our results too clearly suggest the mechanism of H2O2-induced oxidative stress-mediated JNK activation, which, in turn, leads to nuclear translocation of FOXO3a that acts as a transcriptional co-regulator of its target gene expression. In our in silico analysis (data not shown) as well as other studies, an FOXO3a binding site is suggested in the promoter region of catalase gene (39). To further confirm this, we evaluated the catalase promoter that contained three potential FOXO3a binding sites: one at a distal region, distal binding site (DBS) and two others at a proximal region, proximal binding site (PBS1 and PBS2) (Fig. 5A). Chromatin immunoprecipitation (ChIP) analysis revealed that at 10 μM H2O2 concentration, FOXO3a binds with a relatively higher affinity to catalase promoter at DBS in HSPCs as compared with BMSCs (Fig. 5B). However, a differential binding of FOXO3a to the PBS1 and PBS2 on catalase promoter was observed at 10 μM H2O2 concentration. A high binding of FOXO3a to PBS2 in BMSCs (Fig. 5C) and PBS1 in HSPCs (Fig. 5D) was observed. Increased H2O2 concentration consequently led to decreased FOXO3a binding to catalase promoter (Fig. 5B–D). Vit. C and JNK inhibitor, SP600125 in the presence of 10 μM H2O2 concentration, decreased FOXO3a binding to catalase promoter, indicating the 10 μM H2O2-mediated transcriptional upregulation of catalase via JNK-FOXO3a signaling. This was further confirmed by a decreased catalase gene expression in the presence of JNK inhibitor (SP600125) but not AKT inhibitor (wortmannin) in 10 μM H2O2-treated BMSC and HSPCs (Fig. 5E), suggesting that although 10 μM H2O2-induced activation of JNK and AKT was observed in these proliferating cells, only JNK but not AKT imparts a direct regulation on catalase expression. To further substantiate this observation, we evaluated catalase mRNA and protein expression in the presence of JNK and AKT DN mutants. Molecular inhibition of JNK but not AKT led to a decrease in catalase mRNA (Supplementary Fig. S7D) and protein (Supplementary Fig. S7E) expression in 10 μM H2O2-treated BMSC and HSPC, which corroborated further with catalase activity (Supplementary Fig. S7F). These results indicate that physiological relevance of AKT activation in 10 μM H2O2-treated BMSC and HSPC might have a direct regulation on cell proliferation.

AKT and catalase inhibition downregulates cell proliferation-related genes at low oxidative stress
AKT inhibition-mediated decreased cell proliferation in 10 μM H2O2-treated BMSC and HSPC was confirmed by the observation of decreased expression of cyclins B1, D2, and E2 (Fig. 5F) and PCNA (Fig. 5G) along with concomitant increased expression of CKIs p16 and p27 (Fig. 5G). Molecular inhibition of AKT also led to a decreased expression of cyclins (Supplementary Fig. S7G) and increased expression of CKIs (Supplementary Fig. S7H), thereby confirming the role of AKT in cell proliferation. Interestingly, JNK molecular inhibition indirectly led to a decrease in cyclin expression and an increase in CKIs expression via a decrease in catalase expression (Supplementary Fig. S7F, G). As observed earlier, downregulation of catalase led to inactivation of AKT; 3-AT treatment also resulted in decreased cyclins (Fig. 5F), PCNA (Fig. 5G) and increased CKIs expression (Fig. 5G), indicating a simultaneous induction of the JNK–FOXO3a–catalase signaling cascade along with AKT–cyclins–cell proliferation in the presence of 10 μM H2O2-induced low oxidative stress in BMSC and HSPC wherein perturbation of the former signaling regulates the latter.
Low oxidative stress preconditioned BMSCs and HSPCs enhance wound tissue repair
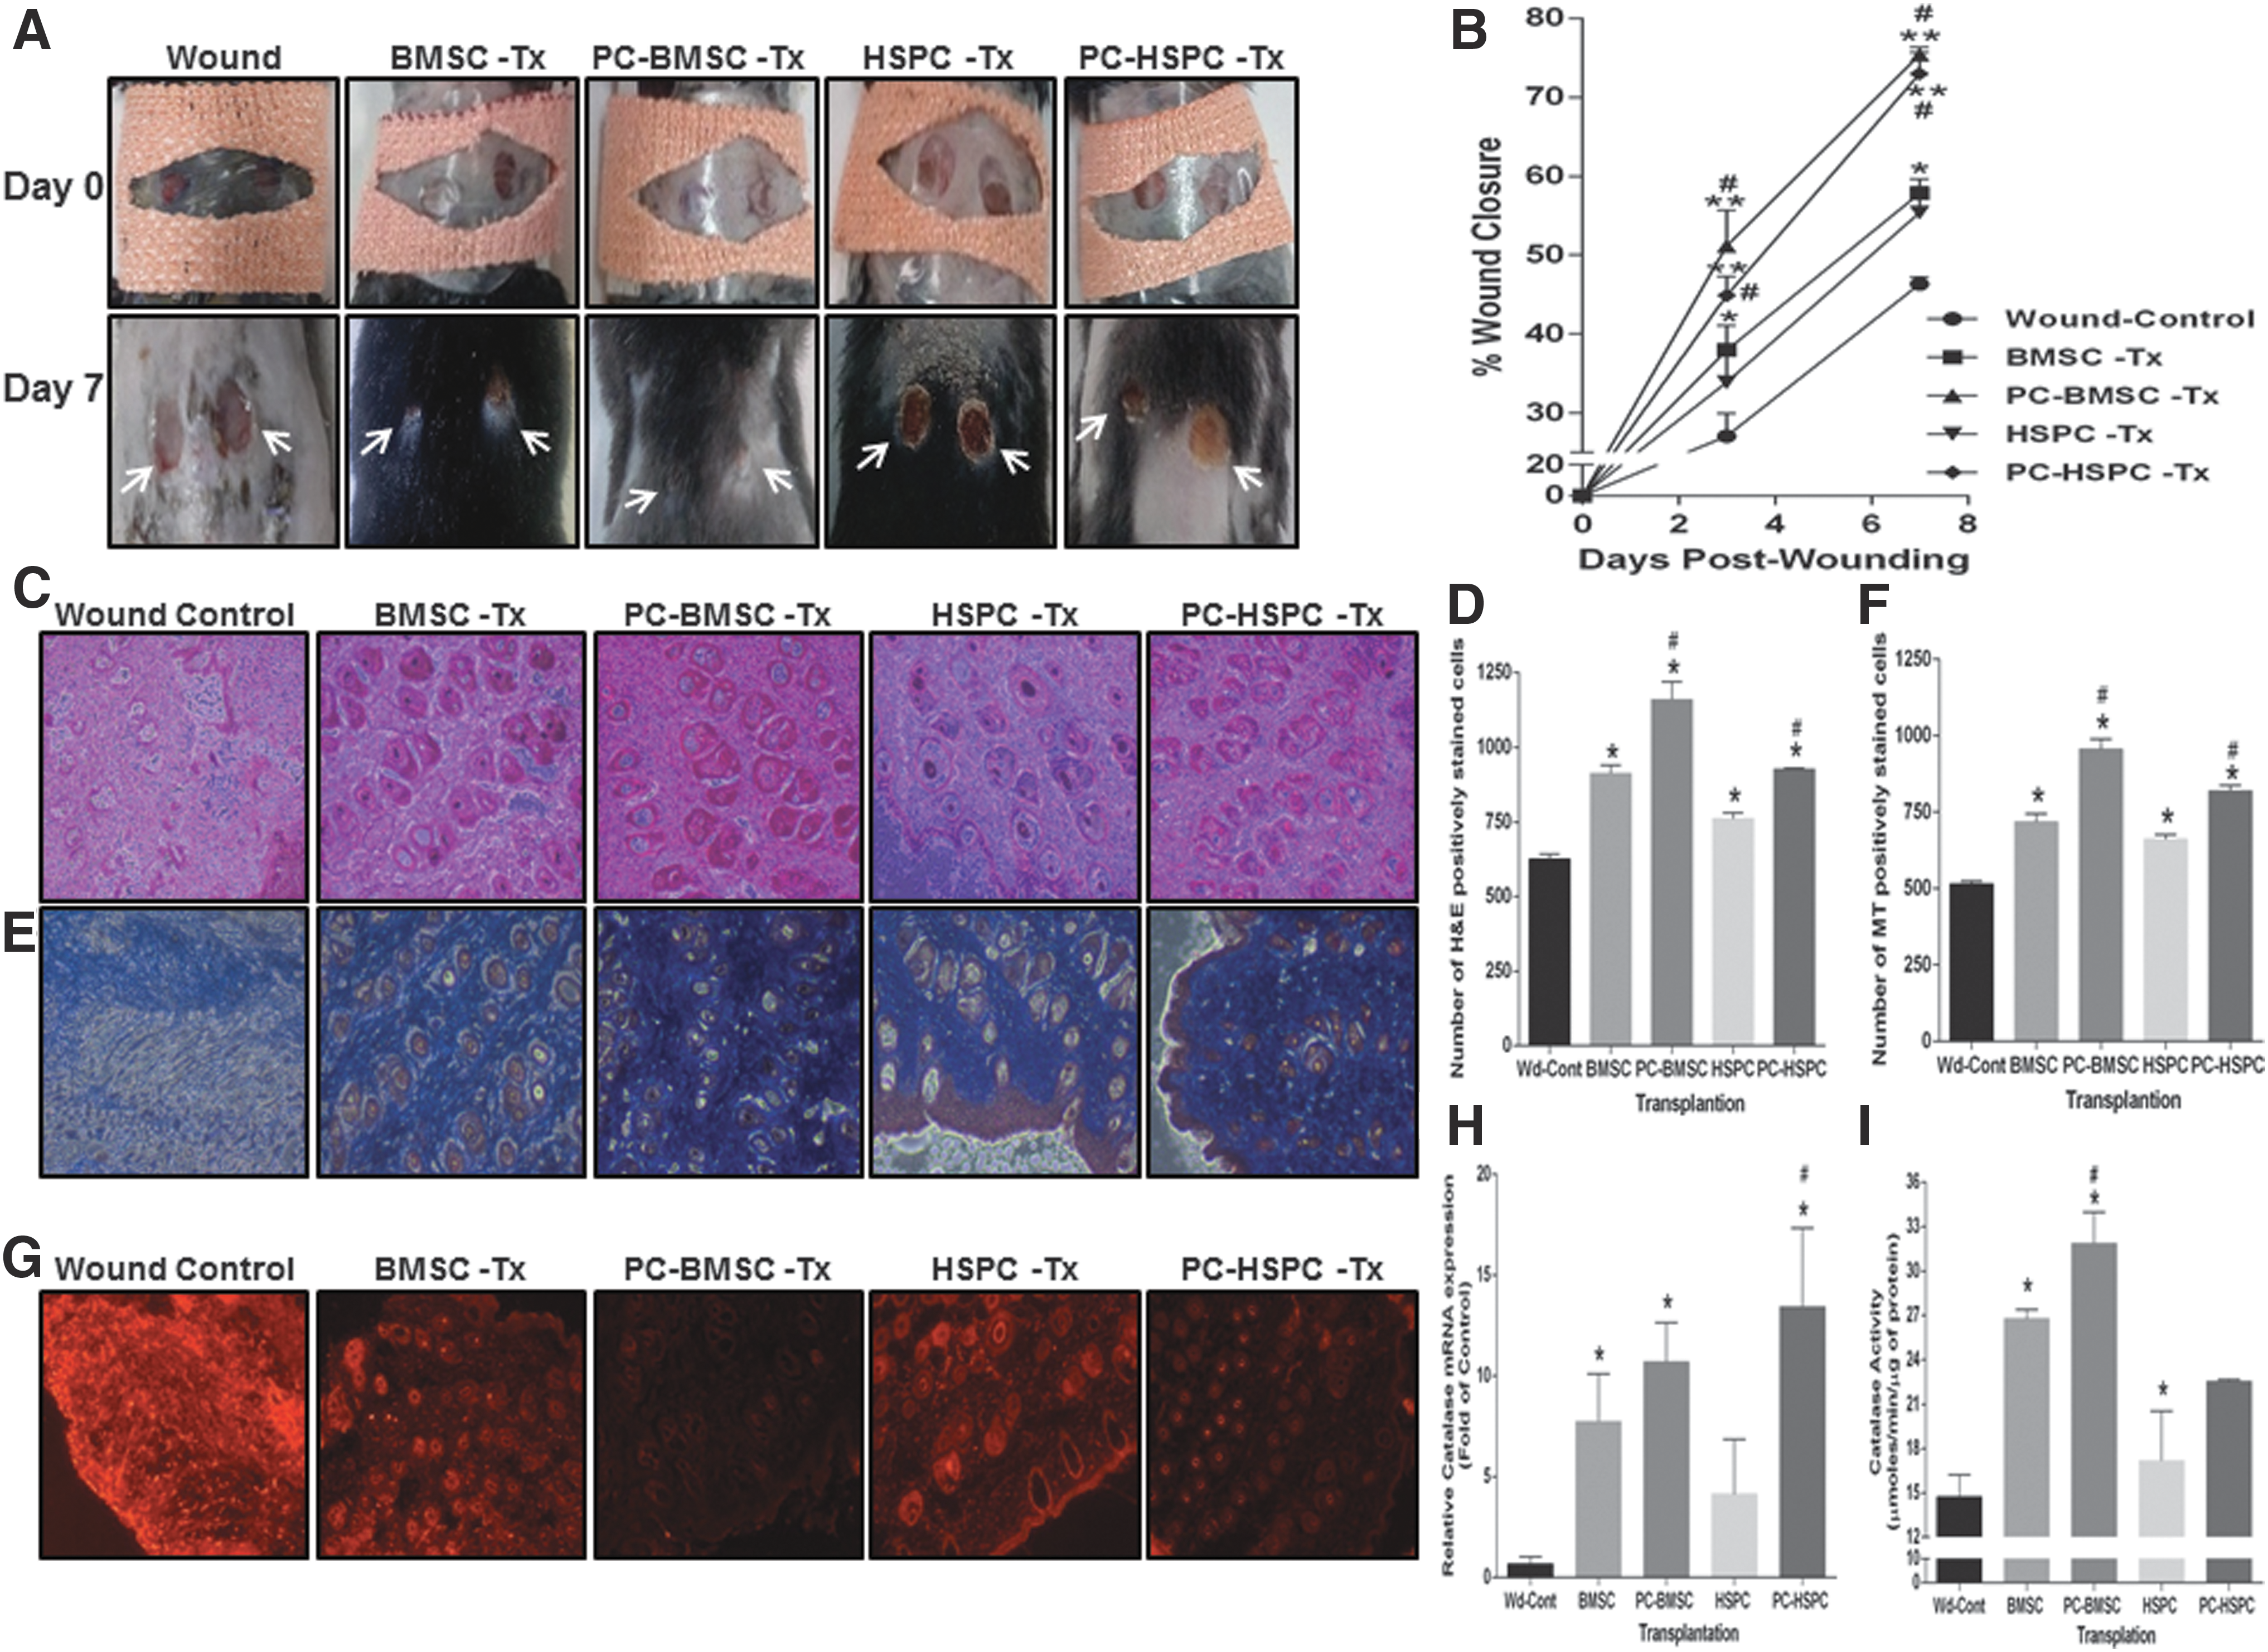
One of the major causes of poor endurance of stem cells in vivo in an injury microenvironment is the poor expansion of transplanted stem cells. Exposure to low oxidative stress in vitro (preconditioning with 10 μM H2O2) before transplantation at the wound site was hypothesized to increase the proliferation of BMSCs and HSPCs. Thus, we utilized a murine model of excisional splinting wound as described earlier (9) wherein wounds heal through granulation and re-epithelialization, a process similar to that which occurs in humans (43). Mice transplanted with preconditioned BMSCs and HSPCs showed an accelerated wound closure postsurgery day 7 as compared with mice transplanted with naive BMSCs and HSPCs only (Fig. 6A). Further temporal quantification of the regenerated wound area depicted a 75% wound closure in preconditioned BMSCs as compared with 56% in naive BMSCs at postsurgery day 7 (Fig. 6B). Similar results were observed with preconditioned HSPCs representing an increased wound closure of 71% at postsurgery day 7 (Fig. 6B). Histopathological analysis of regenerated wound tissue using hematoxylin and eosin staining (Fig. 6C, lower magnification images–Supplementary Fig. S8A) and the quantitation of images (Fig. 6D) clearly demonstrated an increased proliferation of cells in preconditioned BMSCs and HSPCs as compared with naive BMSCs and HSPCs and/or wound-control (nonstem cells transplanted) groups. Also, the preconditioned stem cells transplanted group demonstrated an increased collagen deposition as demonstrated by Masson's Trichrome staining (Fig. 6E) and its quantitation (Fig. 6F). Overall ROS generated at the wound site was evaluated by using dihydroxy ethidium (DHE) staining. Remarkably, preconditioned BMSCs and HSPCs transplanted groups depicted a marked reduction in DHE staining as compared with naive BMSCs or HSPCs transplanted groups and the wound control (Fig. 6G). Concurrently, a significant increase in the expression of antioxidant enzymes such as MnSOD (SOD2) (≥5.5–fold), GPx1 (∼8–fold), and GPx2 (∼3.8–fold) was observed in preconditioned HSPCs and BMSCs transplanted groups (Supplementary Fig. S8B). However, the gene expression levels did not correlate with the activity of these enzymes—SOD (Supplementary Fig. S8C) and GPx (Supplementary Fig. S8D). Interestingly, an increase in catalase gene expression in preconditioned BMSCs (10-fold) and/or HSPCs (13-fold) transplanted groups (Fig. 6H) substantiated well with catalase activity (31.9 and 31.5 μmoles/min/μg of protein, respectively) as compared with naive transplanted or wound-control group (Fig. 6I). Thus, preconditioning BMSCs or HSPCs with low concentrations of H2O2 induced the antioxidant enzyme, catalase. These cells when transplanted at the wound site alleviated the oxidative stress, thereby promoting wound tissue regeneration.
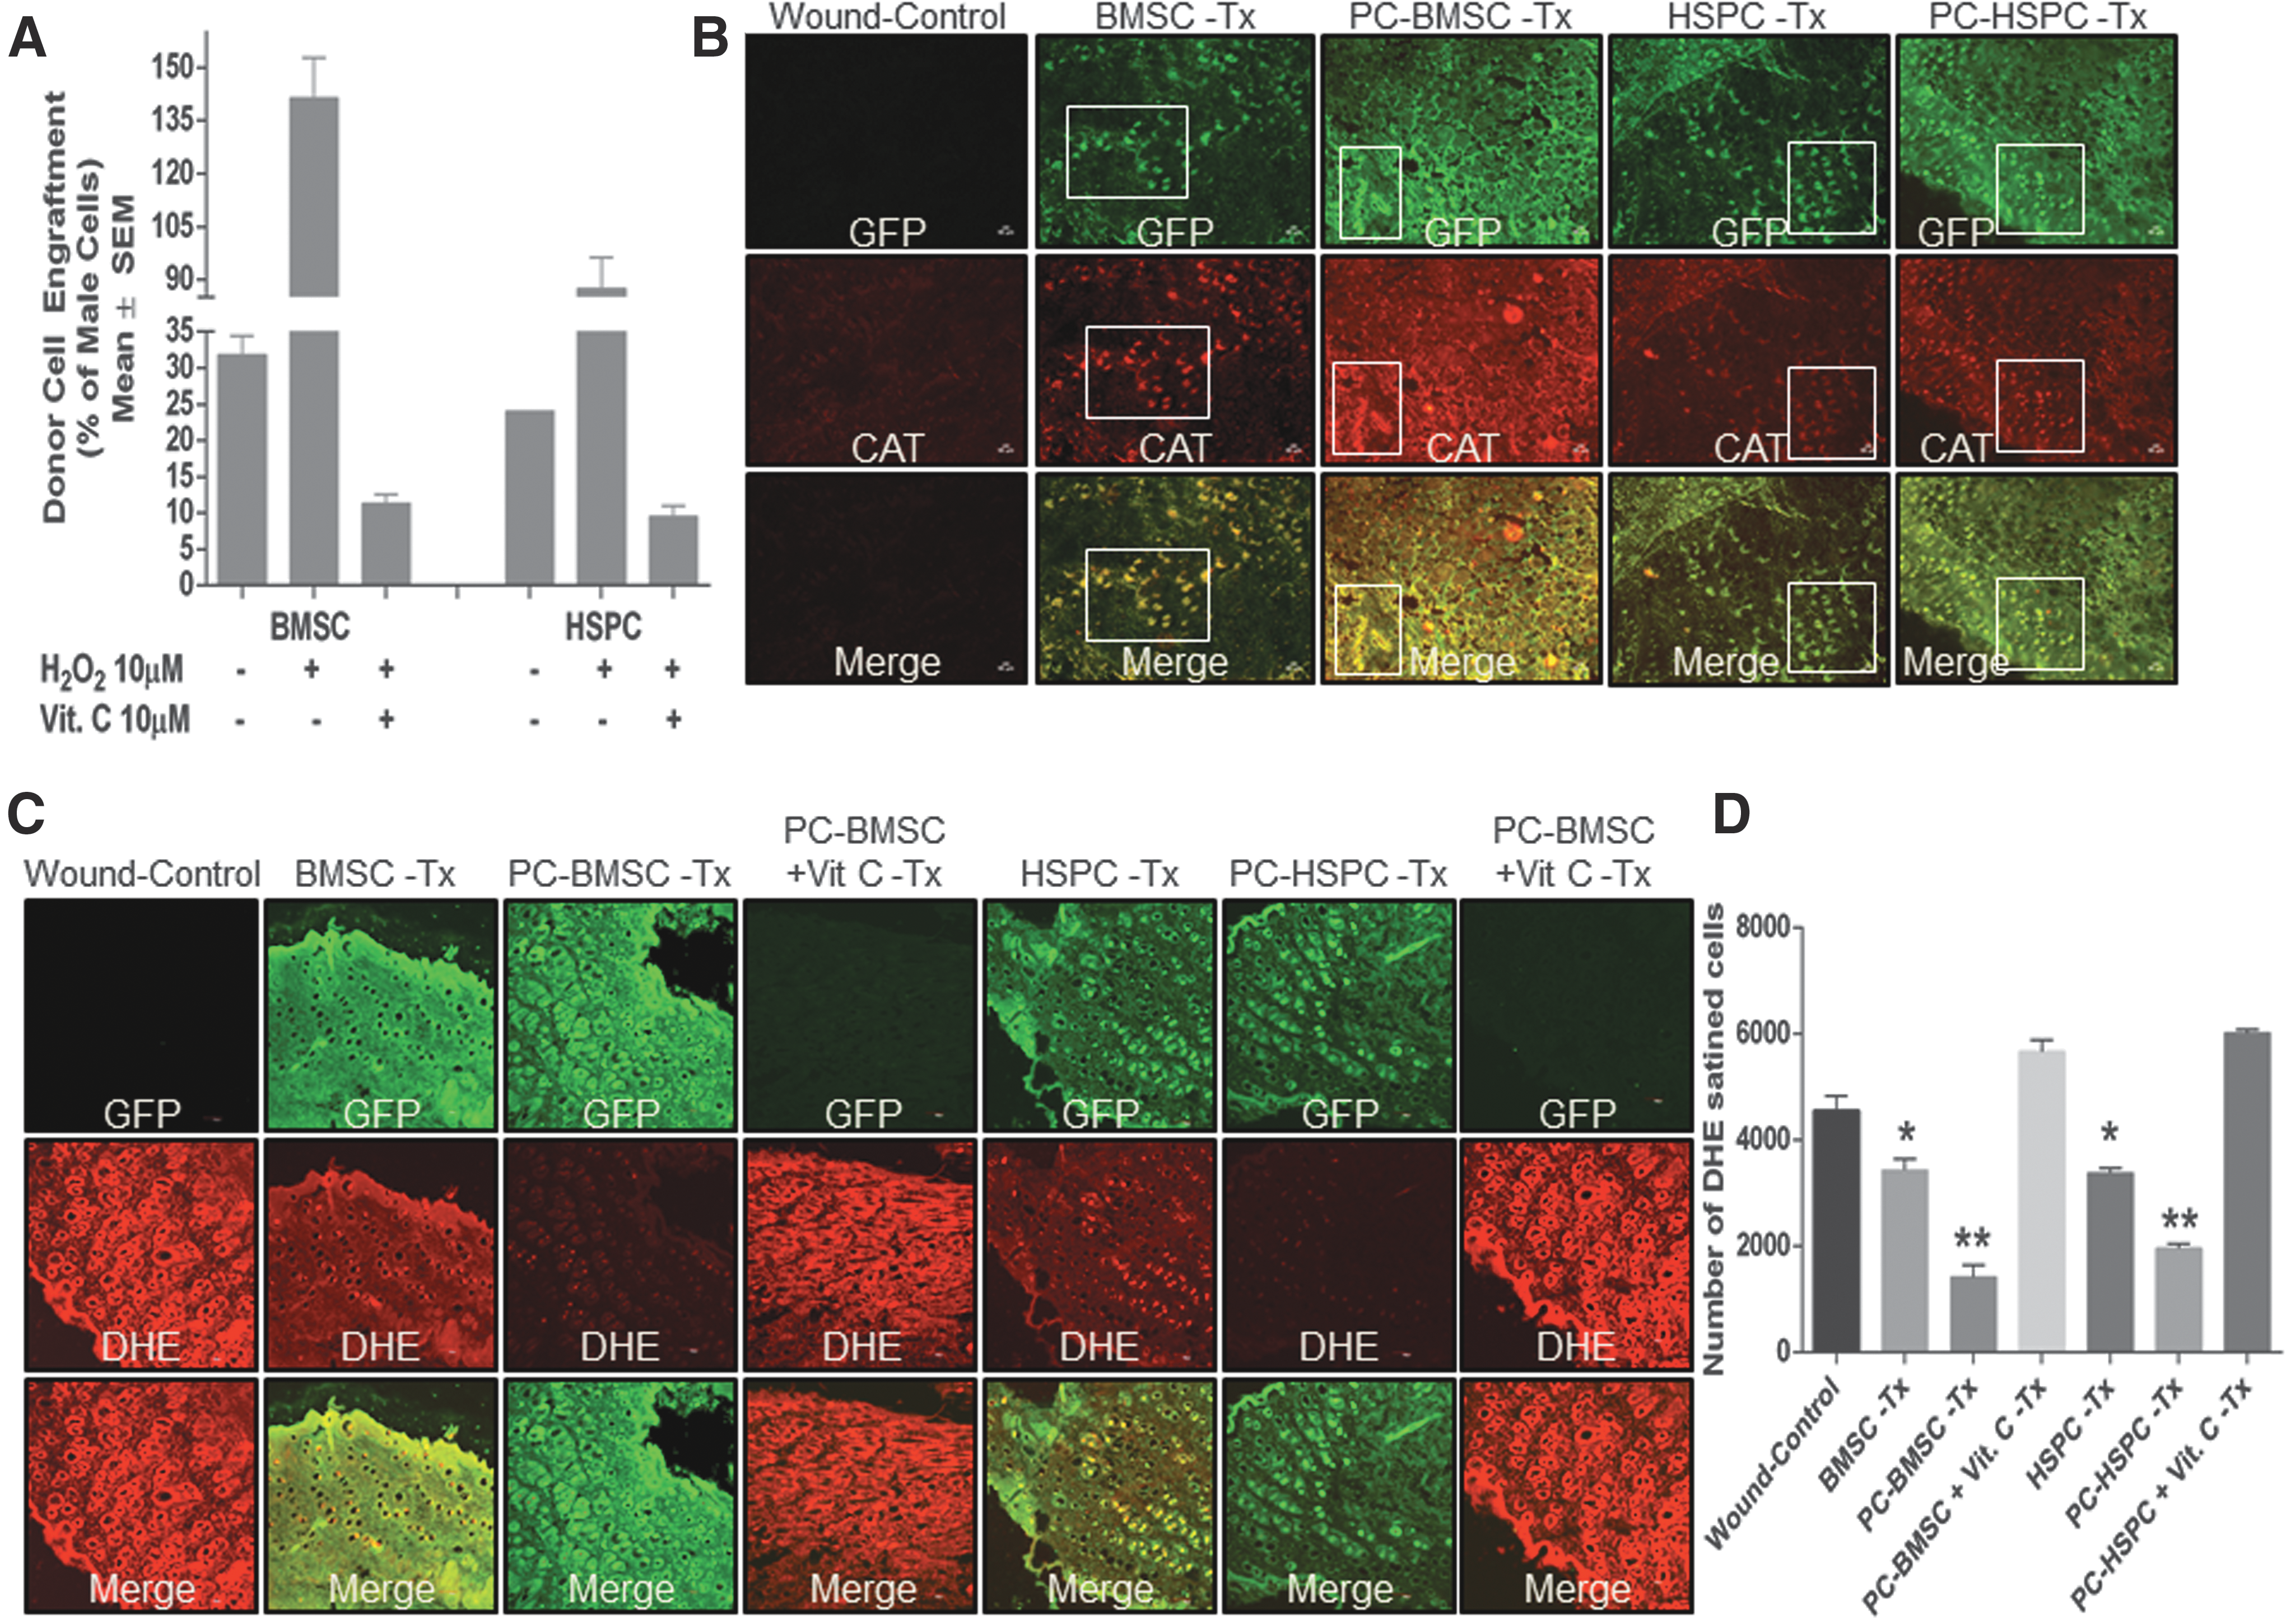
Low oxidative stress preconditioned BMSCs and HSPCs improve engraftment at the wound site
To determine the engraftment of transplanted stem cells at the wound site, BMSCs and/or HSPCs chimera was generated by using donor cells of male C57BL/6J mice transplanted onto recipient female C57BL/6J mice. DNA isolated from the wound tissue at 7 days postsurgery was subjected to quantification of Y-linked zinc finger protein (Zfy-1) gene and Bcl-2 (as reference control) by using real-time PCR. Preconditioned BMSCs and HSPCs transplanted groups depicted an increased engraftment of male donor cells as compared with naive BMSCs and HSPCs transplanted groups that were abrogated when these cells were also pretreated simultaneously with an exogenous antioxidant, Vit. C (Fig. 7A). Further, engraftment of transplanted GFP-expressing BMSCs and HSPCs co-expressing other stem cell markers as reported earlier (8) were also evaluated in the regenerated wound sections. At postsurgery day 7, an increased co-localization of GFP-CAT was observed in preconditioned BMSCs and HSPCs as compared with naive BMSCs and HSPCs transplanted groups, respectively, or the wound control (Fig. 7B and quantitation–Supplementary Fig. S8E), thereby suggesting an increased cellular antioxidant defense mechanism in the transplanted cells. In an effort to understand whether preconditioned BMSCs and HSPCs transplanted groups with a high expression of catalase could decrease the oxidative stress, we co-stained the tissue sections with DHE. Indeed, preconditioned BMSCs and HSPCs transplanted groups depicted a marked decrease in DHE staining (Fig. 7C) as compared with naive BMSCs and HSPCs transplanted groups or the wound control (Fig. 7D). Simultaneous supplementation of Vit. C to 10 μM concentration of H2O2-mediated preconditioning of BMSCs and HSPCs in vitro when transplanted markedly decreased the engraftment of cells as evident from less GFP-positive cells and increased DHE staining. This phenomenon corroborated well with the in vitro observation (Fig. 7C, D). Next, the “antioxidant” nature of Vit. C as an ROS quencher was evaluated for any beneficial effects during wound repair if administered parenterally at a pharmacological dose (200 mg/kg body wt, i.p., per day × 7 days). We observed a significant increase in wound closure at postsurgery day 7 as compared with the wound control (Supplementary Fig. S9A) and increased collagen deposition at the wound bed (Supplementary Fig. S9B, C). However, reports also suggest that Vit. C at a pharmacological dose acts as a “pro-oxidant” by generating ascorbate-free radicals and H2O2 in extracelluar fluids, which diffuse into the cells and cause depletion of ATP, thereby causing cell death (6). The BMSC and HSPC transplanted groups when administered with a pharmacological dose of Vit. C (200 mg/kg body wt, ip.) resulted in markedly low engraftment of cells (Supplementary Fig. S9D). BMSC and HSPC transplanted wound sections depicted a similar high DHE staining as observed in the wound-control group (Supplementary Fig. S9E, Quantitation of DHE staining-Supplementary Fig. S9F), suggesting no beneficial effect of pharmacological administration of Vit. C on reduction of ROS at the wound bed during wound healing. Thus, preconditioning of BMSCs and HSPCs with low concentrations of H2O2 before transplantation enhances the antioxidant defense system in the cells and makes them better equipped to survive the harsh wound environment.
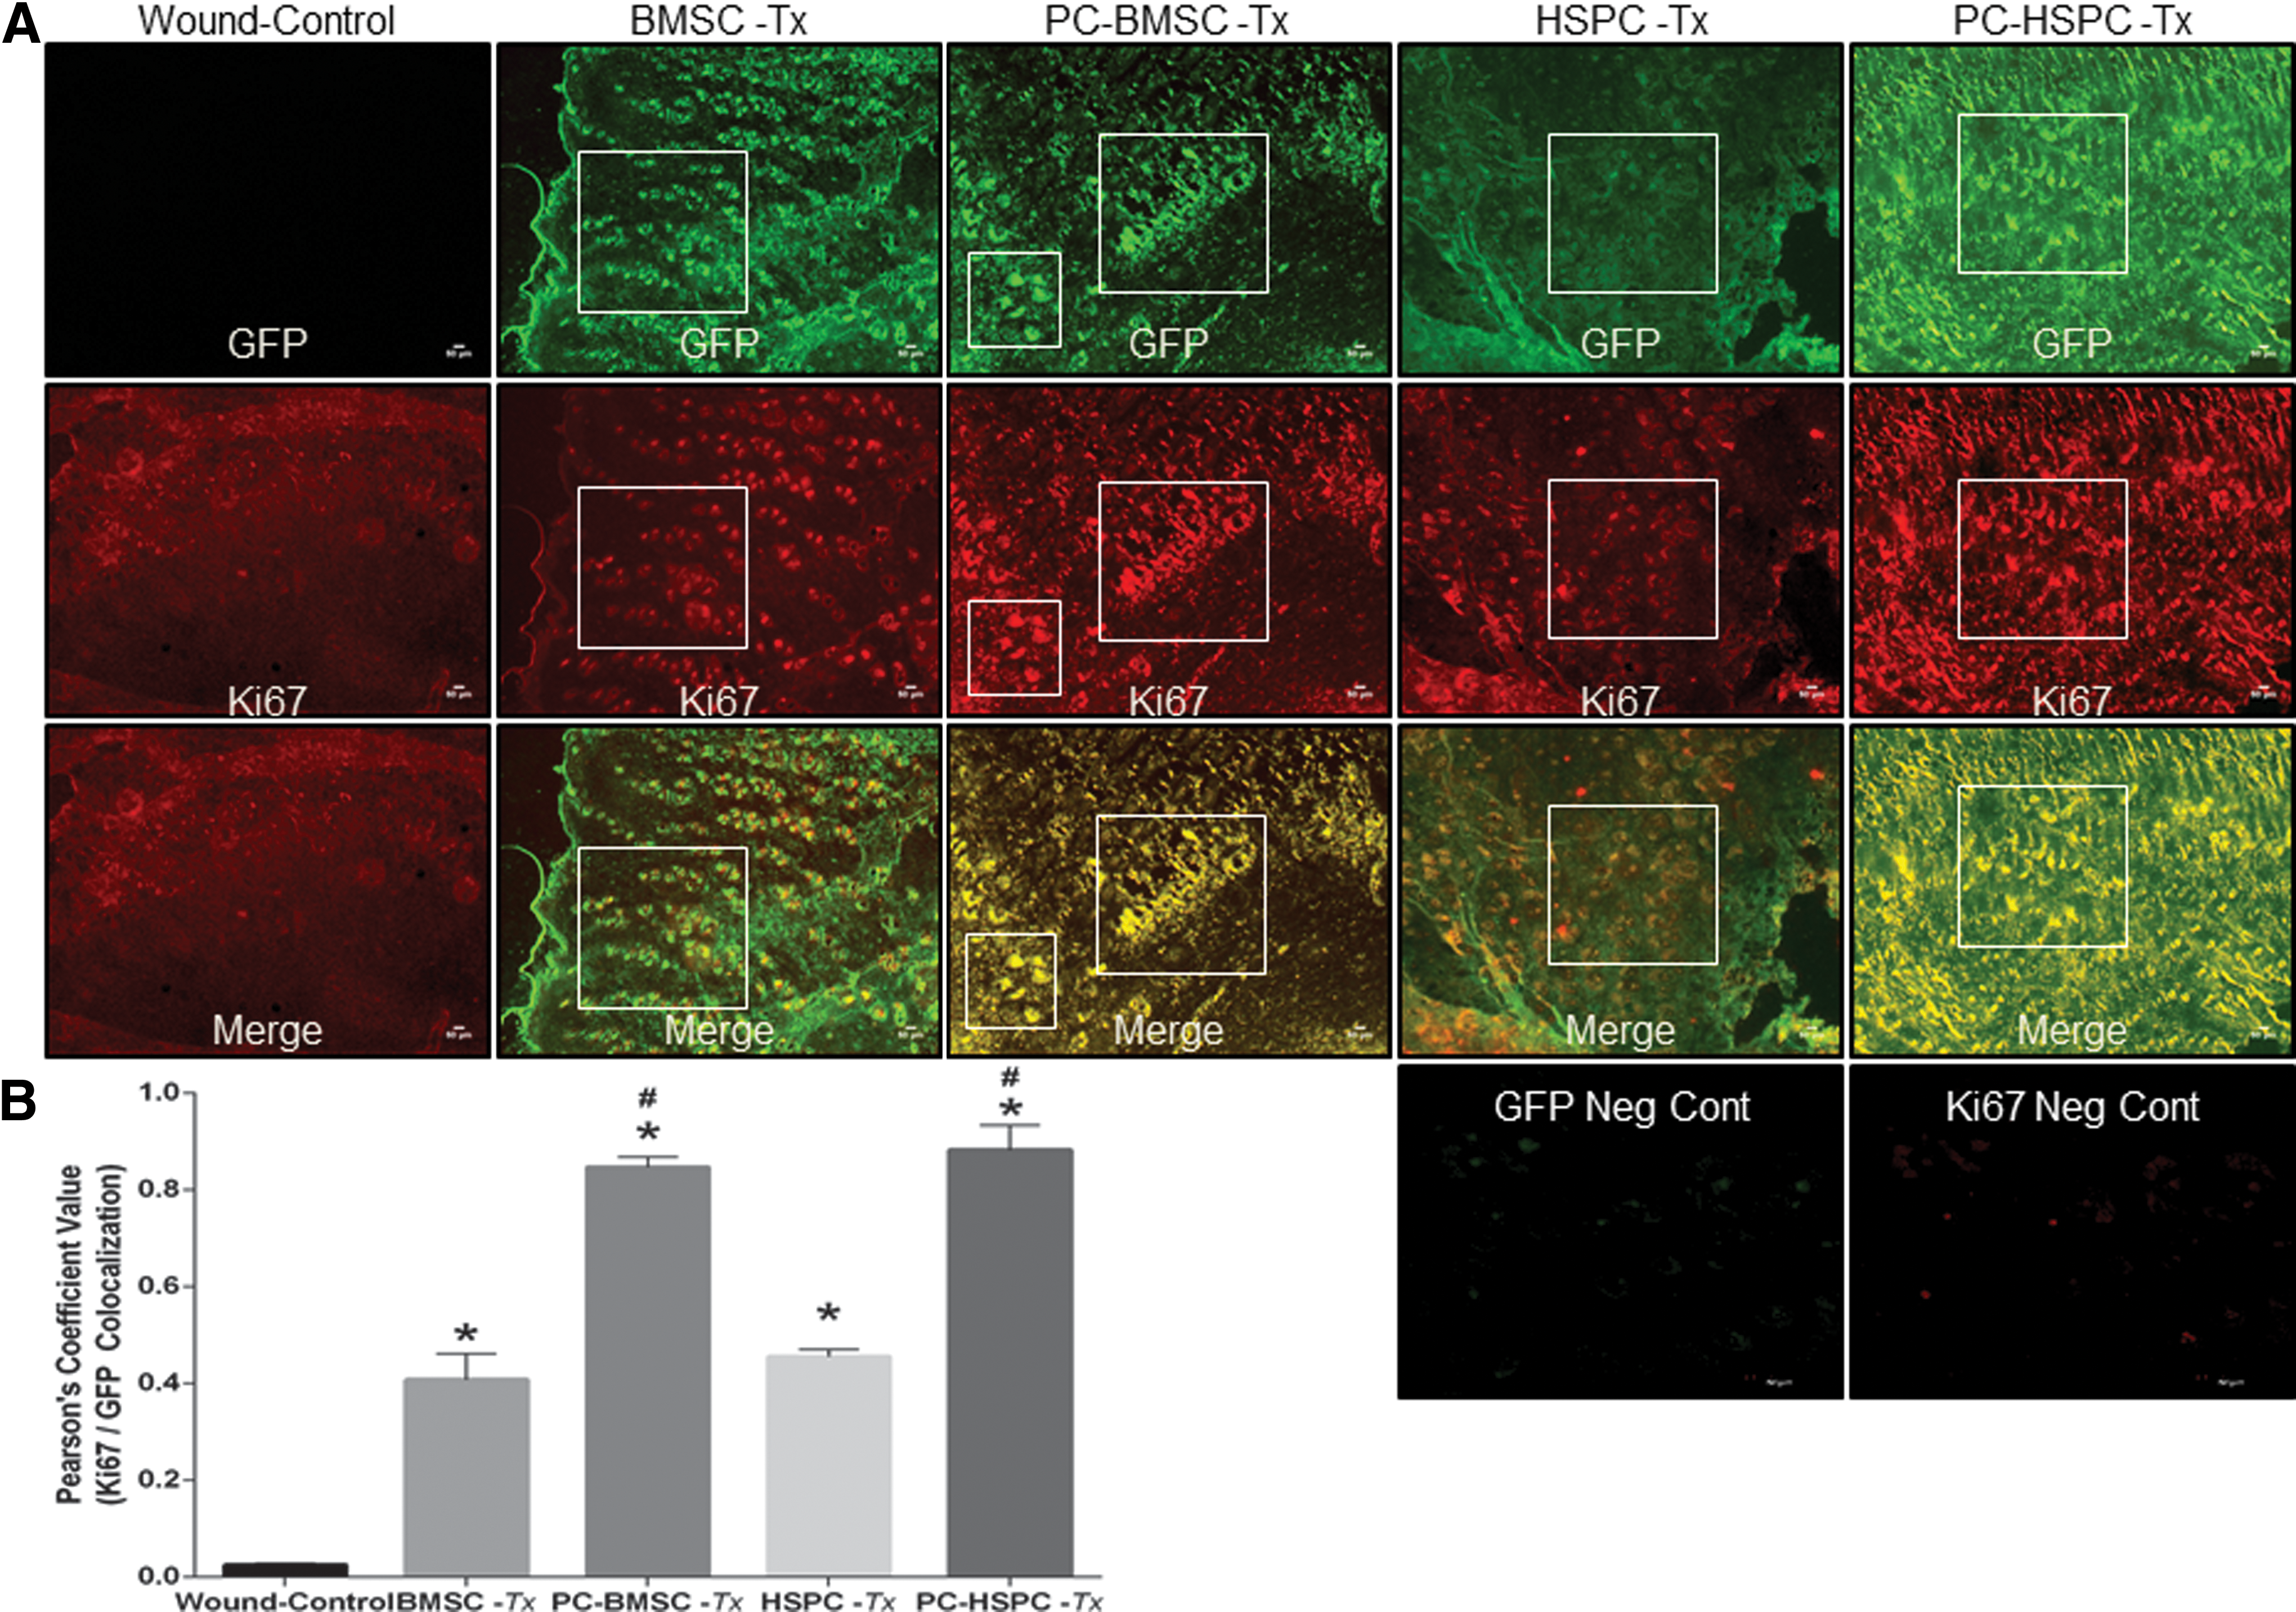
Preconditioned BMSC and HSPC enhance proliferation during wound tissue regeneration
Next, to evaluate proliferation of the transplanted GFP+ cells, we performed co-staining with Ki67 (proliferation marker) for both BMSCs and HSPCs. At postsurgery day 7, an increased co-staining of GFP/Ki67 in preconditioned BMSCs and HSPCs transplanted groups was observed as compared with naive stem cells transplanted, respectively, and wound-control groups (Fig. 8A). Separately, we have also preconditioned both BMSCs and HSPCs with high oxidative stress (100 μM H2O2) but it led to a decrease in proliferation (data not shown) at the wound site. These observations suggest the therapeutic relevance of 10 μM H2O2 but not high concentration-induced oxidative stress in a translational outcome of BMSC and/or HSPC-mediated wound tissue repair/regeneration.
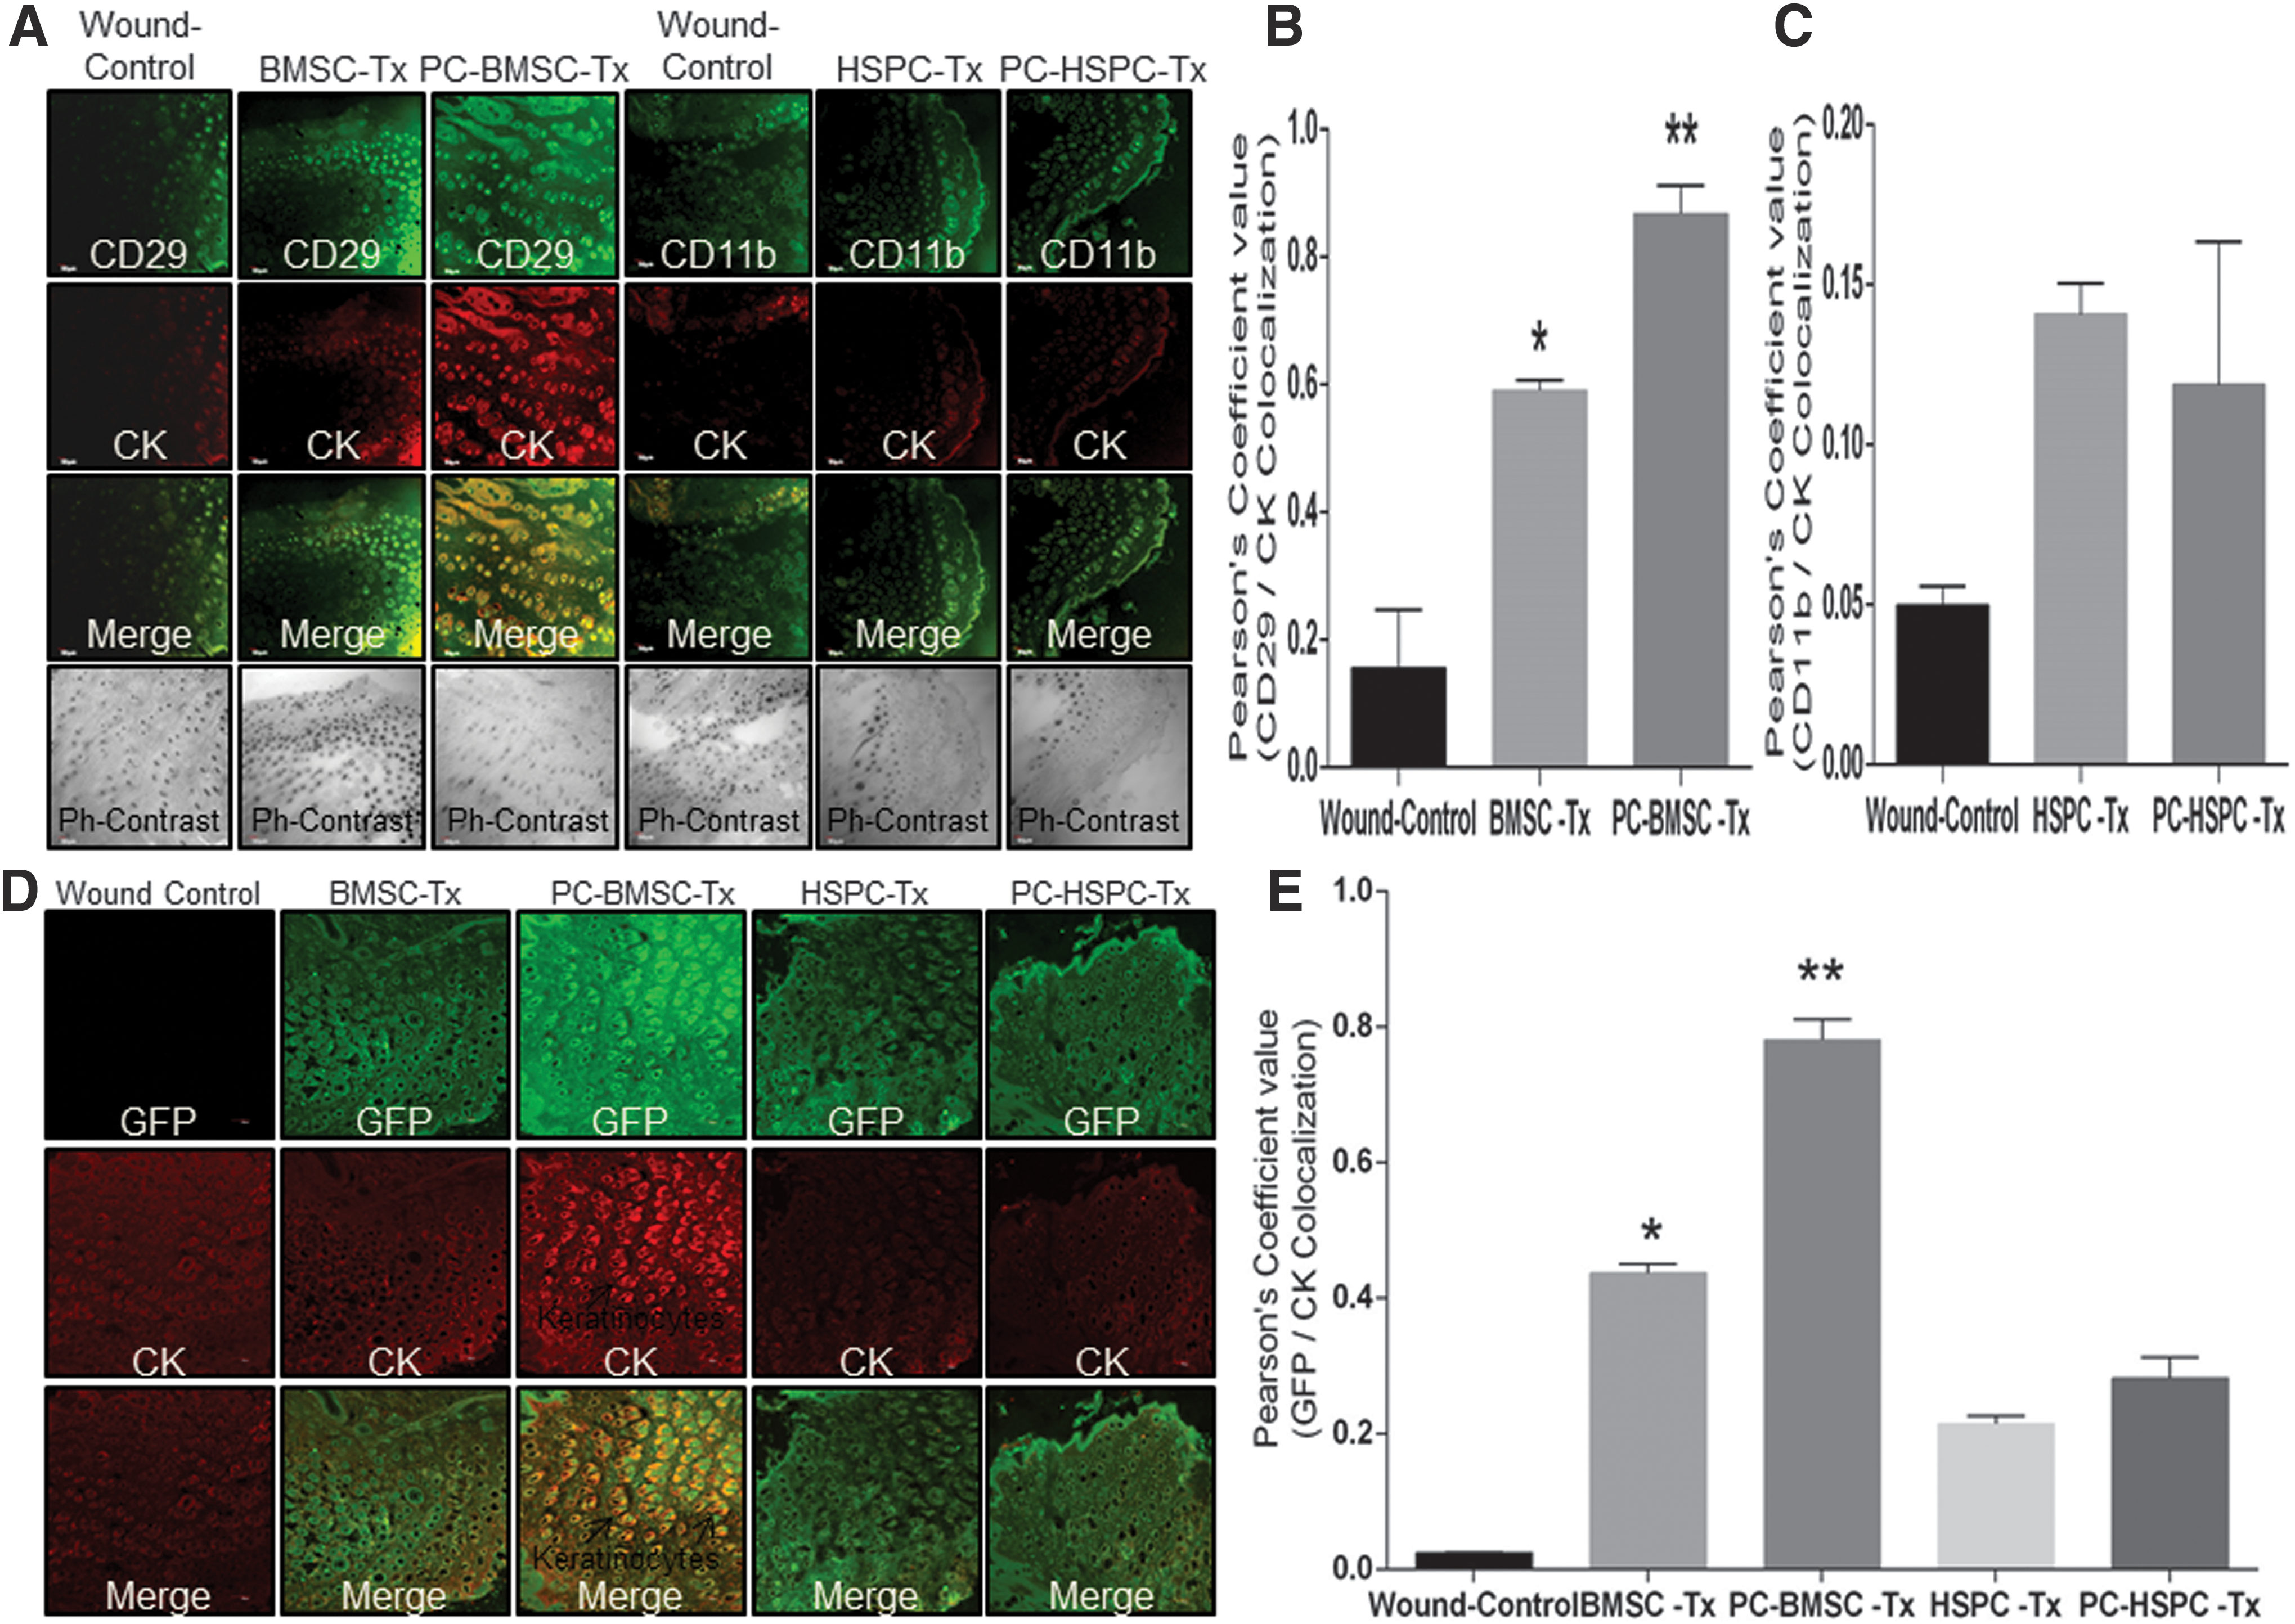
Preconditioned BMSC but not HSPC enhance re-epithelialization during wound tissue regeneration
Further, to determine whether he transplanted stem cells at the wound site could contribute to keratinocyte generation, a co-immunostaining with cytokeratin (CK) and CD29 (BMSC) or CD11b (HSPC) was performed. At postsurgery day 7, a significantly high number of CD29 and CK co-stained cells were observed in preconditioned BMSCs as compared with naive BMSCs transplanted groups or wound-control groups (Fig. 9A left panel, Quantitation of co-localization-Fig. 9B). However, naive or preconditioned HSPCs did not depict similar CD11b and CK co-stained cells (Fig. 9A right panel, Quantitation of co-localization-Fig. 9C). To further confirm whether transplanted cells contributed to keratinocyte generation, we transplanted GFP-labeled cells and performed a co-staining of GFP and CK. At postsurgery day 7, preconditioned BMSCs transplanted wounds depicted a significant increase in double-positive (both GFP-green and CK-red) staining as compared with BMSCs transplanted groups or wound controls (Fig. 9D, quantification-9E, lower magnification images-Supplementary Fig. S10A, quantification of co-localization-Supplementary Fig. S10B). However, preconditioned HSPCs transplanted wounds did not depict co-localization of GFP-CK-expressing cells (Fig. 9D, E). These observations suggest that BMSCs but not HSPCs contribute to an increased number of keratinocytes, thereby leading to cutaneous regeneration.
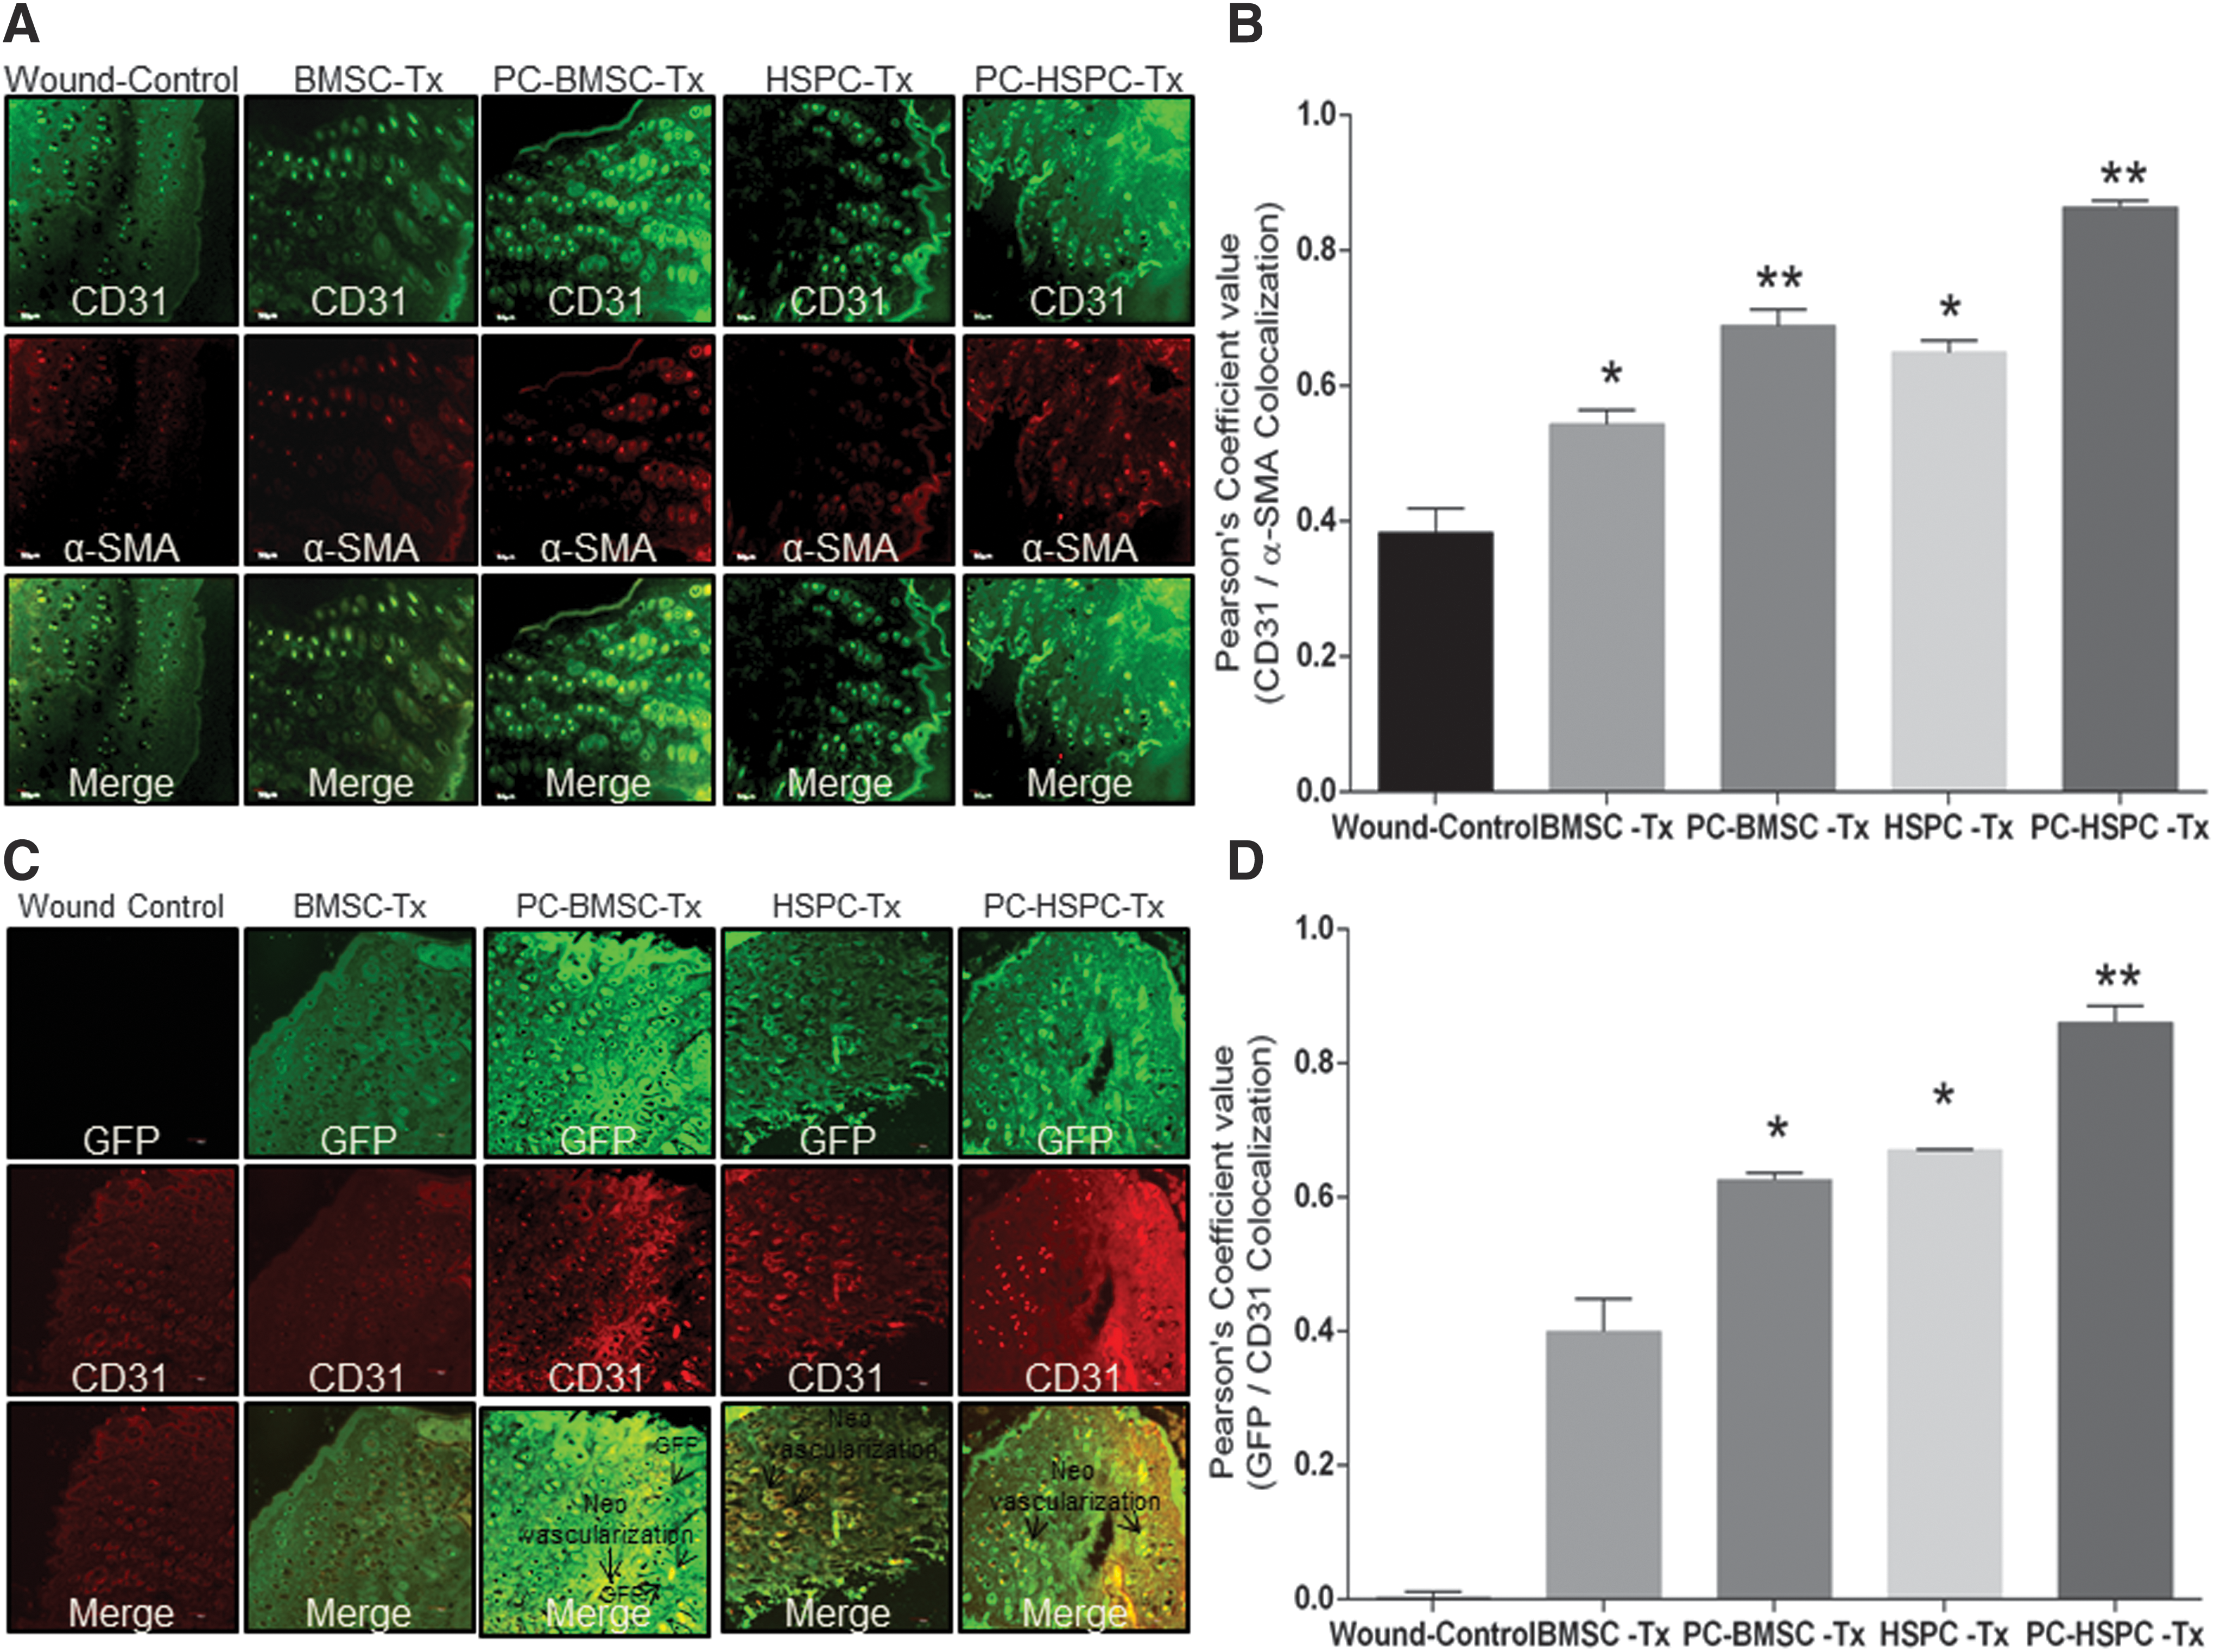
Preconditioned BMSC and HSPC enhance vascularization during wound tissue regeneration
Finally, neo-vascularization, a crucial step for tissue regeneration, was evaluated by using immunofluorescence staining of CD31 and α-SMA at the regenerated tissue sections. Both preconditioned BMSCs and HSPCs transplanted wounds depicted an increased number of endothelial cells at the wound site as compared with naive BMSCs or HSPCs as well as the wound control at postsurgery day 7 (Fig. 10A, Quantitation of co-localization-Fig. 10B). Further, to evaluate the participation of these transplanted cells in vasculogenesis, tissue sections were co-stained with GFP and CD31. Preconditioned HSPCs transplanted groups depicted an increased co-staining of GFP-CD31 as compared with naive HSPCs or the wound control, indicating the involvement of HSPCs in neo-vascularization (Fig. 10C, Quantitation of co-localization-Fig. 10D, lower magnification images-Supplementary Fig. S10C, quantification of co-localization-Supplementary Fig. S10D). Preconditioned BMSCs transplanted wound sections depicted an increased CD31 staining as compared with naive BMSCs or the wound control but the GFP-expressing cells were not fully co-localized with CD31-expressing cells, suggesting the paracrine effect of BMSCs that leads to enhanced vascularization at the wound bed. This indicates the plausible role of these transplanted preconditioned stem cells in potentiating neo-vascularization to enhance wound tissue regeneration.
Discussion
Bone marrow-derived BMSCs and HSPCs are important components of regenerative medicines because of their immense potential of self-renewal, lineage-specific differentiation, as well as trans-differentiation capability that maintain homeostasis and tissue repair (18). During tissue injury, the adult stem cells migrate from the bone marrow and often get exposed to numerous kinds of stress in the injury microenvironment (24). Among these, oxidative stress plays an important role, leading to damage of cellular bio-macromolecules (42). However, as mentioned earlier, level or content of the stressor defines the effect in the cell. Thus, in this study, we have evaluated the role of 10 μM and 100 μM concentration of H2O2-induced oxidative stress in BMSCs and HSPCs physiology. Our observations described the following: (i) 10 μM concentration of H2O2 significantly increased proliferation of both BMSCs and HSPCs by activation of JNK-FOXO3a survival signaling pathways, leading to upregulation of catalase; (ii) exogenous Vit. C and its metabolized product, DHA reverted this H2O2-induced proliferative phenotype; (iii) mechanistically, pharmacological inhibition as well as molecular silencing of catalase sensitized these cells by decreasing cell proliferation when exposed to even 10 μM concentration of H2O2; (iv) 10 μM but not 100 μM concentration of H2O2, induces binding of FOXO3a to catalase promoter; and (v) in an in vivo model of wound tissue healing, transplantation of preconditioned BMSCs or HSPCs with 10 μM concentration of H2O2 depicted an increase in proliferation of engrafted cells, re-epithelialization, and neo-vascularization, thereby potentiating wound tissue repair and regeneration.
Stress tolerance capacity varies extensively between stem cells and its differentiated counterparts. Literature suggests that BMSCs derived from human skin tissue as compared with skin fibroblasts are more susceptible to high concentrations of ROS at a millimolar range (0.5–2 mM) and depict decreased viability. This susceptibility to high ROS has been attributed due to a less efficient antioxidant defense system in the stem cells (30). These studies are in alignment with our observations of reduced expression of antioxidant-catalase gene and protein in BMSCs and HSPCs when exposed to high (100 μM) concentrations of H2O2. Similarly, other studies also depicted a deleterious effect of high ROS (50 μM) generated at the ischemic site postmyocardial infarction on the adhesion properties of BMSCs (37). Although reports vary in terms of high concentrations of oxidant used, which ranges from high micromolar to low millimolar, a harmful effect on stem cell viability is generally observed. Also, adult stem cells isolated from different tissue sources might depict different susceptibility toward ROS. In contrast, studies depicting the effect of low concentrations of ROS on physiology of these adult stem cells, BMSC and HSPC are lacking in the literature. Similar to our observation, a short-term pretreatment of BMSCs with a low dose of H2O2 has depicted an increased therapeutic angiogenesis in the hind limb ischemia model (19). Also, Le Belle et al. have revealed the highly proliferative neural stem cell population that possesses a high amount of endogenous ROS (21). Accumulation of ROS-mediated DNA damage has been recently implicated for HSCs to exit quiescence and differentiate into hematopoietic lineages (44). Thus, the diverse cellular responses of stem cells such as proliferation, migration, differentiation, and adhesion are modulated by a low ROS concentration.
ROS such as H2O2 at a low concentration can act as a second messenger to regulate signal transduction (38). The signaling role of H2O2 is achieved when its concentration increases above the steady-state threshold level and remains elevated for a substantial period to oxidize its protein effectors. In our study, H2O2-induced AKT activation was limited to 10 μM concentration only. However, oxidative stress-induced activation of JNK depicted a dose-dependent effect in mediating its vital role. By contrast, H2O2 at a higher concentration activates p38 MAPK to decrease viability and expansion of HSPCs, resulting in premature senescence phenotype or apoptosis (15). Our data suggest a crucial role for the AKT and JNK signaling pathways.
Cells have their own antioxidant defense mechanisms to safeguard themselves from the permissible toxic levels of free radicals generated due to oxidative stress. We and others have observed that with an increase in H2O2 concentration to sub-lethal levels (100 μM), the expression of mitochondrial isoform of SOD (SOD2) was induced in both BMSCs and HSPCs (2). This corresponded equally at activity level as SOD activity was further increased at sub-lethal levels, implicating its potential antioxidant role only during extreme stress conditions. On the contrary, our results of catalase mRNA expression in both BMSCs and HSPCs depicted similar findings as published earlier where the transcriptional activation of catalase was induced at a low concentration and inhibited at the sub-lethal concentration of H2O2 (35). This observation along with increased proliferation at 10 μM but not 100 μM (sub-lethal) H2O2 concentration in both BMSCs and HSPCs make it more obvious to ponder on a possible role of catalase in this phenomenon.
To comprehend the underlying molecular mechanism involved in upregulation of catalase, we studied the translocation of transcription factor FOXO3a, as it is a downstream target of both AKT and JNK signaling pathways (14). FOXOs belong to the superfamily of proteins that regulate the cell fate by modulating the expression of genes involved in oxidative stress (14). A recent study depicted a direct upregulation of catalase by FOXO3a in cardiac hypertrophy (39). Although the protective role of FOXO3a in quiescent or slow cycling cells was observed by the antioxidant responsive gene, SOD2 upregulation (17), our study mechanistically suggests a catalase upregulation by FOXO3a in a transcriptional-dependent manner at 10 μM concentration of H2O2. Although activation of AKT occurs along with JNK at low oxidative stress, it is imperative to consider a JNK-FOXO3a-mediated upregulation of antioxidant gene, catalase whereas AKT activation leads to cell proliferation (Supplementary Fig. S11A). However, catalase inhibition by 3-AT or CAT-siRNA at low oxidative stress leads to increased ROS level that inactivates AKT and, subsequently, cell proliferation. An increase in ROS to sub-lethal levels led to higher nuclear translocation of FOXO3a but decreased catalase expression and an increase in SOD2 level, indicating a plausible role of other mechanisms.
Stem cells are emerging as a promising tool for the regenerative therapies correcting tissue damage. However, survival of transplanted stem cells is often compromised due to the harsh injury microenvironment that reduces their therapeutic efficacy (36). Cutaneous wound repair is a multifaceted process involving inflammation, angiogenesis, granular tissue formation, fibroblast proliferation, re-epithelialization, and matrix remodeling (22). Perturbations in the earlier mentioned sequential steps of wound repair result in chronic or delayed wound healing in diseases such as diabetes. Literature suggests that topical administration of side population of hematopoietic stem cells as compared with main population of bone marrow cells on excisional wounds led to a better wound closure in diabetic mice as well as wild-type mice (5). Similarly, BMSCs have been reported to promote wound healing in incisional full-thickness wound healing by enhanced proliferation, differentiation, angiogenesis, and re-epithelialization during wound closure (46). H2O2 at a differential concentration for preconditioning BMSCs and cardiac progenitor cells has shown improved angiogenesis and better myocardial architecture (33). Our study too depicted that preconditioning of stem cells with 10 μM H2O2, a concentration at which a significantly high proliferation of these cells was observed in vitro, was a promising strategy for increasing stem cell expansion of engrafted cells, in vivo. In addition, our studies are consistent with the previous literature where only BMSCs but not CD34+ cells such as our isolated HSPCs that are also CD34+ cells (8) contributed to keratinocytes and re-epithelialization (46). Similarly, our study also depicts a substantial fraction of GFP-expressing BMSCs but not HSPCs engrafted in the wound appearing to co-express cytokeratin, suggesting a differentiation of transplanted cells into keratinocytes. Finally, the process of angiogenesis is important for supplying the survival factors for keratinocytes and newly formed granulation tissue. As demonstrated earlier by other workers, BMSC transplantation induces neo-vascularization at the wound site in a paracrine manner by secreting angiogenic growth factors (46). Our results also corroborate with the existing literature as the preconditioned BMSCs transplanted group exhibited increased CD31-expressing cells in close proximity of GFP-positive cells, whereas the preconditioned HSPCs transplanted group depicted increased GFP-CD31 co-expressing cells, suggesting their participation in neo-vascularization. The study suggests transplantation of preconditioned BMSCs and HSPCs with 10 μM H2O2-mediated low oxidative stress as a therapeutic approach for enhanced wound tissue repair (Supplementary Fig. S11B).
Materials and Methods
Exposure to H2O2
BMSCs and HSPCs seeded at a different seeding density depending on the assay type were treated with vehicle or 1, 10, and 100 μM of H2O2/well. Separately, BMSCs and HSPCs were incubated with equimolar concentrations of (10 μM) H2O2 along with antioxidants, Vit. C or DHA (45). In a different set of experiments, BMSCs and HSPCs were also incubated with 10 μM H2O2 along with signaling pathway blockers. Further, to evaluate the loss or gain function of catalase on the cells in the presence of H2O2, both molecular and pharmacological interventions were applied. Cells were treated with either 3 Amino Triazole (3-AT, a catalase inhibitor) or transfected with siRNA specific toward mouse catalase gene for evaluating the effect of catalase inhibition. Similarly, cells were additionally treated with PEG-catalase to evaluate the effect of exogenous catalase (32).
Cell proliferation by colony formation, growth curve, and BrdU assay
For assessing cell expansion, BMSCs and HSPCs were plated for colony formation assay, bromodeoxyuridine (BrdU) cell proliferation assay, and growth curves at different seeding densities as described earlier [10]. For colony formation assay, BMSCs and HSPCs were cultured in complete Mesencult and Methocult medium (StemCell Technologies), respectively (16, 26). DNA synthesis was measured by using a BrdU Cell Proliferation Kit (Roche) by following the manufacturer's protocol (20). For growth curve assay, BMSCs and HSPCs were seeded at a cell density of 3 × 10³ cells per well in at least triplicate with treatments as described earlier (8, 34).
Quantitative real-time PCR
Overall, 1.0 μg of total RNA extracted from treated BMSCs and HSPCs was used for cDNA synthesis from different treatment groups by using Oligo (dT) primer of First-Strand cDNA Synthesis kit (Thermo Scientific) and mouse-specific forward and reverse primers of antioxidant and cell cycle genes (Supplementary Table S1) for quantitative real-time RT-PCR (qRT-PCR) by using Applied Biosystems Step-One Plus PCR System (Applied Biosystems) as described earlier (7). Amplification of mouse-specific eukaryotic 18S rRNA and β-Actin was used in the same reaction of all samples as an internal control. All the target gene expression was normalized to eukaryotic 18S rRNA mRNA and shown as the fold change (7).
Intracellular and extracellular ROS detection
Intracellular production of ROS was detected by fluorescence probe 2′,7′-dichloro-fluorescin diacetate (DCFH-DA; Sigma-Aldrich) as previously described (49). Briefly, after treatment for 24 h or 48 h, cells were washed 3 × with PBS and then incubated in 10 μM DCFH-DA for 30 min at 37°C. The fluorescence intensity of DCF (2′, 7′-dichlorofluorescein) was determined on a Perkin Elmer Spectrofluorometer at excitation and emission wavelengths of 480 and 538 nm, respectively, and background fluorescence was subtracted by using appropriate controls. For extracellular ROS detection, Hydrogen Peroxide Cell-based assay kit was used according to the manufacturer's protocol (Cayman Chemicals). After 24 h and 48 h of treatment, fluorescence intensity was measured at 530 nm (excitation wavelength) and 590 nm (emission wavelength).
Total glutathione measurements
To measure the intracellular oxidative status of stem cells, the reduced glutathione (GSH) content of each cellular protein sample was measured according to the manufacturer's protocol (Cayman Chemicals).
Biochemical assay for catalase, SOD, and GPX
Antioxidant responses of BMSCs and HSPCs were evaluated by measuring the activity of antioxidant enzymes: catalase, SOD, and GPX. SOD and GPX activity was measured according to the protocols provided in the Cayman assay kit (Cayman Chemicals). Catalase activity was measured by using a modified protocol of Aebi.
Immunoblot analysis
Cellular protein was extracted from BMSCs and HSPCs treated with H2O2 alone or in different treatment regimes as described earlier, was subjected to separation by using sodium dodecyl sulfate-poly acrylamide gel electrophoresis, transferred to PVDF membranes (Amersham Biosciences), and immunoblotted by using antibodies against phosphorylated and pan signaling markers: ERK-1/2, AKT, JNK, and p38 MAPK (ThermoScientific). Signals were detected by using the chemiluminescence ECL detection system (Merck Millipore), and visualization was performed by using G: Box (Syngene, Cambridge, United Kingdom). Quantification of protein bands was performed by using NIH Image J software (7).
Cellular immunofluorescence staining—FOXO3a
Immunofluorescent staining was performed according to a reported procedure (13). In brief, treated cells were washed with cold PBS, fixed with 4% formaldehyde for 10 min at 37°C, permeabilized with 0.5% Triton X-100 for 5 min at room temperature, and fixed with methanol for overnight at 4°C. After washing with PBS, the cells were blocked with 1% BSA for 1 h and incubated with primary antibody FOXO3a in 1% BSA for 2 h at room temperature. Further, secondary anti-rabbit PE conjugated antibody was added. Nuclei were stained with 4′,6-diamidino-2-phenylindole (DAPI) contained in the mounting medium (Amresco). Confocal images were obtained with an Olympus FV1000 confocal microscope (Olympus Corp.) by using the 40 × oil immersion lens. NIH Image J software was used to quantitate nuclear localization.
SiRNA silencing—catalase
For catalase knockdown, cells were transfected with siCAT or scrambled negative control according to the manufacturer's instructions by using lipofectamine 2000 (Invitrogen) (7). The cells were further treated for 48 h in the presence or absence of H2O2 and were utilized for different assays.
AKT kinase assay
BMSC and HSPCs were cultured and treated as described earlier for 48 h at 37°C. Kinase activity was measured by using the In-Cell AKT ELISA Kit (Pierce), according to the manufacturer's protocol.
Transient transfection of DN plasmids—AKT and JNK
DN AKT and JNK mutant plasmids (Addgene) were transfected transiently by using lipofectamine 3000 (Invitrogen). Cells were cultured in low serum-containing medium for 48 h followed by various treatment regimes. After 48 h, cells were trypsinised and utilized for different assays.
ChIP assay
ChIP assay was performed according to the manufacturer's protocol (Millipore). Cells were treated with different treatment regime, washed, and cross-linked with 1% formaldehyde at 37°C for 10 min. Cells were lysed in buffer containing a protease inhibitor cocktail, and they were sonicated by using Bioruptor (Diagenode) followed by preclearing with Protein A Agarose/Salmon sperm DNA slurry. Immunoprecipitation was performed overnight at 4°C with 5 μg of anti-Foxo3a antibody, and this was followed by sequential washings with low-salt immune complex buffer, high-salt immune complex buffer, LiCl immune complex buffer, and, finally, with TE buffer. DNA was eluted from the beads and recovered by phenol/chloroform extraction and ethanol precipitation. The purified DNA was used as a template for PCR amplification.
BMSC or HSPC transplantation-mediated wound healing
Bone marrow-derived BMSCs and HSPCs isolated from C57BL/6J mice as described earlier (8) were used for autologous transplantation in the wound model as naive or post in vitro treatment using a low (10 μM) concentration of H2O2 (preconditioned, PC) and/or pretreatment with an equimolar concentration (10 μM) of H2O2 and Vit. C. In a separate set of experiments, isolated BMSCs and HSPCs were labeled with GFP lentivirus for 24 h followed by replacement with fresh medium. After 48 h, the cells were selected by “puromycin-selection” and infected cells were used as naive or preconditioned as described earlier for transplantation. An excision wound splinting model was generated in 8–10 week-old C57BL/6J mice as described earlier (43). Briefly, two symmetrical full-thickness excisional wounds were created beside the midline by using a 5-mm-diameter sterile biopsy punch. Transplantation of bone marrow-derived naive or preconditioned BMSCs and HSPCs was performed by injecting intradermally (id.; 0.7 × 10⁶ cells) and on the wound surface (0.3 × 10⁶ cells) as previously described (9). A silicone splint was placed so that the wound was centered within the splint. An immediate-bonding adhesive was used to fix the splint to the skin, and Tegaderm was placed over the wounds. Animal experimentation protocols were approved by the Institutional animal ethics committee (approval No. IICT/CB/AD/25/06/2014/13 and IICT/CB/AD/26/08/13/08).
Quantification of wound closure
Representative digital images of wound healing depicting wound area at different time points postwound generation (days 0, 3, and 7) in wound-control, BMSC, PC-BMSC, HSPC, and PC-HSPC transplanted groups were taken. Time to wound closure was defined as the time at which the wound bed was completely re-epithelialized and filled with new tissue. Wound area was measured by tracing the wound margin and calculated by using an image analysis program (NIH Image J software). The results were represented as percent wound closure (1), calculated in comparison with the original size of the wound as mentioned later and described earlier (3):
The inside edge of the splint exactly matched the edge of the wound, so that the splinted hole was used to represent the original wound size. Mice were euthanized on postsurgery day 7; skin samples including the wound and surrounding skin were harvested by using a using a 10-mm biopsy punch.
Histological and immunofluoroscence analysis of the regenerated wound
Regenerated wound tissue samples from various treatment groups were fixed in 4% paraformaldehyde. Cross-sections of wound tissue mounted on slides were stained with hematoxylin-eosin, Masson's Trichrome, and DHE. The regenerated wound tissue was separately homogenized in respective assay buffers to evaluate catalase, SOD, and GPX assay. RNA extracted from wound tissue samples was utilized for gene expression of oxidative stress-associated genes by using qRT-PCR analysis. Separately, frozen wound tissue sections from the various groups were stained with specific antibodies against catalase, GFP, Ki67, CD29, CD11b, CK, CD31, and αSMA (Cell Signaling Technologies). Isotype control antibodies were used for negative controls. Sections were examined with Olympus FV1000 and FV10i confocal microscope. Co-localization of different cellular markers was evaluated by using the intensity correlation analysis of NIH Image J software, and data were represented as Pearson's coefficient value (1).
Vit. C in wound healing
Parenteral administration of Vit. C (250 mg/kg body wt, i.p. per day) (6) was carried out for 7 days in the excisional splinting wound model transplanted with BMSCs or HSPCs. The mice were monitored for wound healing, engraftment of transplanted cells, and histological analysis.
Statistical analysis
Data from experiments performed with repeated BMSC/HSPC isolations at least thrice were statistically analyzed by taking mean ± standard deviation (SD) or standard error of mean (SEM). To determine the difference between treatment group and their respective controls, Graph Pad prism version 6.05 was used to obtain statistical significance by using one- or two-way ANOVA followed by Tukey's multiple-comparison test. Blots and photomicrographs represent experiments reproduced at least thrice with similar results.
Footnotes
Acknowledgments
A.D. acknowledges the funding provided by CSIR, Ministry of Science and Technology, Government of India, XIIth Five-year Plan Project # CSC-0111. Fellowships provided by ICMR and UGC are gratefully acknowledged by N.D. (ICMR-SRF) and R.G. (UGC-SRF). The authors also acknowledge the technical assistance provided by Suresh Y. in assisting flow cytometric analysis and T. Ramalinga Murthy in confocal imaging.
Author Disclosure Statement
The authors have no conflicts to disclose.
Abbreviations Used
References
Supplementary Material
Please find the following supplemental material available below.
For Open Access articles published under a Creative Commons License, all supplemental material carries the same license as the article it is associated with.
For non-Open Access articles published, all supplemental material carries a non-exclusive license, and permission requests for re-use of supplemental material or any part of supplemental material shall be sent directly to the copyright owner as specified in the copyright notice associated with the article.