
Abstract
Aims:
Acute kidney injury (AKI) is increasingly recognized as a major risk factor leading to progression to chronic kidney disease (CKD). However, the diagnostic tools for predicting AKI to CKD progression are particularly lacking. Here, we tested the utility of contrast-enhanced ultrasound (CEUS) for predicting progression to CKD after AKI by using both mild (20-min) and severe (45-min) bilateral renal ischemia-reperfusion injury mice.
Results:
Renal perfusion measured by CEUS reduced to 25% ± 7% and 14% ± 6% of the pre-ischemic levels in mild and severe AKI 1 h after ischemia (p < 0.05). Renal perfusion returned to pre-ischemic levels 1 day after mild AKI followed by restoration of kidney function. However, severe AKI caused persistent renal perfusion impairment (60% ± 9% of baseline levels) accompanied by progressive renal fibrosis and sustained decrease in renal function. Renal perfusion at days 1–21 significantly correlated with tubulointerstitial fibrosis 42 days after AKI. For predicting renal fibrosis at day 42, the area under the receiver operating characteristics curve of renal perfusion impairment at day 1 was 0.84. Similar changes in the renal image of CEUS were observed in patients with AKI–CKD progression.
Innovation:
This study demonstrates that CEUS enables dynamic and noninvasive detection of renal perfusion impairment after ischemic AKI and the perfusion abnormalities shown by CEUS can early predict the progression to CKD after AKI.
Conclusions:
These results indicate that CEUS enables the evaluation of renal perfusion impairment associated with CKD after ischemic AKI and may serve as a noninvasive technique for assessing AKI–CKD progression. Antioxid. Redox Signal. 27, 1397–1411.
Introduction
A
Acute kidney injury (AKI) is increasingly recognized as a major risk factor leading to progression to chronic kidney disease (CKD). However, the diagnostic tools for predicting AKI to CKD progression are particularly lacking. This study demonstrates that contrast-enhanced ultrasound (CEUS) enables the evaluation of renal perfusion impairment associated with CKD after ischemic AKI and justifies the future clinical investigations for AKI to CKD progression. Moreover, CEUS combines the advantages of being fast, safe, noninvasive, and repeatedly applicable at the bedside, and without affecting renal function. Therefore, this technique may be particularly useful in clinical settings with renal ischemia-reperfusion injury.
Renal ischemia-reperfusion injury (IRI) is a common cause of AKI (1, 4). The acute decrease in renal perfusion that serves to initiate and extend injury in the early phases of AKI is believed to be critical to the pathophysiology of ischemia-induced AKI (19, 31). Depending on its severity, the impairment of renal perfusion is associated with subsequent chronic structural alterations that may predispose survivors of an episode of AKI to developing progressive CKD (5, 19).
Although alterations in renal perfusion are believed to play a causative role in the pathogenesis of AKI, the diagnostic tools for assessing renal perfusion are particularly lacking. Contrast-enhanced ultrasound (CEUS) is a novel imaging technique that is associated with low mechanical index ultrasonography and microbubble-based contrast agents (35). These microbubbles, when injected into the bloodstream, allow visualization of vascular structures and, with contrast-specific imaging modes, detection of blood flow at the capillary level (35). Recent CEUS-derived approaches allow quantification of blood flow in several organs, including the kidney (24, 38). Several studies that test the potential application of CEUS as a diagnostic tool for measuring renal perfusion have shown promising results (36, 37, 39).
This study was designed to test the hypothesis that renal perfusion measured by CEUS may serve as a noninvasive approach to determine the AKI severity and to early predict the subsequent chronic kidney damage. For this purpose, the study determined whether CEUS can show serial changes in renal perfusion and whether the imaging results can predict the progression to CKD after AKI in a mouse model of acute renal IRI and in human AKI.
Results
Severity of renal injury correlates with subsequent renal fibrosis
To prepare an IRI model with different severity of AKI, mice were subjected to bilateral clamping of renal pedicles for 10–45 min. As shown in Figure 1, a short time (≤15 min) of ischemia did not induce detectable renal injury or a rise in serum creatinine, whereas 20-min clamping resulted in mild AKI. A longer time (≥30 min) of renal ischemia caused significant acute tubular injury and a rise in serum creatinine. There was no significant morphological change in glomeruli in both mild and severe IRI 1 day after ischemia (Supplementary Fig. S1A; Supplementary Data are available online at

To determine the impact of AKI severity on the development of renal fibrosis, mice treated with 20- or 45-min IRI served as mild or severe AKI. Acute tubular injury was more pronounced after severe than mild IRI, and most prominent damages occurred in the corticomedullary junction at day 1 (mild vs. severe IRI: 1.2 ± 0.2 vs. 2.6 ± 0.2; p < 0.01, Fig. 2A, B). Seven days after IRI, kidney morphological changes were restored after 20-min IRI. However, mice with severe AKI showed progressive chronic kidney injury, characterized by persistent cellular inflammation, and increases in glomerulosclerosis index, fibrosis score, and overexpression of extracellular matrix, particularly after 7 days (Fig. 2 and Supplementary Figs. S1–S4).

Consistent with the histological data, serum creatinine levels were significantly elevated 1 day after 20-min IRI, but they returned to baseline levels at day 3. However, 45-min IRI caused more severe AKI, with higher levels of serum creatinine (mild vs. severe AKI at day 1: 1.5 ± 0.3 vs. 2.2 ± 0.4 mg/dl, p < 0.01) that remained higher than pre-ischemic levels at day 3 (sham vs. severe AKI: 0.4 ± 0.1 vs. 1.1 ± 0.2 mg/dl, p < 0.01, Fig. 2G). These results suggest that the severity of the injury is a key determinant dictating the divergent outcomes of ischemia-induced AKI, as 20-min IRI leads to near totally recovery whereas 45-min IRI triggers progression to CKD.
Renal perfusion measured by CEUS predicts progressive renal fibrosis in IRI mice
CEUS was used to measure the renal perfusion in sham mice, mice with mild (20-min IRI) and severe (45-min IRI) AKI before operation and at various time points after operation. Intra-observer and inter-observer reproducibility testing displayed good reliability of measurements (intraclass correlation coefficients [ICC] 82%, 95% confidence interval [CI] 72%–88%, and ICC 79%; 95% CI 68%–86%).
As shown in Figure 3A and B, a significant decline in relative renal cortical perfusion compared with pre-ischemic values was found 1 h after ischemia in both groups with mild and severe AKI, with a more pronounced decline in mice with 45-min IRI. Renal perfusion reduced to 25% ± 7% of baseline levels (range, 15%–35%) in mild AKI, and to 14% ± 6% of baseline levels (range, 10%–20%) in severe AKI (p < 0.01). Renal cortical perfusion had returned to baseline levels at day 1 after mild IRI (90% ± 8% of baseline levels; range, 76%–99%), but it remained compromised until day 42 after severe injury (60% ± 9% of baseline levels, range, 50%–75%; p < 0.05). The trend of changes in renal medullary perfusion was similar to that in the cortex, but the magnitude was more pronounced in the medulla compared with the cortex (Supplementary Fig. S5). There was no difference in renal perfusion among sham groups at different time points post-operation (Fig. 3).

The alterations of renal perfusion determined by CEUS were validated by changes in effective renal plasma flow (ERPF) measured by para-aminohippurate (PAH) clearance (Fig. 3C) and glomerular filtration rate (GFR) measured by inulin clearance (Fig. 3D). The ERPF and GFR at day 42 were significantly lower in mice with severe AKI than that in animals with mild injury (mild vs. severe AKI: ERPF, 880 ± 172 vs. 496 ± 157 μl/min; GFR, 192 ± 17 vs. 131 ± 12 μl/min, p < 0.05).
To examine the correlation between renal perfusion and subsequent chronic kidney damage, mice were submitted to various durations of ischemia. Renal cortical perfusion relative to pre-ischemic level was determined 1 day post-ischemia by CEUS. Animals were sacrificed at day 42 for histological assessment. As shown in Figure 4A–D, ischemic strike for 30 min or longer resulted in significant impairment of renal perfusion and subsequent tubulointerstitial fibrosis. The ratio of renal cortical perfusion at day 1 to pre-ischemic level closely correlated with the renal fibrosis score, accumulation of collagen I, and chronic tubulointerstitial injury index at day 42 (Fig. 4E–G, p < 0.01). Significant correlation was observed between the renal perfusion at day 1–21 and renal fibrosis score at day 42 (Table 1).
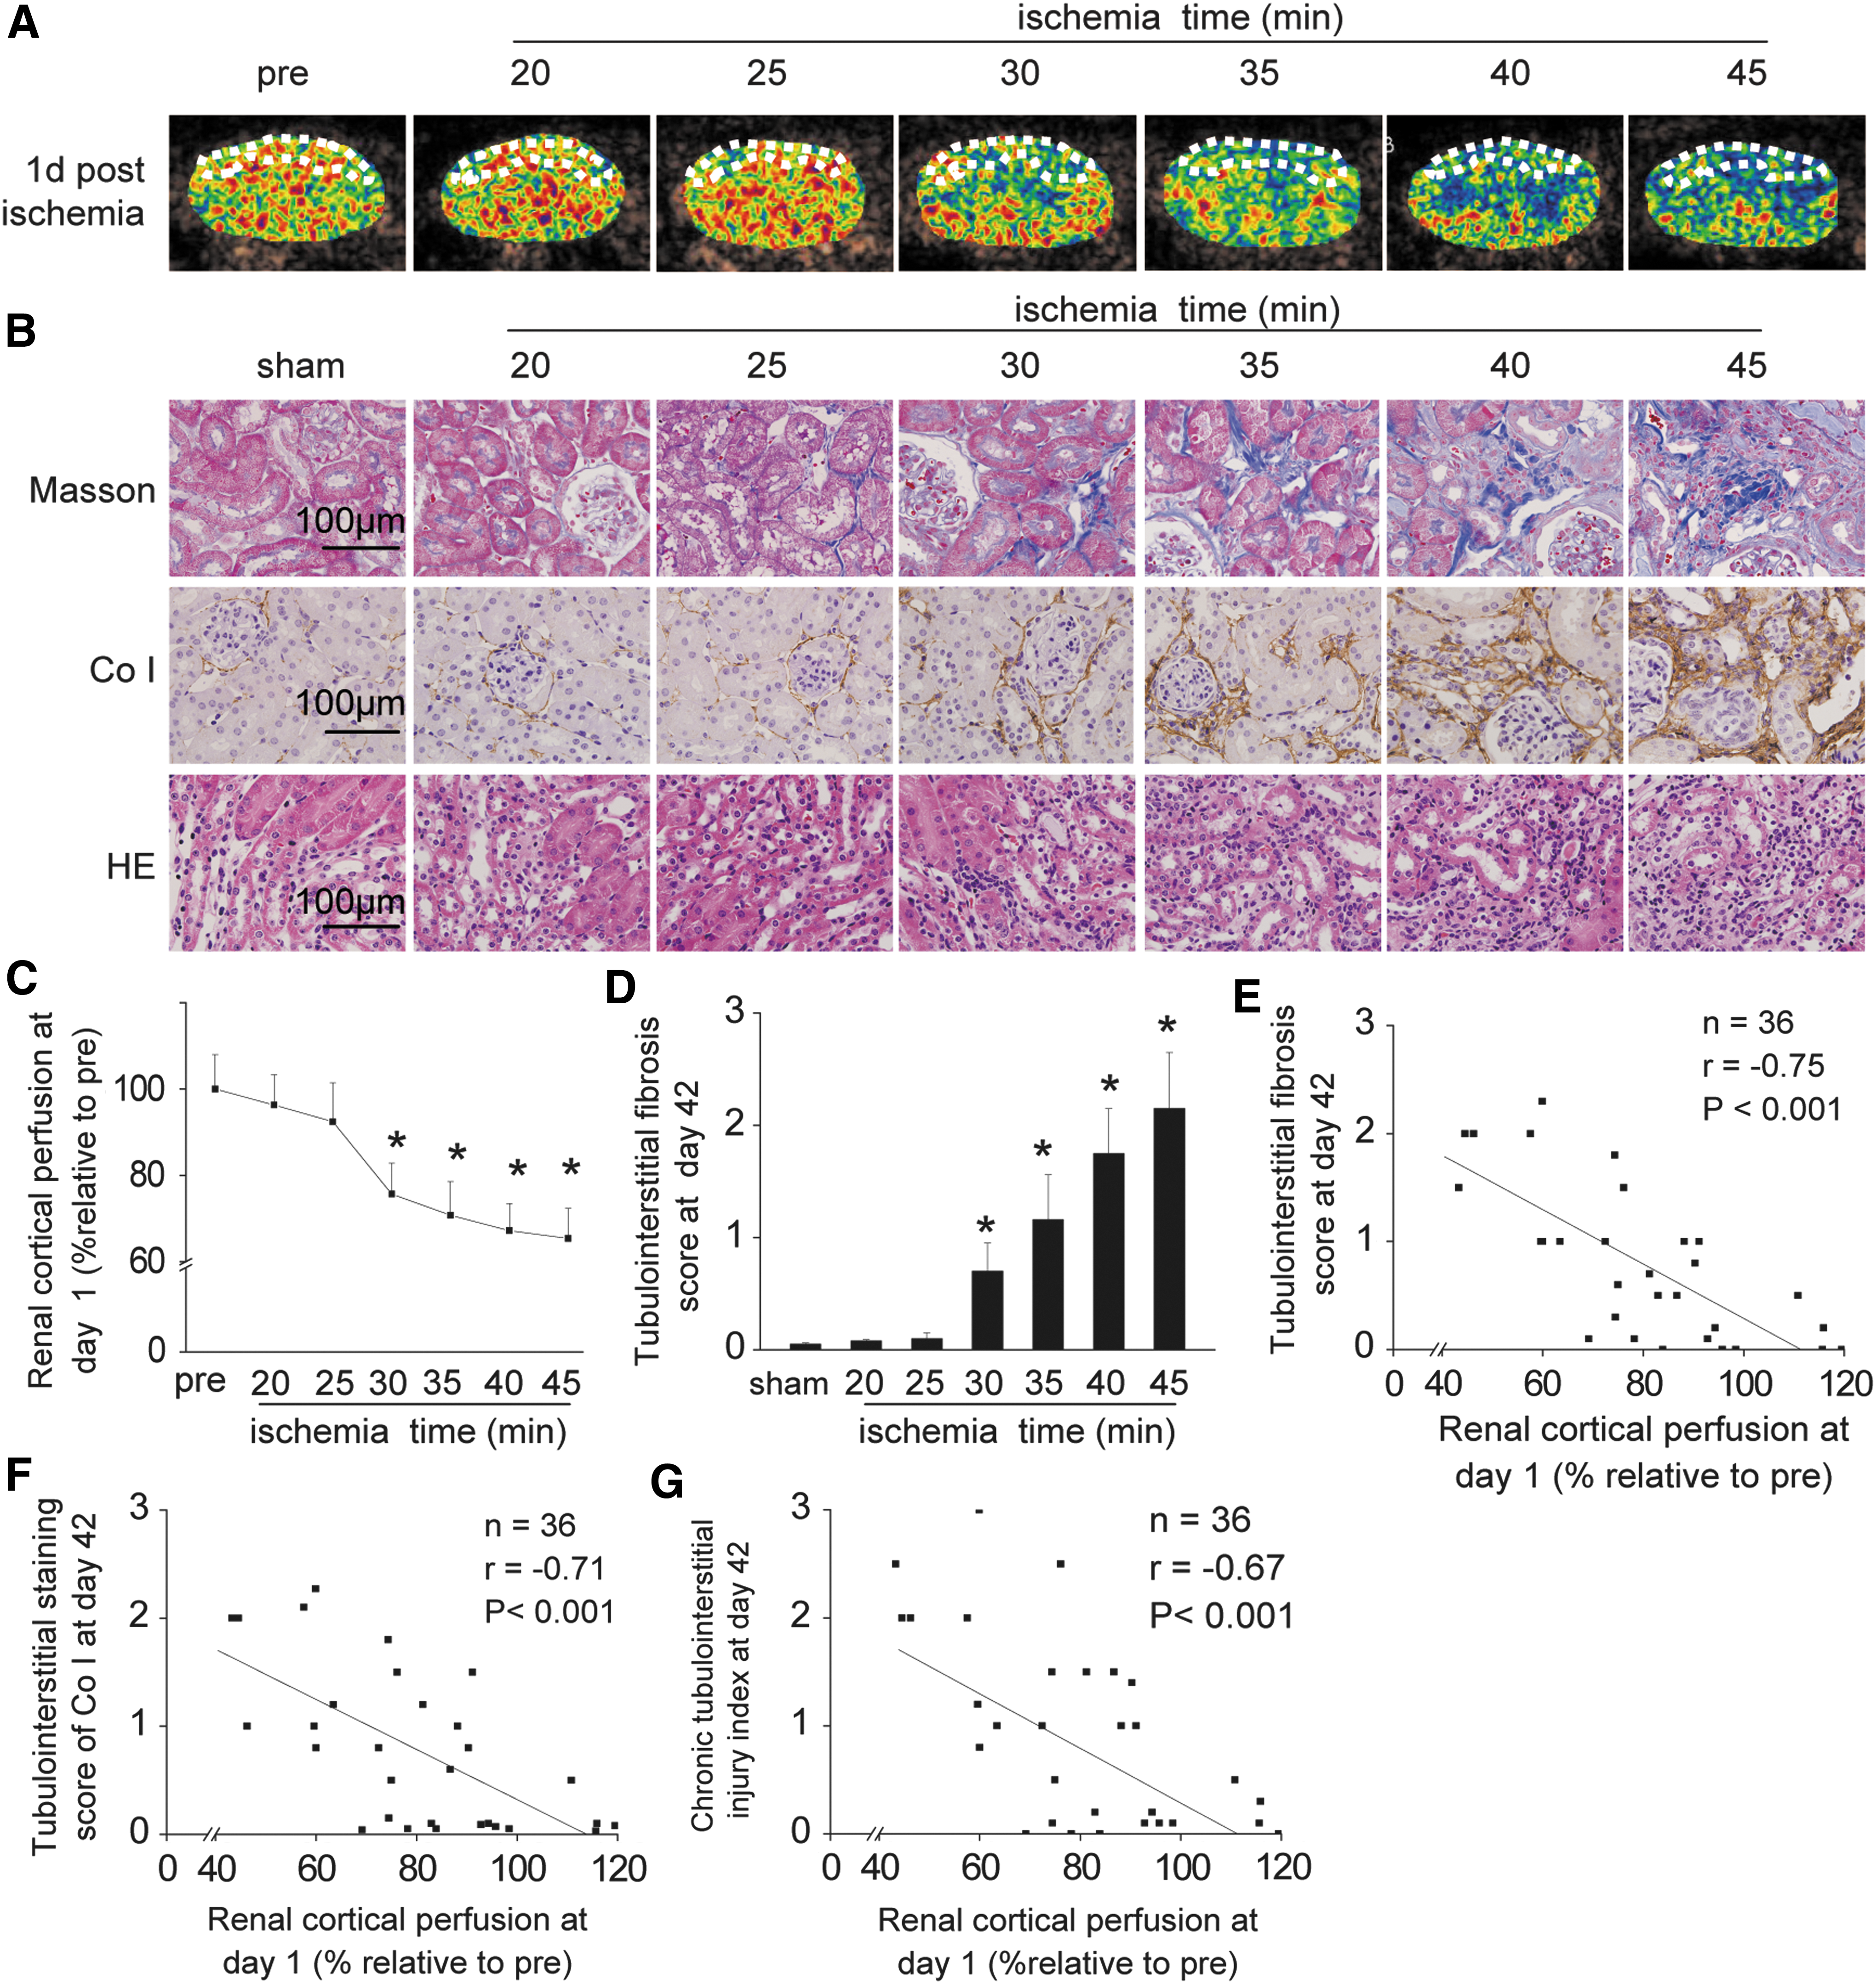
To evaluate the performance of renal perfusion impairment for predicting renal fibrosis at day 42, a receiver operating characteristics (ROC) curve was generated. The areas under the ROC curve at 1–21 days for predicting renal fibrosis were 0.84–0.89 (Table 2). These data suggest that renal perfusion impairment assessed by CEUS can predict subsequent progressive renal fibrosis after ischemic AKI.
Decrease in renal cortical perfusion (%) = [1 − (post-ischemia level/pre-ischemia level)] × 100.
ROC, receiver operating characteristics; CI, confidence interval.
To examine whether repeated CEUS impact kidney function, renal structure and GFR were determined in both sham and severe AKI mice with or without repeated CEUS. As shown in Supplementary Figure S6, repeated CEUS neither modify the renal structure nor affect renal function.
CEUS evaluates renal microvascular inflammation and injury in IRI mice
Renal expression of P-selectin was monitored in vivo by using microbubbles labeled with anti-P-selectin antibody before IRI and at five time points after 20- or 45-min IRI. Endothelial injury, as reflected by P-selectin expression measured by targeted imaging of CEUS, significantly increased in renal microvasculature 1 h after IRI (Fig. 5A, C). Compared with mild AKI, severe AKI caused a more pronounced upregulation of P-selectin (mild vs. severe AKI: 18 ± 4 decibel [dB] vs. 29 ± 5 dB, p < 0.01). A similar trend was observed in an immunohistochemical study using anti-P-selectin antibody (Fig. 5B, D).

To validate the finding of CEUS, the capillary in the renal coritcomedullary junction was examined under a transmission electron microscope (Fig. 6). Mild AKI induced swelling of endothelial cells and stasis of red blood cells in the capillary lumen 1 h after IRI and recovered at day 1 (Fig. 6A). By contrast, severe AKI caused more pronounced injury in endothelial cells (Fig. 6B), characterized by swelling of endothelial cells, disruption of the capillary wall, and adhesion of leukocytes to endothelial cells 1 day after AKI. In mice subjected to 45-min IRI, significant tubulointerstitial fibrosis was found 21 days after AKI. These data suggest that the CEUS-derived technique allows assessment of the severity of endothelial injury in renal microvasculature after AKI.

CEUS evaluates changes in renal perfusion in human AKI
To further illustrate the feasibility of CEUS in human AKI, renal cortical perfusion was measured by CEUS in 40 patients (mean age, 59 ± 7 years; male: female = 1:1) who were admitted for acute decompensated heart failure (ADHF) and in eight age- and gender-matched healthy volunteers (mean age, 57 ± 7 years; male: female = 1:1). The characteristics of ADHF patients are presented in Table 3. All of the patients had no pre-existing CKD, diabetes, urinary tract obstruction, contrast medium exposure, cardiogenic shock, and heart failure after cardiac surgery.
ADHF, acute decompensated heart failure; AKI, acute kidney injury; CKD, chronic kidney disease; NYHA, New York Heart Association.
In patients with ADHF, CEUS was performed on admission and at the day of AKI diagnosis in those who developed AKI during their hospitalization. As shown in Figure 7A and B, the ADHF patients who subsequently developed AKI exhibited a significant lower renal cortical perfusion on admission (48 ± 8 dB/s, n = 26) compared with healthy controls (60 ± 10 dB/s, n = 10) and those who had ADHF but did not develop AKI (57 ± 9 dB/s, n = 14).

We compared degree of reduction in renal cortical perfusion at day of AKI diagnosis (% relative to admission values) between patients with and without AKI–CKD progression. We found a more pronounced decrease in renal cortical perfusion in the group with AKI–CKD progression (26% ± 9%), compared with those without AKI–CKD progression (15% ± 5%), suggesting that a severe reduction in cortical perfusion measured by CEUS at the time of AKI diagnosis may predict subsequent AKI–CKD progression (Fig. 7A, C).
Discussion
This study showed that CEUS enables dynamic and noninvasive detection of renal perfusion impairment after ischemic AKI in mice. The degree of perfusion impairment measured by CEUS closely correlates with the severity of renal histological injury and predicts the subsequent development of progressive chronic fibrosis. A pilot study conducted in patients with acute cardio-renal syndrome suggests an ability of CEUS for predicting AKI–CKD progression in human AKI.
The mouse model of bilateral ischemic IRI, which we used for the study, is a well-established model of AKI (33). We found that in mice with identical age, sex, and genetic backgrounds, the severity of ischemia per se is the single most crucial factor for determining the ultimate outcome of AKI, with 20-min IRI triggering transient AKI followed by renal recovery, whereas a more than 30-min IRI resulted in severe AKI followed by progression to CKD. Therefore, by merely altering the duration of ischemia, one can establish both models of mild AKI with full recovery and severe AKI destined to progressive CKD in the same setting. Such IRI models with divergent renal outcome provide an unparalleled system to test the utility of CEUS for predicting AKI–CKD progression after AKI.
One important finding is that the degree of renal perfusion impairment, determined by CEUS, differs significantly depending on the AKI severity. Previous studies have shown that CEUS-derived parameters reflect changes in renal perfusion (36, 37). However, correlation between changes in renal perfusion measured by CEUS and AKI severity has not been established. Our study found that although a significant decrease in renal perfusion was observed early after ischemia in both mild and severe AKI, the magnitude and the speed of recovery were quite different between these two IRI models, with divergent outcomes. In animals with mild AKI, renal perfusion nearly full recovered at day 1; whereas in severe AKI, decreased renal perfusion persisted until the end of the observation period at day 42. Such an impairment of renal perfusion was validated by reduced ERPF and GFR.
Moreover, although renal perfusion changed in the same pattern in the cortex and medulla, the changes of renal perfusion have been shown to be of a greater magnitude in the medulla. The difference in perfusion changes between the renal cortex and medulla is possibly attributed to their susceptibility to ischemic injury. Renal medulla is particularly sensitive to prolonged or intermittent episodes of hypoperfusion, since hypoxia already exists under normal conditions (6, 34).
More importantly, we found that perfusion abnormalities shown by CEUS significantly correlated with the severity of tubulointerstitial injury and the likelihood of renal recovery. A transient decline in renal perfusion after mild AKI led to complete resolution of the injury and full recovery of kidney function, whereas a sustained reduction in renal perfusion after severe AKI was associated with maladaptive alterations such as increasing inflammation, overexpression of extracellular matrix, and progressive renal fibrosis, suggesting that the degree of renal perfusion impairment measured by CEUS at an early stage of AKI can predict the severity of renal fibrosis at day 42. These results are consistent with those found by Hueper et al. (20) using an arterial spin-labeling magnetic resonance imaging, and they suggest that renal perfusion impairment predicts AKI–CKD progression in ischemic AKI.
In addition to quantifying the changes in renal perfusion, CEUS may enable the noninvasive evaluation of endothelial injury in renal microvasculature during AKI. By using microbubbles targeted to P-selectin, we observed an upregulation of this adhesion molecule in renal microvessels after IRI. Similar to the perfusion impairment, endothelial injury was more pronounced in mice with severe AKI compared with mild IRI. Supporting the finding, an electron microscopy study showed transient swelling of endothelial cells in peritubular capillaries during mild AKI; whereas in severe AKI, sustained endothelial injury was observed particularly in the peritubular capillary network. These acute derangements in the renal microvascular structure can have functional consequences for microvascular flow and permeability that ultimately lead to the disruption of endothelial integrity, microvascular rarefaction, and progressive CKD (3, 5, 19).
Monitoring of renal perfusion by CEUS could be beneficial in clinical practice. Alteration in renal perfusion is an early and critical parameter in the pathogenesis of AKI and progression to CKD (2, 13). In this study, we evaluated the diagnostic value of CEUS in the assessment of renal perfusion in patients with ADHF, a clinical setting with low cardiac output state. Compared with those who developed AKI but recovered at discharge, patients who had sustained renal dysfunction at day 90 showed a more pronounced reduction in renal perfusion at the day of AKI diagnosis, suggesting that the detection of renal perfusion at an early stage of AKI may predict subsequent AKI–CKD progression. Early identification of the patients who are at a high risk of progressing to CKD would help physicians to plan and initiate the appropriate management to improve renal safety of therapies, and to develop renal-preserving treatments.
CEUS combines the advantages of being fast, safe, noninvasive, and repeatedly applicable at the bedside, and without affecting renal function; therefore, it may be particularly useful in clinical settings such as low cardiac output states, septic shock, and hypovolemia. Studies in renal transplant (16, 22) and hepatorenal syndrome (39) have shown its potential utility in clinics. However, the effectiveness of CEUS for predicting AKI–CKD progression in nonischemic settings (such as drug-induced AKI) remains unclear and needs further studies.
This study has some limitations. First, since the absence of a generally recognized gold standard of renal microvascular perfusion, we used ERPF, a parameter reflecting renal plasma blood flow, as the control. Although it is not a perfect comparator, it may provide additional information for changes in renal perfusion in response to IRI. Second, CEUS measurements can be interfered with by some factors, including scanner settings, patient factors, and bubble properties and handling (17, 42). However, good reliability of measurements has been obtained through improvement of the operation process. Third, the sample size is relatively small in the human study. Further studies in a larger cohort of populations would be helpful to extend our observations.
In conclusion, CEUS is able to determine the severity of AKI and to quantify the impairment of renal perfusion over time in ischemic AKI. Renal perfusion, measured by CEUS at an early stage of ischemic AKI, correlates with the acute renal histological and functional impairment, and it predicts the subsequent development of CKD with excellent performance. These findings justify the future clinical investigations for AKI–CKD progression.
Materials and Methods
Mouse ischemic AKI model
The animal experiments were approved by the Institutional Animal Ethics Committee. Six-week-old male C57BL/6J mice weighting 20–24 g were purchased from the Institutional Animal Experiment Center. Mice were subjected to bilateral renal IRI by an established protocol, as previously described (29).
To prepare an IRI model with different severity of AKI, mice were subjected to bilateral clamping of the renal pedicles for 10, 15, 20, 25, 30, 35, 40, or 45 min. Briefly, mice were anesthetized with an intraperitoneal injection of 50 mg/kg pentobarbital sodium during the operations. Mice were hydrated with warm saline on a heating pad (40°C), keeping body temperatures constantly at 37–38°C until full recovery from anesthesia. An atraumatic vascular clamp was placed on both renal pedicles for 10–45 min to induce IRI. Sixteen mice received sham operation without clamping of the renal pedicles. The success of the AKI model was confirmed by increased serum creatinine concentration and renal histological damage 24 h after ischemia (7).
To further determine the impact of AKI severity on renal fibrosis, mice treated with 20- or 45-min ischemia served as mild or severe AKI.
In this study, surgery was performed by the same investigator, and all other experimental conditions were identical between the two groups except the ischemia time.
Evaluation of renal perfusion and microvascular injury by CEUS in IRI mice
Preparation of microbubbles
For perfusion imaging, lipid-shelled perfluorobutane microbubbles (mean diameter 2.4 ± 0.6 μm) were prepared by sonication of a gas-saturated aqueous suspension of 2 mg/ml distearoylphosphatidylcholine and 1 mg/ml polyoxyethylene-40-stearate (47).
For targeted imaging of microvascular P-selectin expression, a biotin rat anti-mouse CD62P monoclonal antibody (RB40.34; BD Biosciences, San Jose, CA) (MBPS) or an isotype control antibody (R3-34; BD Biosciences) (MBISO) was conjugated to biotinylated lipid-shelled perfluorobutane microbubbles as previously described (46).
The successful binding of the primary antibodies with microbubbles was confirmed by the fluorescence-labeled antibody (Alex fluor-594; Jackson ImmunoResearch, West Grove, PA) (46) (Supplementary Fig. S7A–D). Then, a parallel plate flow chamber (GlycoTech) was used to assess the binding efficacy of MBPS or MBISO to the P-selectin antigen immobilized on a culture dish (25). Briefly, 5.5 × 10⁶/ml MBPS or MBISO were drawn through the flow chamber by using a dedicated pump (Harvard Apparatus, Holliston, MA). Shear stress of the microbubble fluid was fixed in the physiological condition of microcirculation at 0.6 dyn/cm2 (41). Five minutes after continuous infusion of MBPS or MBISO, there were 172 ± 9 MBPS per microscope field binding to 1000 ng/ml P-selectin coated in the dish, whereas only 11 ± 3 MBISO were observed under the same condition (Supplementary Fig. S7E).
To evaluate the sensitivity of antigen-antibody binding, different concentrations of P-selectin were coated on the dish and their binding efficacies to MBPS were assessed. As shown in Supplementary Figure S7F, the number of MBPS per microscope field binding to P-selectin increased as the concentration of P-selectin coated on the dish increased. All these data confirmed that the MBPS prepared in this study have stable physical characteristics with good specificity and sensitivity.
Ultrasound
Nonlinear contrast imaging was performed by using a high-resolution ultrasonic imaging system (Sequoia 512, Acuson; Siemens, Malvern, PA) with a 15L8 HD probe. Initially, regular B-mode images were used to visualize the right kidney and to position the maximum longitudinal parasagittal imaging plane, including the entire kidney. Then, the ultrasonographic probe was fixed in place with an iron support, ensuring the constant imaging plane throughout the image acquisitions. Image depth, focus, gain, and frame rate were optimized for each mouse/patient during baseline and held constant for all further measurements. All scans were performed by one experienced operator.
Renal perfusion imaging
Renal perfusion was assessed during continuous infusion of microbubbles via the tail vein at a speed of 4 × 10⁷/min as previously described (44). A high mechanical index burst (mechanical index = 1.9) was given to destroy microbubbles when the contrast enhancement had reached a steady state (about 2 min after the initial of the infusion) (15). Then, low mechanical-index imaging mode (mechanical index = 0.17) was used until and 30 s after the contrast agent concentration reached the plateau. Images were recorded 5 s before bubble destruction and during microbubble infusion.
Data were transferred to an offline computer and analyzed by using the software (Yabko MCE2.7; University of Virginia, Charlottesville, VA). This software took into account the exact compression algorithm and supplies absolute value data in a linear, uncompressed scale (45). Region of interest (ROI) selection was performed on color-coded maps and confirmed on B-mode images and contrast images (15, 24). To minimize the influence of local heterogeneities, ROIs were chosen to be large enough to represent the cortex and medulla (Supplementary Fig. S8A) as previously described (15, 24). The cortex that was only intermittently visible because of breathing or other artifacts was not included in the ROI. The selected ROIs in the cortex and the medulla were maintained (placed automatically) on the consecutive images.
Video intensity (VI), which is the “brightness” of pixels in the ultrasound image in dBs, within each ROI was automatically measured from every frame by using the available offline image analysis software (Yabko MCE2.7). Infusion time versus VI data was then generated and fit to an exponential function: y = A (1 − e−βt ) (Supplementary Fig. S8C). Here, t is the infusion time, A is the plateau VI, which is an index of blood volume, and β is the rate constant that is a measure of mean microbubble velocity. Renal perfusion was calculated by multiplying A and β (44) and expressed as percentage relative to pre-ischemic value. All the analyses were performed by two independent sonographers who were blinded to individuals and time.
Pixel-by-pixel analysis was performed on each imaging clip by using the software (Yabko MCE2.7), yielding color-coded perfusion maps of the kidney, representing relative blood volume in each pixel.
Renal targeted imaging of P-selectin
Renal expression of P-selectin was monitored in vivo by using microbubbles labeled with anti-P-selectin antibody. Targeted imaging was performed as previously described (14). Mice were injected in random order twice with a bolus of 100 μl of saline containing either 5 × 10⁶ MBPS or 5 × 10⁶ MBISO via tail veins. Ultrasound imaging was initiated 8 min after each injection. These microbubbles were destroyed by application of a high mechanical-index burst. Ten seconds later, imaging frames were recorded to capture the influx of freely circulating microbubbles. The image reflecting retained microbubbles was created by subtracting the frames obtained after a 10 s pulsing interval from the initial frame by using the analysis software (Yabko MCE2.7). Background-subtracted VI was automatically measured from this image.
Pixel-by-pixel analysis was performed on each imaging clip by using the software (Yabko MCE2.7), yielding a color-coded image of the kidney, representing VI in each pixel.
Renal histological analysis in IRI mice
Acute and chronic tubulointerstitial injury
The kidneys were dissected and processed for hematoxylin-eosin staining as previously described (23). Acute tubular injury was assessed by determining the degree of renal tubular necrosis at the corticomedullary junction by using a grading scale of 0–4, as previously described (23).
The index of chronic tubulointerstitial injury was determined according to the percentage of damaged (tubular atrophy or dilatation, interstitial macrophage infiltration or fibrosis) area in the renal cortex and corticomedullary junction as previously described (28), Briefly, digital images (at 1360 × 1024 pixel resolution) of 20 microscopic fields in each slide were captured at 200 × magnification by the DP 71 CCD camera (Olympus) that was coupled to a microscope (Olympus; AX-70). The percentage of cortical area affected by tubulointerstitial damage was calculated in each field by Image-Pro Plus software (Media Cybernetics). A score was attributed as follows: 1: <10% of the field affected; 2: 10%–25% of the field affected; 3: 25%–50% of the field affected; 4: 50%–75% of the field affected; 5: 75%–100% of the field affected. Data were expressed as the average score in each slide.
Renal fibrosis was assessed by Masson's trichrome staining. The extent of tubulointerstitial fibrosis was semi-quantitated as previously described (32). Briefly, digital images of 20 microscopic fields in each slide were captured at 200 × magnification as described earlier. The percentage of cortical area affected by tubulointerstitial fibrosis was calculated in each field by Image-Pro Plus software (Media Cybernetics). A score was attributed as follows: 1: <25% of the field affected; 2: 25%–50% of the field affected; 3: >50% of the field affected. Data were expressed as the average score in each slide.
Tubulointerstitial inflammation was assessed by immunohistochemical staining by using a monoclonal antibody-recognizing macrophage marker F4/80 (Serotec, United Kingdom). Macrophage infiltration was quantified by counting the F4/80-positive cells in 10 randomly chosen (0.3 × 0.3 mm2) tubulointerstitial areas.
Glomerular sclerosis
Glomerular sclerosis was assessed by periodic acid-Schiff staining. The extent of glomerulosclerosis was semi-quantitated as previously described (27). Briefly, digital images of 20 microscopic fields in each slide were captured at 200 × magnification. The percentage of glomerular area affected by sclerosis was calculated in each glomerulus by Image-Pro Plus software (Media Cybernetics). A score was attributed as follows: 1: <25% of the glomerular area affected; 2: 25%–50% of the glomerular area affected; 3: 50%–75% of the glomerular area affected; 4: >75% of the glomerular area affected. The sclerosis index for each mouse was calculated as follows: (N1 × 1 + N2 × 2 + N3 × 3 + N4 × 4)/n, where N1, N2, N3, and N4 represent the number of glomeruli that exhibited grades 1, 2, 3, and 4, respectively, and n represents the number of glomeruli assessed.
Extracellular matrix expression
Accumulation of extracellular matrix (fibronectin and collagen I) was evaluated by immunohistochemical staining by using a rabbit anti-mouse fibronectin (1:200; Sigma Chemical, St. Louis, MO) and a rabbit anti-mouse collagen I (1:100; Millipore, Billerica, MA) antibodies. Intrarenal expression of fibronectin and collagen I was semi-quantitated as previously described (8). The protein and mRNA levels of fibronectin and collagen I in homogenates of the renal cortex and medulla were determined by using Western blot and real-time PCR, respectively, as previously described (21).
Renal capillary endothelial injury
The expression of P-selectin in renal microvessels was evaluated by immunohistochemical staining (9) with a rabbit anti-mouse P-selectin (Santa Cruz, Dallas, TX). Intrarenal expression of P-selectin was semi-quantitated as previously described (8).
Capillary endothelial injury in the renal coritcomedullary junction (30) was examined under a transmission electron microscope (Hitachi, Tokyo, Japan).
All histological analyses were performed by two pathologists who were blinded to the treatment of the animals.
Measurement of renal function in IRI mice
Serum creatinine concentrations were measured by using the Quantichrom Creatinine assay kit (BioAssay Systems, Hayward, CA).
The ERPF and GFR were determined by PAH and inulin clearance, respectively (20). Briefly, under isoflurane anesthesia, a catheter was placed in the bladder for urine collection, and a cannula was placed in the tail vein to infuse PAH and inulin. Normal saline solution (0.9%) containing 15% inulin, 3.75% PAH, and 1% bovine albumin was infused at a rate of 5 μl/min. After a 1-h equilibration period, urine was collected every 30 min for three times and blood was drawn at the end of the infusion. PAH and inulin concentrations in urine and plasma were measured by using commercial kits (BioVision; Inc., Milpitas, CA and Glory Science Co., Del Rio, TX).
Evaluation of renal perfusion by CEUS in human AKI
The human study was approved by the Institutional Medical Ethics Committee, and the study participants provided written informed consent.
To further illustrate the feasibility of CEUS in human AKI, renal cortical perfusion was measured by CEUS in 40 patients (mean age, 59 ± 7 years; male: female = 1:1) who were admitted for ADHF between October 2015 and February 2017. We excluded those with preexisting CKD, diabetes, urinary tract obstruction, contrast medium exposure, cardiogenic shock, and heart failure after cardiac surgery.
In patients with ADHF, CEUS was performed on admission and at the day of AKI diagnosis in those who developed AKI during their hospitalization. CEUS was also conducted in 10 age- and gender-matched healthy volunteers (mean age, 57 ± 7 years; male: female = 1:1).
Renal perfusion was evaluated as previously described (36). We used Sonovue® (Bracco, Milano, Italy) as an ultrasound contrast agent. Low mechanical-index (0.06) ultrasound was performed with a Philips iE33 ultrasound machine and a C5-1® 5 MHz probe. Initially, regular B-mode images were used to visualize the right kidney and to position the maximum longitudinal coronal imaging plane, including the entire kidney. Then, the ultrasonographic probe was manually held in place, ensuring the constant imaging plane throughout the image acquisitions. Once adequate images of the kidney were obtained, intravenous infusion of Sonovue was started at a rate of 1 ml/min by using a dedicated syringe pump (Terumo, Somerset, NJ). Image depth, focus, gain, and frame rate were optimized for each mouse/patient during baseline and held constant for all further measurements.
After a 2-min equilibration period, five consecutive destruction/refilling sequences (with a 15-s refilling time) were obtained. Destruction was obtained by applying a flash of increased ultrasound intensity (five pulses with a high mechanical index of 1.2) (36). Ultrasound datasets were exported in a digital imaging and analyzed offline as described earlier. In each series, we analyzed the sequence associated with the less movement artifact and with the larger cortical visualization (38). As shown in Supplementary Figure S8B in Supplementary Data online, to minimize the influence of the local perfusion heterogeneities, ROI in the cortex was drawn to enclose all visible renal cortex on the surface of the kidney closest to the ultrasound probe (37). The selected ROI in the cortex was maintained (placed automatically) on the consecutive images.
Statistical analysis
Results are expressed as mean ± standard deviation. Continuous variables among different groups were compared by using one-way analysis of variance, followed by LSD test. An unpaired t test was used to compare the parameters between different groups at the same time point. Intra-observer reliability and inter-observer reproducibility of CEUS measurements were determined by the corresponding ICC and their 95% CI (40). Correlations were assessed according to Pearson's correlation analysis. To measure the sensitivity and specificity of perfusion impairment at different cutoff values, a conventional ROC curve was generated. Optimal cutoffs were determined by selecting the data point that minimized the geometric distance from 100% sensitivity and 100% specificity on the ROC curve. Statistical analyses were conducted with SPSS17.0 for Windows (SPSS, Inc., Chicago, IL). A value of p < 0.05 was considered statistically significant.
Footnotes
Acknowledgments
This study was supported by the National Key Technology Support Program of China (2013BAI09B06 and 2015BAI2B07 to F.F.H.), the State Key Program of National Natural Science Foundation of China (81430016 to F.F.H.), the Major International (Regional) Joint Research Project of the National Natural Science Foundation of China (81620108003 to F.F.H.), the Foundation for Innovation Research Groups of the National Natural Science Foundation of China (81521003 to Y.L.), the Major State Basic Research Development Program of China (2013CB733804 to J.B.), the National Natural Science Foundation of China (81570619 to W.C., 81571698, 81227801, and 81271640 to J.B.), the Major Scientific and Technological Planning Project of Guangzhou (15020010 to F.F.H.), the Guangzhou Clinical Research Center for Chronic Kidney Disease Program (7415695988305 to F.F.H.), the Team Program of Natural Science Foundation of Guangdong Province (S2011030003134 to J.B.), and the Science and Information Technology of Guangzhou Key Project (201400000004-4 to Dr. Jing Nie, principal investigator).
Author Disclosure Statement
No competing financial interests exist.
Abbreviations Used
References
Supplementary Material
Please find the following supplemental material available below.
For Open Access articles published under a Creative Commons License, all supplemental material carries the same license as the article it is associated with.
For non-Open Access articles published, all supplemental material carries a non-exclusive license, and permission requests for re-use of supplemental material or any part of supplemental material shall be sent directly to the copyright owner as specified in the copyright notice associated with the article.