
Abstract
Aims:
Accurate analysis of dinucleotide redox cofactors nicotinamide adenine dinucleotide phosphate reduced (NADPH), nicotinamide adenine dinucleotide phosphate (NADP+), nicotinamide adenine dinucleotide reduced (NADH), and nicotinamide adenine dinucleotide (NAD+) from biological samples is important to understanding cellular redox homeostasis. In this study, we aimed to develop a simple protocol for quenching metabolism and extracting NADPH that avoids interconversion among the reduced forms and the oxidized forms.
Results:
We compared seven different solvents for quenching and extraction of cultured mammalian cells and mouse tissues: a cold aqueous buffer commonly used in enzyme assays with and without detergent, hot aqueous buffer, and cold organic mixtures (80% methanol, buffered 75% acetonitrile, and acidic 40:40:20 acetonitrile:methanol:water with either 0.02 M or 0.1 M formic acid). Extracts were analyzed by liquid chromatography–mass spectrometry (LC-MS). To monitor the metabolite interconversion, cells were grown in 13C6-glucose medium, and unlabeled standards were spiked into the extraction solvents. Interconversion between the oxidized and reduced forms was substantial except for the enzyme assay buffer with detergent, 80% methanol and 40:40:20 acetonitrile:methanol:water, with the 0.1 M formic acid mix giving the least interconversion and best recoveries. Absolute NAD+, NADH, NADP+, and NADPH concentrations in cells and mouse tissues were measured with this approach.
Innovation:
We found that the interconversion between the reduced and oxidized forms during extraction is a major barrier to accurately measuring NADPH/NADP+ and NADH/NAD+ ratios. Such interconversion can be monitored by isotope labeling cells and spiking NAD(P)(H) standards.
Conclusion:
Extraction with 40:40:20 acetonitrile:methanol:water with 0.1 M formic acid decreases interconversion and, therefore, is suitable for measurement of redox cofactor ratios using LC-MS. This solvent is also useful for general metabolomics. Samples should be neutralized immediately after extraction to avoid acid-catalyzed degradation. When LC-MS is not available and enzyme assays are accordingly used, inclusion of detergent in the aqueous extraction buffer reduces interconversion. Antioxid. Redox Signal. 28, 167–179.
Introduction
N
Only a limited number of studies focus on the analysis of these compounds from biological samples, with great discrepancies for intracellular levels reported so far (4, 8, 22, 29, 31, 37, 47). For example, Veech et al. calculated a (free NADPH)/(free NADP+) ratio of ∼100 in the cytoplasm, through measuring the substrate concentrations of malic enzyme and isocitrate dehydrogenase, a classical observation that is included in many undergraduate biochemistry textbooks (23, 40). Direct measurement of the NADPH and NADP+ from various biological samples, however, has typically resulted in much lower ratios: for example, 3.3, 0.1, 0.04 for rat liver, brain, and heart (22), 15 for Chinese hamster ovary cells (8), 2.3 for immortalized baby mouse kidney cells (31), 1.2 or 0.4 for Saccharomyces cerevisiae under aerobic conditions (31, 37) and 2.7 under anaerobic conditions (37), 57 for Escherichia coli (4), 1.5 or 1.8 for Methylobacterium extorquens AM1 grown on succinate or ethylamine (47), and 0.2 for Pichia pastoris (29). While the literature lacks multiple measurements under the exactly same biological conditions, and thus, these results may reflect true biological variability, it is likely that analytical variation is also contributing to the wide range of observed ratios.
Accurate analysis of dinucleotide redox cofactors NADPH, NADP+, NADH, and NAD+ from biological samples remain a major challenge, in large part, due to reactivity of the cofactors. In this study, we identified interconversion reactions that have plagued NAD+, NADH, NADP+, and NADPH measurement efforts and ways to avoid them. With the significantly improved extraction methods, we quantified concentrations for these cofactors in selected mammalian cells and mouse tissues.
One likely source of analytical variation is extraction efficiency. A straightforward goal is to extract as completely as possible. However, metabolite degradation and interconversion may occur during extraction and after the extract is made. One concern is nonenzymatic degradation in solution, as has been noted for these compounds (13, 24, 38). For example, NADPH is not very stable at low pH and high temperature, while NADP+ is more stable (15, 46). Another involves metabolite interconversion caused by residual catalytic activity when enzymes are not instantaneously fully inactivated during extraction. This possibility has been less studied but may contribute significantly, as we previously observed for nucleotide triphosphates (33). In principle, this can be studied by spiking individual isotope-labeled standards into extraction solvent, extracting cells or tissue, and performing mass spectrometry (MS) analysis to see if other related metabolites get labeled (21). Unfortunately, isotope-labeled standards for NAD(P)(H) are not commercially available. An alternative is to feed the cell with 13C-glucose so that the cellular metabolites get fully labeled and then add unlabeled standard during extraction (33).
In this study, we investigate different extraction methods for NAD(P)(H) from both mammalian cell culture and mouse tissues. We start by examining intrinsic compound stability. We then compare the metabolite yields using seven different extraction methods. Then, by growing cells in 13C-glucose-based medium and adding unlabeled standards in the extraction solvents, we quantitate metabolite interconversion due to residual enzyme activity. By doing so, we identify an extraction method that shows less interconversion and thereby enables more accurate measurement of NADPH/NADP+ and NADH/NAD+. Finally, we investigate different sample drying methods and evaluate their effects on compound stability. Using the resulting optimized methods, we report NAD+, NADH, NADP+, and NADPH concentrations in cultured mammalian cells and selected mouse tissues.
Results
Liquid chromatography–MS method development and validation
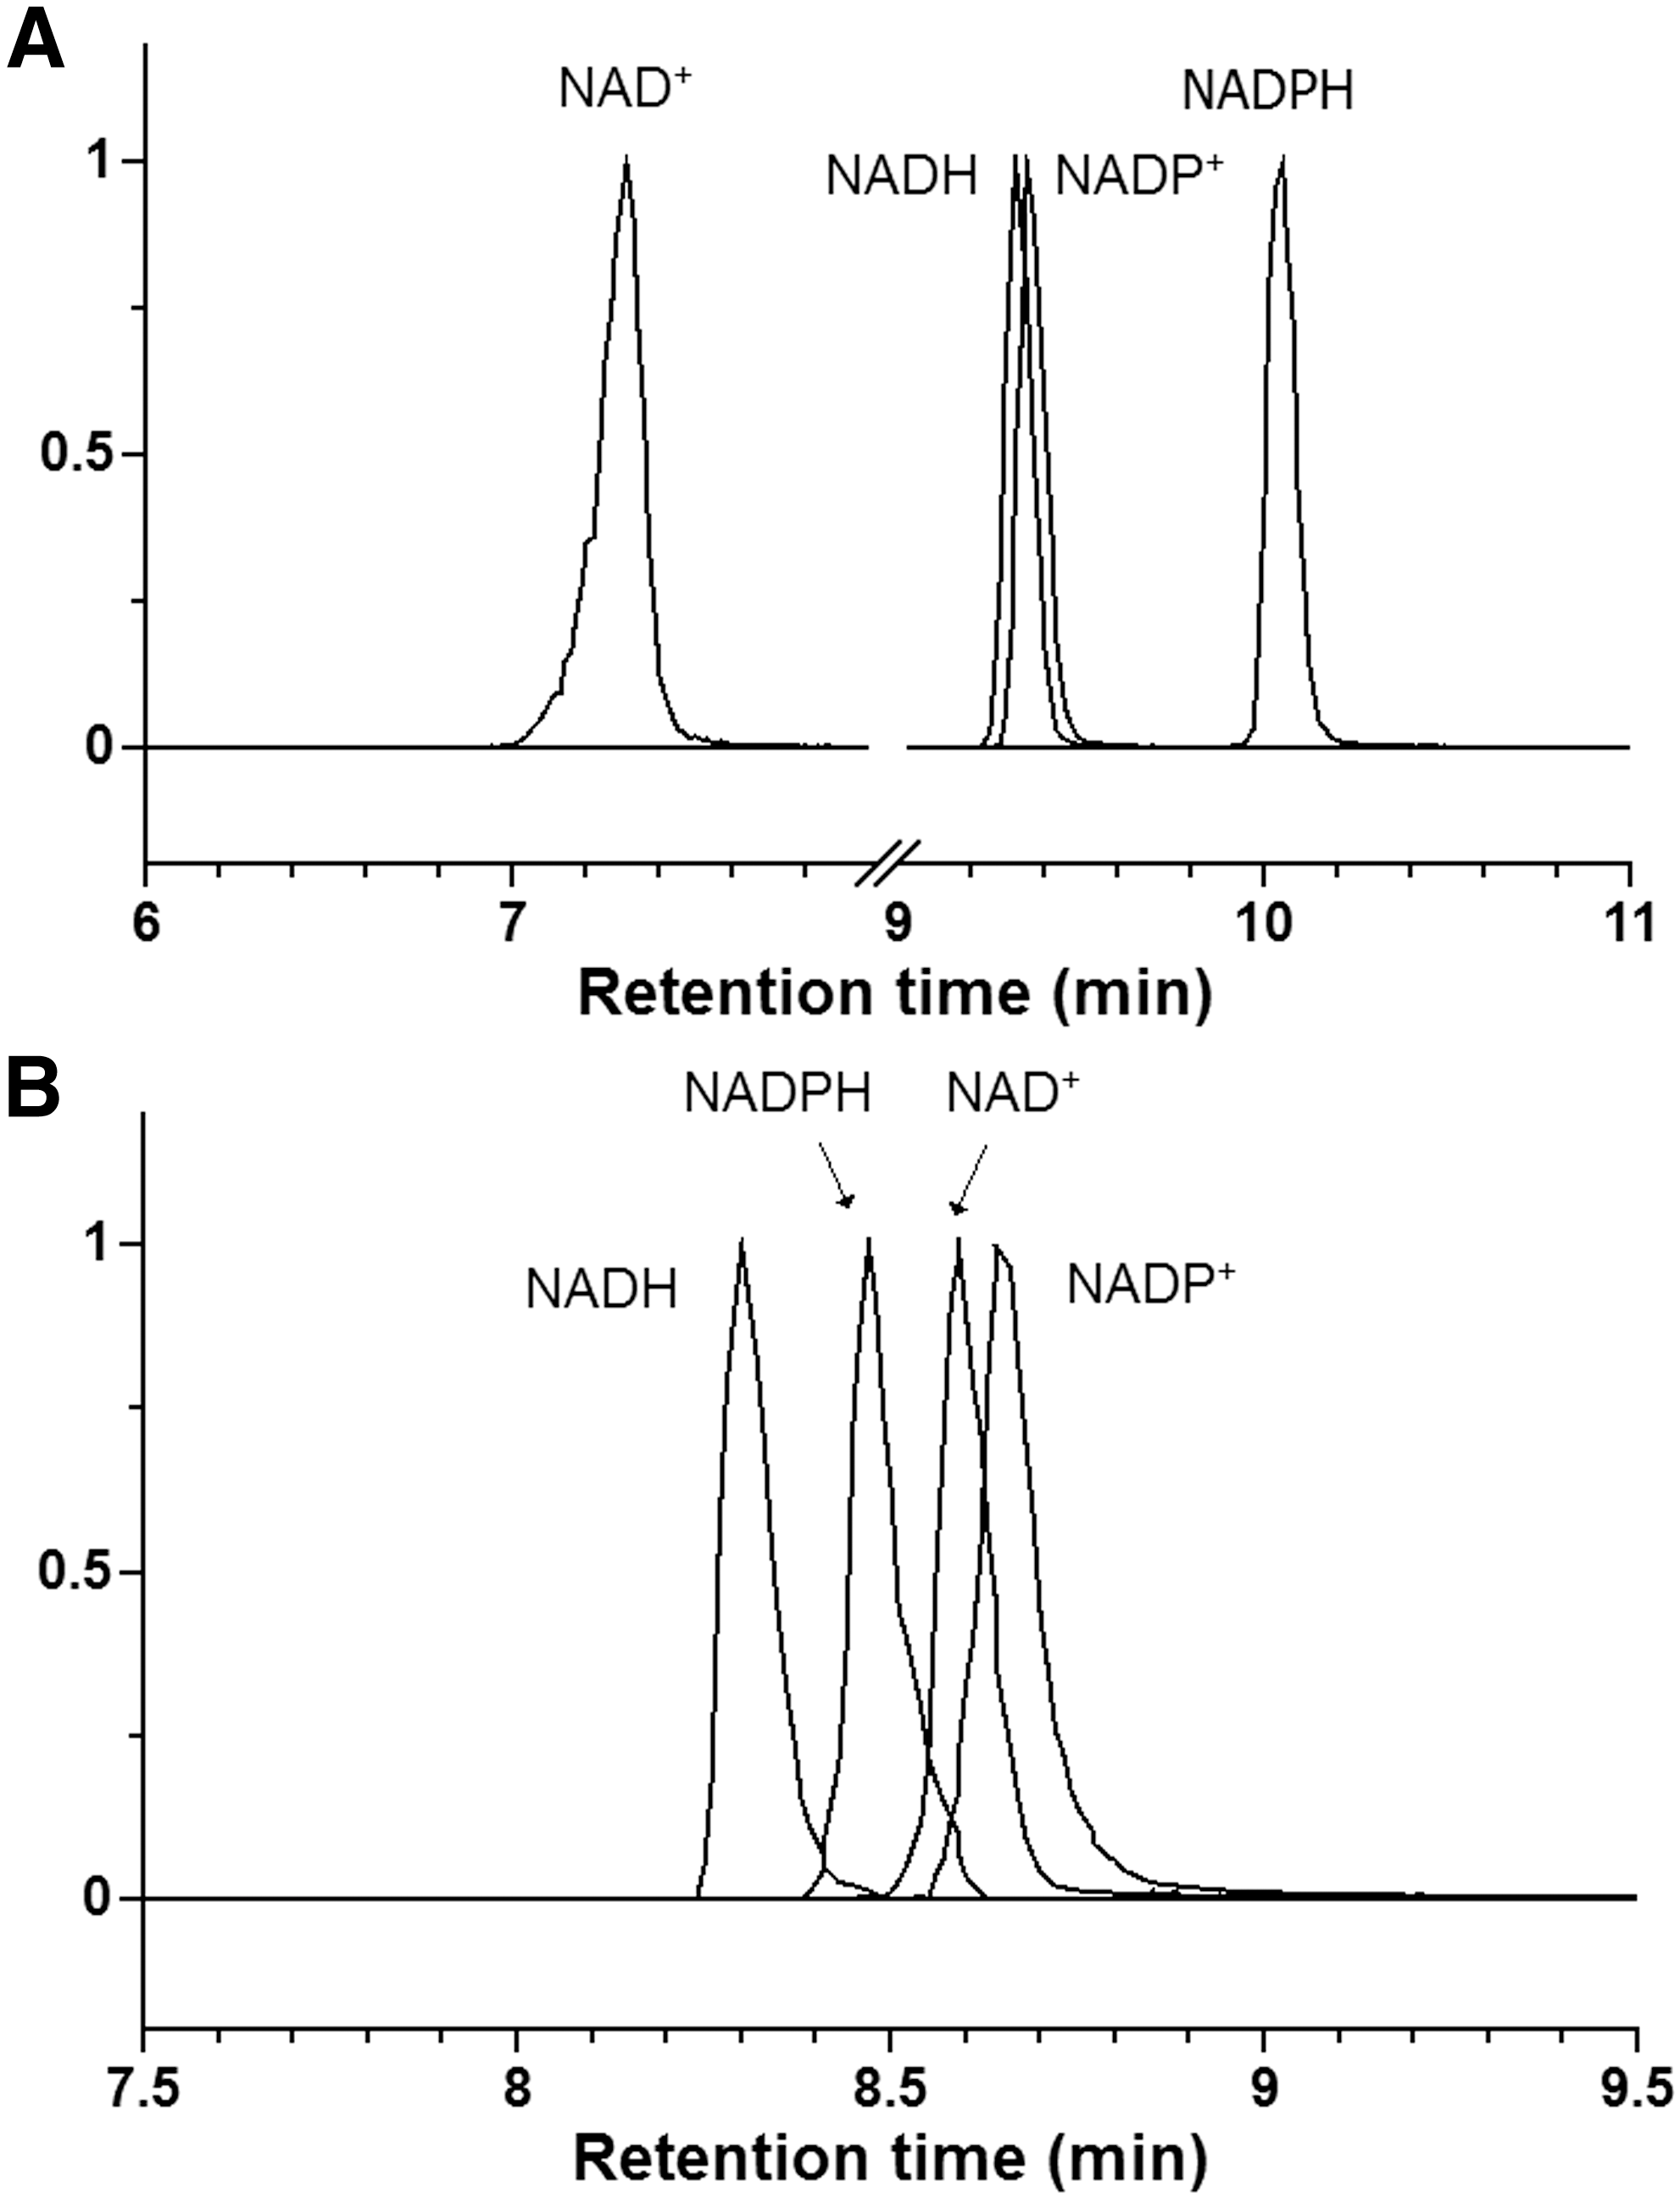
Two complementary liquid chromatography–MS (LC-MS) methods were used for the analysis of NAD(P)(H). Method 1 uses reversed-phase ion pairing chromatography and Method 2 uses hydrophilic interaction chromatography (HILIC). Note that these methods are optimized for use in metabolomics, that is, to enable measurement of many different metabolites in parallel, rather than solely for redox cofactor analysis. Representative chromatograms for the cofactors are shown in Figure 1.
Method 1 was validated using authentic standards dissolved in selected extraction solvents and the results are shown in Supplementary Table S1 (see
Compound stability
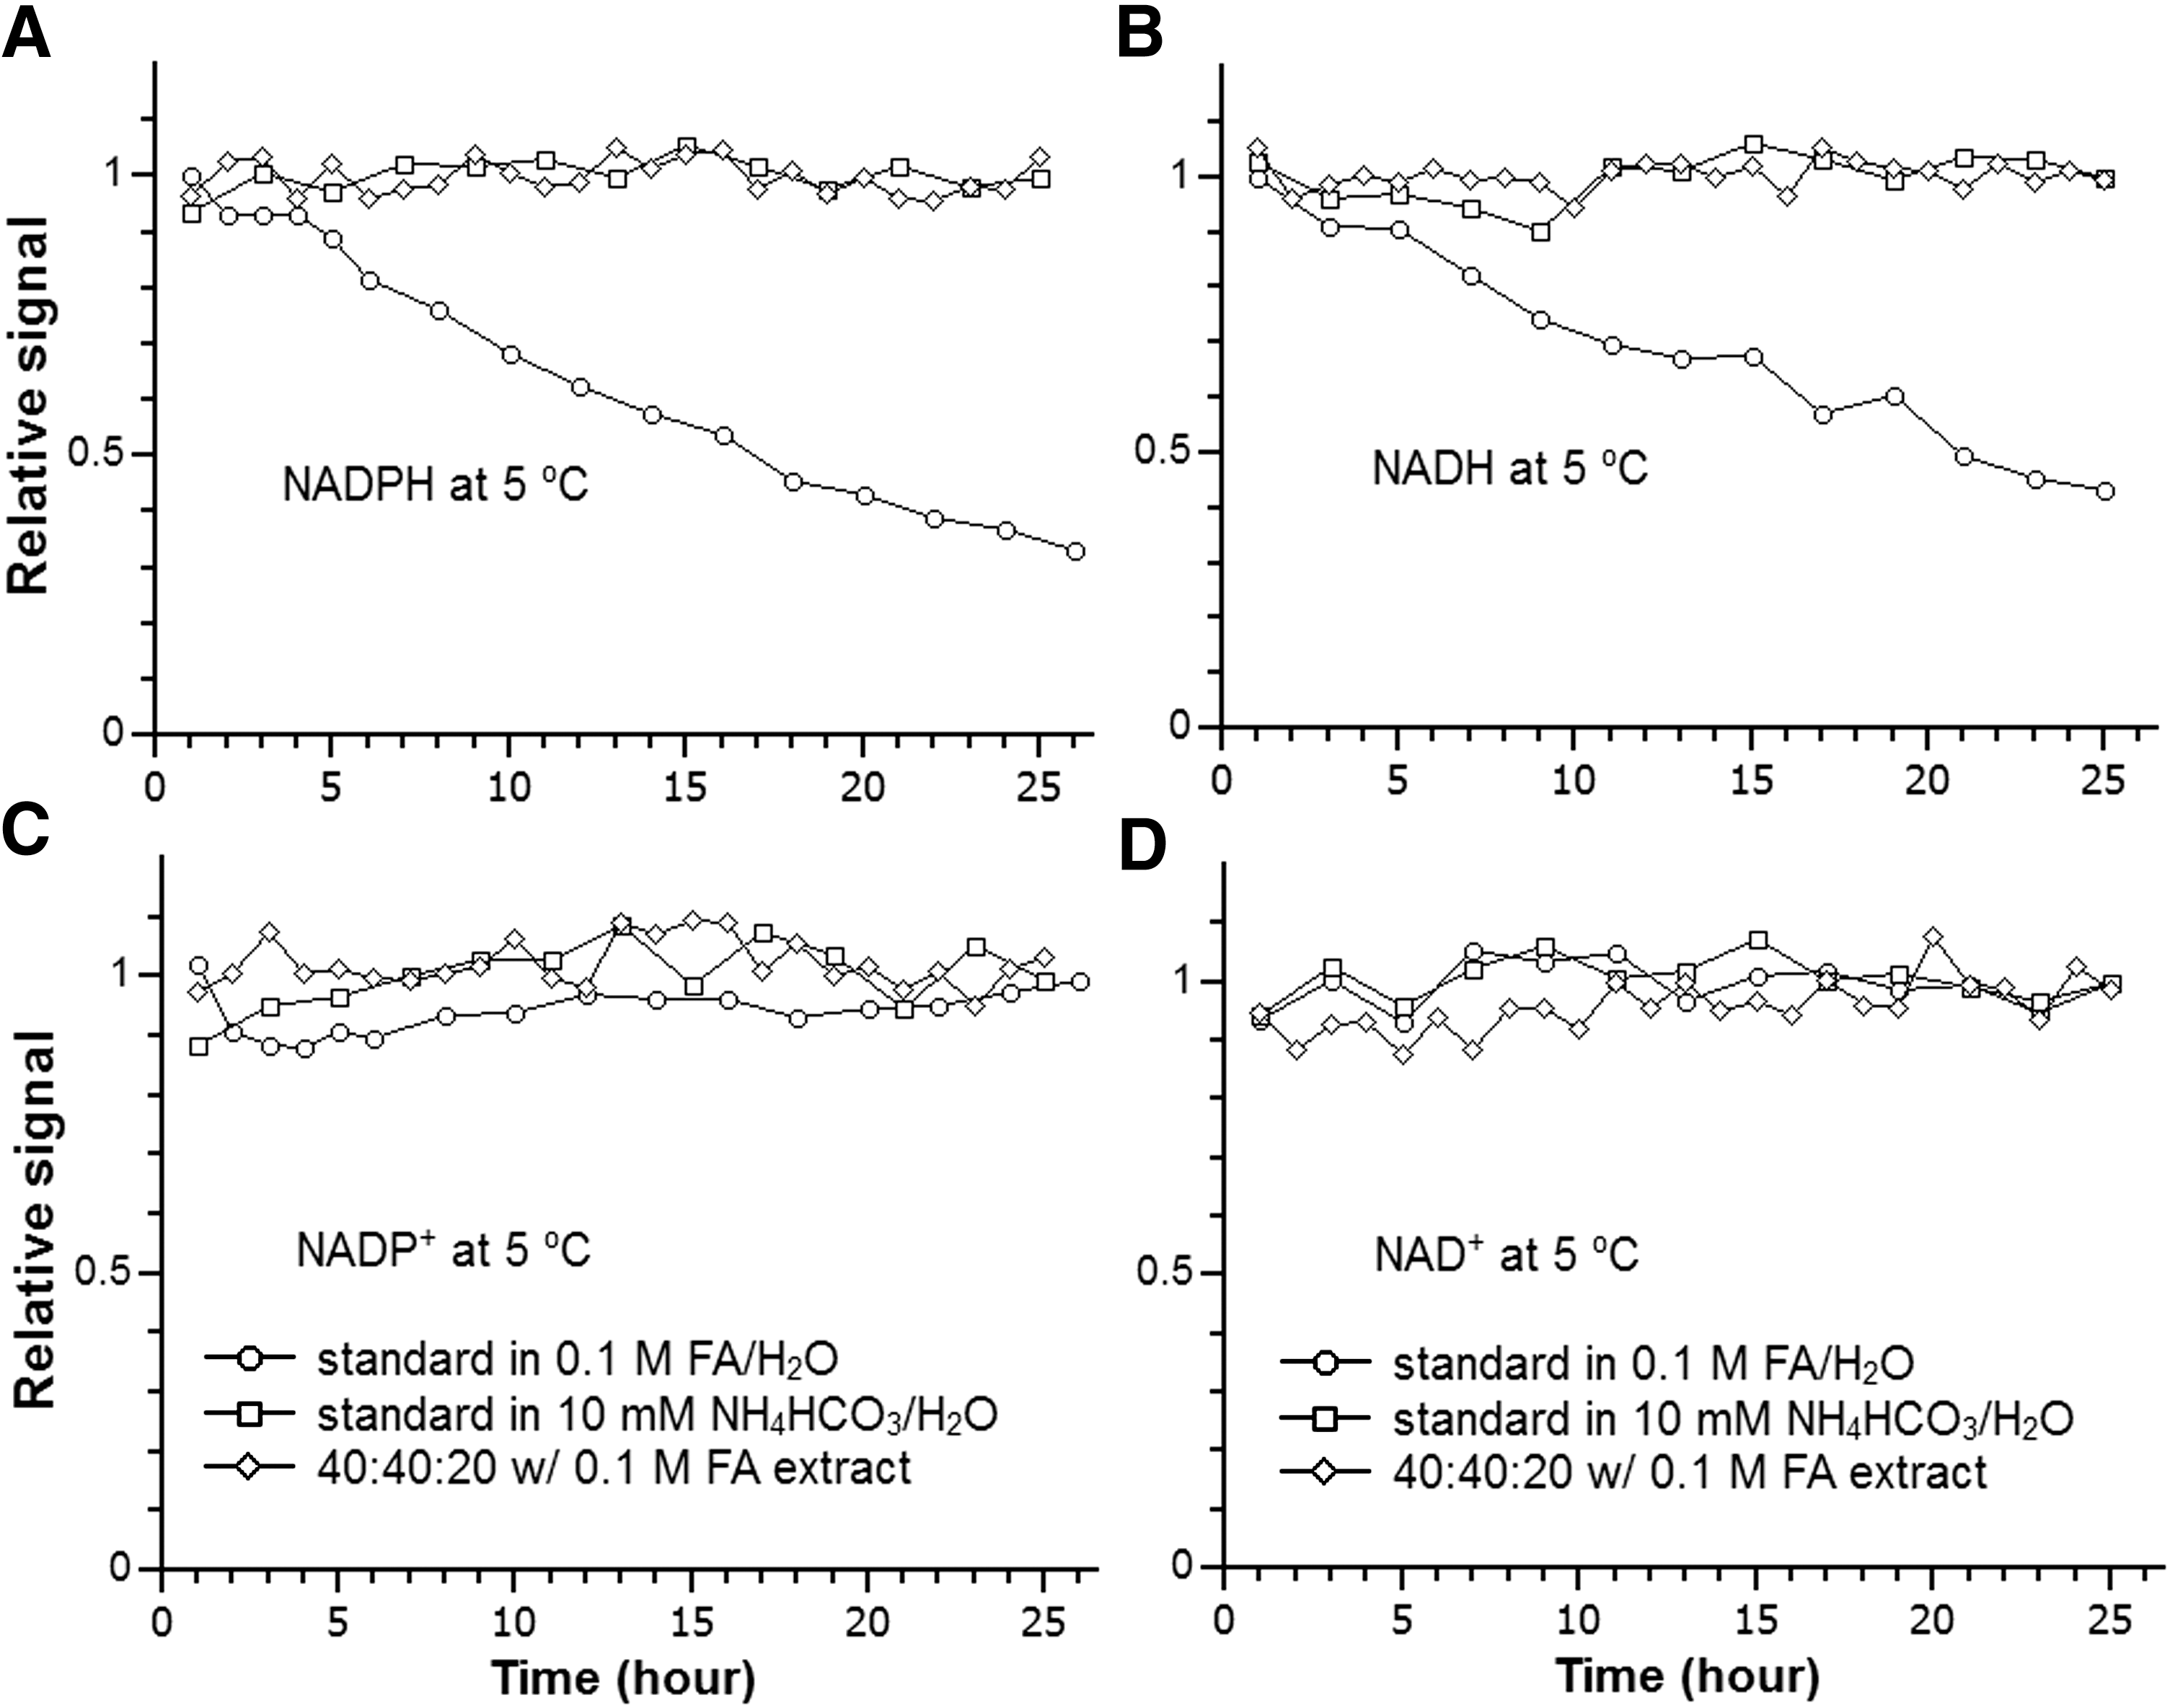
We evaluated the stability of NAD(P)(H) when stored in the high-performance liquid chromatography (HPLC) autosampler (5°C). As shown in Figure 2, NADPH and NADH are not stable in 0.1 M formic acid in water (pH = 2.4) with a half-life of ∼16 and 20 h, respectively. These results are in agreement with previous studies which show that acid causes significant degradation of these two compounds (46). Changing to pH 7.4 with 10 mM ammonium bicarbonate (NH4HCO3) increased the stability and there is no significant loss over 24 h. For the tissue extract using an extraction solvent containing 40:40:20 acetonitrile:methanol:water with 0.1 M formic acid, followed by neutralization with NH4HCO3, both compounds are stable over 24 h. Consistent with previous results, the corresponding oxidized forms, NADP+ and NAD+, are stable under all the tested conditions (Fig. 2) (17).
NADPH and NADP+ extraction from mammalian cell culture
Using HCT116 cells, we evaluated the yield of NADPH and NADP+ with seven different extraction methods (Fig. 3). In brief, these methods are hot aqueous buffer [85°C, 5 mM ammonium acetate, pH 8], cold enzyme assay buffer [4°C, 10 mM nicotinamide, 20 mM sodium bicarbonate, 100 mM sodium carbonate (Na2CO3), pH 11; a buffer classically used for enzymatic NAD(P)(H) analysis]; the same cold enzyme assay buffer with addition of detergent [0.05% Triton X-100 and 1% dodecyl trimethylammonium bromide (DTAB)]; 75% acetonitrile [4°C, 10 mM monopotassium phosphate (KH2PO4), pH 7.4]; 80% methanol (−70°C); and 40:40:20 acetonitrile:methanol:water with either 0.02 M or 0.1 M formic acid [4°C, pH 3.7, and 3.4, respectively]. To minimize acid-catalyzed degradation, the specimens with formic acid were neutralized with NH4HCO3 after 3 min. The largest yield of NADPH was achieved using the 40:40:20 acetonitrile:methanol:water with 0.1 M formic acid. In contrast, this method gave a small yield of NADP+.
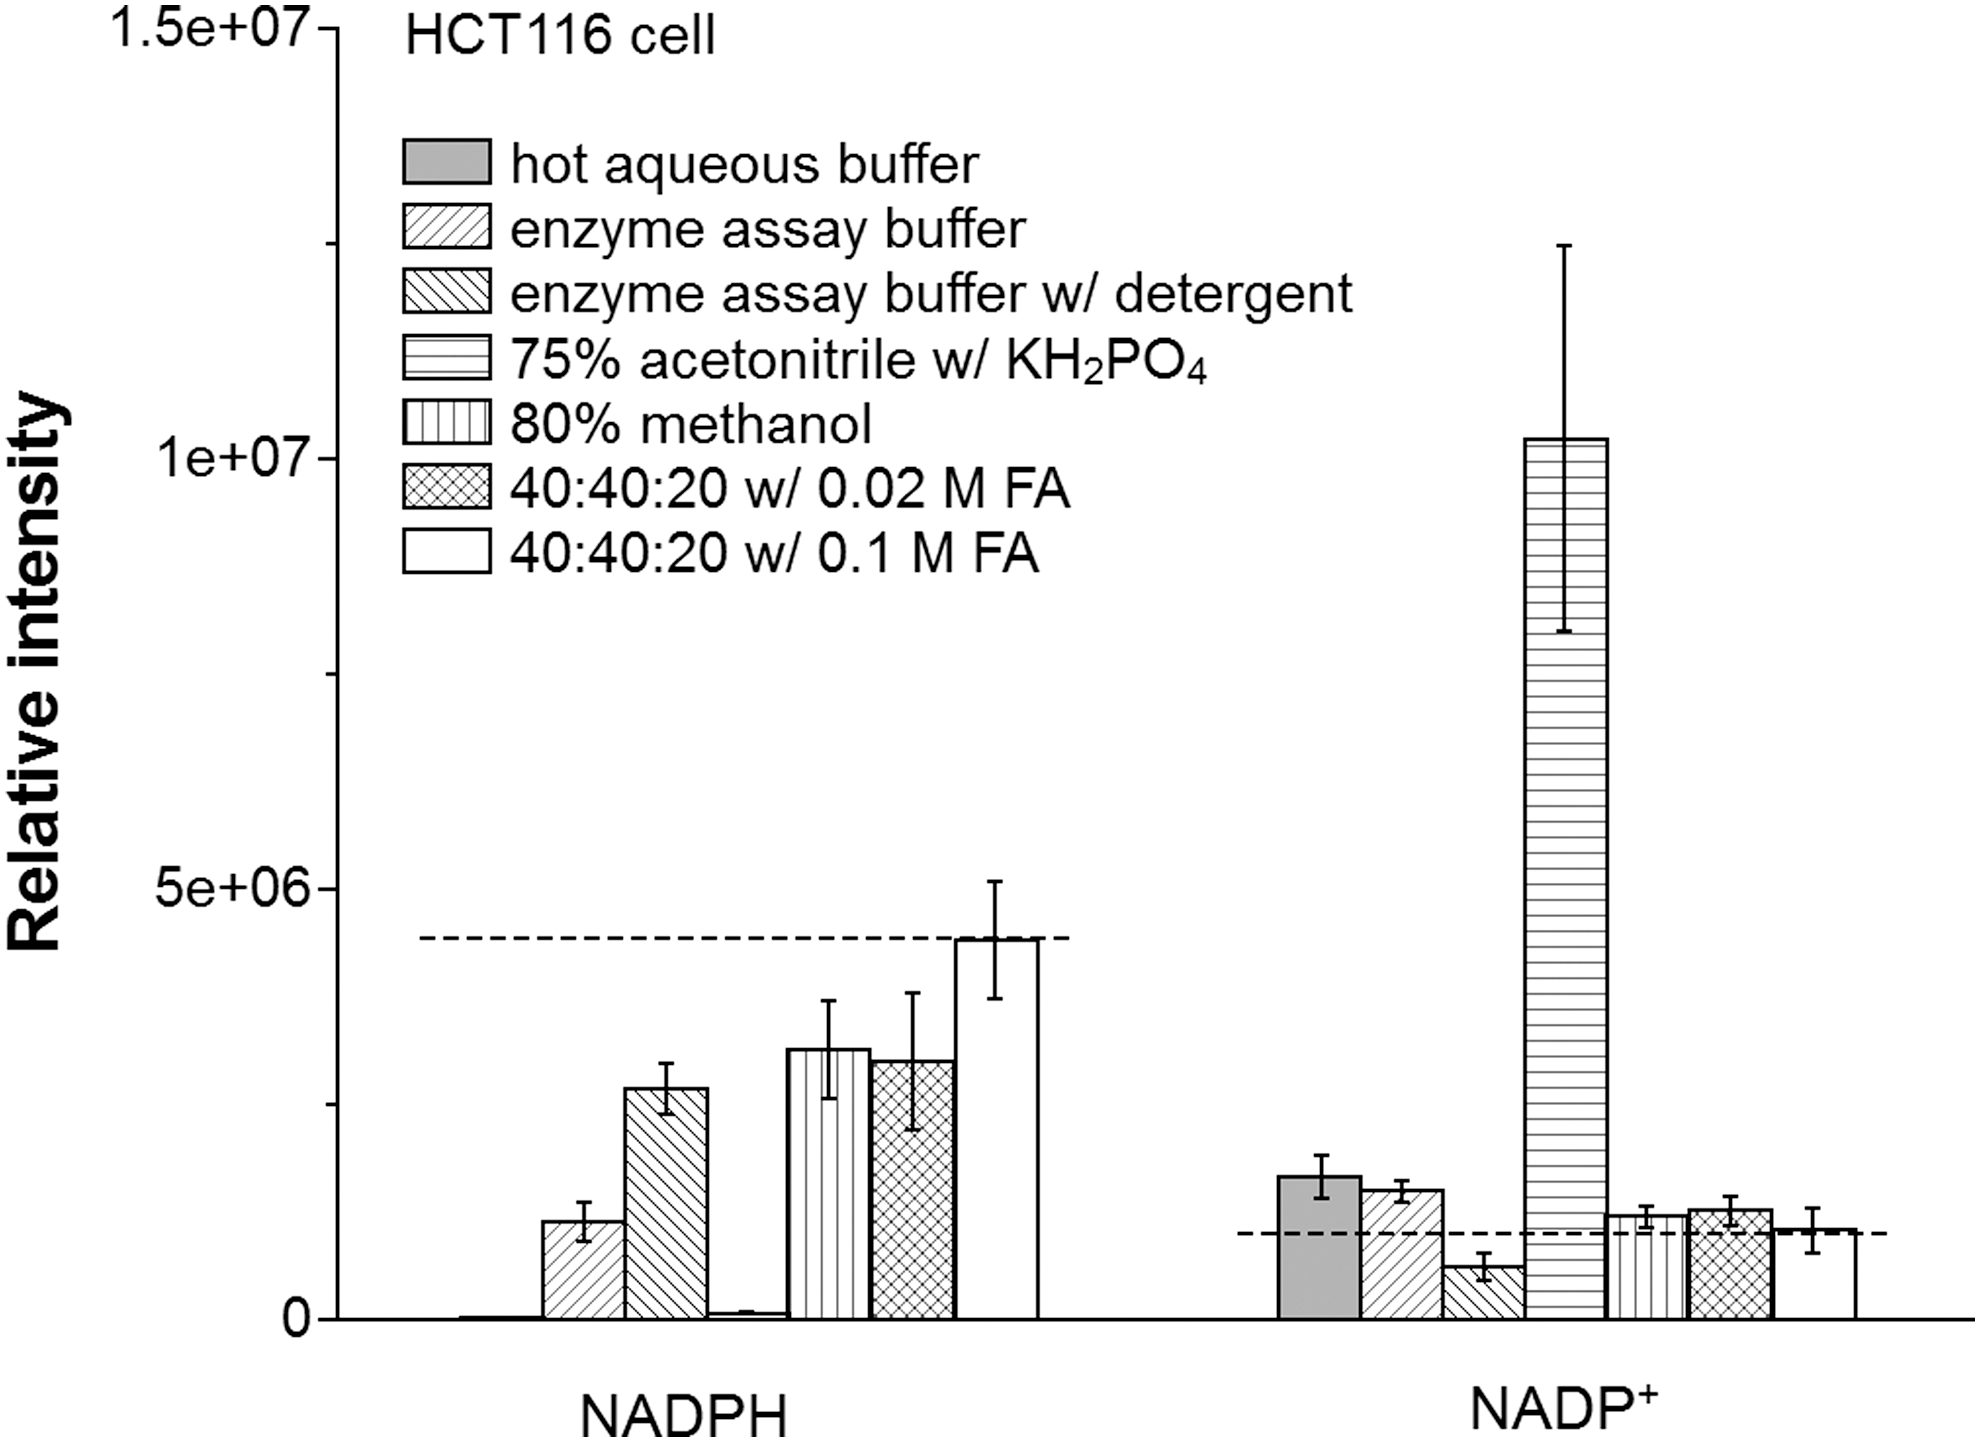
Absent other information, it is unclear if this low yield of NADP+ reflects poor extraction efficiency or desirable prevention of NADPH degradation to NADP+ during the extraction process. To address this, we used a “spiking” approach that takes advantage of the capability of MS to differentiate labeled and unlabeled metabolites. Cells were grown in medium containing 13C6-glucose to label endogenous metabolites. Unlabeled standards were added to the extraction solvents and resulting extract analyzed to detect the degradation/conversion products. When spiking with 0.81 μM NADPH, we observed the production of NADP+ in all conditions, but the 40:40:20 with 0.1 M formic acid method produced the least amount (0.01 μM; ∼1% of the spiked NADPH) (Table 1; Fig. 4). Thus, the low NADP+ yield with this method reflects effective prevention of NADPH degradation, rather than poor extraction. To confirm this, we spiked with NADP+ and observed nearly complete recovery. Notably, a closely related method but with less acid (0.02 M formic acid) did not as effectively prevent NADPH degradation into NADP+. For the two cold aqueous buffer systems commonly used for enzyme assays, it was found that the buffer without detergent produced a much higher amount of NADP+ than the one with detergent (0.12 μM vs. 0.04 μM). Thus, the addition of detergent decreases the residual enzyme activity that converts NADPH to NADP+. Yet, upon the spiking of NADP+ at 1.23 μM, a certain amount of NADPH (0.14 and 0.12 μM, respectively) was produced in both cases. The observation of bidirectional interconversion between NADPH and NADP+ with either enzyme assay buffer suggests that both are potentially subject to systematic measurement error. In summary, the 40:40:20 with 0.1 M formic acid method, which we previously showed also quenches residual enzyme activity which converts adenosine triphosphate to adenosine diphosphate (ADP) in E. coli extracts (33), best enables accurate NADPH/NADP+ ratio measurement from mammalian cells.

There are small amounts of NADP+ contaminant detected in NADPH standard and NAD+ contaminant in NADH standard. The results are the average of three independent experiments and the error is the SD.
FA, formic acid; KH2PO4, monopotassium phosphate; NAD+, nicotinamide adenine dinucleotide; NADH, nicotinamide adenine dinucleotide reduced; NADP+, nicotinamide adenine dinucleotide phosphate; NADPH, nicotinamide adenine dinucleotide phosphate reduced; SD, standard deviation.
With the spiking experiments above, based on the data from the 40:40:20 with 0.1 M formic acid extraction method, we obtained the absolute concentration of NADP+ and NADPH in HCT116 cells (Table 2). The results are 49.7 ± 3.8 μM for NADPH and 4.9 ± 0.2 μM for NADP+, with an intracellular NADPH/NADP+ ratio of ∼10. Given that the observed extent of conversion of spiked NADPH into NADP+ with this extraction solvent was only 1%, it is unlikely that this ratio is substantially impacted by NADPH/NADP+ interconversion. This ratio is higher than those previously reported for similar mammalian cells (31), which likely reflects the current method's improved quenching of enzymatic activity.
The results are the average of three biological replicates for cell samples, and three pieces of tissue from the same organ of one mouse for tissue samples. The error is the SD.
NADPH and NADP+ extraction from mouse liver
Animal tissue samples are complex, containing different cell types and extracellular matrix. To compare different extraction solvent systems, mouse liver was first pulverized in a cryomill operated at liquid nitrogen temperature. This process results in fine tissue powder, which was then subject to different extraction methods. Similar to cultured cells, the 40:40:20 with 0.1 M formic acid method yields the highest amount of NADPH (Fig. 5A), with the extent of the difference between this extraction solvent and the others greater than for cultured cells. The 0.1 M formic acid results in a pH of 3.4, which may help break down tissue and thereby release intracellular metabolites. For the two buffer systems used in enzyme assays, again it was found that addition of detergent increases NADPH yield and thus is a better choice. Repeated extraction with the 40:40:20 with 0.1 M formic acid method showed nearly quantitative recovery of spiked 13C10 15N5-ADP over the first two rounds of extraction. Similarly, most NADPH is obtained in the first round of extraction, with ∼20% in the second round. In contrast, substantial NADP+ is obtained in the second and third rounds of extraction; the high NADP+ in the later extraction rounds may be due to its production from NADPH during the extraction process. Due to the high concentration of NADPH in mouse liver (Table 2), if even a small percentage of NADPH converts to NADP+, it will significantly increase the detected NADP+.
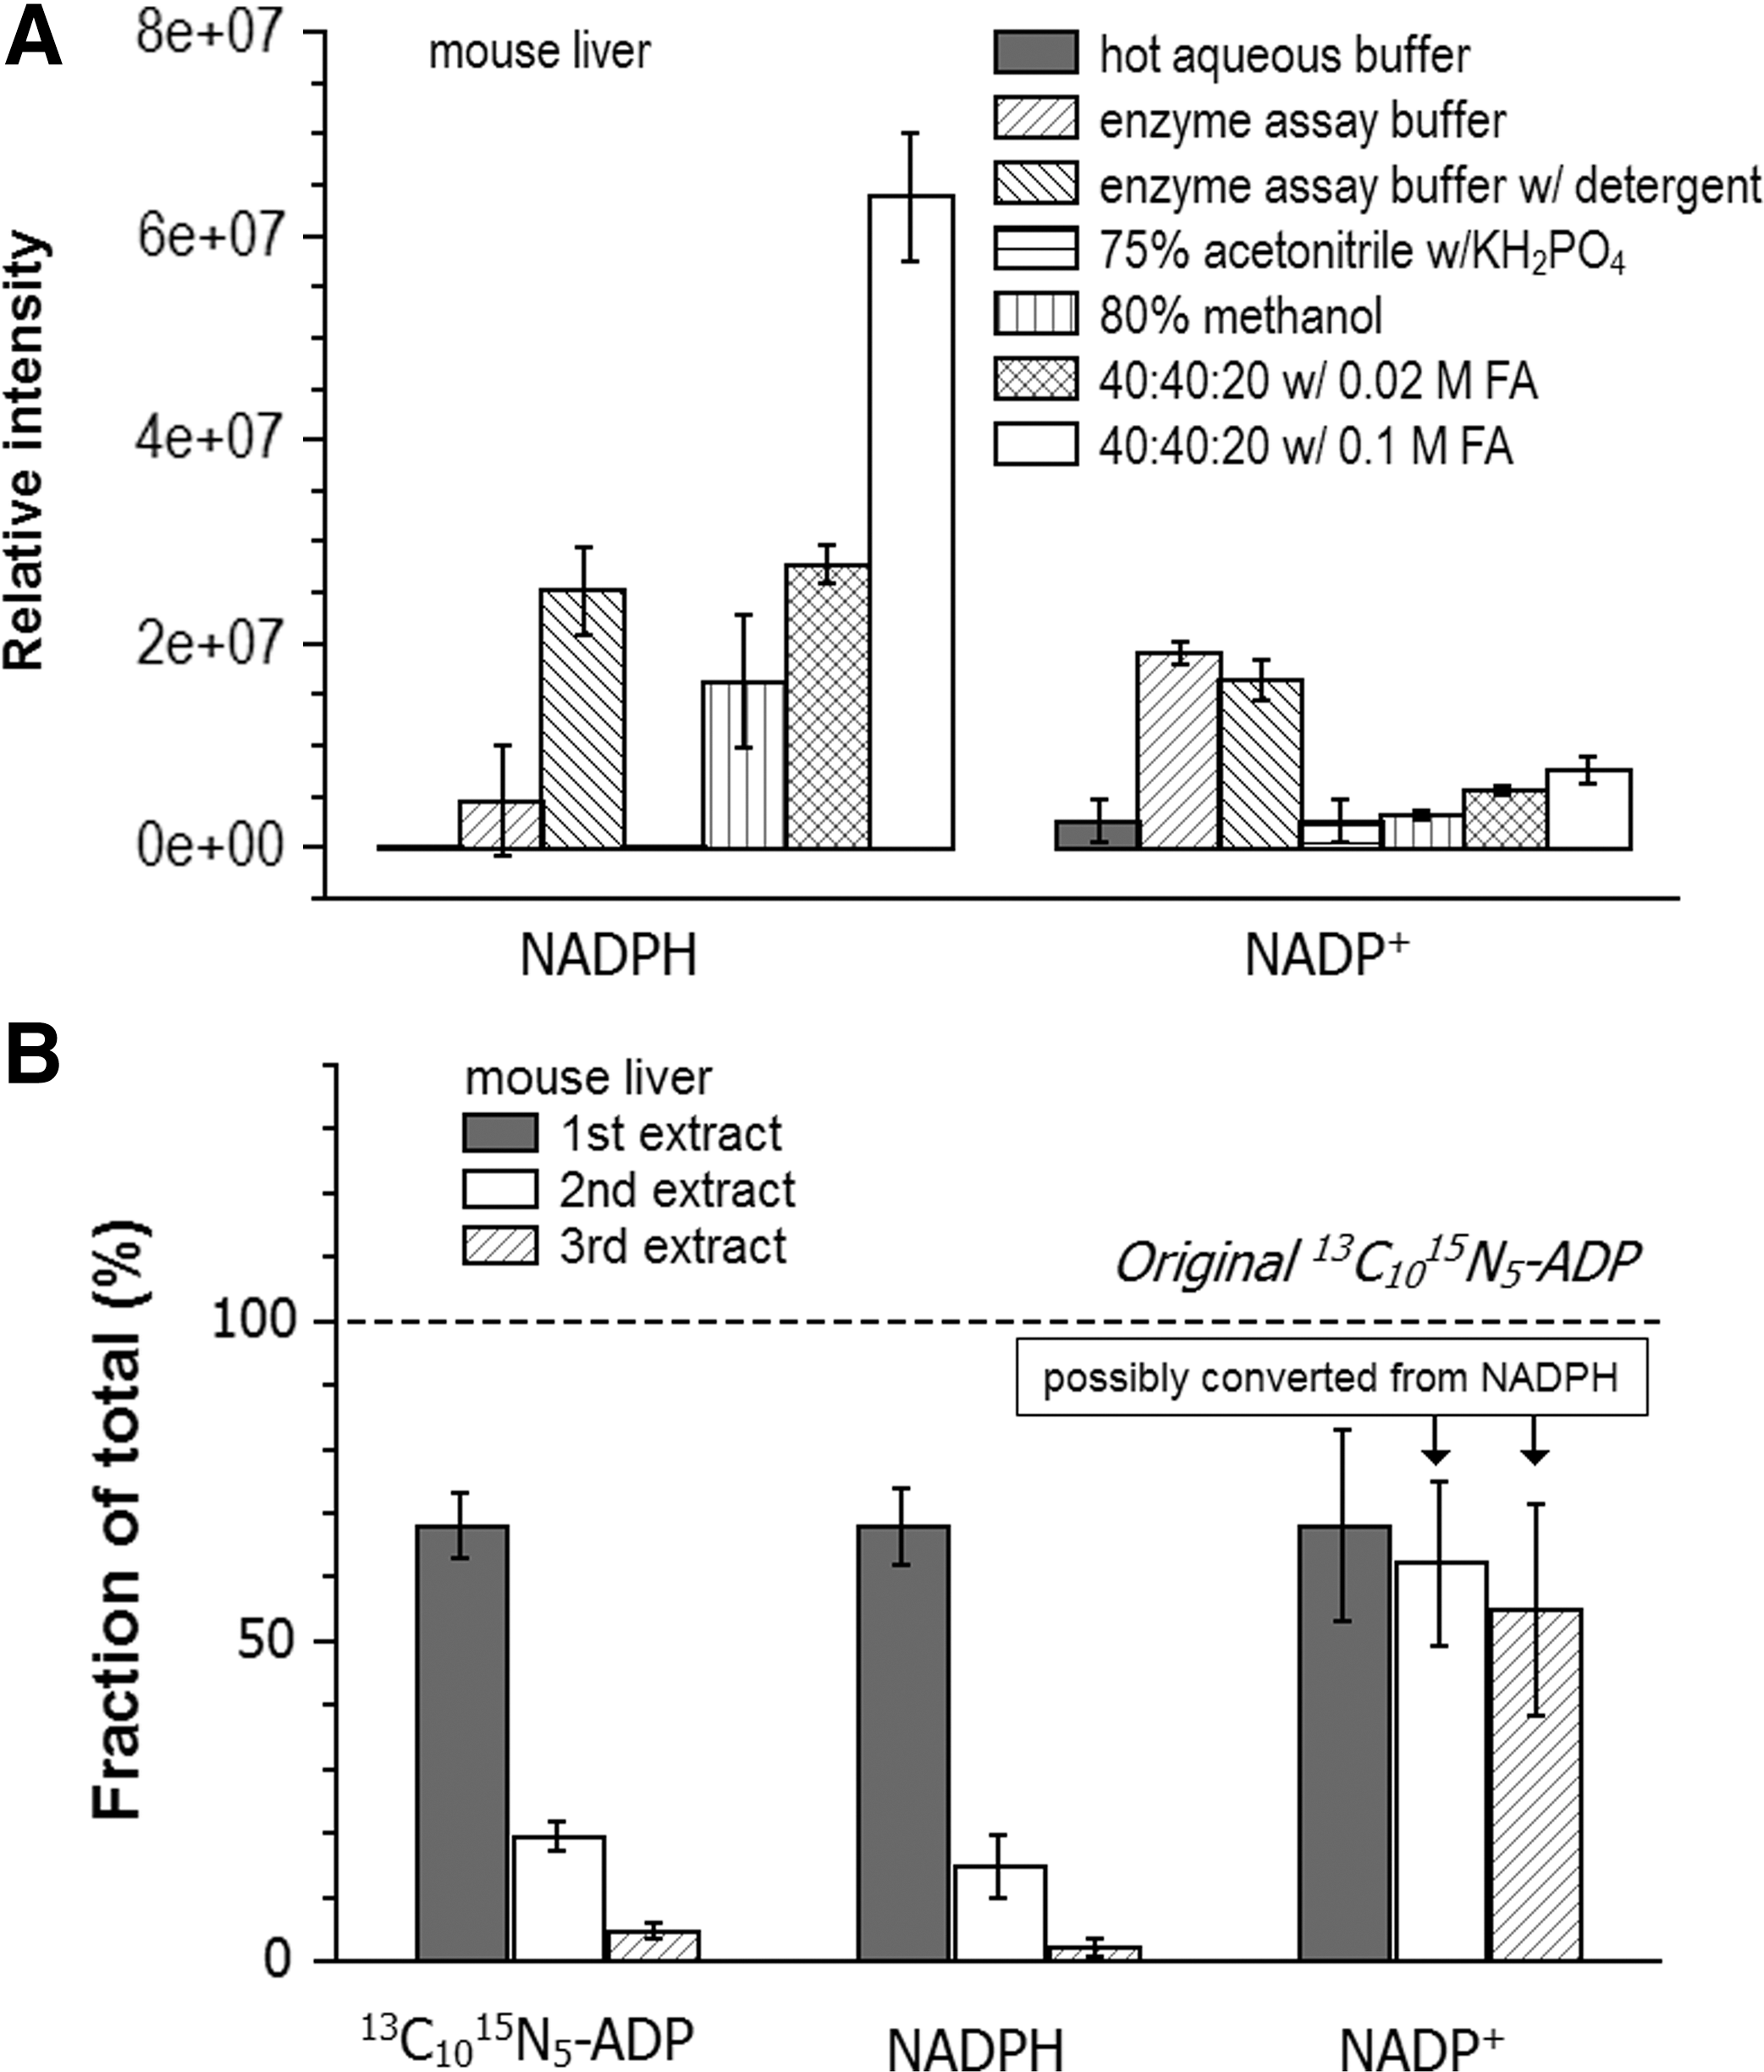
We next measured the NADPH and NADP+ concentration in selected mouse tissues (Table 2). Because of the lack of isotope-labeled standards, quantitation was achieved using external calibration with separate runs of unlabeled standards. Extraction was performed only once using the 40:40:20 with 0.1 M formic acid method, to minimize risk of NADP+ production from NADPH, and the final dinucleotide concentrations were obtained by dividing by 0.68 ± 0.05, which reflects the fraction of spiked 13C10 15N5-ADP detected in the first extract (Fig. 5B). Among the five organs studied, the liver shows the highest NADPH concentration as well as NADPH/NADP+ ratio (Table 2). The liver is a major site of fatty acid synthesis, which requires NADPH (1, 14). On the contrary, we found that the lung shows an NADPH/NADP+ ratio of <1, potentially due to its high exposure to oxygen during respiration (5). In general, our measured NADPH/NADP+ ratios are higher than previously reported on rat tissues using 75% acetonitrile with the KH2PO4 method (22), for example, 5.4 versus 3.3 for the liver, 3.7 versus 0.1 for the brain, 0.48 versus 0.04 for the heart. This likely reflects the improved preservation of NADPH during extraction with 40:40:20 with 0.1 M formic acid.
NADH and NAD+ from mammalian cell culture
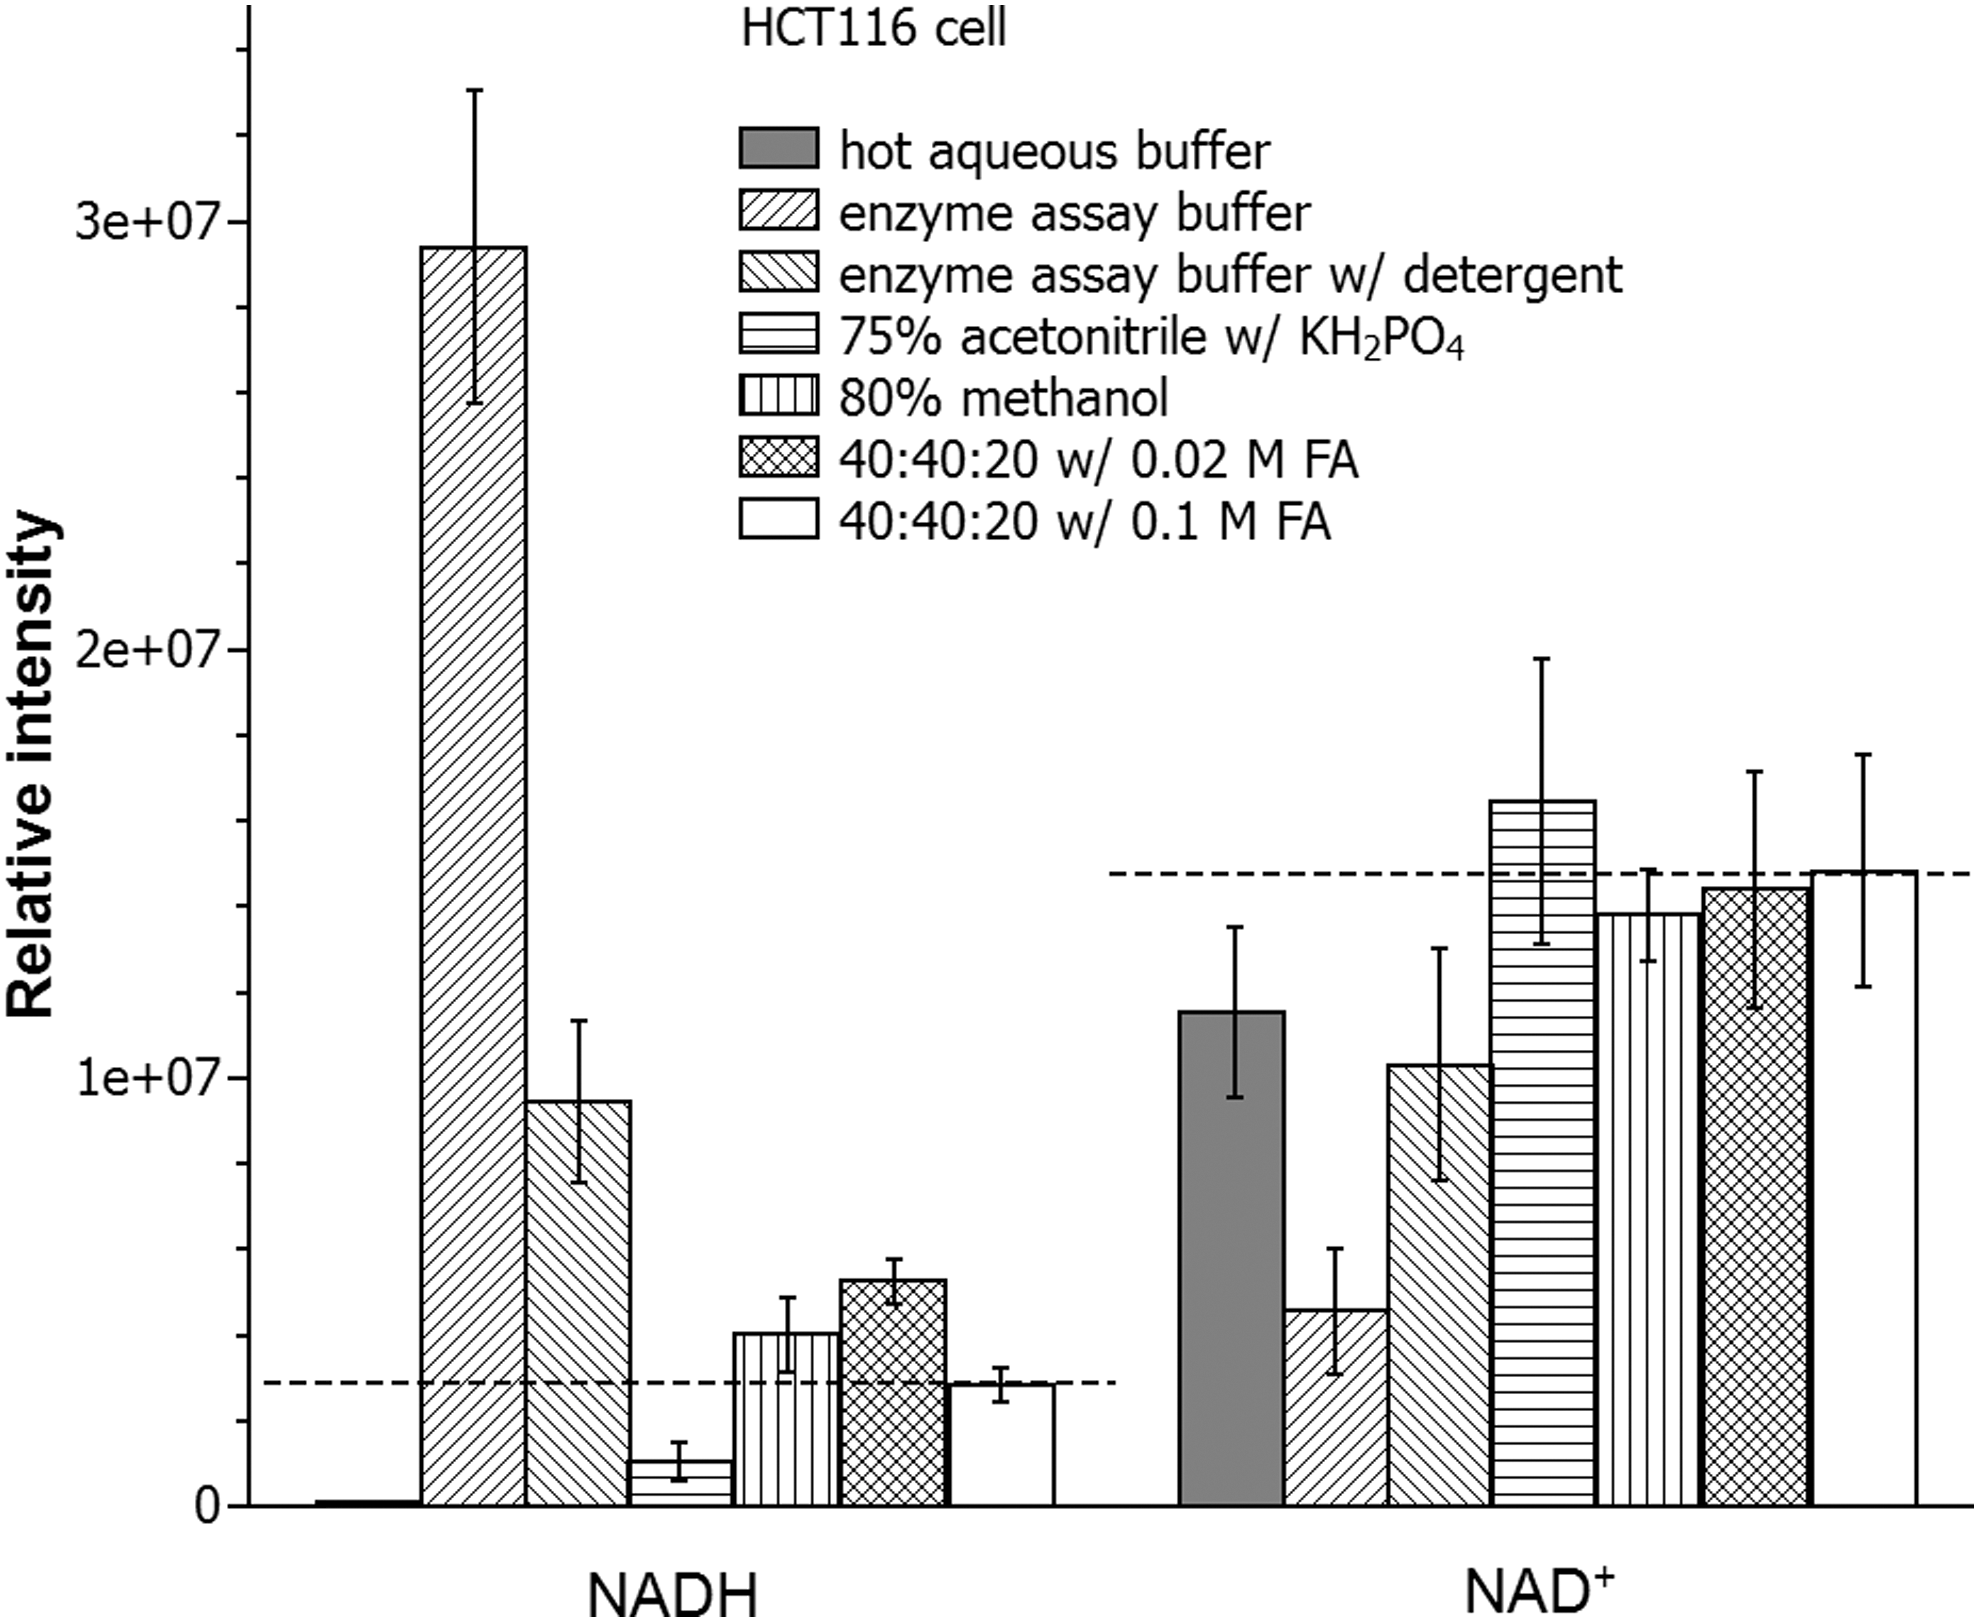
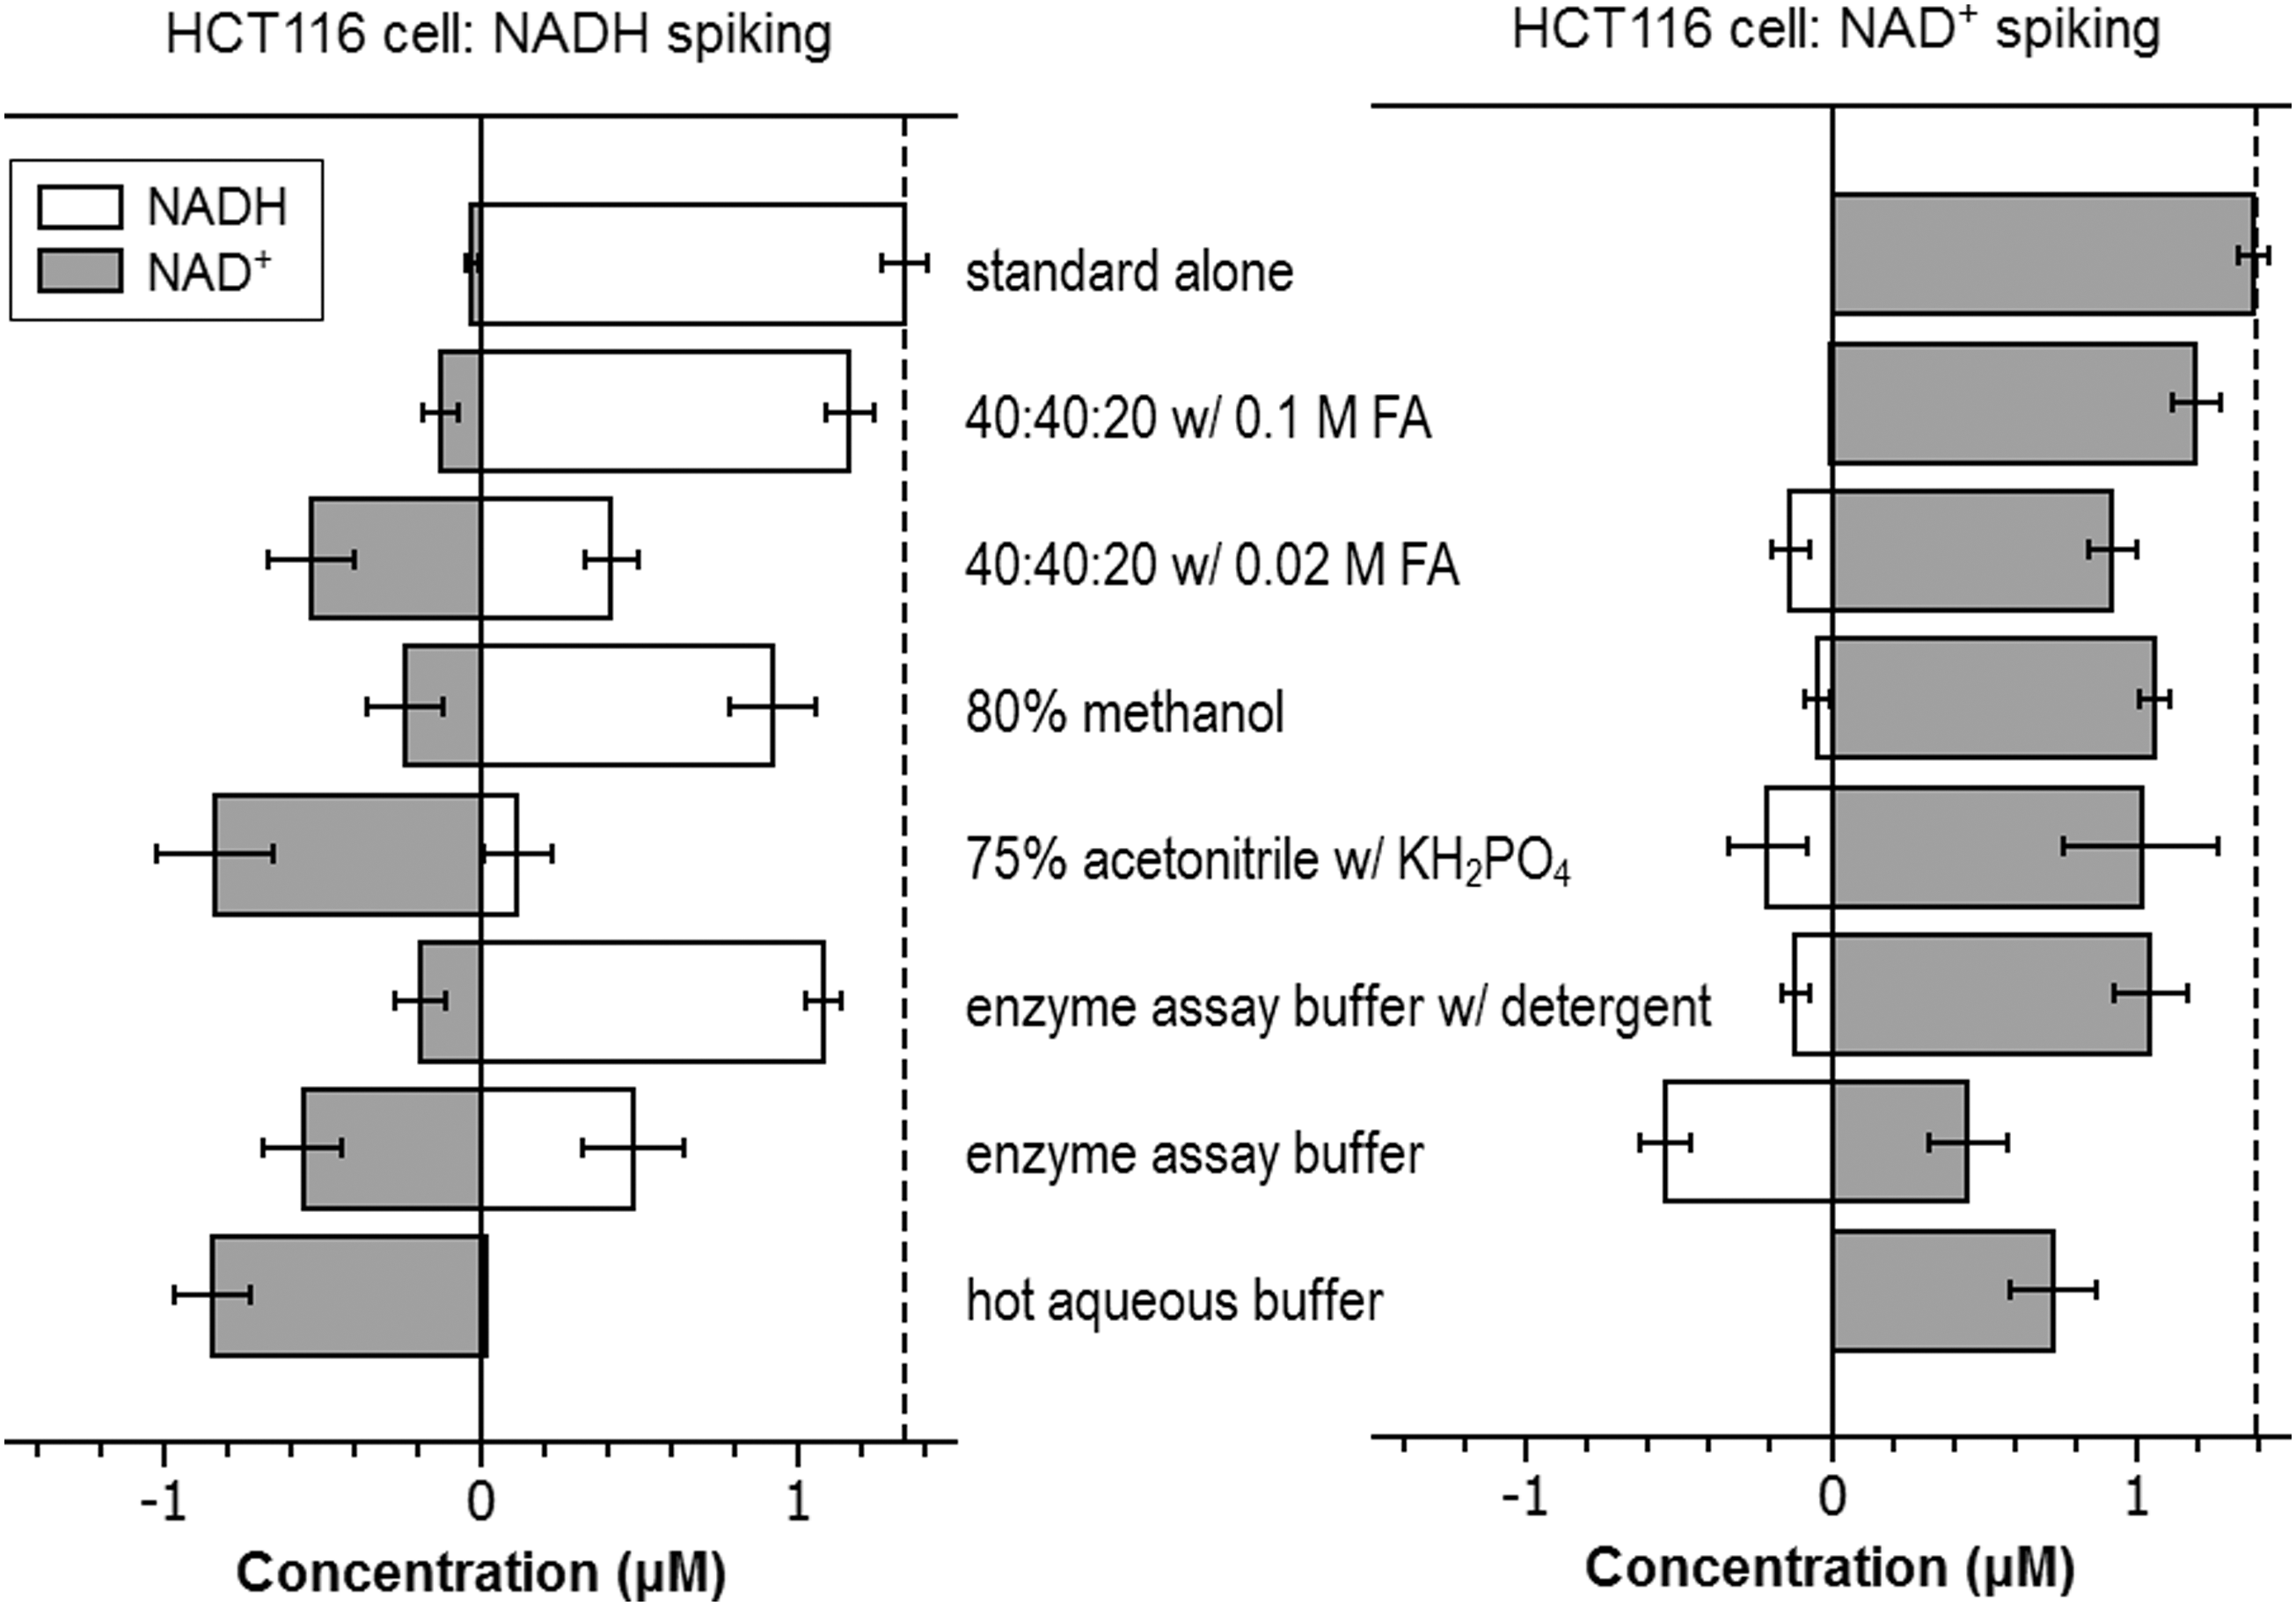
We also evaluated the extraction of NADH and NAD+ from HCT116 cells. Literature suggests that the concentration of NAD+ is significantly higher than NADH in mammalian cells, opposite of NADPH/NADP+ (31). Accordingly, while conversion from either direction is undesirable, conversion from NAD+ to NADH will generate a greater fractional error than the conversion from NADH to NAD+. The relative yield of NADH and NAD+ from seven different extraction methods is shown in Figure 6. Surprisingly, the method using enzyme assay buffer yields the highest level of NADH. This unexpected phenomenon prompted us to perform spiking experiment with 1.39 μM NAD+ (Table 1; Fig. 7). It turns out that more than one-third of spiked NAD+ (∼0.5 μM) is converted to NADH with the enzyme assay buffer. This indicated that the apparent high yield of NADH is not real, but an artifact of interconversion. When the NAD+ standard was added to this buffer in the absence of cell extract, no conversion to NADH was observed. Thus, the conversion during extraction is from residual enzyme activity. Other methods, including enzyme assay buffer with detergent, 75% acetonitrile with KH2PO4, 80% methanol, and 40:40:20 with 0.02 M formic acid, also exhibit some NAD+ conversion to NADH. In contrast, the 40:40:20 with 0.1 M formic acid method shows almost no such conversion. Similar “spiking” experiments were performed for 1.34 μM NADH (Table 1; Fig. 7). All the methods exhibit some conversion from NADH to NAD+. The hot aqueous buffer and 75% acetonitrile with KH2PO4 methods convert >80% of NADH to NAD+. Regarding the two aqueous buffers for enzyme assays, the addition of detergent decreases the conversion in both directions and thus is preferred. Overall, the 40:40:20 with 0.1 M formic acid method shows the least amount of conversion (Table 1) in both directions and thus is the best method for the measurement of NADH/NAD+. With this method, based on the isotope labeling and internal standard addition, we determined the absolute concentration of NADH and NAD+ in HCT116 cells (Table 2).
NADH and NAD+ from mouse liver
We next evaluated the extraction of NADH and NAD+ from mouse liver (Fig. 8). Hot aqueous buffer and 75% acetonitrile with KH2PO4 yield almost no NADH, presumably due to the degradation as observed in the cellular spiking studies (Fig. 7). The method using enzyme assay buffer yields the highest amount of NADH, but this is likely due to residual enzyme activity that converts NAD+ to NADH, as occurs with this method for the cultured cells (Fig. 7). The related method using buffer with detergent shows some improvement with less conversion from NAD+ to NADH, but the NAD+ detected is lower than those from the other three organic solvents, which each gave similar results, with a trend toward higher yields of both NAD+ and NADH with the 40:40:20 with 0.1 M formic acid method. With this method, we determined the recovery for the repeated extraction (Fig. 8B). Two rounds of extraction yield >99% recovery.

We then proceeded to measure the NADH and NAD+ in selected mouse tissues. Quantitation was achieved using external calibration with separate runs of unlabeled standards. Extraction was performed only once using the 40:40:20 with 0.1 M formic acid method and the final concentration was obtained after dividing by a factor of 0.925, which reflects the average ratio of NADH and NAD+ detected in the 1st extract compared to the combined yield of three rounds of extractions (Fig. 8B). Results are listed in Table 2. Compared to literature using 75% acetonitrile with KH2PO4 method on rat tissues, our work shows a lower ratio of NAD+/NADH: 2.6 versus 29.99 for the liver, 21.0 versus 47.53 for the brain, 4.7 versus 153.15 for the heart (22). This likely reflects better capture of NADH and prevention of NADH conversion to NAD+ during extraction.
Sample drying
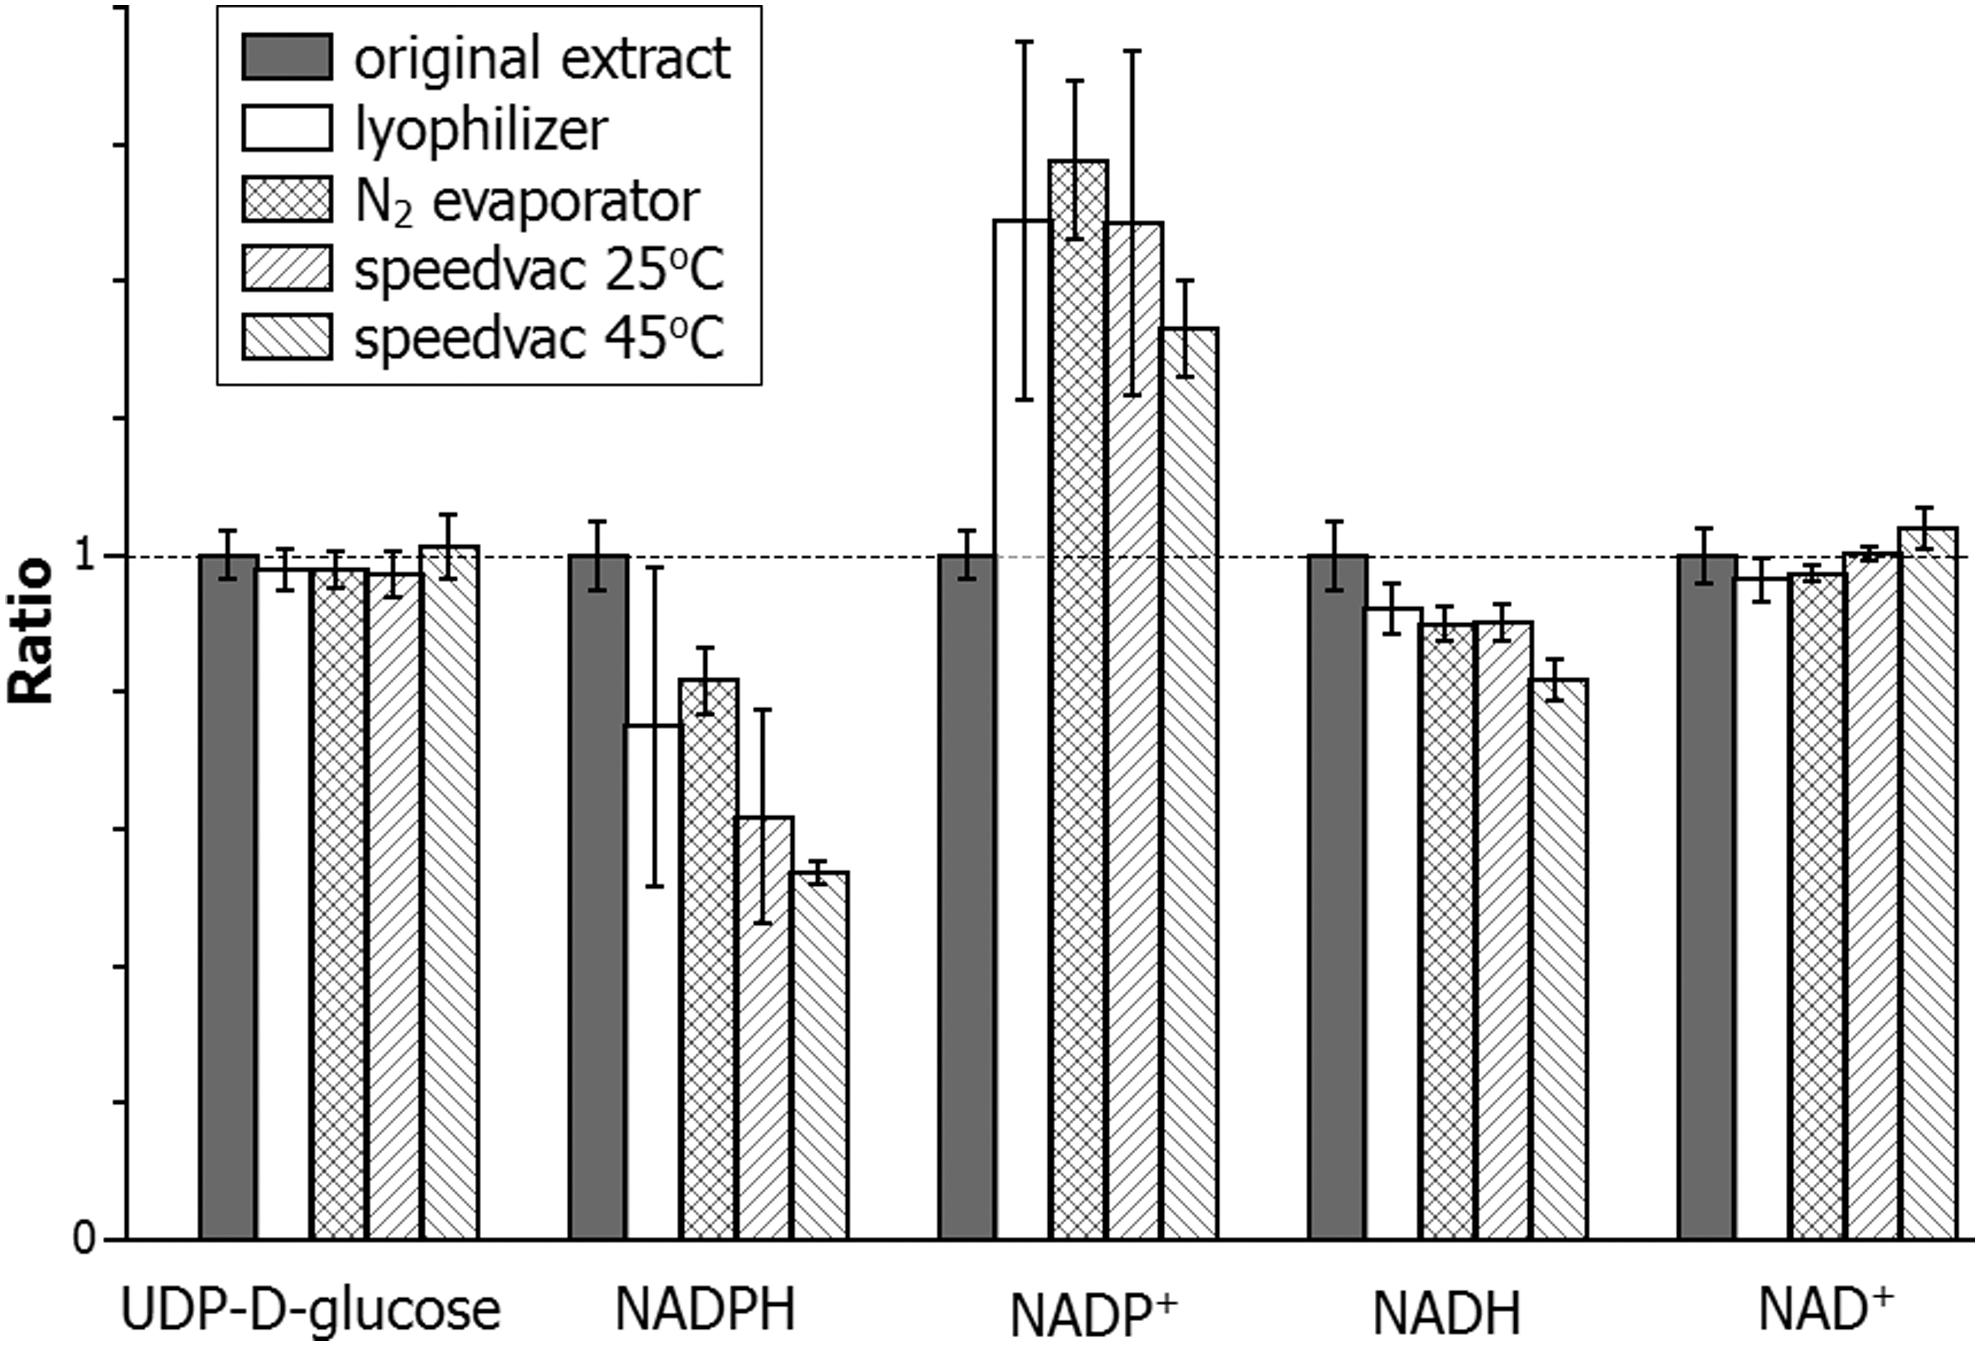
In the above comparison of extraction methods, all the extracts were analyzed immediately. In literature many procedures involve drying down the extract to concentrate samples, or to redissolve into a different solvent for better chromatographic peak shape. To evaluate the effect of solvent removal on NAD(P)(H), we dried extracts from mouse liver made using the 40:40:20 with 0.1 M formic acid extraction method. Results are shown in Figure 9. Most metabolites, with uridine-diphosphate-glucose shown as an example, are not affected by the drying process, as the amount detected is indistinguishable before and after. In contrast, NADPH is partially lost with all the drying methods and NADP+ increases, indicating some conversion of NADPH to NADP+ during the drying. NADH is also partially lost in all conditions. The level of NAD+ is much higher than NADH in this sample (Table 2); thus, the NAD+ level is insensitive to oxidation of NADH. The loss of NADPH and NADH is more severe at a higher temperature (compare SpeedVac operated at 25°C vs. 45°C). These results indicate that the solvent removal procedures will likely alter the ratio of NADPH/NADP+ and to a less extent, NADH/NAD+.
Discussion
In this study, we investigated several different extraction methods for the redox cofactors NADPH/NADP+/NADH/NAD+ from cultured mammalian cells and mammalian tissues. Relative yields of these metabolites were compared to identify the best extraction method. Most importantly, we spiked unlabeled standard to cells grown in medium containing 13C6-glucose during extraction to study the effect of metabolite interconversion. This proved to be quite informative; it revealed that residual catalytic activity is a major problem when measuring these cofactors. Importantly, interconversion may occur during the first few seconds or less of extraction, even if enzyme activity is eventually effectively quenched. For measurement of these cofactors from mammalian cells and tissues, we suggest the use of the 40:40:20 with 0.1 M formic acid extraction method as it most effectively stops interconversion, followed by LC-MS analysis. We note that the spiking studies to quantitate interconversion were conducted only for cell culture and not tissue specimens. Thus, although this method appears to be best of the current candidates, further work is needed to validate and, if necessary, improve tissue extraction. Beyond NAD(P)(H) measurement, we find that this quenching and extraction solvent generally works well for most water-soluble metabolites and thus is a good choice for metabolomics. Because the combination of acid, acetonitrile, and methanol quickly stops enzymatic activity, measurement of other high-energy compounds such as nucleotide triphosphates may also be more successful (33). In the case where MS analysis is not readily accessible, enzyme assays should be performed using extraction solvent containing detergent. Aqueous extraction solvent without detergent results in such extensive interconversion as to preclude even approximate analysis of redox ratios. In summary, failure to properly prevent interconversion between oxidized and reduced forms of the cofactors has limited prior measurement procedures for NAD(P)(H). Extraction with properly selected solvents followed by MS measurement should enable more accurate redox cofactor measurement going forward and thus drive progress in understanding redox biology.
Materials and Methods
Chemicals and reagents
Most chemicals and reagents in the study, including β-NADPH tetra(cyclohexylammonium) salt (≥95%, N5130), β-NADP+ disodium salt (≥97%, NADP-RO), β-NADH disodium salt (≥97%, N8129), β-NAD+ sodium salt (≥95%, N0632), tributylamine (90780), formic acid (90%, 399388), NH4HCO3 (09830), Triton X-100 (T8787), DTAB (D8638), and acetic acid (99%, 9508-02), were obtained from Sigma-Aldrich (St. Louis, MO). HPLC-grade acetonitrile (A955), methanol (A456), water (W6) were obtained from Fisher Scientific (Waltham, MA). 13C6-glucose (CLM-1396) was from Cambridge Isotope Laboratories (Tewksbury, MA) and 13C10 15N5-ADP was from Spectra Stable Isotopes (Columbia, MD).
LC-MS method development and validation
Two different LC-MS methods were developed for the analyses of these cofactors.
LC-MS Method 1
This method was used to generate the reported data. It is a reversed-phase ion pairing method, which is modified from earlier methods (26, 27). LC separation was achieved on a Synergy Hydro-RP column (150 × 2 mm, 4 μm particle size, 00F-4375-B0; Phenomenex, Torrance, CA), using Accela UHPLC system with Pal Autosampler (Thermo Fisher Scientific, San Jose, CA). Solvent A is 97:3 water:methanol with 10 mM tributylamine and 15 mM acetic acid, and solvent B is methanol. The gradient is as follows: 0 min, 0% B; 2 min, 0% B; 4 min, 20% B; 10 min, 80% B; 12 min, 100% B; 15 min, 100% B; 15.5 min, 0% B; 20 min, 0% B. Total running time is 20 min at a flow rate of 300 μl/min. Other LC parameters are autosampler temperature 5°C, injection volume 10 μl, and column temperature 25°C. An electrospray ionization interface was used to direct column eluant to an Exactive Orbitrap mass spectrometer (Thermo Fisher Scientific) operating in negative ion mode scanning m/z 400–800, with a resolution of 100,000 at m/z 200. Other MS parameters are sheath gas flow rate 25 (arbitrary units), aux gas flow rate 10 (arbitrary units), sweep gas flow rate 1 (arbitrary units), spray voltage 3 kV, capillary temperature 300°C, capillary voltage −60 V, tube lens voltage −140 V, skimmer voltage −30 V, AGC (automatic gain control) target 3E6, and maximum injection time 250 ms. Representative chromatograms are shown in Figure 1A and associated mass spectra are shown in Supplementary Figure S1. An important consideration, since we are going to examine NAD(P)(H) extraction with different solvents, is the impact of the injected sample solvent on peak shape. While peak shapes were in general acceptable, NAD+ exhibited substantial peak broadening or peak tailing when the samples contain high organic content. For quantitation, peak areas were used to account for any changes in peak shape as a function of extraction solvent.
On the MS side, detection was by high-resolution full scan in negative ion mode, using a ±10 parts-per-million mass window around the theoretical mass. For NADPH and NADH, major ions detected included the molecular anion [M-H]− and the sodium adduct [M+Na-2H]−, with the biggest peak the molecular anion, which we accordingly used for quantitation (Supplementary Fig. S1). The sodium adducts, with a typical signal intensity around 10%–15% of the corresponding molecular anion, were not used for quantitation because it does not affect the overall results. For NADP+ and NAD+, major ions detected included the molecular anion, the sodium adduct, and the in-source fragment due to loss of nicotinamide. In both cases, the largest signal was the in-source fragment and accordingly we summed the intensity with that of the molecular anion for quantitation.
This method was validated using authentic standards to examine LOD, linear range, and mass accuracy. Standards were dissolved in selected extraction solvents and analyzed at the following concentrations: NADPH at 0, 0.0026, 0.010, 0.044, 0.18, 0.44, 0.88, 1.75 μM, NADP+ at 0, 0.0038, 0.015, 0.064, 0.25, 0.64, 1.27, 2.54 μM, NADH at 0, 0.0042, 0.017, 0.070, 0.28, 0.70, 1.41, 2.82 μM, and NAD+ at 0, 0.0044, 0.018, 0.073, 0.29, 0.73, 1.46, 2.92 μM. The lowest concentration at which the signal is at least threefold of the corresponding background was defined as LOD. Linearity was calculated using the linear regression of the observed signal with respect to concentration, from LOD to the highest concentration tested. The difference between the measured mass and the theoretical mass was used to evaluate mass accuracy.
LC-MS Method 2
This method was used to validate all of the major results of Method 1. It is a HILIC method developed on a Q Exactive Plus mass spectrometer coupled to Vanquish UHPLC system (Thermo Fisher Scientific). LC separation was achieved on an Xbridge BEH Amide column (150 × 2 mm, 2.5 μm particle size; Waters, Milford, MA). Solvent A is 95:5 water:acetonitrile +20 mM ammonium acetate +20 mM ammonium hydroxide at pH 9.4, and solvent B is acetonitrile. The gradient is 0 min, 90% B; 2 min, 90% B; 5 min, 50% B; 11 min, 0% B; 13.5 min, 0% B; 15 min, 90% B; 20 min, 90% B. Total running time is 20 min at a flow rate of 150 μl/min. Other LC parameters are autosampler temperature 5°C, injection volume 5 μl, and column temperature 25°C. The Q Exactive Plus mass spectrometer was operated in negative ion mode scanning m/z 400–800, with a resolution of 140,000 at m/z 200. Other MS parameters are sheath gas flow rate 28 (arbitrary units), aux gas flow rate 10 (arbitrary units), sweep gas flow rate 1 (arbitrary units), spray voltage 3 kV, capillary temperature 300°C, S-lens RF level 65, AGC target 3E6, and maximum injection time 500 ms. Representative chromatograms are shown in Figure 1B. This method was used to further validate the major results from Method 1.
Compound stability
Individual NADPH, NADP+, NADH, NAD+ standards were weighed and dissolved in water at a concentration of 1 mg/ml. The solutions were further diluted to a concentration of 2 μM into buffers of 0.1 M formic acid in water with a pH of 2.4, and 10 mM NH4HCO3 in water with a pH of 7.4. The 2 μM solutions were transferred to 2-ml glass vials, stored in the autosampler kept at a temperature of 5°C, and repeatedly analyzed over a 24-h period. For selected extraction methods, mouse liver extracts were evaluated in a similar way.
Evaluation of different extraction methods for mammalian cell culture
To extract metabolites from adherent mammalian cell cultures, one well-documented approach is to aspirate the media and add the extraction solvent directly to the plate, followed by scraping the plate with cell scraper (28, 50). While this method has the important advantage of quenching metabolism with minimal disruption of the cells, here for convenience we used a “pellet”-based approach, which allows cells from a single culture to be distributed across tubes and thereby extracted with different solvents. This approach is not preferred for biological studies due to the risk of metabolic alterations during pelleting, but is appropriate for comparing different extraction procedures. HCT116 (ATCC CCL-247; ATCC, Manassas, VA) cells were grown in a 15-cm plate containing Dulbecco's modified Eagle's medium (DMEM) (10-017; Cellgro, Manassas, VA) without pyruvate and supplemented with 10% fetal bovine serum (FBS) (F6178; Sigma-Aldrich) in an incubator with 5% carbon dioxide and ambient oxygen at 37°C. When the cells reached 80% confluence, cells were trypsinized, mixed with 15 ml DMEM, and aliquoted into multiple 1.5-ml centrifuge tubes, with additional aliquot loaded into packed cell volume tubes (TP87006; Midwest Scientific, Valley Park, MO) to determine the cell volume. Cells were then centrifuged at 1000 g for 2 min at room temperature resulting in a pellet at the bottom. Medium was aspirated and extraction solvent added. The amount of extraction solvent was chosen to achieve a ratio of 50 μl solvent: 1 μl cell volume, with ∼250 μl solvent, and 5 μl cells used for all extraction methods. Detailed extraction procedures are described below.
1. “Hot aqueous buffer”: This method was adopted from Reference (29). 5 mM ammonium acetate in water (pH 8.0) was preheated at 85
2. “Enzyme assay buffer”: This extraction method follows that of one well-documented enzyme assay (16, 20, 39, 41
–44, 49, 51, 52). The aqueous buffer contains 10 mM nicotinamide, 20 mM NaHCO3, 100 mM Na2CO3 precooled on ice. The buffer was added to the cell pellet, vortexed for 10 s, and samples allowed to sit on dry ice for 20 min, followed by 10 min at room temperature, another 20 min on dry ice, and another 10 min at room temperature, and then centrifuged at 16,000 g for 15 min at 4
3. “Enzyme assay buffer with detergent”: This method follows that of commercial NADP/NADPH-Glo enzyme assay kit (G9081; Promega, Madison, WI) (2, 7, 9
–11, 19, 34
–36, 45). The extraction buffer contains 10 mM nicotinamide, 20 mM NaHCO3, 100 mM Na2CO3, 0.05% Triton X-100, and 1% DTAB (D8638; Sigma-Aldrich), precooled on ice. The solvent was added to the cell pellet, vortexed for 10 s, and samples allowed to sit on ice for 20 min and then centrifuged at 16,000 g at 4
4. “75% acetonitrile with KH2PO4”: This method was adopted from Reference (22). The solvent is acetonitrile +10 mM aqueous KH2PO4 (3:1, v:v), pH adjusted to 7.4 using NH4OH, and precooled on ice. The solvent was added to the cell pellet, vortexed for 10 s, and allowed to sit in −20
5. “80% methanol”: This method was adopted from References (12, 50). The solvent mixture is 80% methanol in water, precooled on dry ice. The cold solvent was added to the cell pellet, vortexed for 10 s, and allowed to sit on dry ice for 20 min. Samples were then centrifuged at 16,000 g for 15 min at 4
6. “40:40:20 with 0.02 M formic acid”: Solvent A is 40:40:20 acetonitrile:methanol:water with 0.02 M formic acid, and solvent B is 15% NH4HCO3 in water (w:v), precooled on ice. Solvent A was added to the cell pellet, vortexed for 10 s, and allowed to sit on ice for 3 min. For each 100 μl of solvent A, 1.7 μl of solvent B was then added and vortexed to neutralize the samples, and the mixture allowed to sit on dry ice for 20 min. Samples were then centrifuged at 16,000 g for 15 min at 4
7. “40:40:20 with 0.1 M formic acid”: Solvent A is 40:40:20 acetonitrile:methanol:water with 0.1 M formic acid, and solvent B is 15% NH4HCO3 in water (w:v), precooled on ice. Solvent A was added to the cell pellet, vortexed for 10 s, and allowed to sit on ice for 3 min. For each 100 μl of solvent A, 8.7 μl of solvent B was then added and vortexed to neutralize the sample, and the mixture allowed to sit on dry ice for 20 min. Volumes were calculated to produce a total volume of 50 μl solvent per 1 μl of cell volume. Samples were then centrifuged at 16,000 g for 15 min at 4°C and supernatant taken for LC-MS analysis.
To evaluate the metabolite interconversion during extraction, cells were plated in 15-cm plates, grown for 1 day before switching to DMEM with 10% dialyzed FBS (Sigma-Aldrich) with 13C6-glucose in place of the normal glucose in the medium. Cells were incubated in the isotopic labeling medium for 48 h to fully label intracellular metabolites. Known amounts of unlabeled NADPH (0.81 μM final concentration), NADP+ (1.23 μM final concentration), NADH (1.34 μM final concentration), NAD+ (1.39 μM final concentration) standards were added to the extraction solvents 2 min before extraction. Extraction was carried out as described above, separately for each standard. The amount of unlabeled NADPH/NADP+/NADH/NAD+ in extracts was quantified by comparing to the signal from separate runs of standards in the corresponding extraction solvents. The spiked NAD(P)(H) also serves as an internal standard, which, in the absence of substantial interconversion, allows measurement of metabolite concentration in cells (4, 31). Note that NAD(P)(H) concentrations from cultured cells were determined by isotope labeling of the cells and spiking in internal standard at a single concentration, while NAD(P)(H) concentrations from mouse tissues were determined by an external calibration curve.
Evaluation of different extraction methods for mouse tissues
Two-month-old female wild-type C57BL/6 mice (The Jackson Laboratory, Bar harbor, ME) on normal diet were sacrificed by cervical dislocation and tissues quickly dissected and snap frozen in liquid nitrogen with precooled Wollenberger clamp (30). This avoids further metabolite turnover and helps to protect unstable compounds. Frozen samples from liquid nitrogen were then transferred to −80°C freezer for storage. Tissue samples were generally analyzed within 1 week after collection to avoid metabolite degradation. We used mouse liver to evaluate different extraction methods. To extract metabolites, frozen liver tissue samples were first weighed individually (∼20 mg each sample) and ground with a cryomill machine (Retsch, Newtown, PA) maintained at cold temperature using liquid nitrogen (18). Samples were then extracted using methods described above, using a ratio of 1000 μl of final extraction solvent for 20 mg of tissues, with the only difference being the centrifugation time of 30 min instead of 15 min.
One question regarding tissue extraction is the extraction efficiency and recovery. Due to the lack of commercially available isotope-labeled standards for these compounds, a “spiking” experiment on tissue was not possible. To estimate the extraction efficiency, 13C10 15N5-ADP was added to the extraction solvent at first step at a concentration of 2 μM, and extraction conducted as above to obtain the 1st extract. The remaining pellets were extracted twice using a solvent containing no 13C10 15N5-ADP to obtain the 2nd and 3rd extracts. The amount of 13C10 15N5-ADP detected in 1st, 2nd, and 3rd extracts was used to evaluate the extraction efficiency and recovery.
To obtain the absolute metabolite concentration in various organs, we used an external calibration approach due to the lack of isotope-labeled standards. Selected mouse tissues in triplicate were extracted using the indicated method only once (1st extract), and the signal compared to the separate runs of NADPH/NADP+/NADH/NAD+ standards at 3, 2, 1, 0.5 μM in corresponding solvent. Measured values were multiplied by a recovery factor of (1st extract + 2nd extract + 3rd extract)/(1st extract) to account for incomplete extraction.
Metabolite loss with different drying methods
Thirty milligrams of mouse liver tissue was extracted using 1.38 ml 40:40:20 acetonitrile:methanol:water with 0.1 M formic acid, followed by neutralization with 121 μl of 15% NH4HCO3 in water. The extract was divided into multiple 200 μl portions and dried using the following devices: a lyophilizer (Labconco, Kansas City, MO), N2-evaporator (Organomation Associates, Berlin, MA), and SpeedVac concentrators (Thermo Scientific, Waltham, MA) operated at 25°C and 45°C, respectively. The dried samples were then redissolved in 200 μl of 10 mM NH4HCO3 in water. The experiment was also conducted with the dried samples redissolved in 40:40:20 acetonitrile:methanol:water containing 10 mM NH4HCO3 with similar results.
Footnotes
Acknowledgments
The authors thank the members of Rabinowitz Lab for discussion and comments. This work is supported by the National Institutes of Health grants CA163591 and DK113643 to J.D.R., CA211437 to W.L., P30DK019525, which supports a joint Princeton-U Penn Metabolomics Core for Diabetes Research, and P30CA072720 for Rutgers Cancer Institute of New Jersey.
Author Disclosure Statement
No competing financial interests exist.
Abbreviations Used
References
Supplementary Material
Please find the following supplemental material available below.
For Open Access articles published under a Creative Commons License, all supplemental material carries the same license as the article it is associated with.
For non-Open Access articles published, all supplemental material carries a non-exclusive license, and permission requests for re-use of supplemental material or any part of supplemental material shall be sent directly to the copyright owner as specified in the copyright notice associated with the article.