
Abstract
Aims:
Cyclic adenosine 3′5′-monophosphate (cAMP) is a universal second messenger that plays an important role in intracellular signal transduction. cAMP is synthesized by adenylate cyclases from adenosine triphosphate and terminated by the phosphodiesterases (PDEs). In the present study, we investigated the role of the cAMP pathway in tubular epithelial cell mitochondrial biogenesis in the pathogenesis of renal fibrosis.
Results:
We found that the cAMP levels were decreased in fibrotic kidney tissues, and replenishing cAMP could ameliorate tubular atrophy and extracellular matrix deposition. The downregulation of cAMP was mainly attributed to the increased PDE4 expression in tubular epithelial cells. The inhibition of PDE4 by PDE4 siRNA or the specific inhibitor, rolipram, attenuated unilateral ureteral obstruction-induced renal interstitial fibrosis and transforming growth factor (TGF)-β1-stimulated primary tubular epithelial cell (PTC) damage. The Epac1/Rap1 pathway contributed to the main effect of cAMP on renal fibrosis. Rolipram could restore C/EBP-β and PGC-1α expression and protect the mitochondrial function and structure of PTCs under TGF-β1 stimulation. The antifibrotic role of rolipram in renal fibrosis relies on C/EBP-β and PGC-1α expression in tubular epithelial cells.
Innovation and Conclusion:
The results of the present study indicate that cAMP signaling regulates the mitochondrial biogenesis of tubular epithelial cells in renal fibrosis. Restoring cAMP by the PDE4 inhibitor rolipram may ameliorate renal fibrosis by targeting C/EBP-β/PGC1-α and mitochondrial biogenesis. Antioxid. Redox Signal. 29, 637–652.
Introduction
C
Cyclic adenosine 3′5′-monophosphate (cAMP) is one of the most common second messengers involved in several cellular processes, including gene transcription (29, 54), cell proliferation, differentiation, migration, apoptosis, calcium homeostasis, immune reaction (17), and insulin secretion (25, 54).
cAMP is synthesized by adenylate cyclases (ACs) from adenosine triphosphate (ATP) and is terminated by the cAMP phosphodiesterase (PDE) (73). The PDE family includes 11 isoforms. PDE4, PDE7, and PDE8 are selective for cAMP. Previous studies have identified that PDE4 is widely expressed in tubules (16). The inhibition of PDE4 has repeatedly shown suppressive effects on tubular damage in acute renal failure (30, 39, 42). The antifibrotic effects of cAMP have been demonstrated in several animal models, such as the 5/6 subtotal nephrectomy, anti-Thy1 nephritic rat model and the streptozotocin-induced rat diabetic nephropathy model (10, 38, 61).
However, the mechanism of cAMP in tubular epithelial cells in the development of renal fibrosis needs further investigation. Proximal tubular cells are rich in mitochondria and mainly rely on mitochondrial metabolism to synthesize ATP. Restoring mitochondrial biogenesis has been reported to ameliorate tubular epithelial cell damage in the face of profibrotic injury (22, 23, 41, 72). Considering the significant role of cAMP in mitochondrial biogenesis (7, 65), we hypothesize that the antifibrotic effect of cAMP may rely on the mitochondrial biogenesis of tubular epithelial cells.
cAMP mediates its effects via four effectors as follows: protein kinase A (PKA) (67), exchange protein Epac (6, 14), the cyclic nucleotide-gated channels (33), and the Popeye domain-containing proteins (56). The role of cAMP–PKA signaling in the regulation of mitochondrial homeostasis is under intense study in recent years. This signaling can activate nuclear cAMP response element-binding proteins (CREBs) and the downstream transcription factor PGC-1α, which in turn regulates mitochondrial biogenesis (66). In addition to its role in mitochondrial biogenesis, PKA signaling can also regulate the import of mitochondria proteins (43, 47) and is physiologically significant in regulating mitochondrial fusion and fission (9, 11).
However, the role of Epac in mitochondrial function has not been fully recognized. Park et al. demonstrated that the inhibition of cAMP PDEs by resveratrol promotes mitochondrial function via Epac1 through AMPK and PGC-1α (44). Stokman et al. found that the activation of Epac could reduce antioxidant signaling during ischemia/reperfusion injury and prevent tubular epithelial injury and renal failure (58).
Epac1 and Epac2 are expressed throughout the nephron and collecting duct, and Epac1 has been shown to be more abundant than Epac2 in tubular epithelial cells (37). Epac plays a pivotal role in the modulation of Na+/H+ exchangers, urea transport, Na+-K+-ATPase activity, and membrane trafficking of renal tubule (8). Epac is also intimately involved in many forms of kidney diseases, such as diabetic kidney disease, ischemic kidney injury, and glomerular diseases (71). Selectively activating Epac by 8-Me-cAMP attenuated transforming growth factor (TGF)-β-induced MDCK cell damage (75, 76). However, the underlying mechanisms of Epac in the fibrosis remain elusive.
The present study examines the role of cAMP signaling in renal fibrosis. In addition, we further explored the function of the cAMP-Epac pathway in mitochondrial biogenesis in tubular epithelial cells under profibrotic conditions. Finally, targeting PDE4 to increase the level of cAMP is a viable therapeutic approach to suppress renal fibrosis and chronic renal failure.
Results
Decreased cAMP levels in renal tissues with fibrosis
To evaluate changes of cAMP levels in the fibrotic kidneys, we generated various animal models leading to renal fibrosis. Angiotensin II (Ang II) infused by mini-pump for 4 weeks developed renal fibrosis with matrix deposition, as previously described (15) (Fig. 1A, B), and the cAMP level in the kidney tissues was significantly decreased (Fig. 1C). In the rat adriamycin model of chronic renal failure, interstitial ECM accumulated in the cortical area (Fig. 1D, E), and the cAMP level in the fibrotic kidneys was downregulated by more than one-third that of the control kidneys, and the difference was statistically significant (Fig. 1F).
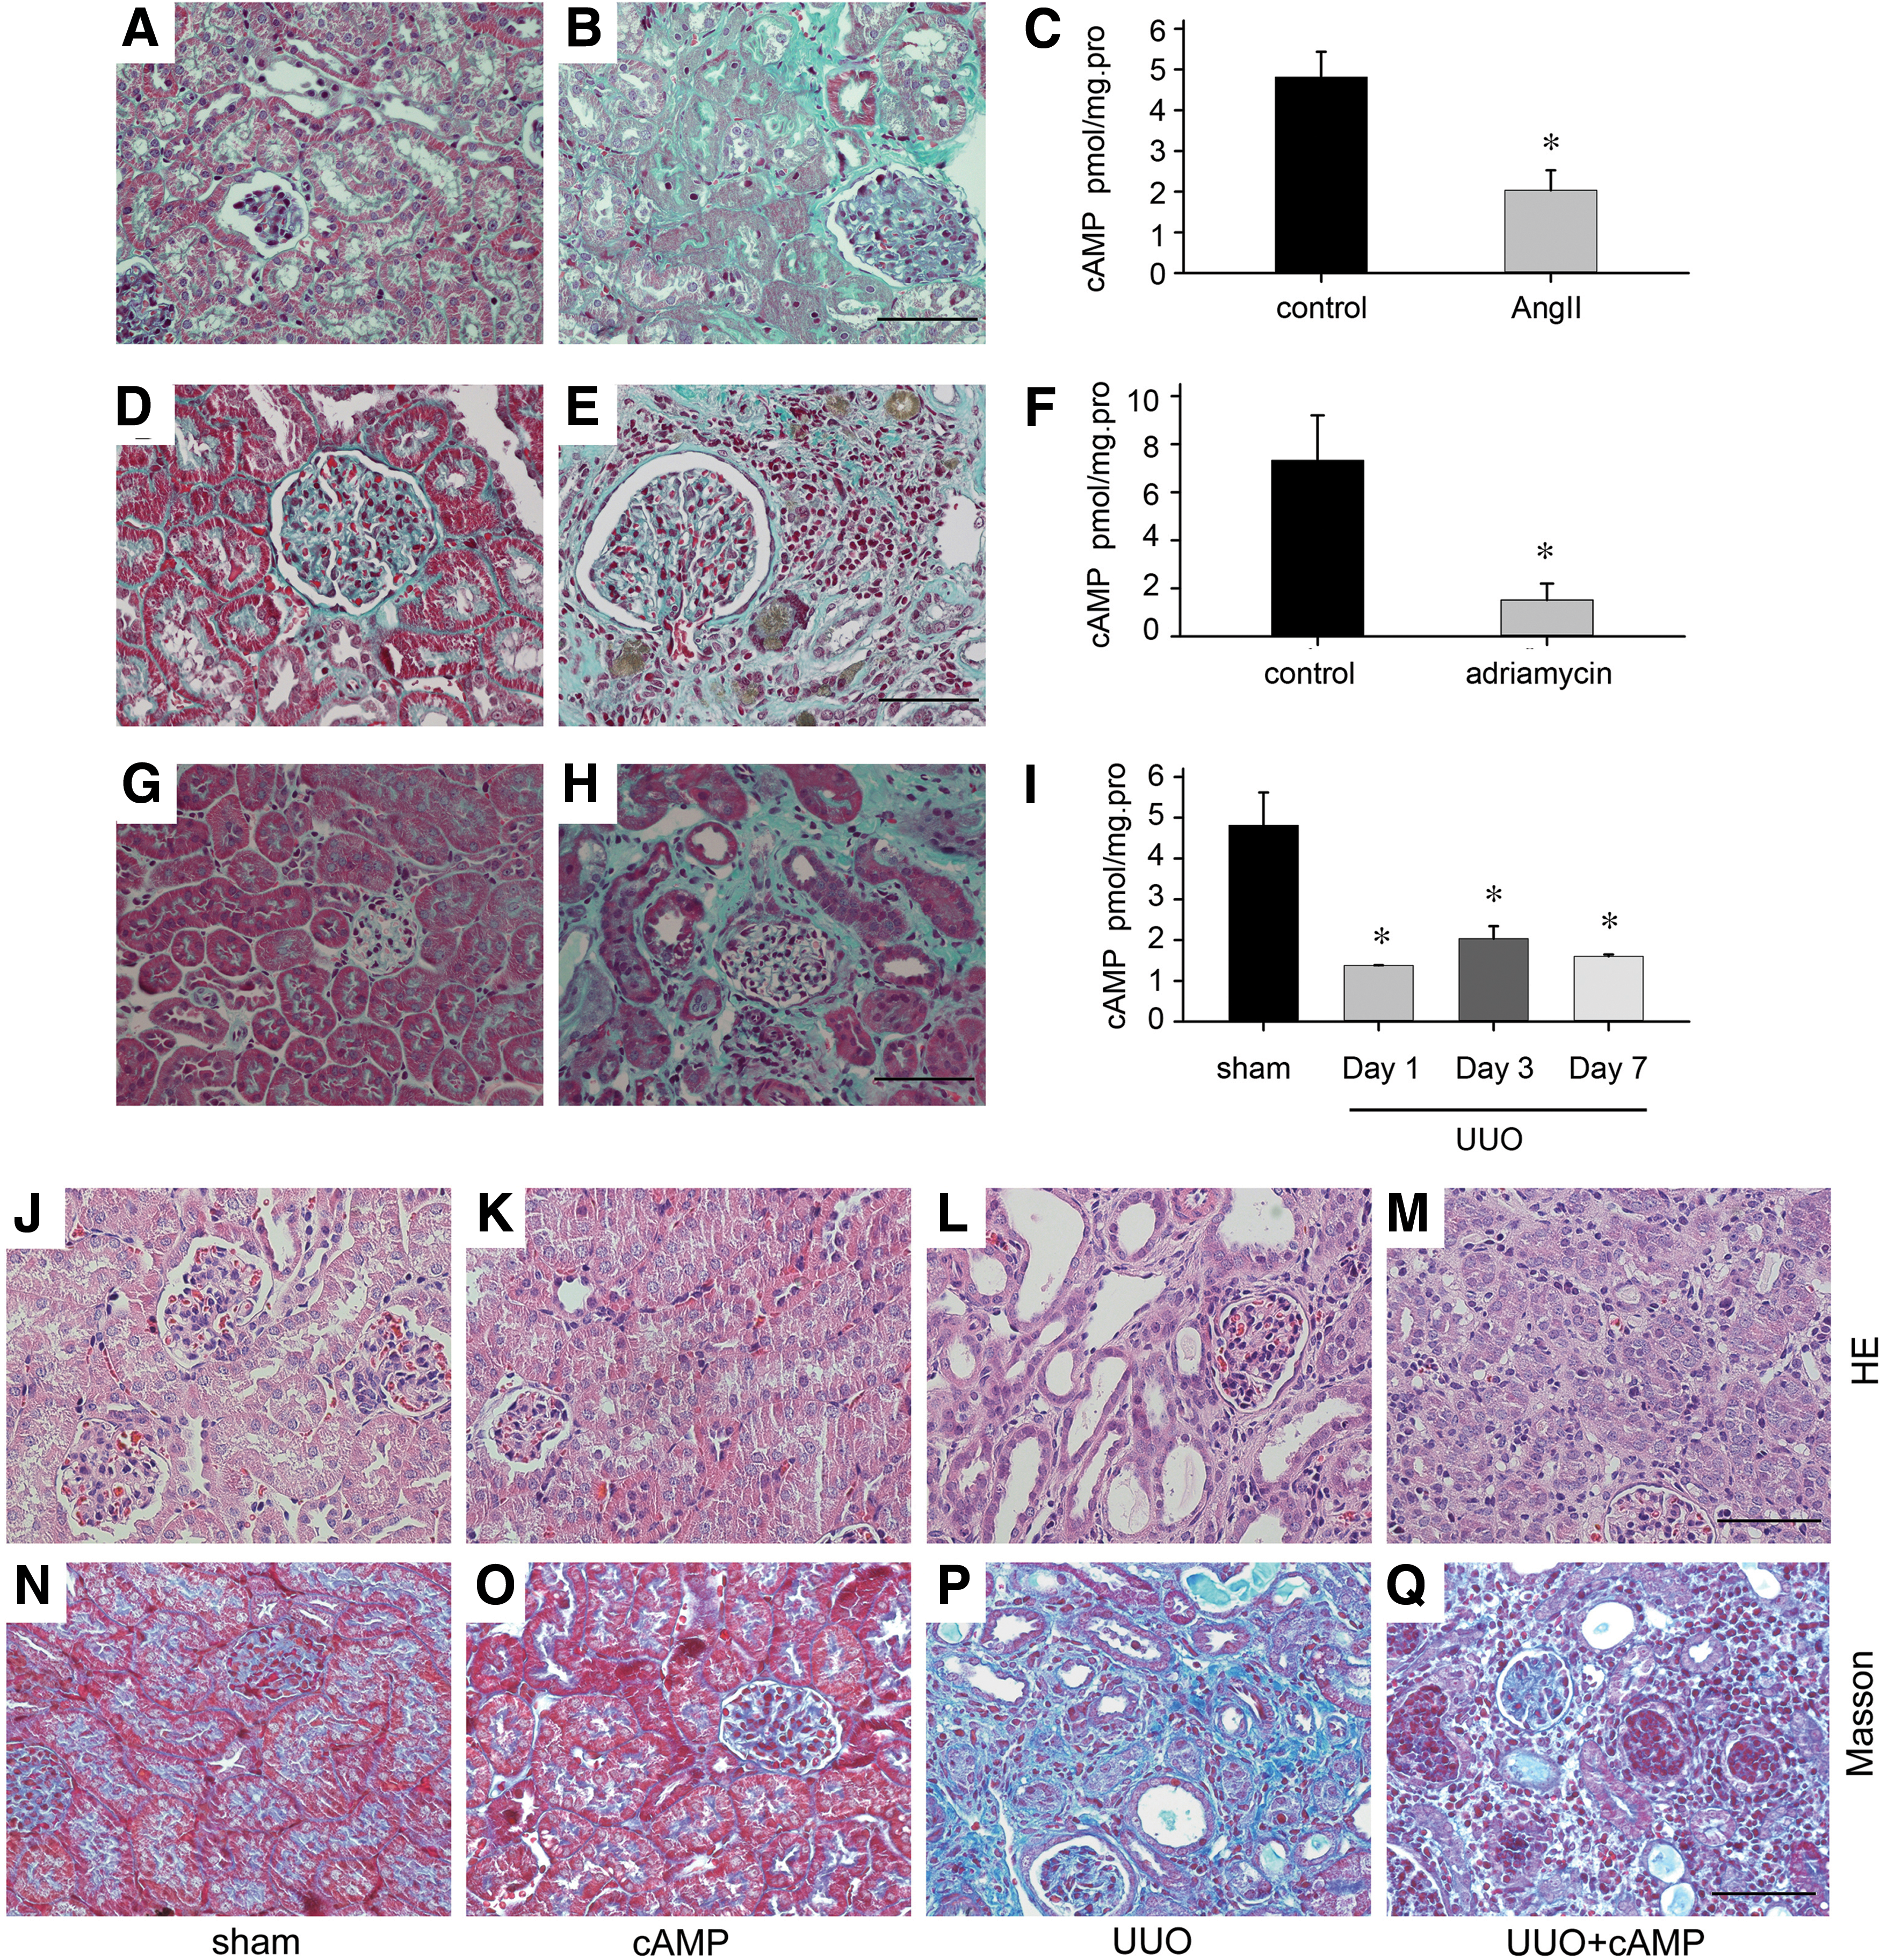
We also monitored the cAMP levels in the tubules of fibrotic kidneys induced by unilateral ureteral obstruction (UUO) at various times. We found that the level of cAMP in the tubules was sharply decreased at day 1 after UUO and consistently decreased until day 7 (Fig. 1G–I).
To further confirm the role of cAMP in renal fibrosis, we treated UUO mice with cAMP by vein injection daily. The effect of cAMP on renal fibrosis is summarized in Figure 1J–Q. Histological examination showed that cAMP injection could ameliorate tubular atrophy and dilation, as well as the infiltration of inflammatory cells (Fig. 1J–M) and interstitial fibrosis induced by UUO (Fig. 1N–Q). These results suggest that cAMP signaling is essential for renal fibrosis.
PDE upregulation contributed to the decrease of cAMP in tubular epithelial cells in renal fibrosis
The concentrations of cAMP in cells are determined by the rate of synthesis by ACs and degradation by cyclic nucleotide PDEs. ACs II, III, IV, and IX are mainly expressed in the proximal tubules (68). We detected the mRNA levels of ACs in separated tubules in fibrotic kidneys. Only the mRNA expression of AC IX was decreased on the first day after UUO (Fig. 2A). The PDE mRNA expression profile of renal tubules was also assessed by real-time PCR. The mRNA expression of PDE3b, PDE4a, and PDE4b was dramatically increasing compared with the other PDE isoforms (Fig. 2B).

Then, we detected the dynamic changes of PDE4a and PDE4b in the process of fibrosis induced by UUO. The mRNA levels of PDE4a and PDE4b steadily decreased in a time-dependent manner after UUO (Fig. 2C). Immunohistochemical staining exhibited that PDE4b was remarkably induced and predominantly localized in tubular epithelial cells on day 1 after UUO (Fig. 2D–G).
Rolipram is a specific inhibitor of PDE4. Considering the protective effect of cAMP against renal fibrosis, we reasoned that the benefit of rolipram might be achieved in renal fibrosis in vivo by inhibiting the degradation of cAMP. Thus, vehicle or rolipram at 5 mg/kg was administered via intraperitoneal injection at 1 day before UUO and continuing injections at a dose of 5 mg/kg/day. As shown in Figure 3A, rolipram led to a significant reduction of FN expression in the kidneys of mice after UUO surgery. Quantitative determination showed a more than 50% suppression of FN protein over the vehicle control with significant differences (Fig. 3B).
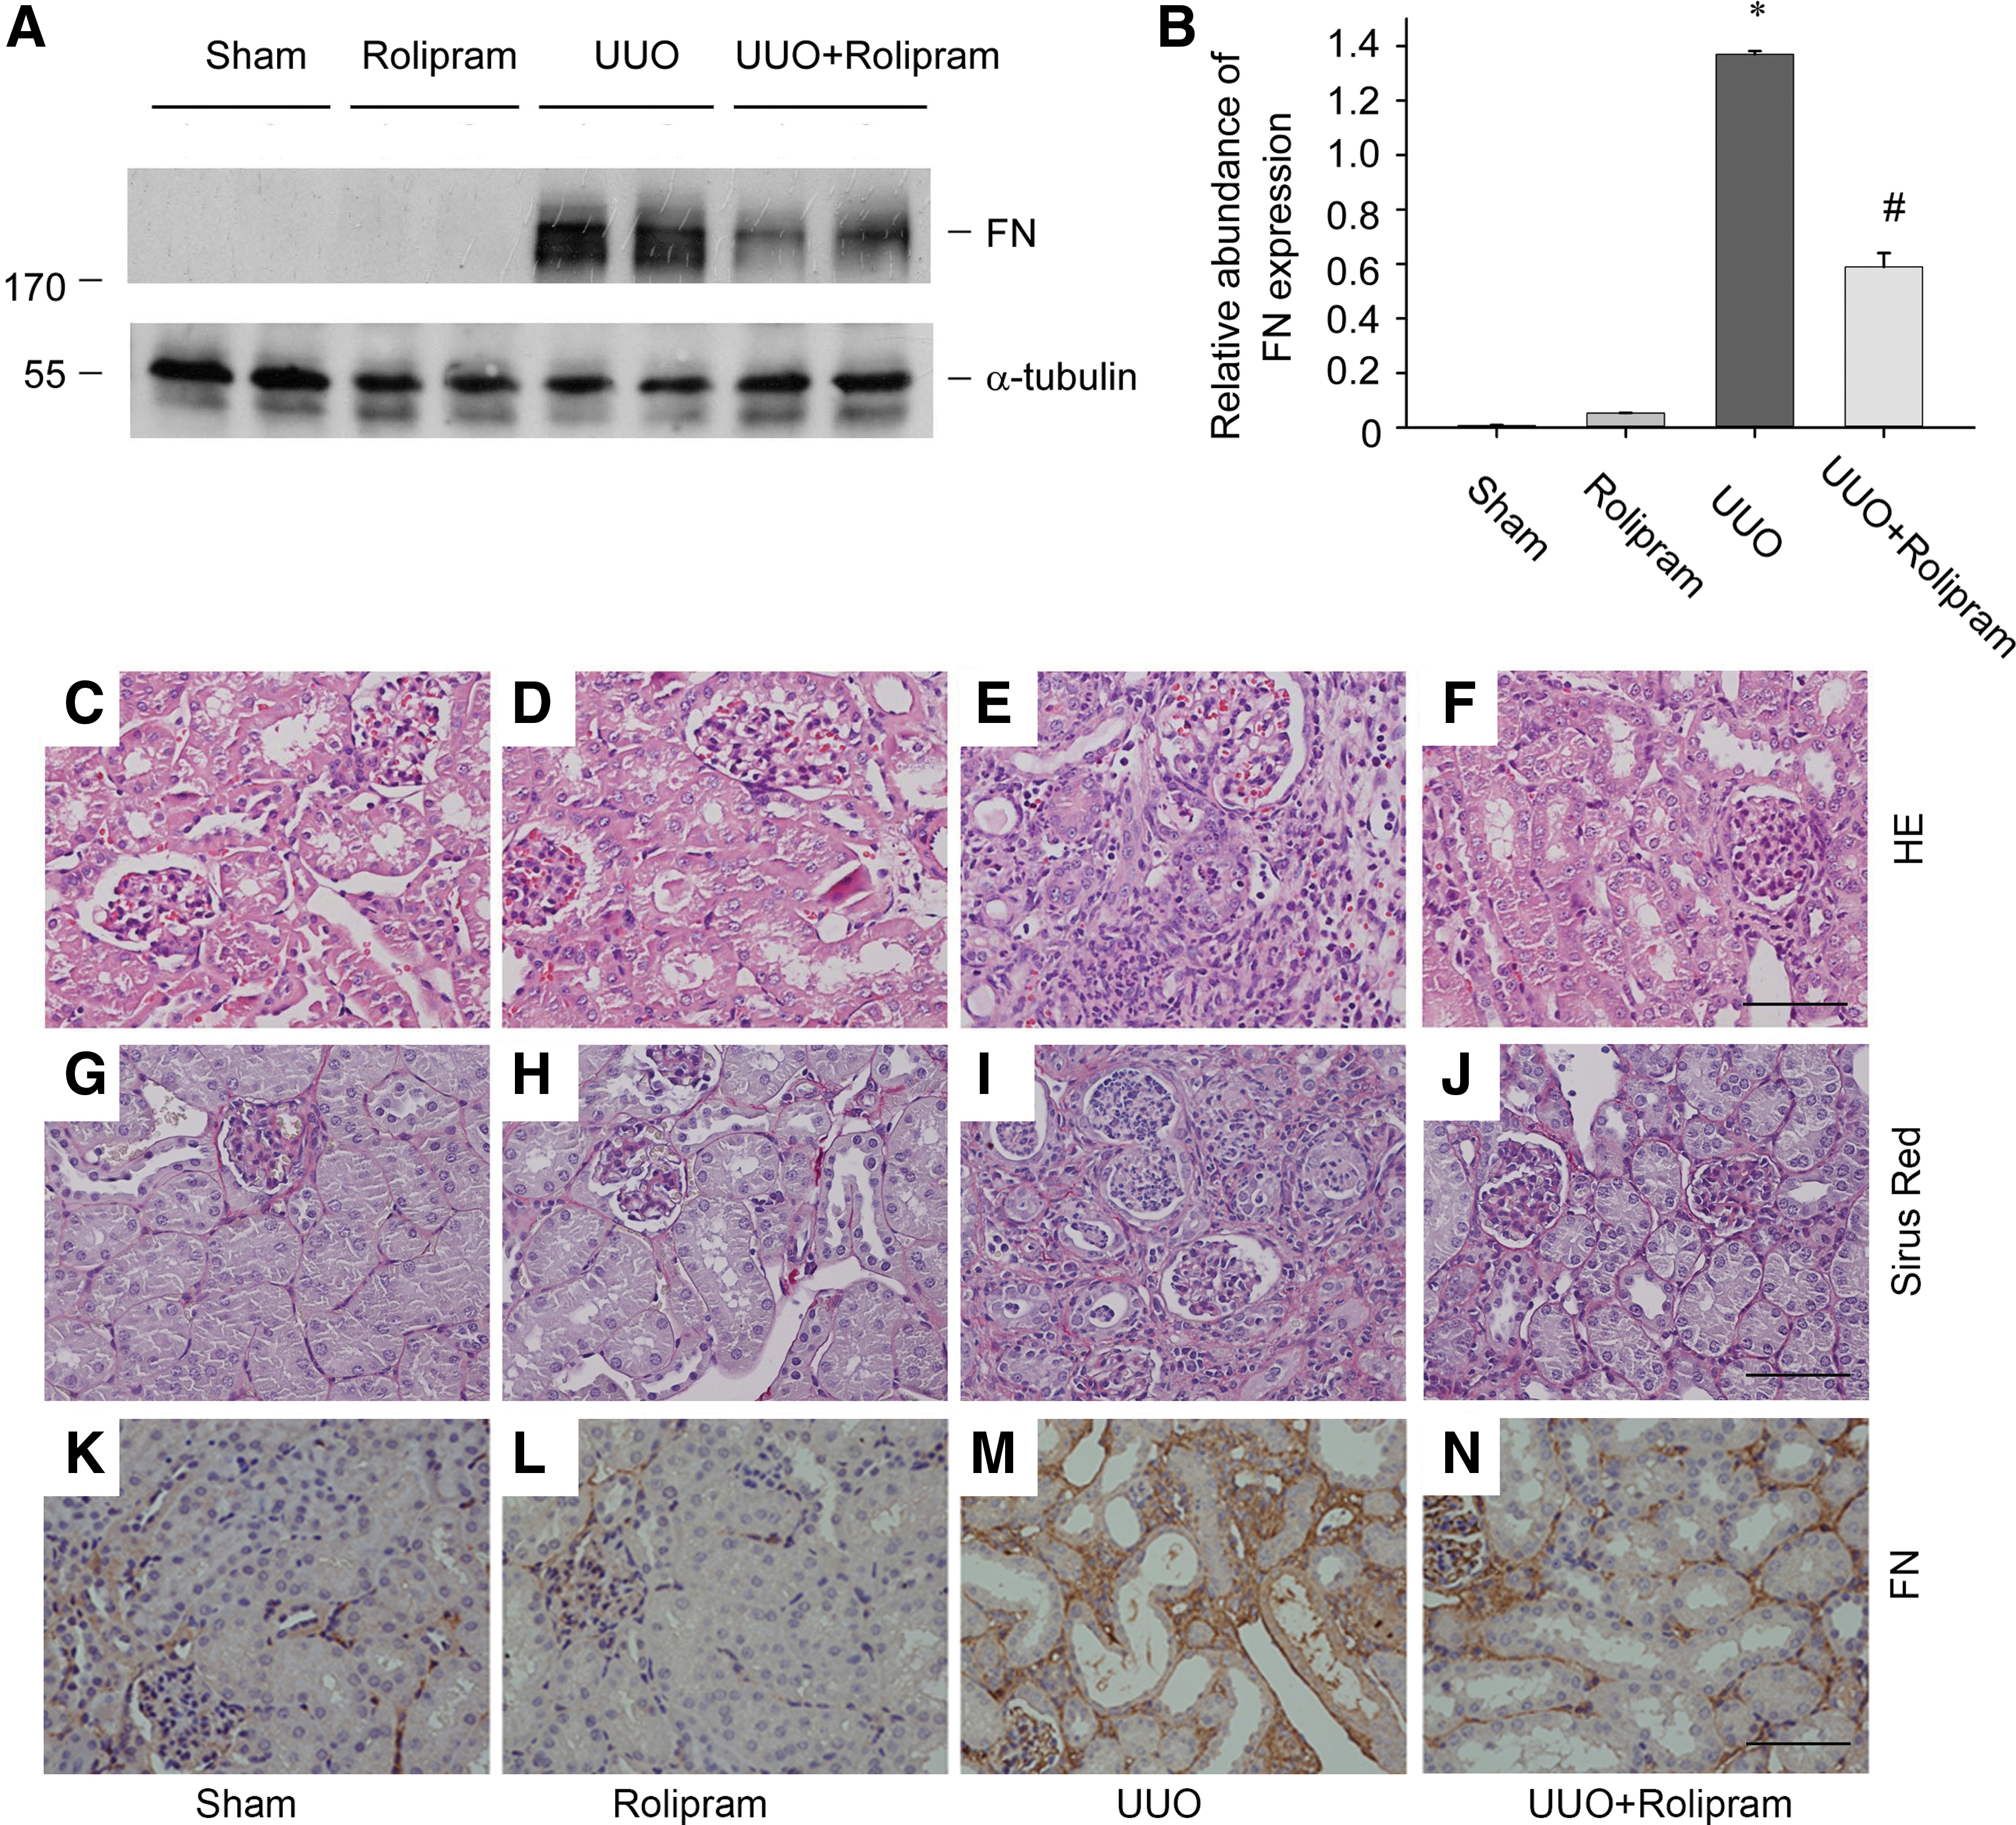
Compared with UUO mice treated with vehicle, tubulointerstitial lesions of UUO mice treated with rolipram exhibited less tubular atrophy, inflammatory cell infiltration (Fig. 3C–F), and interstitial fibrosis (Fig. 3G–J). Immunohistochemical staining further confirmed that the FN deposition in tubular interstitium was decreased in UUO-operated mice treated with rolipram (Fig. 3K–N).
We next monitored cAMP changes in primary tubular epithelial cells (PTCs) under TGF-β1 treatment. The results showed that the level of cAMP in PTC was decreased at 3 h and consistently declined after TGF-β1 stimulation (Fig. 4A). The expression profile for PDE isoenzyme mRNAs was analyzed by real-time PCR. PDE4 is mainly expressed in tubular epithelial cells, and the mRNA levels of PDE4a and PDE4b were upregulated under TGF-β1 stimulation in a time-dependent manner (Fig. 4B). Next, the protein levels of PDE4a and PDE4b were detected by Western blotting. As shown in Figure 4C, the protein level of PDE4a was unchanged, but the PDE4b expression was increased at 12 h, and high levels were observed up to 48 h after TGF-β1 stimulation.

To further test the involvement of PDE4 in TGF-β1-induced PTC damage, we transfected PDE4b siRNA into PTCs to knock down PDE4b expression. As shown in Figure 4D, PDE4b siRNA transfection efficiently downregulated PDE4b expression and reduced TGF-β1-induced FN protein upregulation. In addition, inhibiting PDE4 activity by rolipram could also counteract the effect of TGF-β1. Western blot analysis showed that rolipram inhibited FN upregulation in TGF-β1-treated PTCs (Fig. 4E). Immunofluorescence staining also showed that rolipram significantly inhibited TGF-β1-induced FN expression (Fig. 4F–I).
cAMP signaling through the Epac axis is required for tubular epithelial cell damage
In kidney cells, intracellular cAMP signaling is primarily mediated by two effectors that bind cAMP as follows: PKA and cAMP-regulated guanine exchange factors (Epac). To determine which of these two effectors was activated in the tubular epithelial cells, we treated PTCs with TGF-β1 for various times. The PKA activity in the PTC was not significantly decreased after TGF-β1 treatment (Fig. 5A). The expression of Epac1 at both the protein and mRNA levels was remarkably downregulated after 1 h in response to TGF-β1 (Fig. 5B, C). Epac1 promotes the exchange of GDP for GTP, including the activation of the small G protein Rap1.

To obtain insight into the Epac1 signaling pathway, the protein levels of Rap1-GTP were determined. As shown in Figure 5D, the expression of Rap1-GTP in PTC was significantly decreased by TGF-β1. To further understand the role of Epac1 in the PTC damage induced by TGF-β1, we applied the selective Epac1 activator 8-pCPT-2′-O-Me-cAMP (8-O-cAMP). PTCs were pretreated with different doses of 8-O-cAMP (10 and 100 nM) for 30 min before treatment with TGF-β1 for 48 h. The results showed that Epac1 activation with 8-O-cAMP decreases the FN expression induced by TGF-β1 (Fig. 5E).
To further dissect the function of Epac1, small interfering RNA was used. Transfection efficiency was detected by Western blotting analysis. Epac1 expression was significantly reduced after exposure to mouse Epac1 siRNA compared with scramble RNA (Fig. 5F, G). As shown in Figure 5H, PTCs with Epac1 knockdown displayed a phenotype conversion by overexpression of FN, and pretransfection of Epac1 siRNA could also amplify TGF-β1-induced tubular epithelial cell damage.
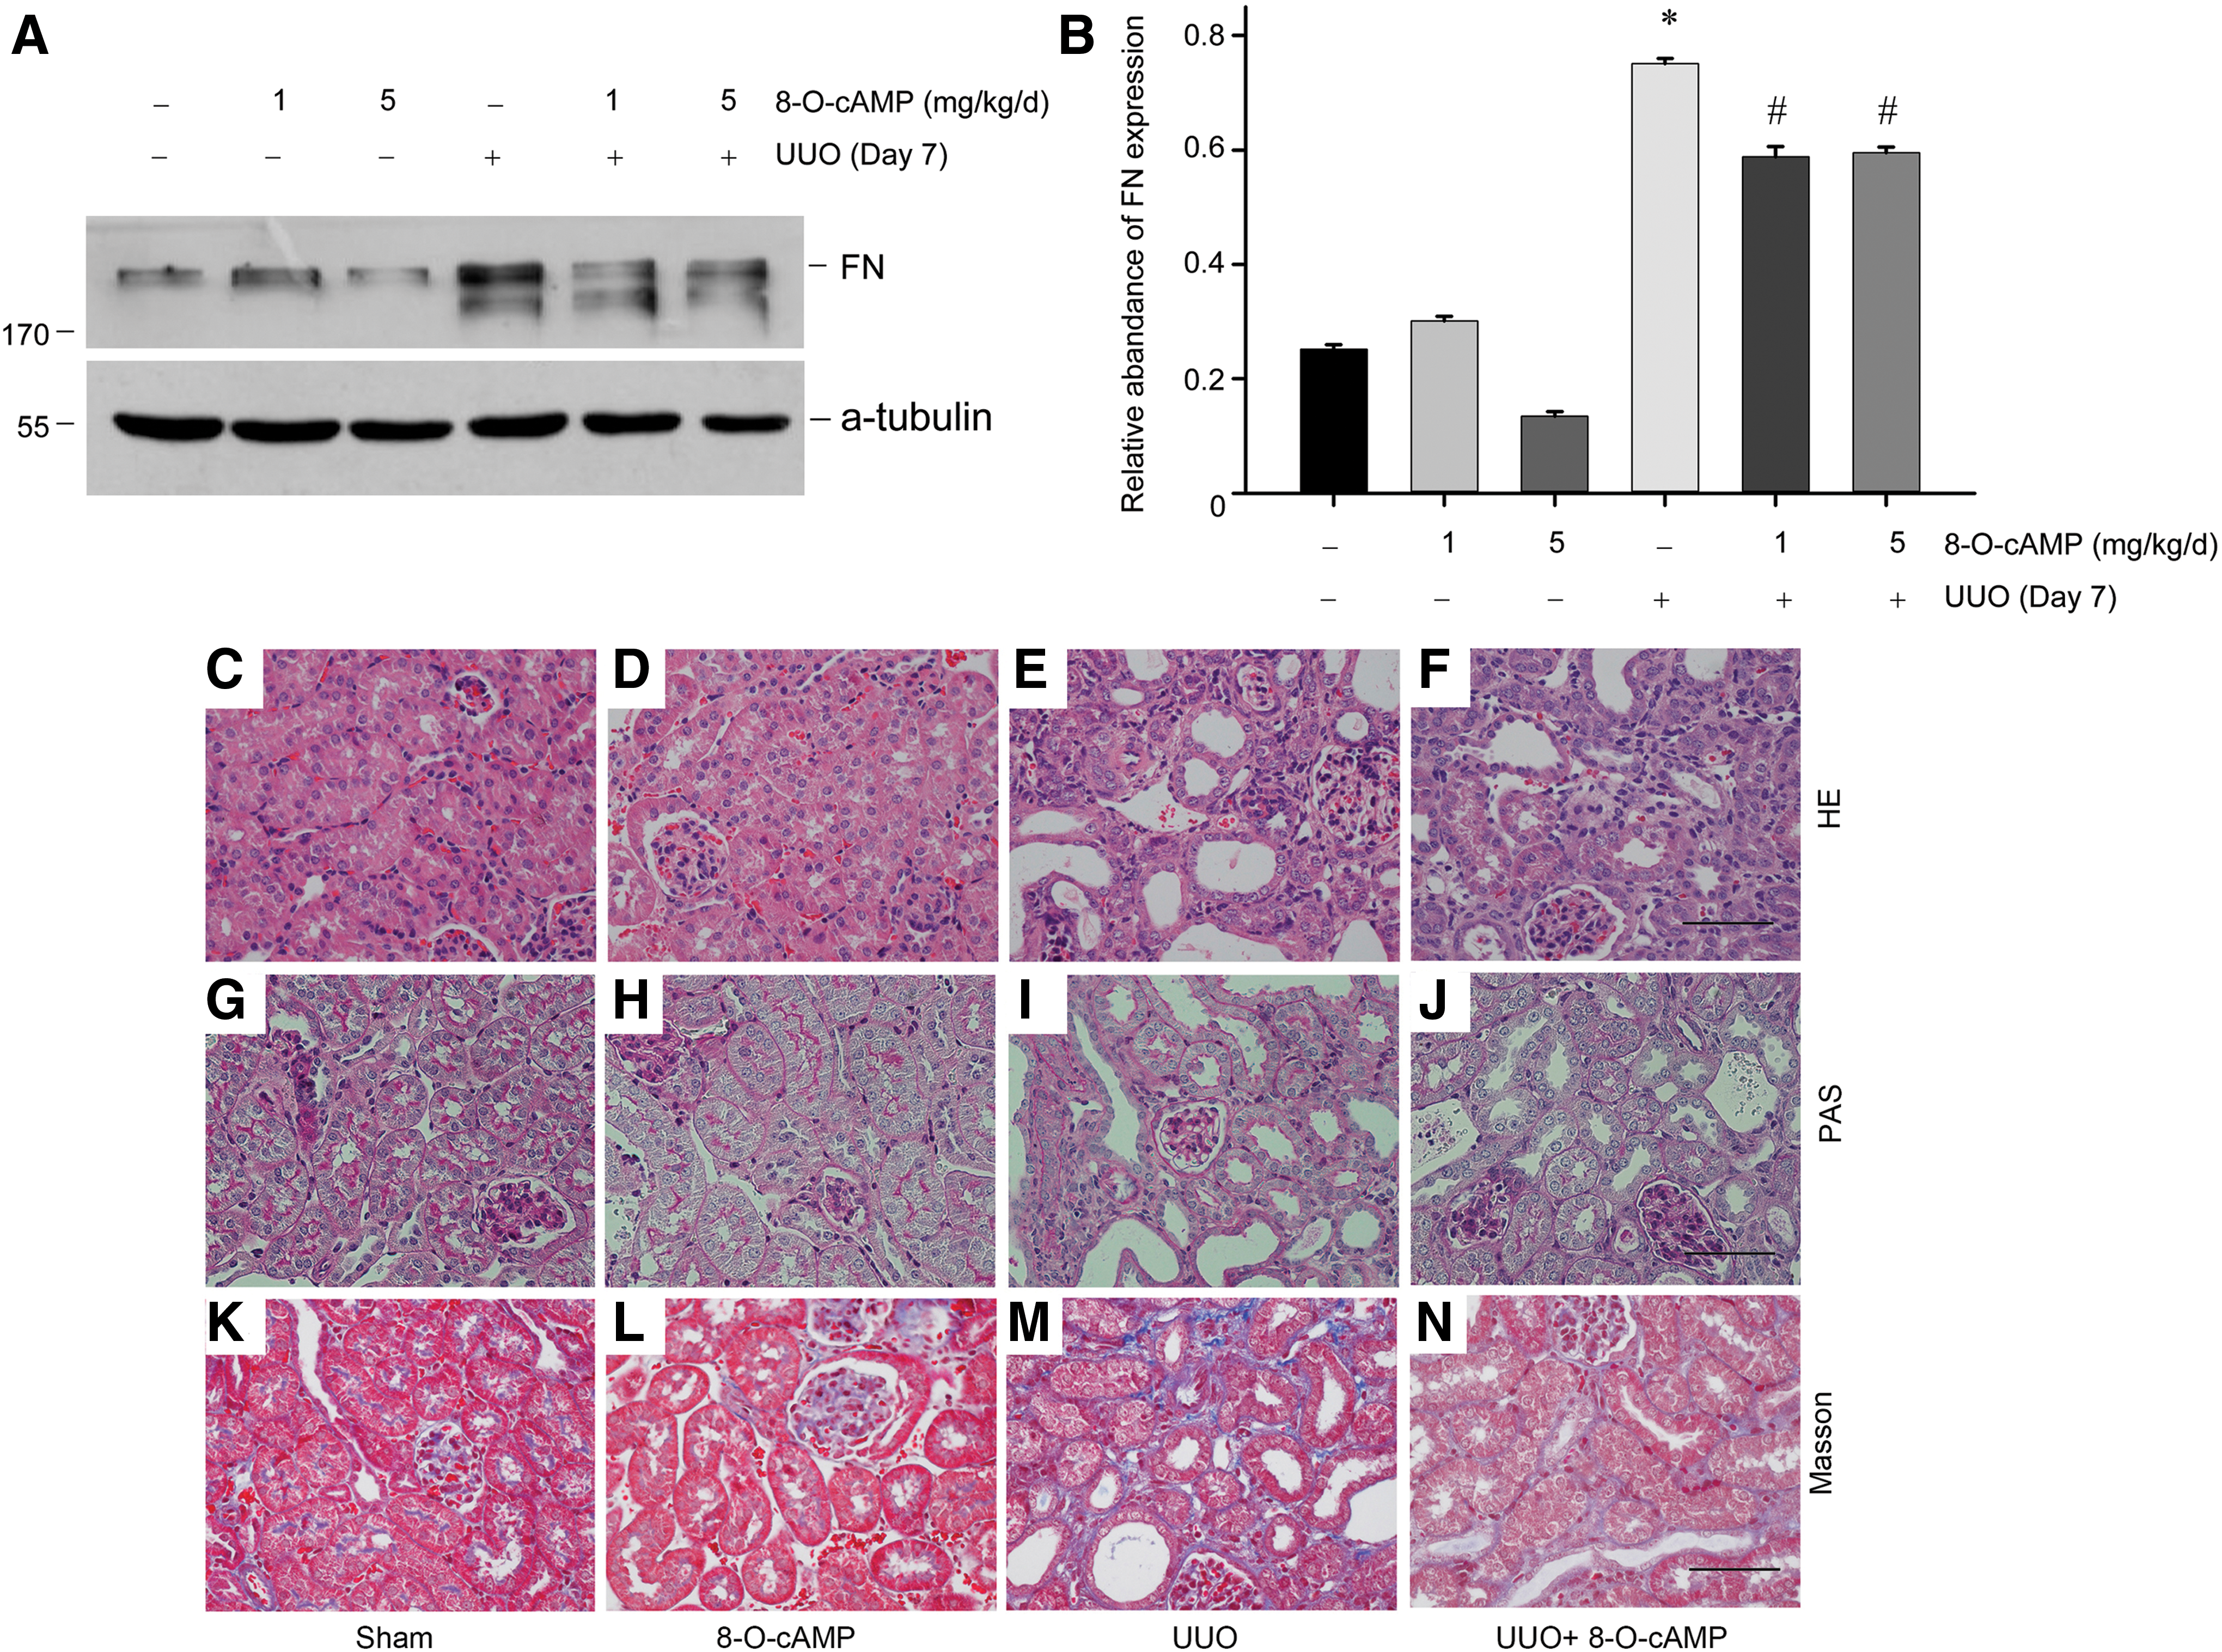
Next, we explored the therapeutic role of 8-O-cAMP in the mouse renal fibrosis model. The activator 8-O-cAMP was administered by tail vein injection. The mouse subjected to UUO and treated with saline showed a significant increase in FN protein expression at day 7 after UUO compared with sham-operated mice. When the same mice were pretreated with 8-O-cAMP, an apparent reduction of FN expression was observed (Fig. 6A, B). Histological changes of tubular damage are shown in Figure 6C–N. Moreover, 8-O-cAMP injection could reduce tubular atrophy (Fig. 6C–F), the loss of brush border (Fig. 6C–F), tubular cell detachment (Fig. 6G–J), and interstitial fibrosis (Fig. 6K–N). These data demonstrate that Epac1 is an indispensable effector for cAMP signaling in tubular epithelial cells in renal fibrosis.
Inhibiting PDE4 by rolipram increases mitochondrial biogenesis via the PGC-1α-C/EBP-β pathway
Mitochondria are key organelles involved in many cellular functions, including energy production, the life and death of cells, calcium homeostasis, and reactive oxygen species generation. Emerging data have emphasized the involvement of mitochondria in the progress of chronic renal injury (21). With the development of renal fibrosis induced by UUO (Supplementary Fig. S1B–D; Supplementary Data are available online at
The level of ATP released in proximal tubular epithelial cells was decreased during the course of UUO (Supplementary Fig. S1F). Tubular injury score indicated a robust tubular injury in the obstructed kidney (Supplementary Fig. S1G). The correlation between tubular injury index and mitochondrial number was significant and negative, with an R value of −0.928 (Supplementary Fig. S1H). In addition, the matrix deposition score determined by Sirius Red staining (Supplementary Fig. S1I) was negatively associated with the mitochondrial number in tubular epithelial cells (R = −0.814, p < 0.01) (Supplementary Fig. S1J).
Considering that cAMP may mediate mitochondria homeostasis, we analyzed the correlation between cAMP level and mitochondria number in the tubules of fibrotic kidneys. Linear regression analysis indicated a positive relationship between the levels of cAMP and mitochondria number in the tubular epithelial cells, with R = 0.773 (Fig. 7A). Moreover, the levels of ATP showed a more significant correlation with the intracellular cAMP content, with R = 0.952 (Fig. 7B).
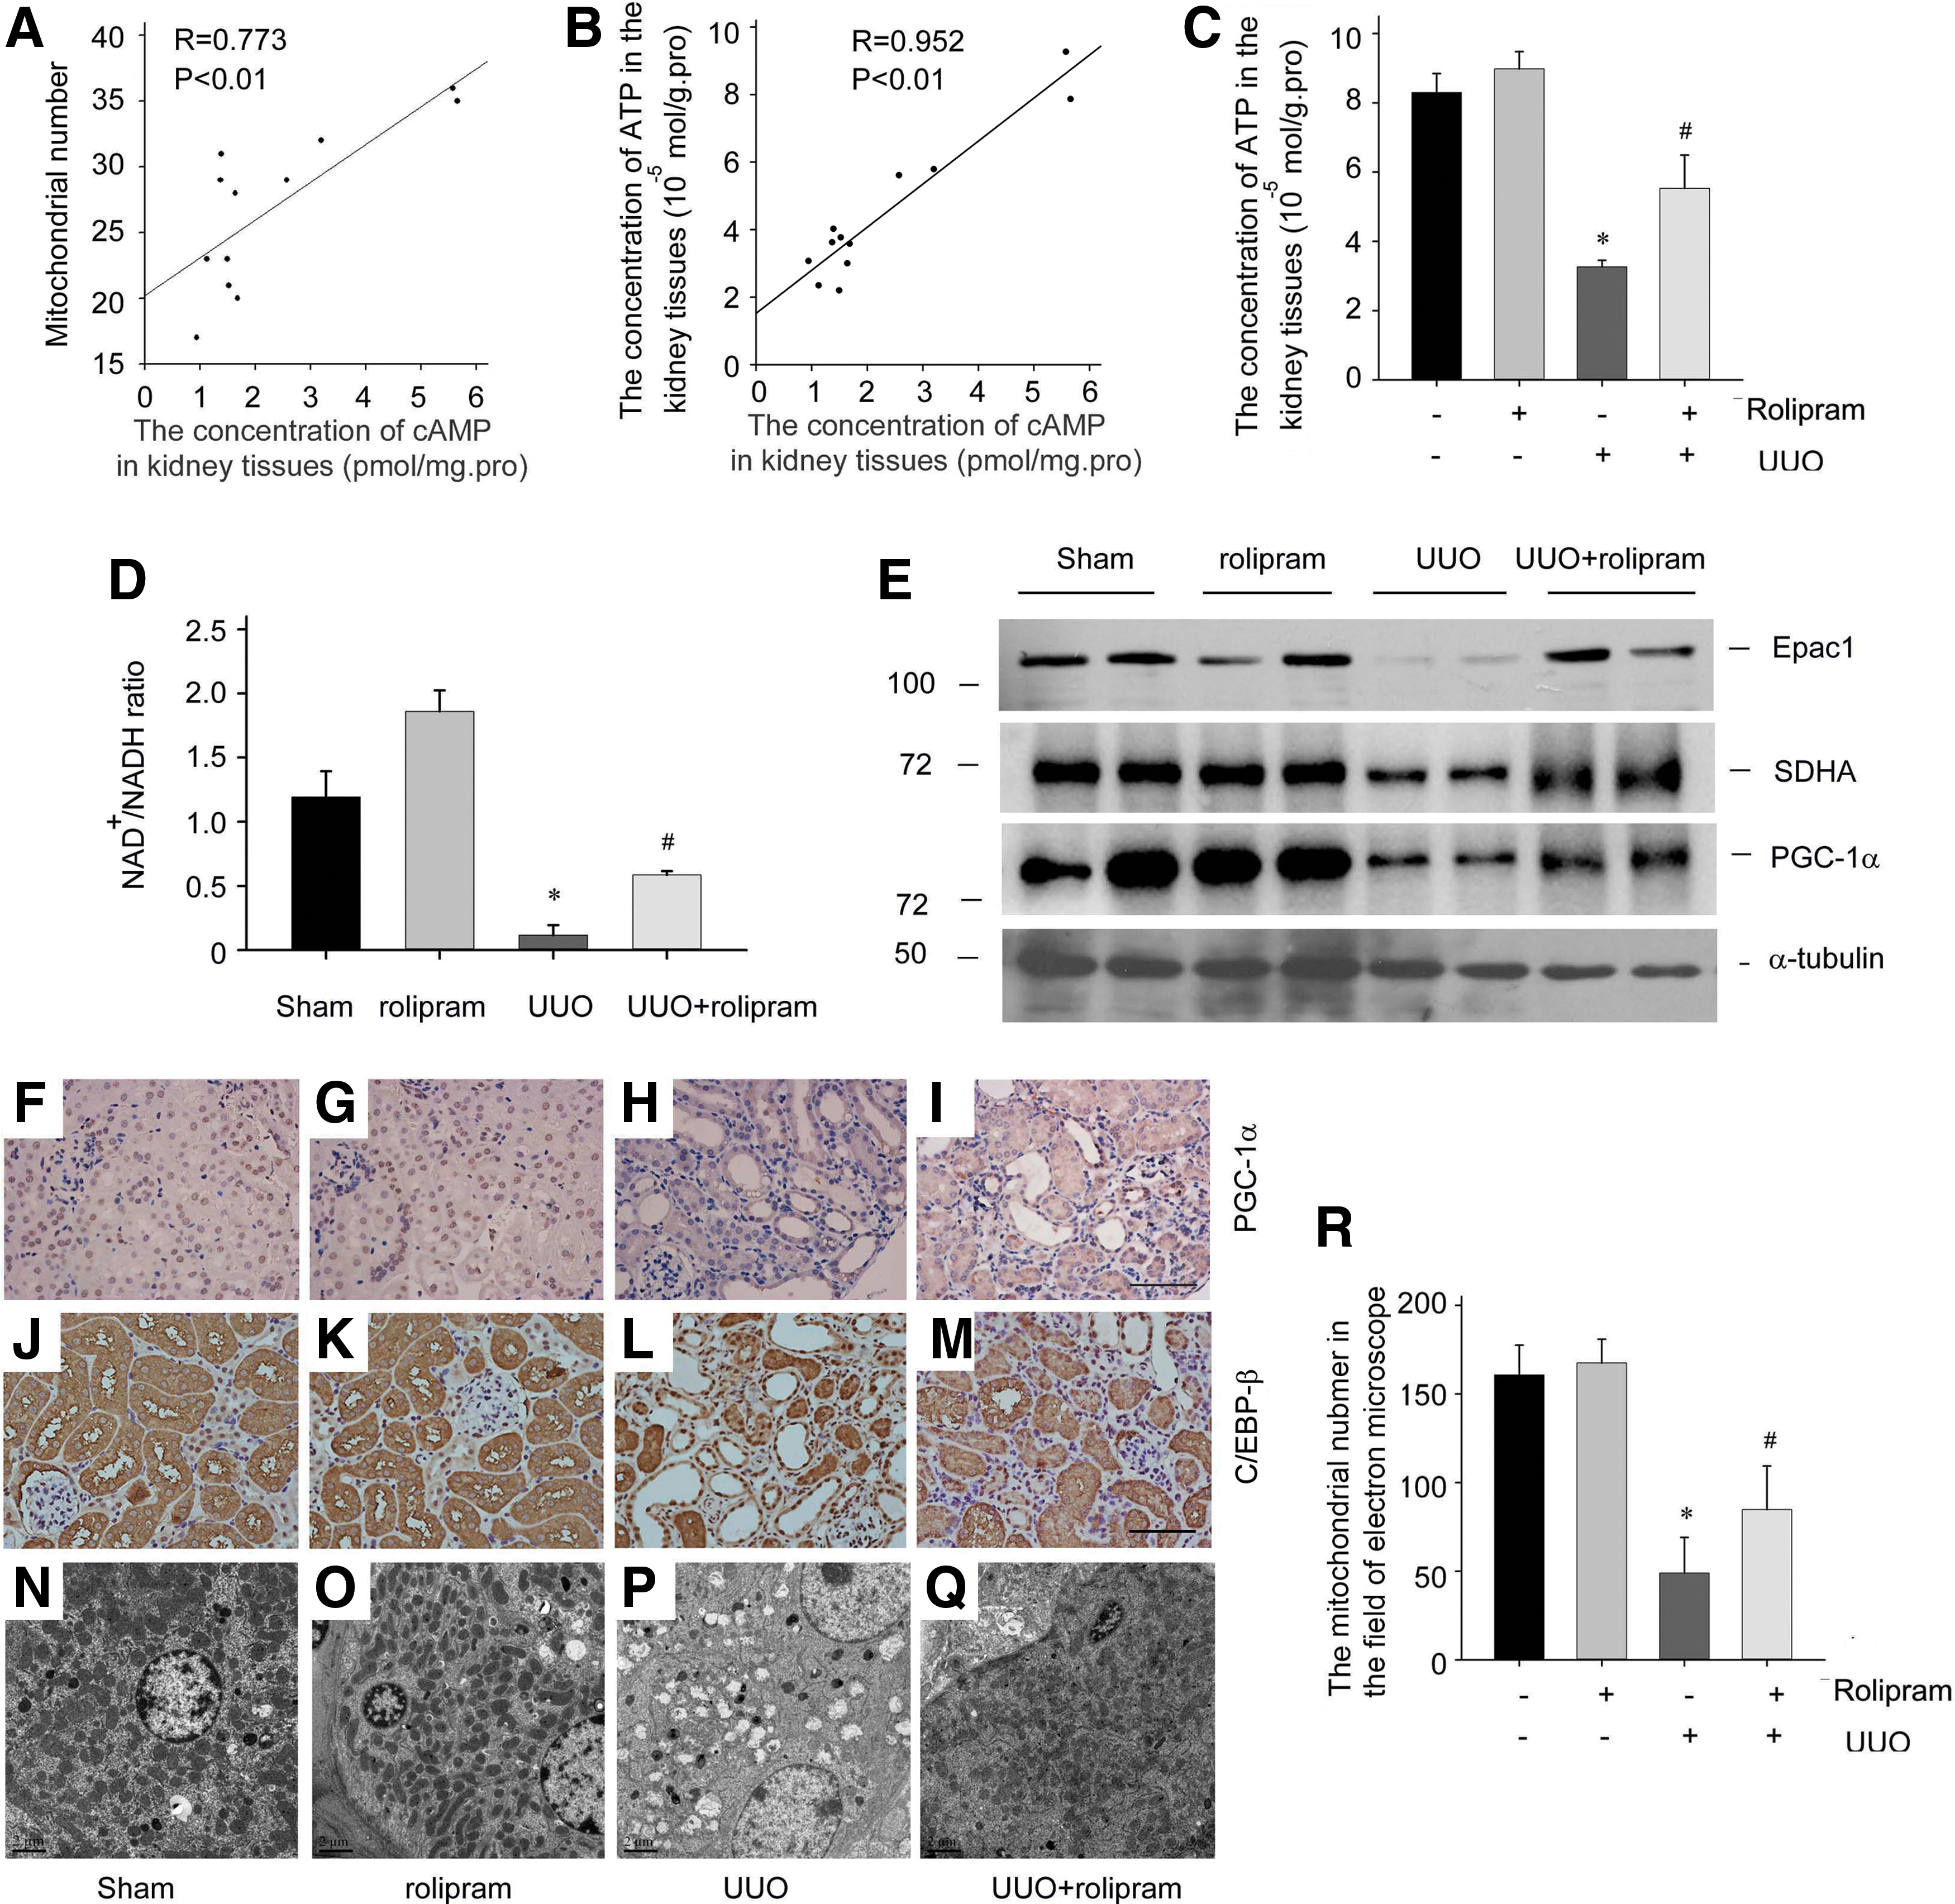
Further inhibition of type IV PDE by rolipram could restore the ATP levels of tubular epithelial cells in the obstructed kidneys (Fig. 7C). As shown in Figure 7D, rolipram-treated UUO mice had higher levels of NAD+ levels in tubular epithelial cells than in vehicle-treated UUO mice. The expression of the cAMP effector-Epac1 and mitochondrial protein succinate dehydrogenase (SDHA) subunits in UUO kidneys was also recovered by rolipram treatment (Fig. 7E).
The PGC-1α plays a central role in the regulatory network of mitochondrial biogenesis in tubular epithelial cells (48, 72). The transcriptional regulatory factors to PGC-1α have been well delineated (20). Recent studies have shown that the PGC-1α expression was partly regulated by C/EBP-β, and the small GTPase Rap1 could modulate C/EBP-β binding to the PGC-1α promoter (59, 69). In renal fibrosis induced by UUO, the PGC1-α protein level was notably decreased in the separated tubules compared with control subjects (Fig. 7E). Furthermore, immunohistochemical staining showed that PGC-1α and C/EBP-β were mainly expressed in renal proximal tubular cells, and their expression was obviously reduced in fibrotic kidneys (Fig. 7F, H, J, and L).
However, following the administration of rolipram, the expression and distribution of PGC-1α and C/EBP-β were normalized (Fig. 7I, M). Electron microscopy revealed a notable deformation of renal tubular mitochondria in UUO-operated kidneys. The ridge of the mitochondria often disappeared in proximal tubular epithelial cells in fibrotic kidneys (Fig. 7P). With rolipram administration, the mitochondrial morphology was partially restored (Fig. 7Q), and the mitochondrial number in proximal tubular epithelial cells was also increased in rolipram-treated UUO mice compared with vehicle-treated UUO mice (Fig. 7R).
The mitochondrial changes in tubular epithelial cells promoted by TGF-β1 were also monitored. As shown in Supplementary Figure S2A and B, TGF-β1 induced a sustained decrease of cytosolic ATP levels and the ratio of NAD+ to NADH in a time-dependent manner in PTCs. The mitochondrial oxygen consumption rates (OCRs), ATP production, and maximal respiration were significantly downregulated in PTCs with TGF-β1 treatment (Supplementary Fig. S2C, D). The mitochondrial DNA (mtDNA) copy numbers measured by DNA levels of cytochrome B (Cyt B) and cytochrome oxidase III (COX III) (50) were markedly reduced in PTCs after TGF-β1 treatment (Supplementary Fig. S2E).
The mitochondrial protein SDHA and mitochondrial transcription factor mtTFA were downregulated at the protein level (Supplementary Fig. S2F). The number of mitochondria was decreased in parallel with changes in mitochondrial structure (Supplementary Fig. S2G). These results indicate that mitochondrial biogenesis plays a critical role in TGF-β1-induced tubular epithelial cell damage.
TGF-β1 decreased PGC-1α and C/EBP-β expression (Supplementary Fig. S2F), and rolipram restored expression at the protein levels (Fig. 8A). The mtDNA copy number measured by the DNA levels of Cyt B and COX III was repaired by the pretreatment of rolipram followed by TGF-β1 treatment (Fig. 8B). The downregulation of SDHA and mtTFA induced by TGF-β1 was also blocked by rolipram pretreatment in a dose-dependent manner (Fig. 8C). We next evaluated the mitochondrial dynamics regulating DRP1 and MFN2 expression in PTCs. The results showed that fission regulating DRP1 protein was increased, and the fusion regulating MFN2 protein was decreased in the TGF-β1 treatment PTCs. Rolipram could recover DRP1 and MFN2 expression under TGF-β1 stimulation (Fig. 8D).
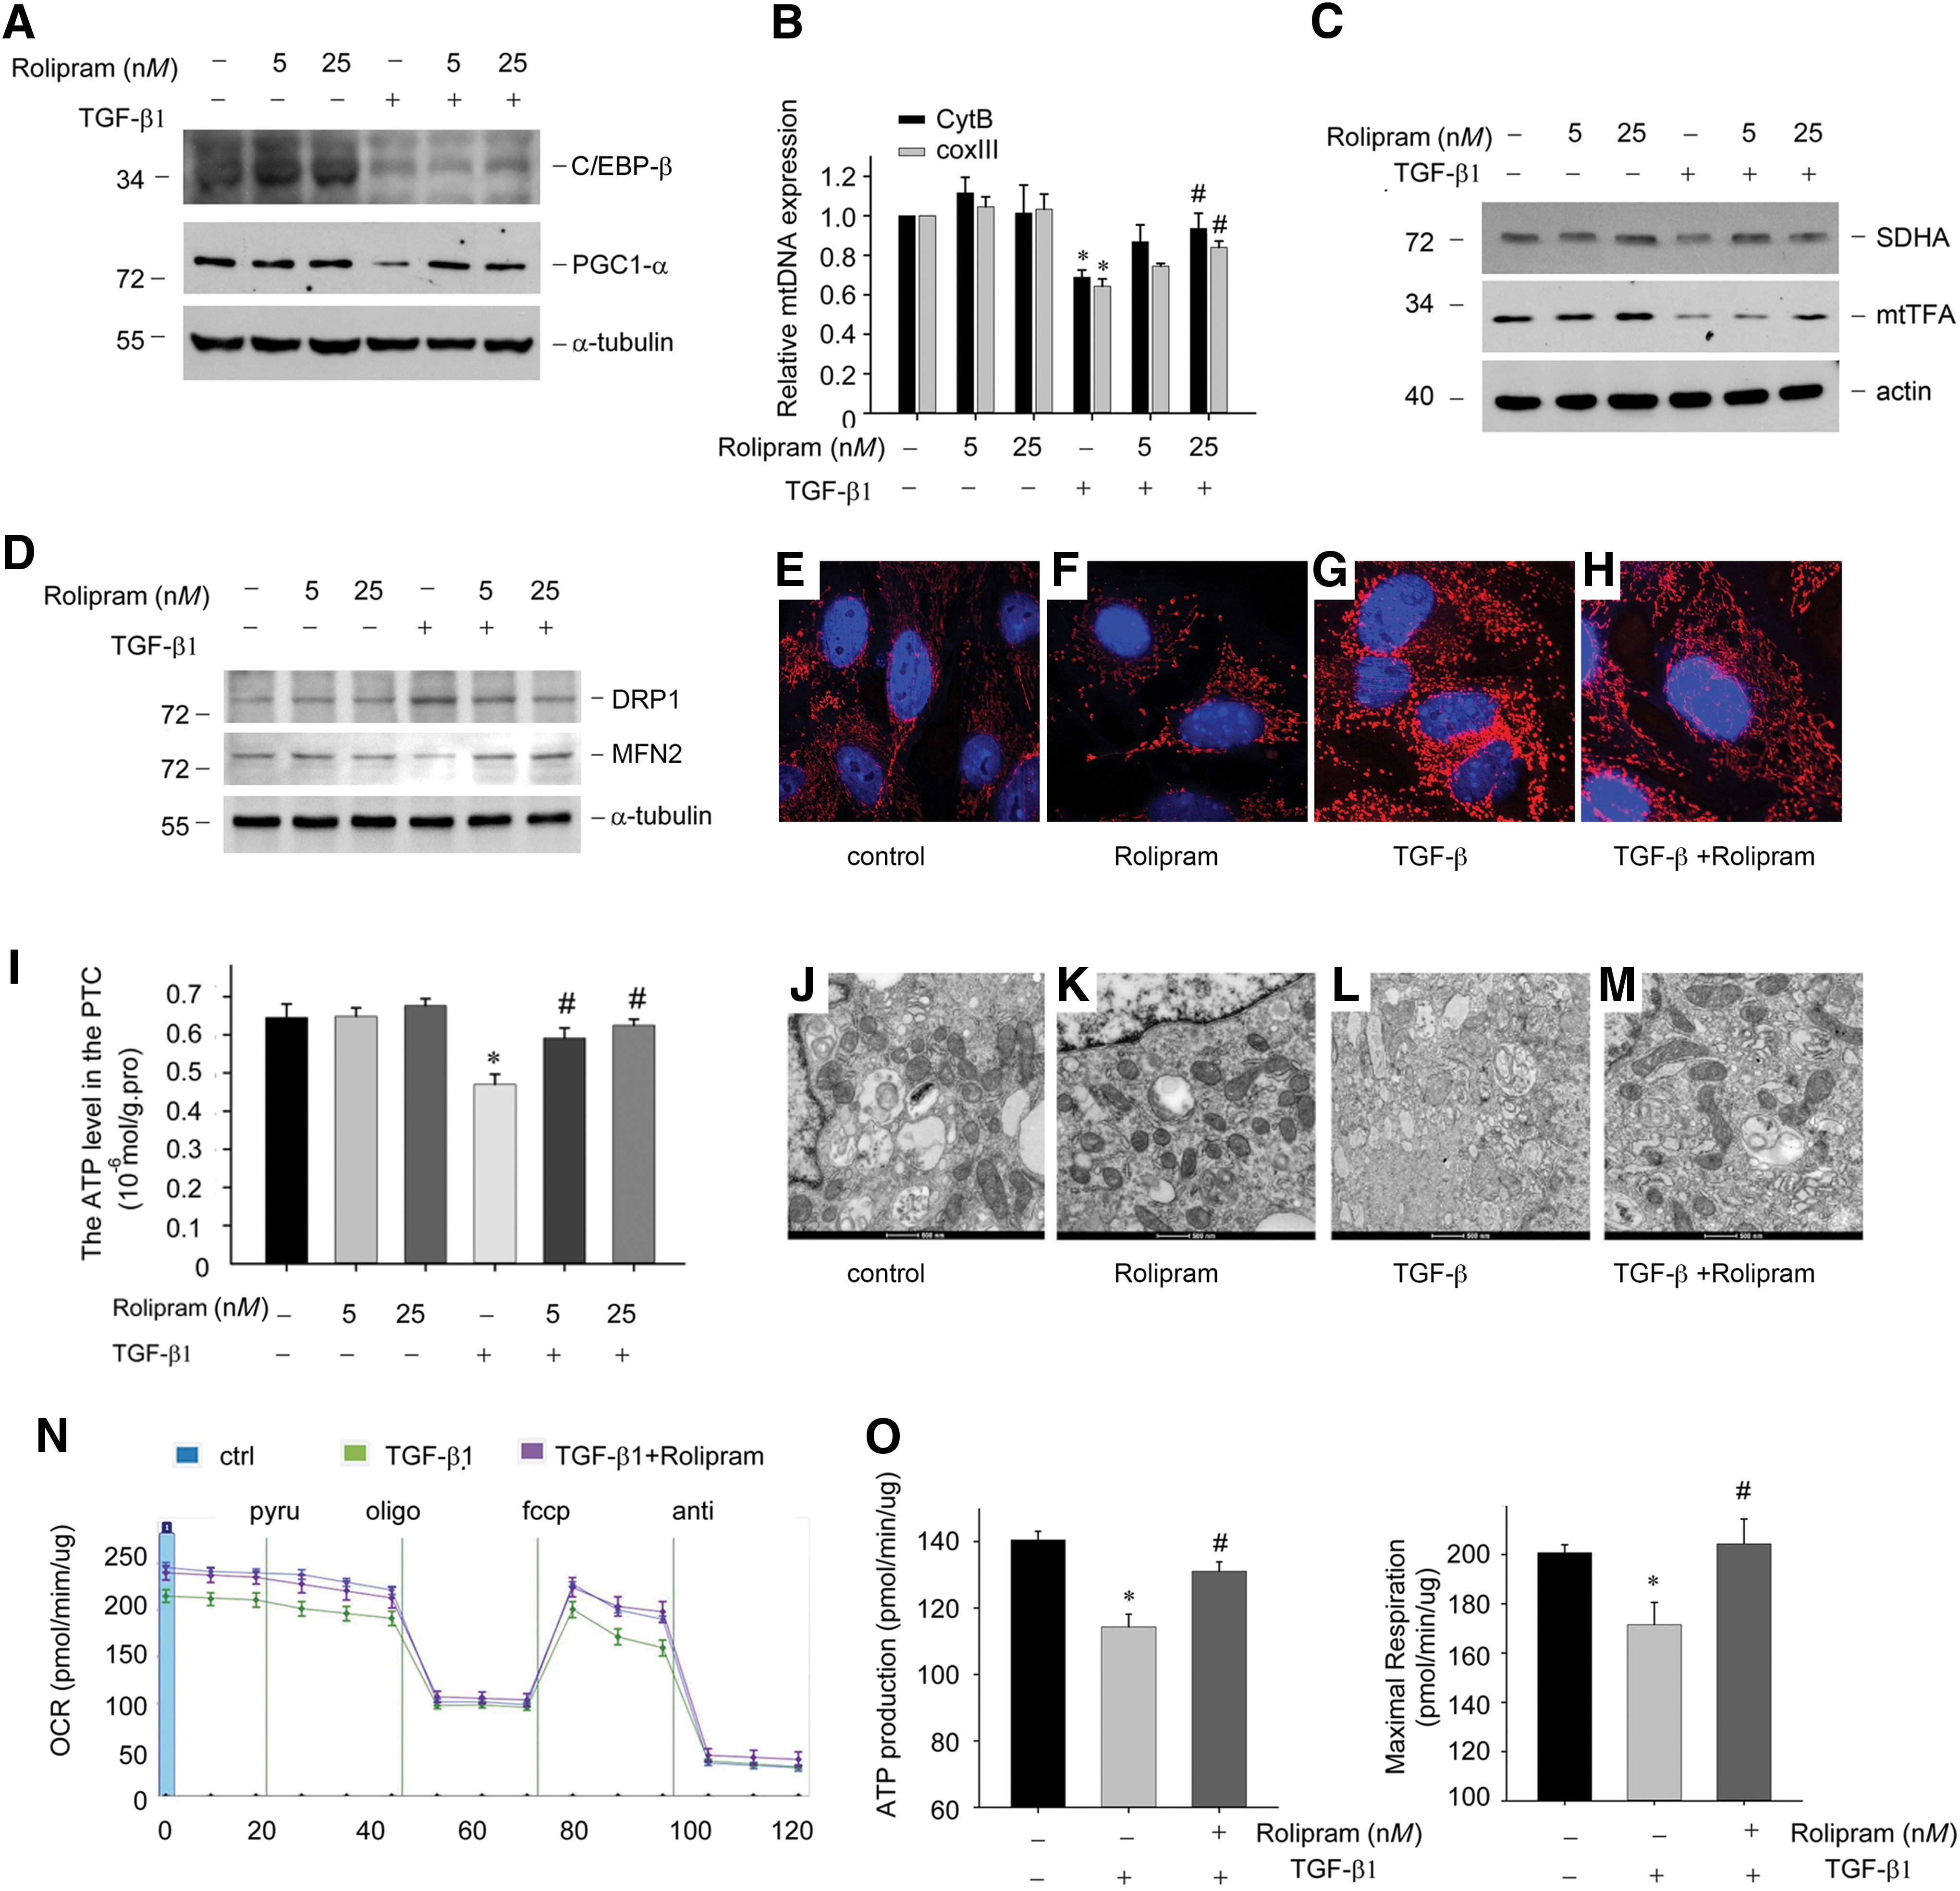
Using MitoTracker Red staining, we observed increased mitochondrial fission in TGF-β1-treated PTCs (Fig. 8G), and rolipram could block mitochondrial fission induced by TGF-β1 (Fig. 8H). Meanwhile, the ATP levels of PTCs and the mitochondrial structure were also recovered by rolipram, as shown in Figure 8I–M. The measurement of the OCR with rolipram demonstrated that rolipram also increased mitochondrial oxidative phosphorylation (Fig. 8N, O).
Further experiments are necessary to determine whether the protective role of rolipram relies on the C/EBP-β-PGC1-α axis. PTCs were transfected with C/EBP-β siRNA or PGC1-α siRNA before TGF-β1 treatment. As shown in Figure 9A, PGC1-α siRNA transfection could reduce PGC1-α expression and block the antifibrotic effect of rolipram on FN expression. Similarly, after C/EBP-β siRNA transfection to knock down C/EBP-β expression, the effect of rolipram on PGC1-α and FN expression was weakened (Fig. 9B). Taken together, these results indicate that rolipram may recover PGC1-α expression and increase mitochondrial biogenesis by increasing C/EBP-β expression in tubular epithelial cells.

Discussion
In the present study, we demonstrated that the mitochondrial dysfunction of tubular epithelial cells plays a vital role in renal fibrosis, and the cAMP level is decreased and correlated with mitochondrial damage in the tubular epithelial cells. The reduction of cAMP in tubular epithelial cells in renal fibrosis is mainly attributed to the upregulation of PDE4. Increasing the cAMP level by PDE4 inhibitor could inhibit UUO-induced renal fibrosis by recovering PGC1-α expression and increasing mitochondrial biogenesis via the activation of the Epac-C/EBP-β signaling pathway.
cAMP is necessary for fluid secretion and ionic homeostasis in the kidney, and it plays an important role in renal fibrosis and polycystic kidney disease (18, 19, 53). The antifibrotic effects of cAMP have been investigated in interstitial fibroblast cells and mesangial cells. Evidence indicates that the tubular epithelial cells express an extracellular cAMP-adenosine pathway both in the apical membrane and basolateral membrane (28). We found that the cAMP level is decreased in tubular epithelial cells in the process of renal fibrosis. Replenishing cAMP levels in the UUO mice could ameliorate tubular atrophy and ECM deposition (Fig. 1).
The cellular content of cAMP is determined by the balance between activities of synthesizing enzymes, ACs, and catabolizing enzymes, the cyclic 3′,5′-nucleotide PDEs. Previous studies have shown that ACs II, III, IV, and IX are mainly expressed in the proximal tubules (68). We detected changes of ACs in the tubules of fibrotic kidneys. Only the mRNA level of AC IX is decreased in the tubule of fibrotic kidneys (Fig. 2A). Considering that in most cells and tissues the catalytic capacity for cAMP synthesis by ACs is far less than the capacity for hydrolysis by PDEs, the PDEs play the key role in the cellular content of cAMP (60).
We examined the mRNA profile of PDE family expression in the tubule at different time points of UUO. The mRNA levels of PDE4a and PDE4b were dramatically increased in the proximal tubular cells (Fig. 2B, C), but Western blot analysis and immunohistochemical staining further confirmed that only PDE4b protein was upregulated in tubular epithelial cells at the early stages of renal fibrosis (Fig. 2G). PDE4 considered a “cAMP-specific PDE” is widely expressed in the nephron and has the highest activity in the tubules (16). The inhibition of PDE4 activity protects renal function in acute kidney injury and glomerulonephritis (5, 31, 42, 63). Rolipram is a specific PDE4 inhibitor first developed as an antidepressant drug (49) and has been investigated in a range of peripheral inflammatory disorders (45), chronic obstructive pulmonary disease (74), diabetes (34, 35), and autoimmune diseases (57).
The antifibrotic effect has been found in pulmonary fibrosis and liver fibrosis as a result of anti-inflammatory effects (1, 64). Lange-Sperandio et al. found that rolipram could delay inflammation in experimental obstructive nephropathy (36). In vitro and in vivo studies using TGF-β1-treated PTCs and mice with UUO surgery showed that rolipram could protect tubular phenotype and block the process of renal fibrosis (Figs. 3 and 4). These findings support the notion that increasing renal cAMP by PDE4 inhibitors may provide a therapeutic option for the treatment of renal fibrosis.
The cAMP pathway is attributed to the activation of PKA, cAMP-gated ion channels, and exchange proteins directly activated by cAMP (Epac). The cAMP-PKA pathway signaling exerts indispensable effects on tubulogenesis and may interfere with excessive cell proliferation, tubular dilation, and oxidative stress (39, 55, 62). In this study, the PKA activity was not significantly changed in the face of TGF-β1 in PTCs (Fig. 5A). The mRNA and protein levels of Epac1 were dramatically decreased in the first hour after TGF-β1 stimulation and constantly downregulated up to 48 h (Fig. 5B, C). This result may be because cAMP exhibits a lower affinity for EPAC1 than for PKA (24). The Epac1-dependent effect was further confirmed through Epac1 siRNA and treatment with the selective Epac activator 8-O-cAMP (Fig. 5E–H). This effect on renal fibrosis is consistent with a recent report showing that Epac1 is involved in the antifibrotic effect of prostaglandin D2 (75, 76).
Over the last several years, cAMP signaling has been recognized as an indispensable pathway in the regulation of mitochondrial homeostasis and mitochondrial dynamics. There are at least two independent cAMP pathways to regulate mitochondria: one pathway is contained inside the mitochondrial matrix, and another pathway is associated with the cytosolic/mitochondrial interaction. The cAMP signaling in the mitochondrial matrix can phosphorylate mitochondrial substrates, such as the nuclear-encoded 18-kDa subunit of complex I (NDUFS4), the BAD protein, and steroidogenic acute regulatory protein (StAR) (2, 40, 46), stimulating the enzymatic activity of mitochondrial complex I and complex IV (3, 13). Cytoplasmic cAMP activates nuclear CREB and downstream PGC-1α to promote mtTFA production, mtDNA replication, and mitochondrial biogenesis (51, 52, 66). Considering that cAMP is generated from ATP, it is reasonable to observe that the level of cytosolic AMP is positively associated with mitochondrial number and the level of ATP in the tubule. We further observed that the additional supplement of cAMP could restore ATP levels and the mitochondrial number in the tubules of patients who suffer from UUO and finally ameliorate renal fibrosis.
PGC-1α expression could be regulated by C/EBP-β, which binds to CREs in the promoter at −756 to −752 bp of PGC-1α (26, 59). In addition, Rap1b, as the downstream factor of Epac, was reported to ameliorate tubular injury by the modulation of mitochondrial biogenesis via c/EBP-β-PGC-1α signaling in the progression of diabetic nephropathy (69). In this study, increasing renal cAMP levels by rolipram could restore Epac1 expression and mitochondrial biogenesis by targeting the c/EBP-β-PGC-1α pathway in renal fibrosis (Figs. 7 –9). Knocking down C/EBP-β or PGC-1α expression would block the antifibrotic effect of rolipram. Therefore, the role of rolipram in proximal tubular epithelial cells relies on the c/EBP-β-PGC-1α.
In conclusion, mitochondrial homeostasis is critical to tubular epithelial cells. Mitochondrial dysfunction with the tubular epithelial cells is an indispensable event in the progression of renal fibrosis. The present results reveal the critical role of cAMP in the proximal tubular epithelial cells in renal fibrosis. The PDE4 inhibitor rolipram may ameliorate renal fibrosis by recovering mitochondrial biogenesis and function. The antifibrotic effect of rolipram relies on C/EBP-β-PGC-1α expression. This finding indicates that the therapeutic inhibition of PDE4 and activation of cAMP-Epac signaling may improve the outcome of chronic kidney diseases.
Concise Methods
Mice and animal models
Male CD-1 mice weighing 18–20 g were purchased from Shanghai Experimental Animal Center (Shanghai, China). The animals were housed at the animal facilities of the Experimental Animal Center of Nanjing Medical University with free access to food and water. The animals were treated humanely in accordance with the National Medical Advisory Committee guidelines using approved procedures of the Institutional Animal Care and Use committee at the Nanjing Medical University.
UUO was performed as previously described (70). The mice were euthanized on days 1, 3, and 7 after UUO, and the obstructed kidneys were removed. Ang II was infused at a rate of 1 μg/kg/min by a miniosmotic pump (Alzet) for 4 weeks in male CD1 mice. Adriamycin nephropathy was induced by adriamycin injected in male Wistar rats by tail vein at the dose of 4 mg/kg, and the kidney tissues were collected at day 14.
cAMP (cat no: A9501; Sigma) at a dose of 1 mg/kg body weight or 8-O-cAMP (cat no: C8988; Sigma) at a dose of 1 or 5 mg/kg body weight was administered by tail vein injection at 1 day before UUO surgery and administered for seven consecutive days. Rolipram (cat no: R6520; Sigma) was intraperitoneally administered at a dose of 5 mg/kg body weight at 1 day before UUO and administered consecutively for 7 days thereafter. The mice were sacrificed at day 7 after UUO.
Cell culture and treatment
Primary tubular segments were obtained from the cortex of mouse kidneys using established methods (4). The tubular segments were then digested with collagenase at 200 U/L and suspended in Hank's balanced salt solution. The segments were digested for 30 min at 37°C with rotation at 70 rpm. PTCs were cultured in Dulbecco's modified Eagle medium/F-12 (Invitrogen) medium containing insulin 5 μg/mL/transferrin 2.75 μg/mL/selenium 3.35 ng/mL (Invitrogen), 40 ng/mL hydrocortisone (Sigma), 10 ng/mL recombinant human epidermal growth factor (from R&D Systems, Minneapolis, MN), and 1% antibiotic solution (Sigma; 10,000 U/mL penicillin, 0.1 mg/mL streptomycin).
PTCs were seeded onto six-well culture plates to 60–70% confluence in complete medium for 16 h and subsequently changed to serum-free medium. Human recombinant TGF-β1 (5 ng/mL) (cat no: 100B-010-CF; R&D) was added to the serum-free medium at various times. Rolipram was added at a concentration of 5 or 25 nM 30 min before TGF-β1 treatment. For Epac experiment, PTCs were pretreated with 8-O-cAMP at 10 or 100 nM for 30 min, followed by TGF-β1 incubation. PDE4b siRNA, Epac1 siRNA, C/EBP-β siRNA, or PGC1-α siRNA (Invitrogen) was transfected into PTCs by Lipofectamine 2000 (Invitrogen) according to the manufacturer's instructions.
Histology and immunohistochemistry
Mouse kidney samples were fixed in 10% neutraformaline and embedded in paraffin. Sections 3 μM in thickness were used for hematoxylin and eosin, periodic acid-schiff, Masson and Sirius red staining. Kidney injury was defined by tubular necrosis, cellular casts, and tubular injury. Score 0 represents injury areas <10%, whereas scores 1, 2, 3, and 4 represent injury involving 10–25%, 25–50%, 50–75%, and >75% of the kidney tissue area, respectively. The paraffin-embedded kidney sections were deparaffinized, hydrated, and antigen retrieved, and endogenous peroxidase activity was quenched with 3% H2O2.
The sections were subsequently blocked with 10% normal donkey serum, followed by incubating with anti-PDE4a (cat no: ab14607; Abcam), PDE4b (cat no: ab14611; Abcam), FN (cat no: F3648; Sigma-Aldrich), PGC-1α (cat no: sc13067; Santa Cruz), and C/EBP-β (cat no: ab32358; Abcam). Slides were viewed with a Nikon Eclipse80i microscope equipped with a digital camera (DS-Ri1; Nikon).
Immunofluorescence staining
Indirect immunofluorescence staining was performed according to an established procedure. Briefly, the cells were washed twice with cold phosphate-buffered saline (PBS) and fixed with cold methanol: acetone (1:1) for 10 min at −20°C. Following three extensive washes with PBS, the sections were blocked with 0.1% Triton X-100 and 2% normal donkey serum in PBS buffer for 40 min at room temperature and then incubated with the anti-FN (cat no: F3648; Sigma-Aldrich), followed by staining with fluorescein isothiocyanate-conjugated secondary antibody. The cells were double stained with 4′,6-diamidino-2-phenylindole to visualize the nuclei. The slides were viewed with a Nikon Eclipse 80i epi-fluorescence microscope equipped with a digital camera (DS-Ri1; Nikon).
Transmission electron microscopy
Kidney sections were fixed in 2.5% glutaraldehyde in phosphate buffer (pH 7.4) and postfixed with 1% osmium tetroxide. Fixed tissue blocks were dehydrated and embedded in Epon 812. Ultrathin sections were stained with uranyl acetate and lead citrate and subsequently examined under a transmission electron microscope. Mitochondrial number was assessed by electron microscopy. Mitochondrial number was quantitatively assessed in a blinded manner from 10 fields in proximal tubular epithelial cells in each sample as previously described (27).
Western blot analysis
Western blot analysis for specific protein expression was performed according to an established procedure. The following primary antibodies were used: anti-actin (cat no: sc-1616; Santa Cruz), anti-tubulin (cat no: T8203; Sigma-Aldrich), anti-PDE4a (cat no: ab14607; Abcam), anti-PDE4b (cat no: ab170939; Abcam), anti-Epac1 (cat no: ab109415; Abcam), anti-PGC1-a (cat no: sc13067; Santa Cruz), anti-SDHA (cat no: ab123545; Abcam), anti-mtTFA (cat no: sc28200; Santa Cruz), anti-FN (cat no: F3648; Sigma-Aldrich), anti-αSMA (cat no: A5228; Sigma-Aldrich), anti-DRP1 (cat no: ab184247; Abcam), anti-MFN2 (cat no: sc-50331; Santa Cruz), and anti-CEBP-β (cat no: ab32358; Abcam).
Rap1-GTP were immunoprecipitated using the active Rap1 detection kit following the manufacturers' instructions (cat no: 8818; Cell Signaling Technology), and Western blotting with anti-Rap1. Quantification was performed by measuring the intensity of the signals with ImageJ software (National Institutes of Health, Bethesda, MD).
RNA isolation and real-time quantitative real-time-polymerase chain reaction
Total RNA was extracted using TRIzol reagent (Invitrogen) according to the manufacturer's instructions. cDNA was synthesized using 1 μg of total RNA, ReverTra Ace (Vazyme, Nanjing, China), and oligo (dT) 12–18 primers. Gene expression was measured by real-time PCR using real-time PCR Master Mix reagents (Vazyme, Nanjing, China) and 7300 real-time PCR system (Applied Biosystems, Foster City, CA). For real-time PCR analysis, the relative amount of mRNA or gene to internal control was calculated using the equation 2ΔCT, in which ΔCT = CT gene − CT control.
mtDNA copy number assay
mtDNA copy number analysis was performed by quantification of mitochondrial Cyt B and COX III levels, which are encoded by mtDNA. Tissue total DNA was isolated using DNeasy blood and tissue kit (cat no: 69504; QIAGEN). mtDNA was quantified by quantitative real-time PCR with primers to Cyt B and COX III.
Seahorse XF24 mitochondrial stress analysis
Optimization of cell density and working concentration titers for each individual inhibitor was completed before the Seahorse XF24 mitochondrial stress analysis according to the Seahorse XF24 User's Manual (Seahorse Bioscience, Billerica, MA). OCR was automatically calculated, recorded, and plotted by Seahorse XF24 software version 1.8 (Seahorse Bioscience).
At the end of each assay, cells were washed once with an excess of room temperature Dulbecco's phosphate-buffered saline, lysed with ice-cold RIPA buffer (0.15 M NaCl, 1 mM ethylenediaminetetraaceticacid, 1 mM ethylene glycol-bis tetraacetic acid, 0.5% sodium deoxycholate, 0.1% sodium dodecyl sulfate, 1% Triton X-100, 50 mM Tris-HCl, pH 7.8, and protease and phosphatase inhibitor cocktails), and the protein content estimated by Bio-Rad protein assay (Bio-Rad, Hercules, CA) using a Molecular Devices SoftMax M3 microplate reader (Sunnyvale, CA). Data were normalized for total protein content per well.
Intracellular ATP measurement
ATP concentration was analyzed using the ATP bioluminescent somatic cell assay kit (FLASC; Sigma-Aldrich, St. Louis, MO). Briefly, 100 μL ATP assay mix working solution, 100 μL somatic cell ATP-releasing reagent, and 50 μL ultrapure water were added to the assay vials and vortex mixed, followed by addition of treated cells to each vial. Luminescence was detected using a SpectraMax M2 microplate reader (Molecular Devices, Sunnyvale, CA).
cAMP measurement
The cAMP complete enzyme immunoassay kit from Assay Designs was used as directed by the manufacturer (cat no: ADI-900-163; Enzo).
NAD+/NADH ratio measurement
The NAD+/NADH ratio was measured with the NAD+/NADH quantification kit from Biovision (cat no: K377-100) based on an enzymatic cycling reaction, according to the manufacturer's instructions.
Statistics
Animals were randomly assigned to control and treatment groups. Statistical analysis was performed using SigmaStat software (Jandel Scientific Software). Comparisons between groups were made using one-way analysis of variance, followed by Student's t-test. p < 0.05 was considered significant.
Footnotes
Acknowledgments
This work was supported by 973 Science program of the Ministry of Science and Technology of China (2012CB517603), National Science Foundation of China Grant 81470971 and Key project of National Natural Science Foundation of China 81530022 to J.Y.; National Science Foundation of China Grant 31300955/C1102 and Science Foundation of Jiangsu Province Grant BK-20141489 to L.J.; and National Science Foundation of China Grant 31400980 and Science Foundation of Jiangsu Province Grant BK-20141014 to L.F.
Author Disclosure Statement
No competing financial interests exist.
Abbreviations Used
References
Supplementary Material
Please find the following supplemental material available below.
For Open Access articles published under a Creative Commons License, all supplemental material carries the same license as the article it is associated with.
For non-Open Access articles published, all supplemental material carries a non-exclusive license, and permission requests for re-use of supplemental material or any part of supplemental material shall be sent directly to the copyright owner as specified in the copyright notice associated with the article.