
Abstract
Aims:
Hemodynamic shear stress participates in maintaining vascular redox status. Elucidating flow-mediated endothelial metabolites enables us to discover metabolic biomarkers and therapeutic targets. We posited that flow-responsive vascular endothelial growth factor receptor (VEGFR)-protein kinase C isoform epsilon (PKCɛ)-6-phosphofructo-2-kinase/fructose-2,6-biphosphatase 3 (PFKFB3) signaling modulates glycolytic metabolites for vascular repair.
Results:
Bidirectional oscillatory flow (oscillatory shear stress [OSS]: 0.1 ± 3 dyne·cm−2 at 1 Hz) upregulated VEGFR-dependent PKCɛ expression to a greater degree than did unidirectional pulsatile flow (pulsatile shear stress [PSS]: 23 ± 8 dyne·cm−2 at 1 Hz) in human aortic endothelial cells (p < 0.05, n = 3). PSS and OSS further upregulated PKCɛ-dependent PFKFB3 expression for glycolysis (p < 0.05, n = 4). Constitutively active PKCɛ increased, whereas dominant-negative PKCɛ reduced both basal and maximal extracellular acidification rates for glycolytic flux (p < 0.01, n = 4). Metabolomic analysis demonstrated an increase in PKCɛ-dependent glycolytic metabolite, dihydroxyacetone (DHA), but a decrease in gluconeogenic metabolite, aspartic acid (p < 0.05 vs. control, n = 6). In a New Zealand White rabbit model, both PKCɛ and PFKFB3 immunostaining was prominent in the PSS- and OSS-exposed aortic arch and descending aorta. In a transgenic Tg(flk-1:EGFP) zebrafish model, GATA-1a morpholino oligonucleotide injection (to reduce viscosity-dependent shear stress) impaired vascular regeneration after tail amputation (p < 0.01, n = 20), which was restored with PKCɛ messenger RNA (mRNA) rescue (p < 0.05, n = 5). As a corollary, siPKCɛ inhibited tube formation and vascular repair, which were restored by DHA treatment in our Matrigel and zebrafish models.
Innovation and Conclusion:
Flow-sensitive VEGFR-PKCɛ-PFKFB3 signaling increases the glycolytic metabolite, dihydroxyacetone, to promote vascular repair. Antioxid. Redox Signal. 28, 31–43.
Introduction
H
Hemodynamic shear stress participates in epigenomic changes to maintain endothelial homeostasis. We uncovered a vascular metabolite, dihydroxyacetone, for vascular repair via flow-responsive vascular endothelial growth factor (VEGF) receptor-protein kinase C isoform epsilon (PKCɛ)-6-phosphofructo-2-kinase/fructose-2,6-biphosphatase 3 (PFKFB3) signaling, thus providing a novel mechano-metabolomic pathway for vascular repair.
Pulsatile shear stress (PSS) and oscillatory shear stress (OSS) differentially activate canonical Wnt-β-catenin signaling to modulate vascular development and repair (14, 33). PSS and OSS promote the differentiation of embryonic stem cells to vascular progenitors in angiogenesis (5, 45). Laminar flow-dependent vascular endothelial growth factor (VEGF) and endothelial nitric oxide synthase (eNOS) phosphorylation induce nitric oxide (•NO)-mediated protein kinase C isoform epsilon (PKCɛ) signaling to confer mitochondrial homeostasis (4, 55). Although VEGF-mediated angiogenesis promotes tumor initiation and progression (3, 43), the mechanisms underlying flow-mediated VEGF-PKCɛ signaling to modulate endothelial metabolites for vascular repair remain unexplored.
Endothelial glycolysis is mechano-responsive (49). Glucose uptake in endothelial cells (ECs) is metabolized to pyruvate via the glycolytic pathway (11). Rather than relying on oxidative metabolism for mitochondrial respiration, ECs generate more than 80% of their ATP from the glycolytic pathway (11). ECs increase their glycolytic flux when switching from quiescence to proliferation and migration states (13). A recent study reports that laminar shear stress (LSS) activates Krüppel-like factor 2 (KLF2) to suppress 6-phosphofructo-2-kinase/fructose-2,6-biphosphatase 3 (PFKFB3)-mediated glycolysis in ECs, mitigating angiogenesis and vessel sprouting (15), whereas flow-sensitive VEGF receptor (VEGFR) signaling upregulates PFKFB3-driven glycolysis (12, 13). Shear-mediated nitric oxide production induces PKCɛ (25, 54), which, in turn, attenuates mitochondrial reactive oxygen species (ROS) after ischemia/reperfusion (I/R) injury (6, 36). Flow-responsive VEGF-eNOS signaling activates PKCɛ to modulate EC proliferation, lumen formation, and homeostasis (28, 44). Nevertheless, the mechanotransduction mechanism underlying PKCɛ-mediated metabolomic pathways to mediate vascular repair remains elusive.
In this context, we sought to elucidate the flow-sensitive VEGFR-PKCɛ signaling to mediate glycolytic metabolites for vascular repair. Both PSS and OSS promoted VEGFR-dependent PKCɛ and PFKFB3 expression to promote glycolytic flux. Further, we demonstrated that shear stress-mediated PKCɛ signaling rescued vascular regeneration in Tg(flk-1:EGFP) zebrafish tail amputation model, and the glycolytic metabolite, dihydroxyacetone (DHA), restored tube formation and vascular repair in response to silencing PKCɛ. Thus, our study indicates that flow-sensitive VEGFR-PKCɛ signaling promotes glycolytic metabolites for vascular repair.
Results
Flow-responsive PKCɛ mediated endothelial glycolysis
PSS and OSS differentially increased PKCɛ messenger RNA (mRNA) expression by 65% and 134%, respectively, whereas the VEGFR inhibitor, cediranib at 10 μM or VEGFR2 knockdown with small interfering RNA (siRNA) inhibited shear stress-induced PKCɛ mRNA and protein expression (Fig. 1A and Supplementary Fig. S1A; Supplementary Data are available online at

In addition, PKCɛ-mediated metabolic activity was quantified by using a SeaHorse Flux Analyzer. CA-PKCɛ increased basal (3.11-fold, p < 0.01, n = 4) and maximum extracellular acidification rates (ECAR; 2.52-fold, p < 0.01 vs. DN-PKCɛ, n = 4) for proton production as an indicator of glycolytic flux (57). This elevated glycolytic flux was further validated with H2O2 (50 μM)-induced oxidative stress (2.13-fold basal ECAR, 2.45-fold maximum ECAR, p < 0.01, n = 4) (Fig. 1E, F).
Shear stress modulated PKCɛ-dependent glycolytic metabolites
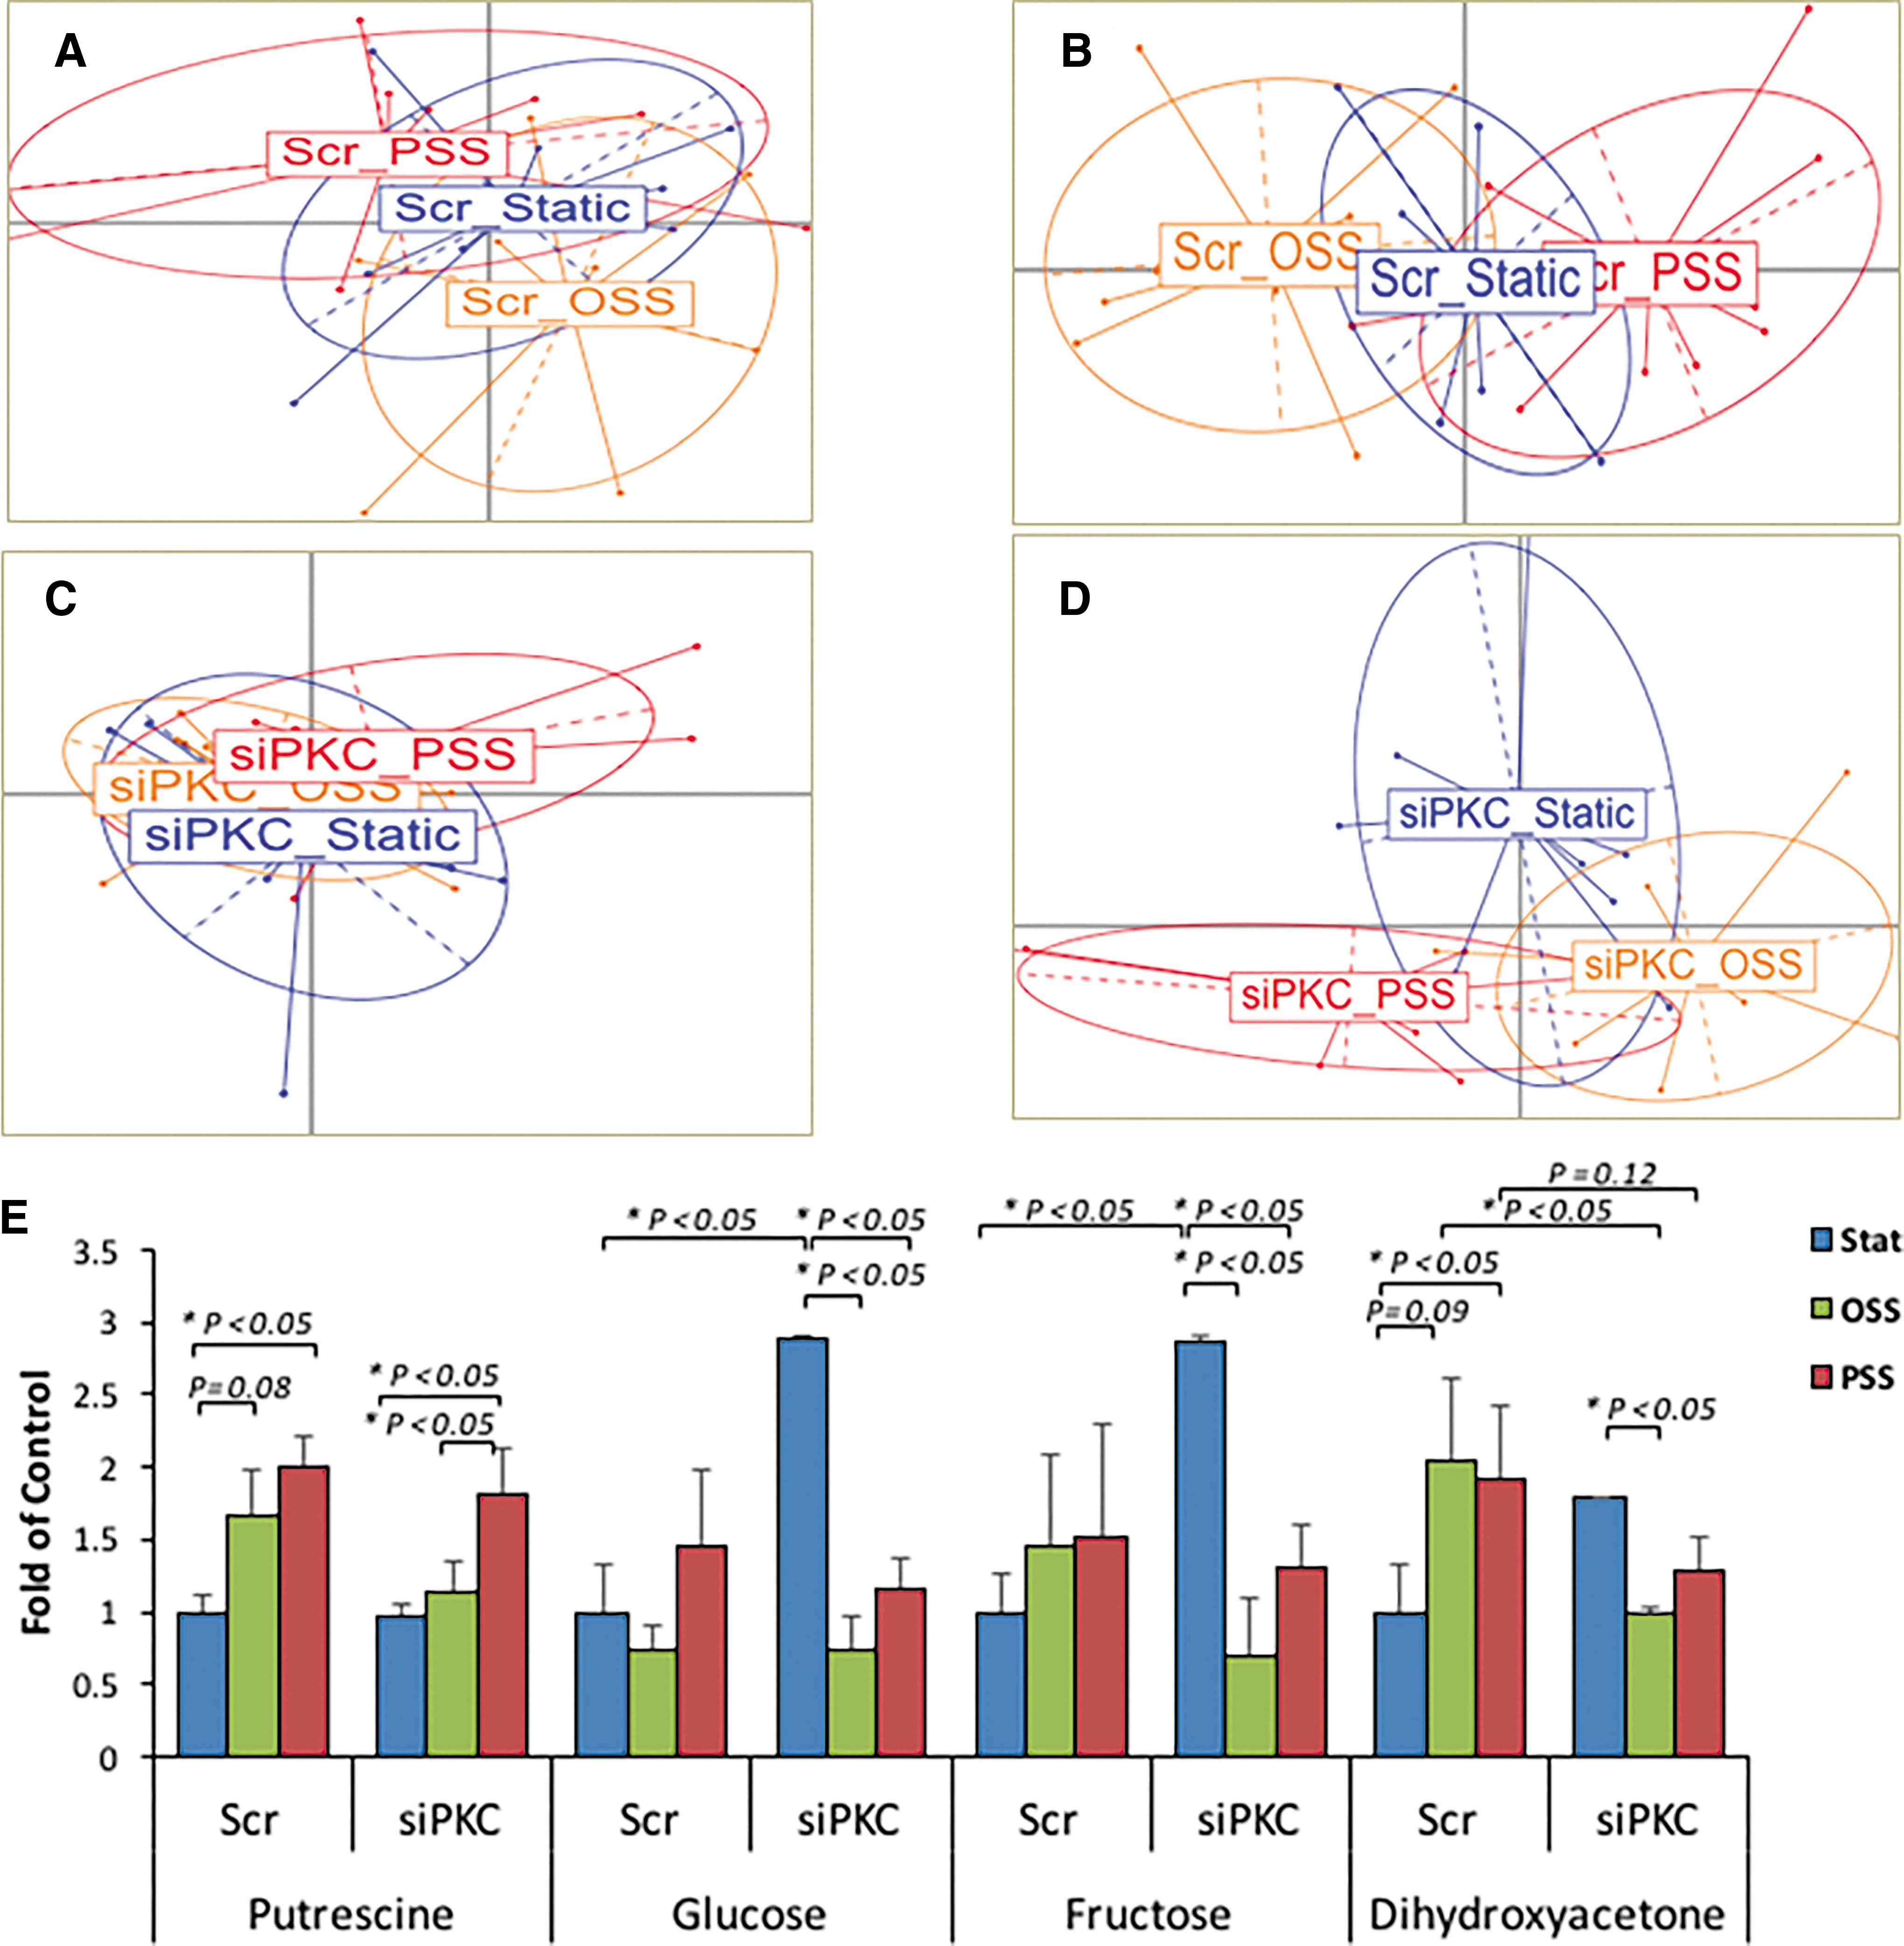
Our metabolomic analysis of 156 human aortic endothelial cells (HAEC) metabolites with a known identity (Supplementary Table S1) revealed that 4 metabolites were significantly upregulated in response to PSS and OSS, including putrescine (C4H12N2) and dihydroxyacetone (C3H6O3), whereas aspartic acid (C4H7NO4) was decreased (Supplementary Fig. S3). To validate flow-mediated glycolytic metabolites, we performed metabolomic analysis in HAEC transfected with scrambled (Scr) siRNA or siPKCɛ in response to (i) static, (ii) PSS, and (iii) OSS conditions. Principal component analysis (PCA) demonstrated significant separation among 16 metabolites in the scrambled (Scr) group and among 13 in the siPKCɛ group (p < 0.05, n = 6) (Fig. 2A–D). Both PSS and OSS upregulated putrescine, glucose (C6H12O6), fructose (C6H12O6), and DHA. In the presence of siPKCɛ transfection, OSS attenuated glucose, fructose, and DHA to a greater degree than did PSS. siPKCɛ transfection also increased glucose and fructose, implicating a reduction in glycolysis and/or fructolysis. Further, siPKCɛ attenuated both PSS- and OSS-mediated increases in DHA (Fig. 2E). Thus, both PSS and OSS modulated PKCɛ-dependent glucose, fructose, and DHA as well as PKCɛ-independent putrescine.
PKCɛ mediated tube formation and vascular repair
In an in vitro Matrigel model, siPKCɛ decreased endothelial tube formation by 40% as quantified by tube lengths (p < 0.05 vs. Scr siRNA, n = 3) (Fig. 3A, B). CA-PKCɛ increased tube formation by 2.1-fold (p < 0.05 vs. LacZ, n = 3) (Fig. 3C, D). VEGFR inhibitor, cediranib, disrupted tube formation in Adv-LacZ-infected HAEC (Fig. 3C, D), and this disruption was restored with Adv-CA-PKCɛ (Fig. 3C, D). Glycolysis-relevant metabolites (glucose, fructose, and DHA) promoted HAEC tube formation, whereas a gluconeogenesis-relevant metabolite (aspartic acid) had no effects (Supplementary Fig. S4).

In a transgenic Tg(flk-1:EGFP) zebrafish model of tail regeneration, control p53 morpholino oligonucleotide (MO) injection supported vascular regeneration as visualized by a closed loop between the dorsal longitudinal anastomotic vessels and dorsal aortas at 3 days post-amputation (dpa) (Fig. 3E). PKCɛ MO injection impaired, whereas PKCɛ mRNA restored vascular regeneration at 3 dpa (Fig. 3E). Taken together, PKCɛ-mediated glycolytic metabolites promoted tube formation and vascular repair.
Genetic manipulations of shear stress-mediated vascular repair
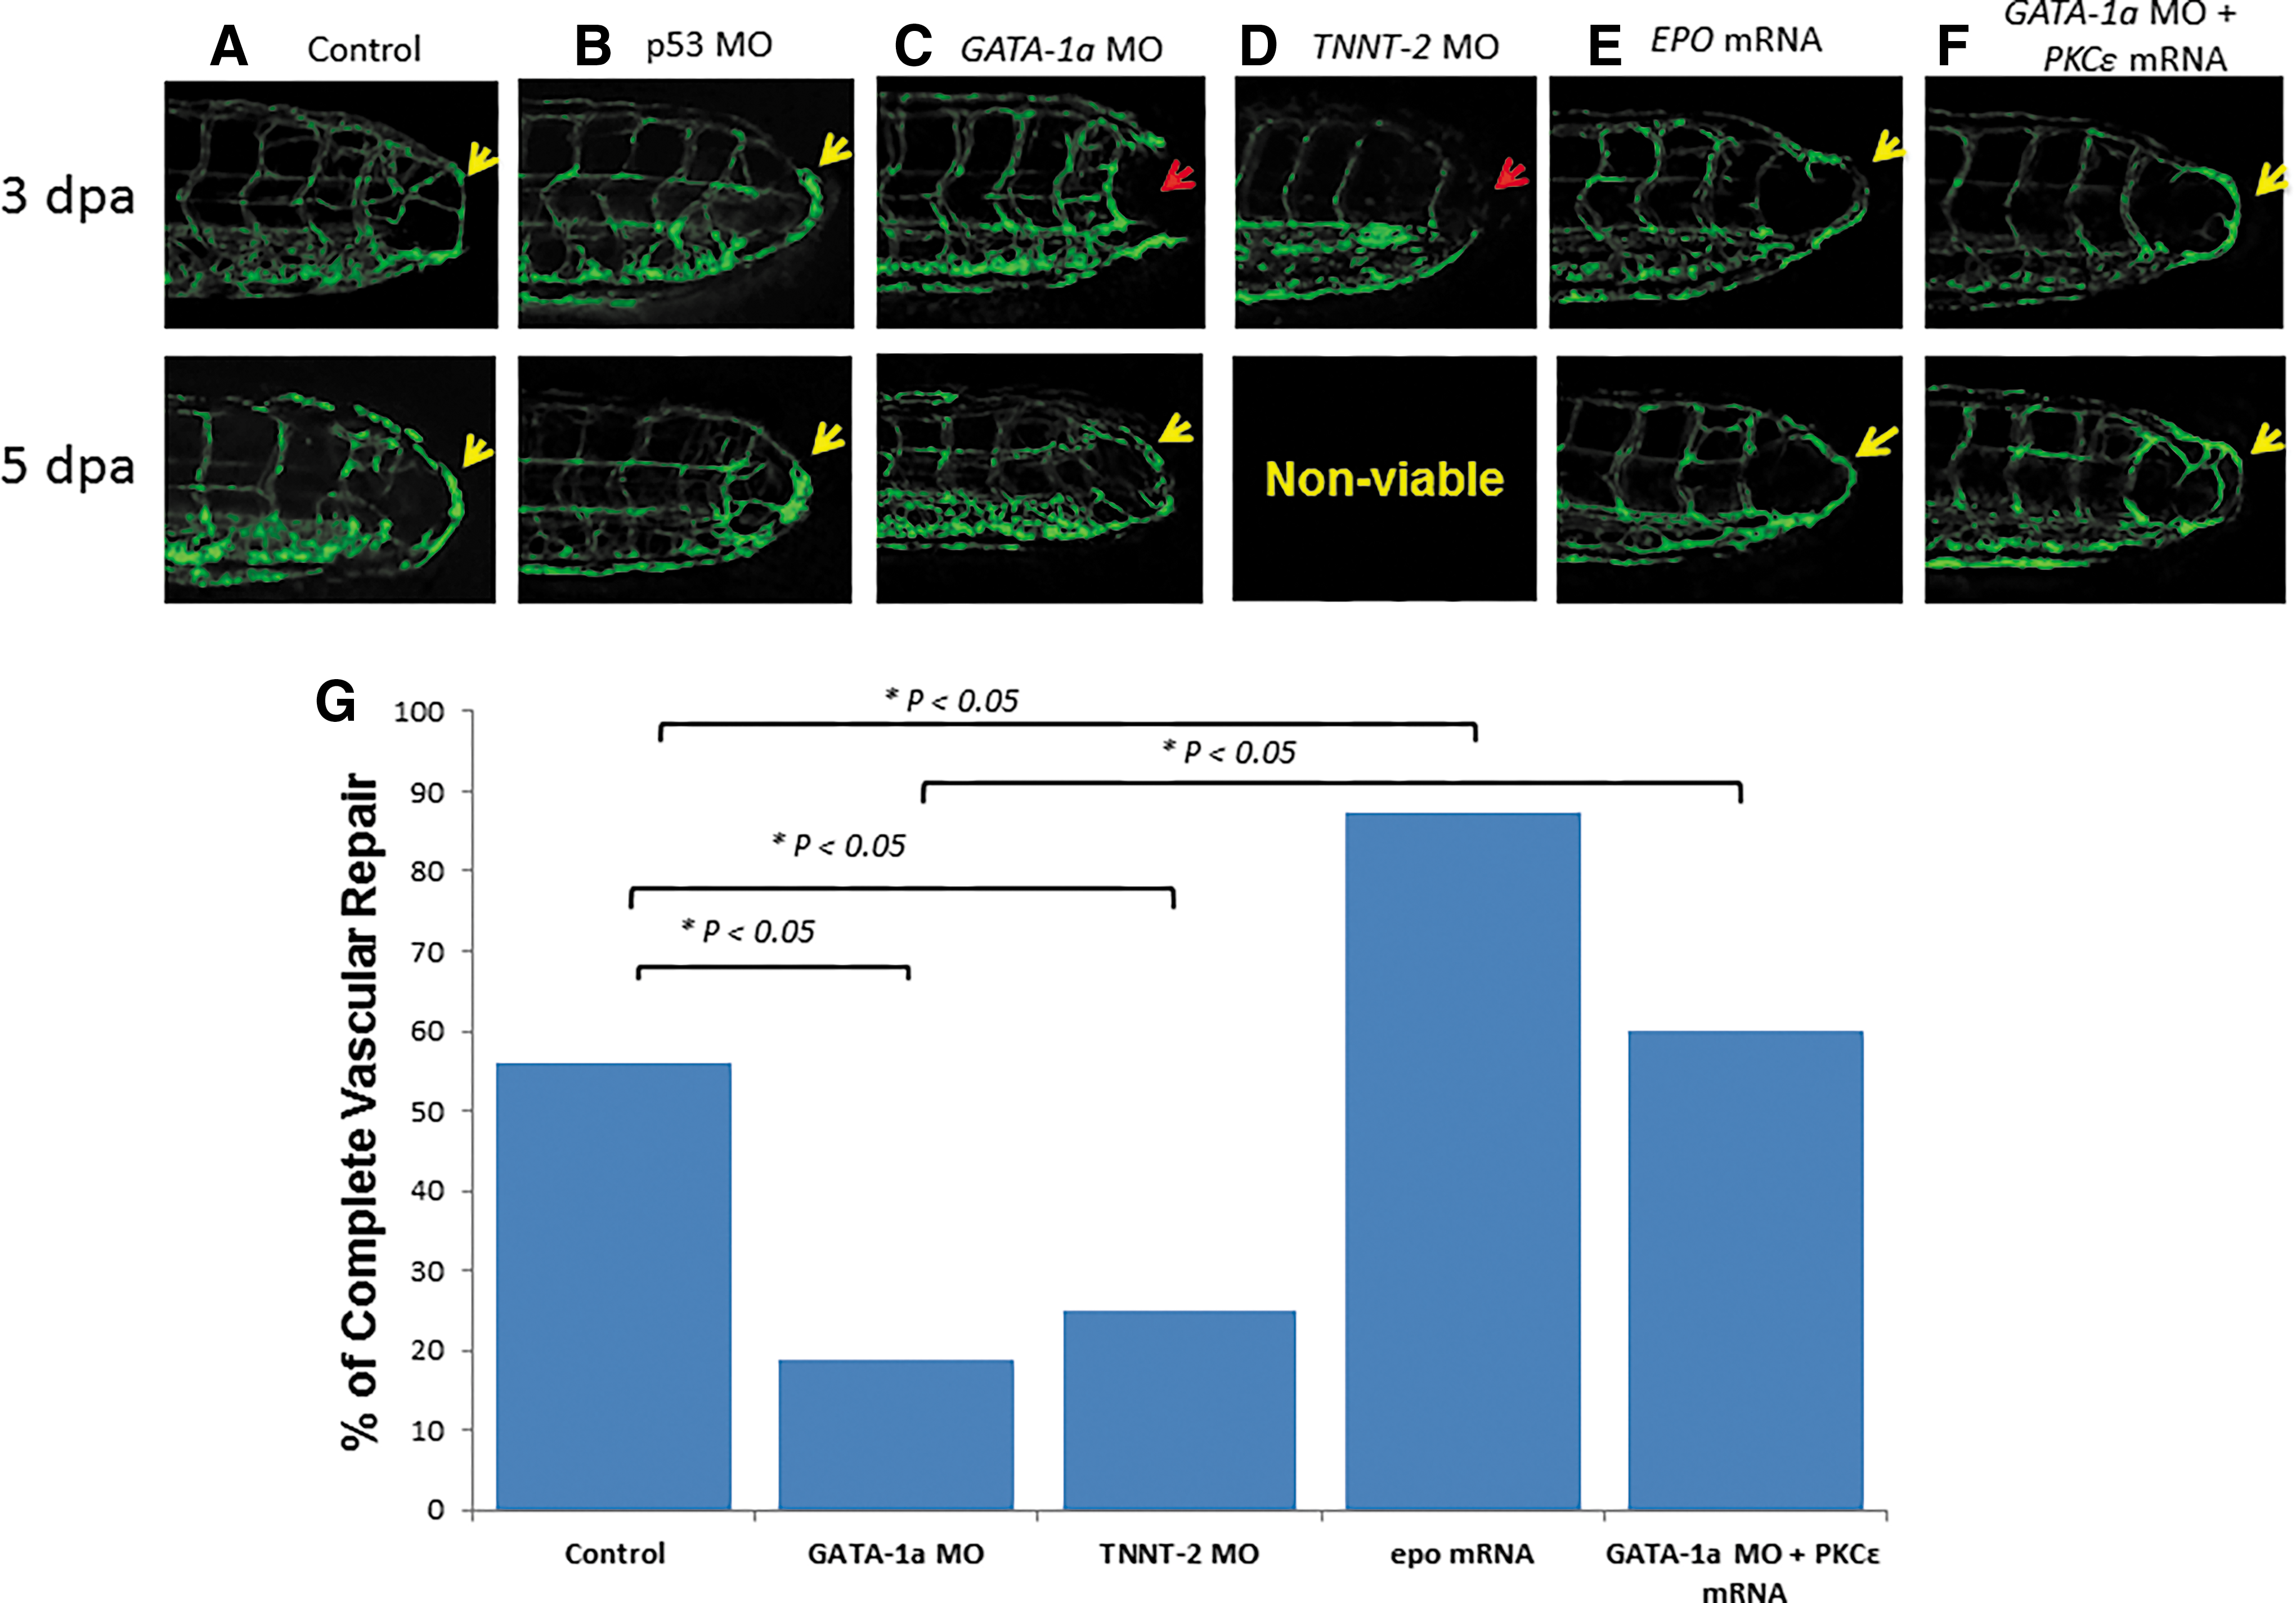
After GATA-1a MO injection to reduce viscosity-dependent shear stress (Supplementary Videos S1 and S3), zebrafish embryos failed to develop vascular regeneration at 3 dpa until 5 dpa (p < 0.05 vs. control, n = 30) (Fig. 4C). After TNNT-2 MO injection to inhibit myocardial contraction and blood flow, zebrafish embryos also failed to develop tail regeneration at 3 dpa (p < 0.05 vs. control, n = 5) (Fig. 4E), and they failed to thrive at 5 dpa. After erythropoietin mRNA injection to augment erythrocytosis as a means of restoring viscosity-dependent shear stress (Supplementary Video S2), zebrafish embryos developed tail regeneration at 3 and 5 dpa (p < 0.05 vs. control, n = 30) (Fig. 4E). As a corollary, rescue of GATA-1a MO-injected embryos with PKCɛ mRNA restored vascular regeneration at 3 and 5 dpa (p < 0.05 vs. GATA-1a MO-alone injected group, n = 30) (Fig. 4F). Vascular repair was quantitatively compared in response to the genetic manipulations (Fig. 4G), supporting the important roles of shear stress and PKCɛ to promote vascular repair.
PKCɛ-dependent DHA rescued vascular repair
In an in vitro Matrigel model, siPKCɛ attenuated tube formation, which was partially rescued by the PKCɛ-dependent glycolytic metabolite, DHA (p < 0.05 vs. Scr siRNA, n = 4) (Fig. 5A, B). In the zebrafish tail amputation model, DHA restored vascular repair from 67% to 100% in the control MO-injected fish at 6 dpa (p < 0.05 vs. control, n = 4). Further, DHA rescued vascular repair from 30% to 80% in PKCɛ MO-injected fish (p < 0.05 vs. control, n = 30) (Fig. 5C, D). These findings strengthen the notion that PKCɛ-dependent DHA promoted endothelial tube formation and vascular repair.

Discussion
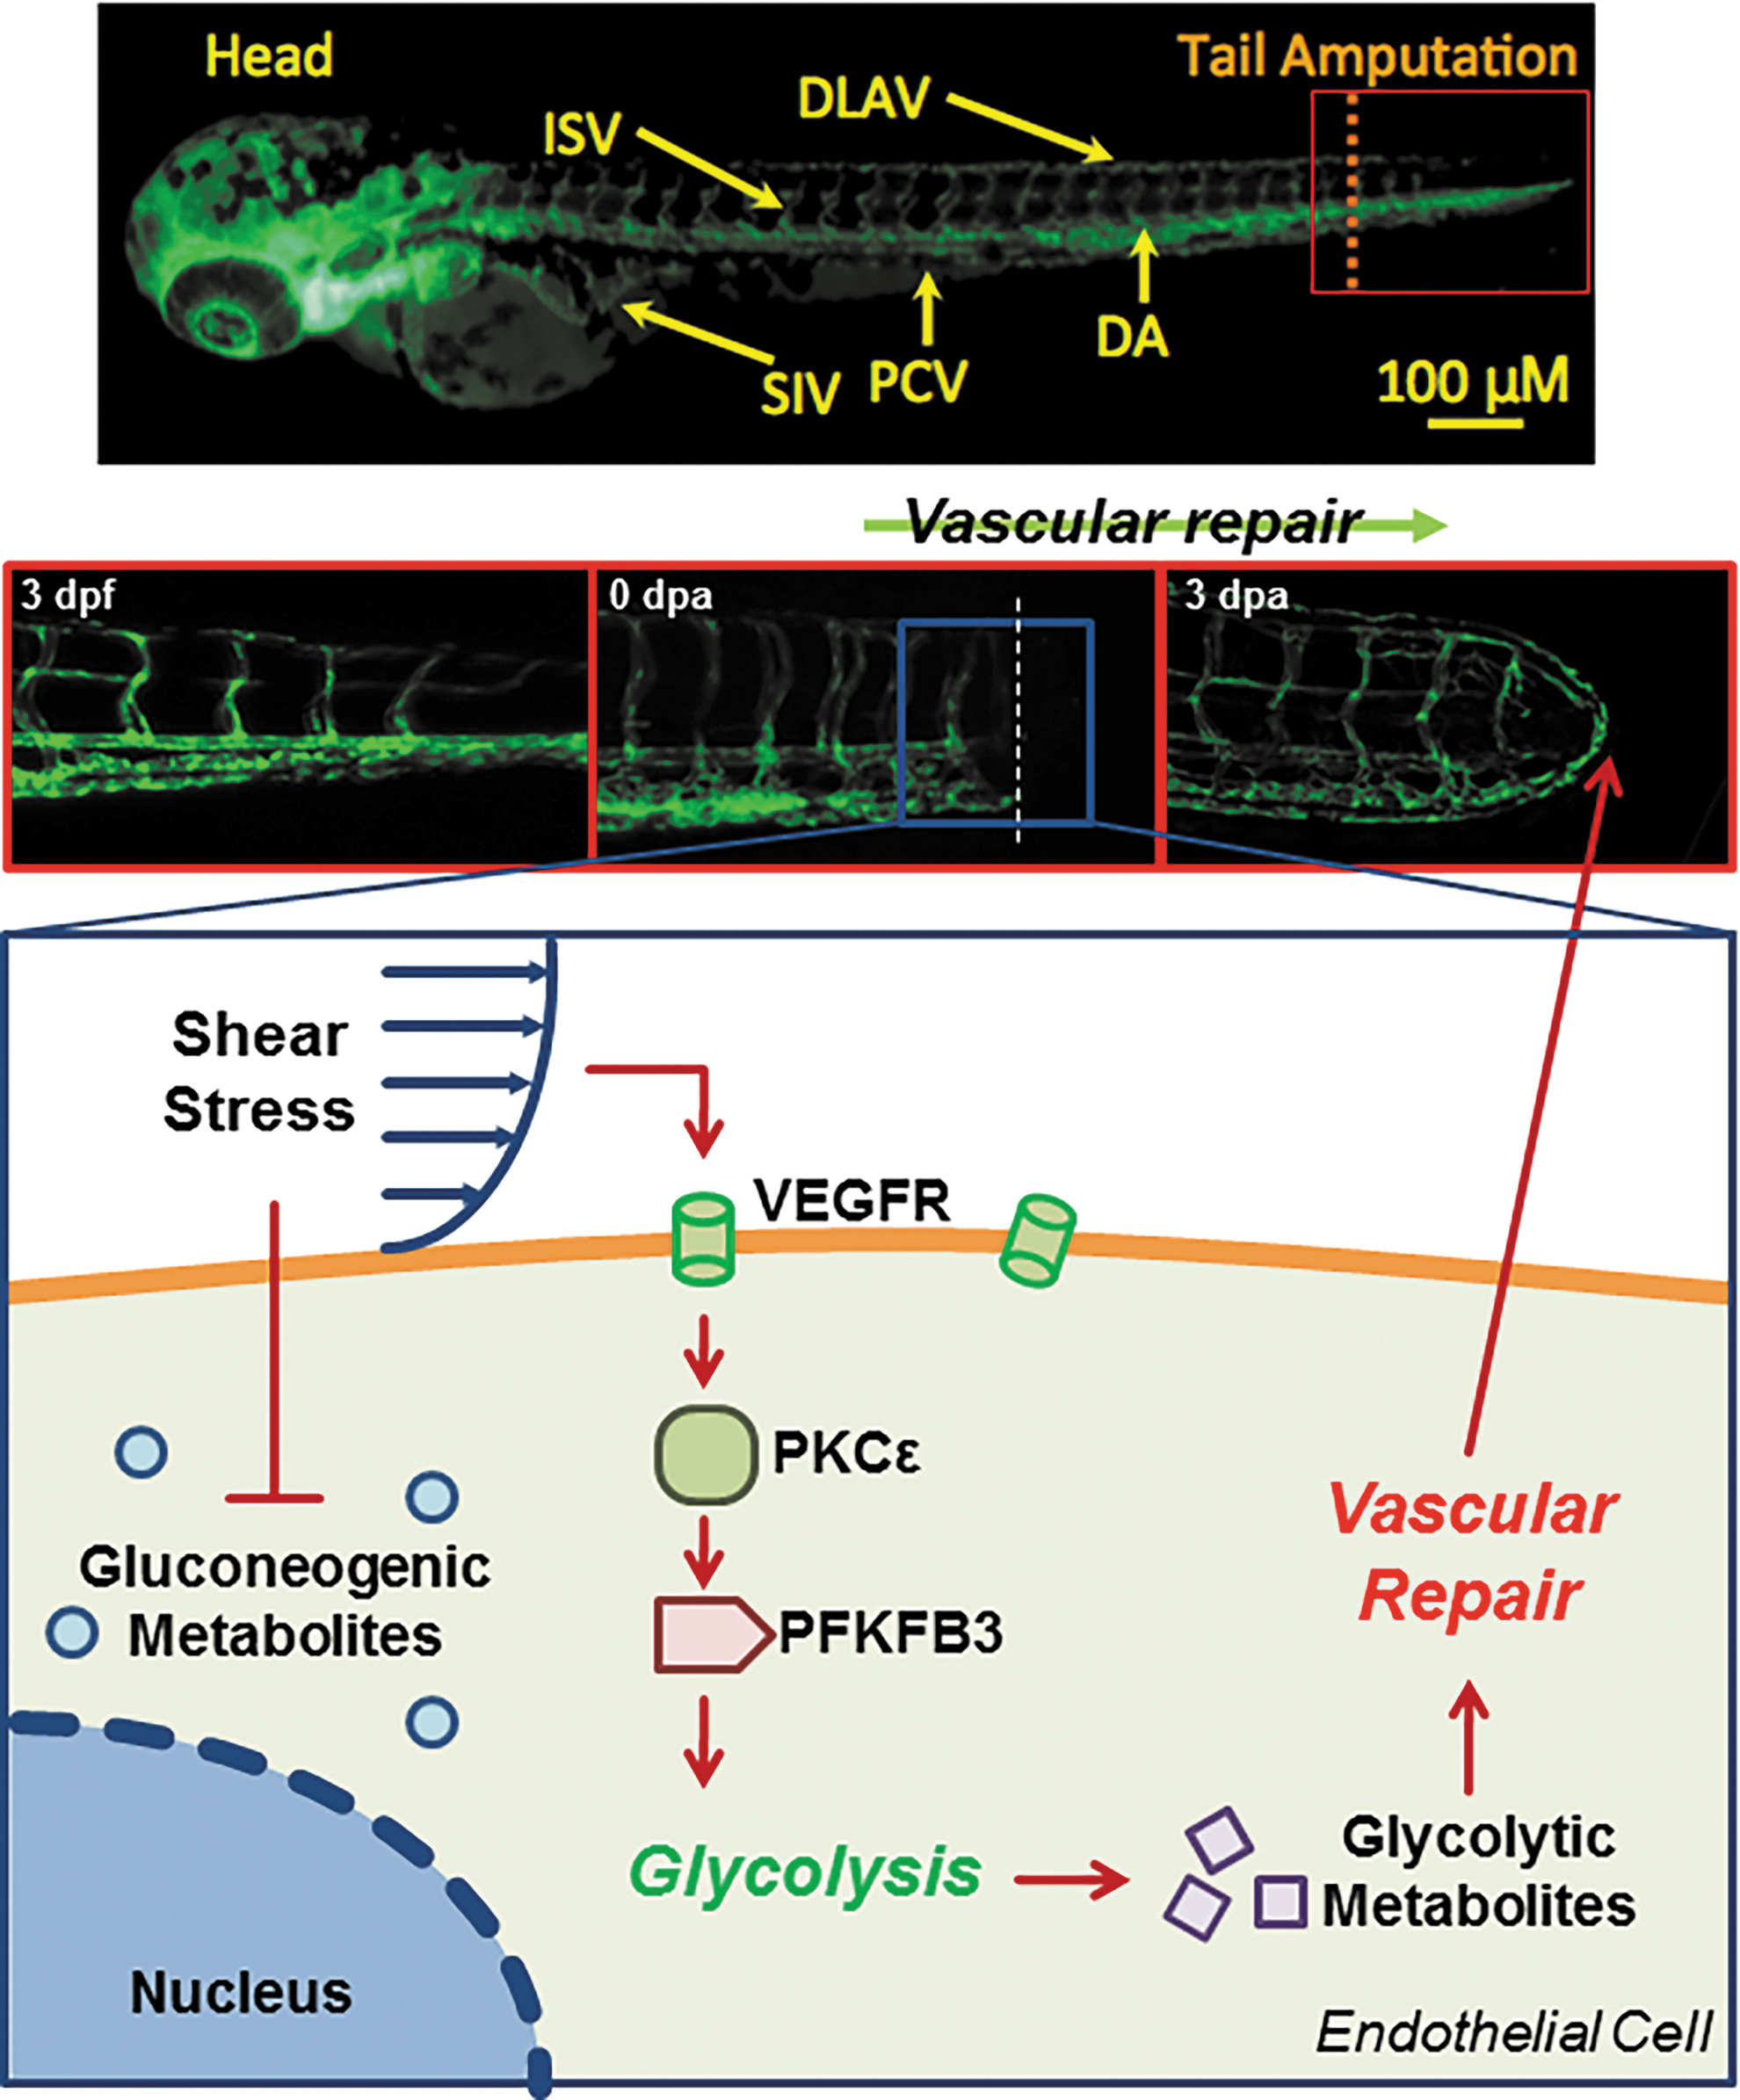
The novelty of this study resides in establishing flow-mediated VEGFR-PKCɛ-PFKFB3 signaling to promote glycolytic metabolite, DHA, for vascular repair. Metabolomic analysis revealed that PSS and OSS modulated PKCɛ-dependent endothelial PFKFB3 expression to mediate glycolytic metabolites. In the NZW rabbit aortic arch and descending aorta, PKCɛ and PFKFB3 immunostaining was present in the PSS- and OSS-exposed regions. In the zebrafish model of tail amputation, shear stress plays an important epigenetic role with PKCɛ to mediate vascular regeneration. Thus, we provide a new mechano-metabolomic pathway to increase the glycolytic metabolite, DHA, for vascular regeneration (Fig. 6).
Our data support that the characteristics of flow, namely PSS (τ ave = 50 dyne·cm−2 accompanied by a slew rate at ∂τ/∂t = 71 dyne·cm−2·s−1 at 1 Hz) and OSS (0 ± 3 dyne·cm−2 with τ ave = 0 dyne·cm−2 at 1 Hz), modulate VEGFR-PKCɛ-PFKFB3 signaling to increase glycolytic metabolites (Fig. 1E). Doddaballapur et al. reported that LSS (τave = 20 dyne·cm−2 at steady state, ∂τ/∂t = 0) reduced KLF2-dependent PFKFB3 promoter activity to reduce glycolysis (15), leading to attenuation in angiogenic sprouting (13, 46). However, the differential effects of LSS versus OSS to modulate AMPK and Akt activities are well recognized to promote glycolysis (21). Further, Jalali et al. demonstrated the role of p60scr and RAS in shear stress-activated endothelial MAPK signaling (23), whereas induction of PFKFB3 expression in response to MAPK activation has been previously reported in cancer cells (40). Taken together, these observations highlight the differential characteristics of shear stress to mediate PFKFB3 expression (22, 34).
Hemodynamic shear forces modulate vascular metabolism to maintain cellular homeostasis (27, 51). Our metabolomic analyses via gas chromatography time-of-flight mass spectrometry (GC-TOF) revealed that PSS and OSS increased DHA, fructose, glucose, and putrescine (Fig. 2). DHA is an intermediate metabolite of fructose metabolism, participating in glycolysis in its phosphate form (42). As a corollary, the glycolysis-related metabolites (namely alanine, glucose, and lactate) were also elevated in response to I/R in the CA-PKCɛ mouse (36). Thus, these glycolytic metabolites provide a basis for cellular homeostasis (27, 51) and migration (56), vascular development (12), and physical activity (39).
PFKFB3 is a key regulator of glycolysis to promote angiogenic sprouting (12). In response to the transition from quiescence to proliferation and migration, vascular ECs developed an increased glycolytic flux (13). During migration, glycolytic enzymes are translocated to lamellipodia for ATP production (13). Inhibition of PFKFB3 decreases stalk cell proliferation and tip cell migration (12) to reduce vessel sprouting (46). We further demonstrated PKCɛ-dependent PFKFB3 expression (Fig. 1C, D) and prominent PKCɛ and PFKFB3 immunostaining in the shear-exposed NZW aorta (Supplementary Fig. S2), supporting the notion that flow-mediated VEGFR-PKCɛ-PFKFB3 signaling promotes vascular regeneration.
PKC isoforms are distributed in numerous tissues and cell types. Three phorbol ester/diacylglycerol-dependent PKC isoforms, α-, δ-, and ɛ-, are highly expressed in the myocardium (26). PKCδ and PKCɛ are two Ca2+-independent isoforms implicated in regulation of growth, differentiation, and apoptosis of ventricular cells (16). PKCɛ over-expression in the CA-PKCɛ mouse increased glycolytic metabolites in association with cardioprotection after I/R injury (36). CA-PKCɛ over-expression further attenuated H2O2-mediated endothelial mitochondrial super oxide (O2 •−) production (Supplementary Fig. S5). In addition to increasing glycolytic flux (Supplementary Fig. S2E), CA-PKCɛ reduced p62 protein level to promote autophagic flux (Supplementary Fig. S6B). In this context, we present evidence of flow-mediated PKCɛ signaling to modulate endothelial homeostasis for tube formation and vascular repair.
Zebrafish (Danio rerio) comprise a well-established genetic system for studying cardiovascular development and disease (30, 37, 47). Use of zebrafish allows for genetic manipulations of viscosity to change shear stress (Fig. 4) [Eq. (1)]. Injection of GATA-1a MO significantly inhibits erythropoiesis up to 6 days post-fertilization (29), resulting in a reduction in viscosity to decrease shear stress, whereas an injection of erythropoietin (EPO) mRNA promotes erythrocytosis (9), resulting in a rise in viscosity to increase shear stress. Thus, use of the zebrafish system enabled us to recapitulate shear stress-mediated vascular repair via PKCɛ and glycolytic metabolite, DHA.
The NZW rabbits are a well-established atherosclerotic model for interrogation of the metabolically active lesions (35, 41). Similar to humans, NZW rabbits developed oxidized low-density lipoprotein-rich lesions in response to high-fat-induced hypercholesterolemia (7, 24, 58), thereby providing an ex vivo model to validate endothelial PKCɛ and PFKFB3 expression (Supplementary Fig. S2). In this context, both in vivo zebrafish and ex vivo NZW rabbit models are complementary and synergistic to strengthen the vascular endothelial phenotypes (31).
Despite differential PKCɛ mRNA and protein expression in response to PSS and OSS (Fig. 1A), we observed similar levels of PKCɛ activity. PKCɛ is activated by phosphorylation (Fig. 1B), and this non-linear relation may stem from post-translational modifications of PKCɛ protein to influence the level of PKCɛ phosphorylation (Fig. 1B), and subsequent PFKFB3 mRNA expression. In addition, the PSS- and OSS-responsive NADPH oxidase system generates ROS (22, 34). Despite an increase in PKCɛ protein expression (Fig. 1A), the concomitant production in ROS may be implicated in ubiquitination and protein degradation of PFKFB3 protein expression (52).
The advent of high-throughput “omics” approaches, including epigenomics, transcriptomics, miRnomics, proteomics, and metabolomics (48), has provided a new mechanotransduction strategy to discover biomarkers with therapeutic targets. Jo and colleagues investigated the disturbed flow-mediated metabolites by using the blood plasma samples from ApoE−/− mice, and they demonstrated that 128 metabolites were significantly altered, including sphogomyelin, a common mammalian cell membrane sphingolipid in association with atherosclerosis (20). Our findings further support that flow-mediated VEGFR-PKCɛ-PFKFB3 signaling increases endothelial glycolytic metabolites for vascular regeneration. In addition, PKCɛ over-expression promotes glycolytic metabolites for myocardio-protection. Taken together, we elucidated a mechano-metabolomic pathway to promote DHA as a potential biomarker for vascular therapeutics.
Materials and Methods
Ethics statement
All animal experiments were performed in compliance with the University of California, Los Angeles (UCLA) Institutional Animal Care and Use Committee (IACUC) protocols, under a project license also approved by the UCLA IACUC. Humane care and use of animals were observed to minimize distress and discomfort.
Vascular endothelial cell culture
HAEC were purchased from Cell Applications and cultured in endothelial growth medium (Cell Applications) that was supplemented with 5% fetal bovine serum (FBS; Gibco). HAEC were propagated for experiments between passages 5 and 10.
siRNA transfection
siRNA transfection was performed with Lipofectamine RNAiMax (Invitrogen). HAEC were plated in six-well plates or standard glass slides on the day before transfection. The cells were transfected with 50 nM PKCɛ or KDR siRNA (Qiagen). Transfection media were changed to normal growth media after 4 h of transfection. Cells were used for confirmation of gene knockdown or assay at 48 h after transfection.
Chemical reagents
Human recombinant VEGF was purchased from Fisher Scientific and dissolved in phosphate-buffered saline (PBS). Cediranib was purchased from SelleckChem and dissolved in dimethyl sulfoxide (DMSO).
PKCɛ activity assay
PKCɛ activity assay with the ADP-Glo Kinase assay kit (Promega) was performed to assess activity change of PKCɛ in response to PSS and OSS. A confluent monolayer of HAEC on glass slides were subjected to three flow conditions: (i) static, (ii) PSS, and (iii) OSS, as previously described (34). After flow exposure, HAEC underwent the kinase reaction by adding a mixture of kinase reaction buffer. After a short incubation, ADP-Glo™ reagent (Promega) was added to terminate the kinase reaction and to deplete residual ATPs in the lysates. Next, a mixture of kinase detection reagents was added to introduce luciferase and luciferin from newly synthesized ATP, converted from ADP. The specificity was achieved by using PKCɛ-specific peptide as substrate. Luciferase activities were measured by using the Glo-Max Luminometer (Promega) as a readout of PKCɛ activity.
Quantitative real-time polymerase chain reaction analysis
PKCɛ and PFKFB3 mRNA expression was measured by quantitative RT-polymerase chain reaction (PCR). Total RNA was isolated by using Aurum Total RNA Mini Kit (Bio-Rad Laboratory). RNA was reverse transcribed by using iScript complementary DNA (cDNA) synthesis kit (Bio-Rad Laboratory), followed by PCR amplification with iScript RT-PCR Kit with SYBR Green (Bio-Rad Laboratory). The expression levels were normalized to actin.
The forward primer sequence for PKCɛ was 5′-GAG CCG CCA CTT CGA GGA CTG-3′, and the reverse primer was 5′-TTG TGG CCG TTG ACC TGA TGG-3′. The forward primer sequence for Actin was 5′-ACC CAC ACT GTG CCC ATC TAC-3′, and the reverse primer was 5′-TCG GTG AGG ATC TTC ATG AGG-3′. The forward primer sequence for PFKFB3 was 5′-GGA GGC TGT GAA GCA GTA CA-3′, and the reverse primer was 5′-CAG CTA AGG CAC ATT GCT TC-3′. The differences in CT values for various intervals versus control were used to determine the relative difference in the levels of PKCɛ mRNA expression.
SeaHorse mitochondrial function analysis
HAEC were infected with either CA-PKCɛ recombinant adenovirus (Adv-CA-PKCɛ) or DN-PKCɛ recombinant adenovirus (Adv-DN-PKCɛ), followed by treatment with or without 50 μM H2O2 in Dulbecco's modified Eagle's medium (DMEM) +1% FBS. Mitochondrial function was analyzed by using the Seahorse XF analyzer system as described with a 24-well assay plate format (50). Twenty thousand cells were loaded to individual wells of the 24-well SeaHorse analysis plate. Glycolysis levels were determined through measurements of the ECAR (53). Basal glycolysis was measured without treatment and maximum glycolysis was determined by treatment of the cells with 4 μM carbonyl cyanide p-trifluoromethoxy-phenylhydrazone (FCCP), the mitochondrial uncoupler, after basal measurement.
Dynamic flow system to assess vascular endothelial metabolites
A dynamic flow system was used to simulate well-defined PSS and OSS as previously described (34). The flow system was designed to generate physiologic shear stress occurring at human arterial branching points with well-defined slew rates, time-averaged shear stress, frequency, and amplitude. Confluent monolayers of HAEC grown on glass slides were subjected to three flow conditions at 1 Hz for 4 h: (i) static control at no flow state, (ii) pulsatile flow with time-averaged shear stress of 23 dyne·cm−2 accompanied by a stress slew rate (∂τ/∂t = 71 dyne cm−2 s−1), and (iii) oscillating flow (0.1 ± 4 dyne·cm−2). ECs were maintained in DMEM culture media supplemented with 1% FBS at a temperature of 37°C and pH of 7.4 during flow exposure.
Endothelial metabolomic analysis
Metabolite samples were collected from HAEC treated with PSS (τ ave = 50 dyne·cm−2 accompanied by ∂τ/∂t = 71 dyne·cm−2·s−1 at 1 Hz), OSS (0 ± 3 dyne·cm−2 with τ ave = 0 dyne·cm−2 at 1 Hz), or static conditions for 4 h (Supplementary Fig. S7). For oscillating flow, minimal forward flow at a mean shear stress of 0.2 dyne·cm−2 was provided every hour to deliver nutrients and to remove waste products. Cells were trypsinized, fixed in 4% paraformaldehyde (PFA), and immediately stored at −80°C before shipment in dry ice to the West Coast Metabolomics Center at UC Davis. GC-TOF analysis was performed to identify 156 known metabolites and 290 unknown compounds (18). Metabolites were reported with retention index, quantification mass, and full mass spectra. Quantification was by peak height without internal standards for absolute concentration.
PCA to assess significant metabolite change
PCAs were carried out by using the programming language R, version 2.14.0. Built-in “ade4” package was utilized to plot factorial maps with representation-of-point classes, which are denoted as Static, PSS, and OSS. Before performing PCAs, the concentrations of subjected metabolites were normalized by using the Pareto scaling method to put the measurements of different metabolites on the close scale. The x-axis in the figures was depicted as the first principal component (PC1) representing the space with the largest variance in data, whereas the y-axis was depicted as the second principal component (PC2) representing the space with the second largest variance. The ovals are 95% inertia ellipses.
Immunohistochemistry
Vascular rings corresponding to the aortic arch and thoracic aorta were cut from rabbit aorta segments, and they were immersed in 4% PFA. They were embedded in paraffin and cut into serial 5-μm sections. Immunostaining was performed with standard techniques in paraffin-embedded vascular tissue. Hematoxylin and eosin staining was used to observe gross vascular morphology, and PKCɛ and PFKFB3 staining was performed by using mouse monoclonal (PKCɛ, ABCAM) and goat polyclonal (PFKFB3, SCBT) antibodies. Tissue sections were viewed with a microscope, and images were captured with a CCD digital camera. Quantification of staining intensity was performed by using ImageJ software.
Tube formation assay
HAEC cells were grown in a 96-well plate at 20,000 cells/well on a 100 μl Matrigel growth-factor-reduced matrix (BD Biosciences) that was allowed to solidify before seeding cells in DMEM +5% FBS +25 ng/ml VEGF. Tube growth was allowed for 6 h, and wells were imaged to visualize tube formation with a microscope (Olympus). Images were analyzed by using
Transgenic Tg(flk-1:EGFP) zebrafish model to study vascular injury and repair
Tg(flk-1:EGFP) transgenic zebrafish embryos were generously provided by Prof. Ellen C. Lien (Children's Hospital Los Angeles, Los Angeles, CA) for assessing vascular injury and repair in response to tail amputation. Flk-1, VEGFR1, is tissue specific for vascular ECs. Fish embryos were injected with either a PKCɛ MO or a control nonsense MO. Injection was validated by qRT-PCR analysis of PKCɛ gene expression. The following MO sequences were used. Standard control negative MO: 5′-CCT CTT ACC TCA GTT ACA ATT TAT A-3′; zebrafish p53 apoptosis suppression MO (p53MO): 5′-GCG CCA TTG CTT TGC AAG AAT TG-3′; PKCɛ splice MO: 5′-CTC CAT TAA AAA CCA CCA TGA TGA C-3′; GATA-1a MO: 5′-CTGCAAGTGTAGTATTGAAGATGTC-3′; TNNT-2a MO: (5′-CGCGTGGACAGATTCAAGAGCCCTC-3′. MOs were dissolved in water to make 0.3 mM stock solution with addition of 0.1 mM p53 MO. Immediately after collection at 0 hpf, approximately 30–40 embryos were randomly chosen for micro-injections. All the embryos were maintained in E3 medium at 28°C.
Injected fish larvae were grown to 72 hpf in standard E3 medium, followed by amputation of the posterior tail segment ∼100 μm from the tip of the tail. The larvae were anesthetized in 0.02% tricaine solution to allow for precise placement. Amputation was performed with a surgical scalpel under a stereo microscope (MEIJI Techno EMZ series; MEIJI) for both control and treatment groups. After amputation, fish were separated to allow for same-fish control. Fish tail sections were imaged (Olympus IX71; Olympus) to visualize the blood vessels immediately after amputation and every 24 h thereafter over the next 3 days. Regeneration of blood vessels was compared between the different treatment groups at 0, 1, and 3 dpa.
Cloning of PKCɛ mRNA for rescue
Mouse PKCɛ cDNA was amplified from a donor plasmid (Addgene) and cloned into the plasmid pCS2+ at the BamHI and EcoRI sites. Clones with the PKCɛ cDNA insert were selected by PCR screening. The pCS2+PKCɛ plasmid was verified by transfecting the plasmids into HEK-293 cells, followed by detecting PKCɛ protein expression by Western blot with anti-PKCɛ antibody. mRNA was synthesized from the cloned plasmid by using the mMessage SP6 kit (Invitrogen). Transcribed PKCɛ mRNA was purified with the total RNA isolation kit (Bio-Rad Laboratory) for in vivo rescue experiments.
Blood shear stress modulation
Shear stress (τ) is characterized as dynamic viscosity (μ) of fluid multiplied by shear rate
where
Western blot analysis
Cells were harvested, washed with PBS, and lysed with RIPA buffer. The lysate was centrifuged at 12,000 g for 10 min, and the resulting supernatants were used as the entire cell lysate. Proteins were separated by 4–20% polyacrylamide gel with sodium dodecyl sulfate (SDS), electroblotted onto the polyvinylidene difluoride membranes (GE Healthcare), and blocked overnight at 4°C in Tris buffered saline-Tween20 (TBS-T) containing 5% non-fat dry milk (Bio-Rad Laboratory). PKCɛ protein expression was detected with anti-PKCɛ (Santa Cruz Biotech), and equal loading was verified by blotting with anti-β-tubulin (Millipore, Inc.). After treatment with peroxidase-conjugated anti-goat (Santa Cruz Biotech) or anti-mouse IgG antibody (Jackson ImmunoResearch) for 1 h at room temperature, chemilluminescence signal was developed with Supersignal Western Pico (Pierce) and recorded with FluorChem FC2 (Alpha Inotech, Inc.). Antibodies against autophagy-associated genes were purchased from Boster Biological Technologies for p62. Parallel blots were performed with anti-β-tubulin (Millipore, Inc.) for loading normalization. Densitometry was performed to quantify blot bands as previously described (34).
Mitochondrial superoxide assay
Mitochondrial superoxide (mtO2 •−) was analyzed both quantitatively by flow cytometry and qualitatively by fluorescent imaging as previously described (34). Briefly, in a six-well format for FACS analysis, cells were incubated with 10 μM mitoSOX dye (Invitrogen) for 15 min, then lysed, and finally rinsed three times with PBS buffer to remove residual dye. Samples were then analyzed by using FACS analysis, with gating to remove debris or clusters.
For qualitative imaging of mtO2 •− levels during tube formation, tube formation assay was performed, as described earlier, with media that were absent of phenol red. At 6 h, cells were incubated with 10 μM mitoSOX dye for 30 min, rinsed three times with Dulbecco's PBS, and finally fixed with PFA. Cells were imaged by using fluorescent microscopy.
Statistical analysis
Data were expressed as mean ± standard error of the mean unless otherwise stated. Multiple comparisons were performed by one-way analysis of variance, and statistical significance for comparison between two groups was determined by student t-test, two-sample proportional z-test, or Wilcoxon rank-sum test (non-parametric analysis) when data were not normally distributed. A p-value <0.05 was considered statistically significant.
Footnotes
Acknowledgments
The authors would like to express their gratitude to Dr. Manuel Mayr for providing the metabolomic analysis of PKCɛ-mediated cardiac metabolites. Human CA-PKCɛ and dominant-negative PKCɛ adenoviruses were generously provided by Dr. Allen Samarel at the Loyola University Medical Center. This study was supported by the National Institutes of Health HL118650, HL083015, and HL129727 (T.K.H.).
Author Disclosure Statement
No competing financial interests exist.
Abbreviations Used
References
Supplementary Material
Please find the following supplemental material available below.
For Open Access articles published under a Creative Commons License, all supplemental material carries the same license as the article it is associated with.
For non-Open Access articles published, all supplemental material carries a non-exclusive license, and permission requests for re-use of supplemental material or any part of supplemental material shall be sent directly to the copyright owner as specified in the copyright notice associated with the article.