
Abstract
Aims:
Diabetic nephropathy (DN) is the most common microvascular complications and the principal cause of mortality and morbidity rates in patients with diabetes. The expression of advanced oxidation protein products (AOPPs) has been found in vacuolated renal tubules in DN and correlated with patients' decreased renal function. The accumulation of AOPPs is regarded as an initiating factor in podocyte injuries via the protein kinase C (PKC) signaling, which plays a critical role in triggering oxidative stress and mitochondrial injuries in diseases including DN. Whether AOPPs could induce mitochondrial injuries and fibrosis in renal tubules remains largely unknown. Herein, we tested the hypothesis that the accumulation of AOPPs in diabetes incurs mitochondrial dysfunction and oxidative stress, causing renal tubulointerstitial fibrosis (TIF) via PKC signaling pathway.
Results:
In vivo, intrarenal AOPPs accumulation correlated with oxidative stress, renal fibrosis, proteinuria, and declined renal function in DN patients and diabetic rats. AOPPs-induced mitochondrial injuries, apoptosis, and TIF were significantly mitigated by PKCη inhibition in diabetic rats. In vitro, high glucose (HG) stimulated AOPP expression and augmented PKC-mediated oxidative stress and fibrosis in HK-2 cells. Furthermore, we provide mechanistic evidence that inhibition of PKCη isoform alleviated mitochondrial injuries and function, attenuated apoptosis, and renal fibrosis in HG-cultured AOPPs-induced HK-2 cells.
Innovation and Conclusion:
We propose a novel mechanism that AOPPs-induced mitochondrial dysfunction and oxidative stress cause TIF in DN via activation of the PKCη isoform.
Introduction
Diabetic nephropathy (DN) is the principal cause of end-stage renal disease. It is the common culprit in the dialysis population in patients with diabetes (27, 32).
It is estimated that by 2030, the prevalence of DN would override other glomerular diseases and become the number one cause of renal deficiency around the globe (29). Advanced oxidation protein products (AOPPs), a class of renal pathological mediators, have been recognized in diseases with oxidative stress, including chronic kidney diseases (CKDs) and diabetes (2, 44). Chronic accumulation of AOPPs is associated with aggravated renal fibrosis in remnant kidney and experimental
In summary, we have shown that advanced oxidation protein products (AOPPs) trigger cluster of differentiation 36 (CD36)-dependent mitochondrial injury, oxidative stress, and profibrosis via activation of PKCη signaling. Therefore, inhibition of protein kinase C (PKC) signaling is able to simultaneously repress oxidative stress and reverse AOPPs-induced proteinuria and renal insufficiency. This study provides a novel and mechanistic linkage between AOPP/CD36 signaling and PKCη activation in the progression of diabetic nephropathy (
PKC plays a critical role in mediating mitochondrial injuries in various cells in several conditions (30). As a family of serine/threonine kinases, it plays a critical role in fibrosis by increasing extracellular matrix via stimulating active transforming growth factor-β production (43). PKC activation has been found in numerous tissues of diabetic animals and in several cultured cell systems exposed to high glucose (HG) media in vitro (6, 47, 55). Accumulating evidence has demonstrated that oxidative stress can be triggered by PKC signaling and induce podocyte damage in multiple diseases (25, 50). Although strategies have been used to block PKC signaling, injuries caused by PKC families can only be partially inhibited, suggesting other underlying mechanisms and the potential role of renal tubular cells in triggering these events.
Mitochondria, organelles widespread in the cytosol, regulate various physiological functions of the cell and play prominent roles in a number of cellular processes, including cellular metabolism, calcium buffering, or apoptosis. Mitochondria dynamically join and divide by the processes of fusion and fission under normal conditions (23). Mitochondrial dynamics are also involved in various cellular functions such as redox regulation and cell proliferation (1). The disruption of normal mitochondrial dynamics is implicated in the pathogenesis of various diseases, including diabetes (46), and aberrant mitochondrial fission is associated with increased reactive oxygen species (ROS) production and oxidative stress (16). Fission and fusion events continuously shape the mitochondrial network in the cell, and any disturbance in mitochondrial dynamics may alter cell morphology and affect its function (31). Moreover, mitochondrial dynamics is critical not only for the transmission of mitochondria to dividing cells but also for repair of damaged organelles (34).
It is well established that hyperglycemia is a major risk factor in the development and progression of DN (17), and metabolic/hemodynamic insults have been implicated in the pathogenesis of diabetic glomerulopathy (12). Hyperglycemia induces multiple cellular and molecular alterations that presage the development of renal tubulointerstitial fibrosis (TIF) (39). TIF not only accounts for declined renal function but also plays a predictive role in the progression of CKDs (4, 11, 14). However, the effect of exogenous stimuli, such as AOPPs and oxidative stress, on TIF has not been fully addressed. In this study, we tested the hypothesis that AOPPs could trigger mitochondrial dysfunction and oxidative stress, causing renal TIF in DN via the PKC signaling pathway.
Results
Relationships between intrarenal AOPP expression, oxidative stress, and fibrosis-related markers with DN patients' renal function
To elucidate the clinical significance and role of AOPPs in mitochondrial injuries and renal fibrosis, we first examined the expression profiles of related markers in renal biopsy tissues of DN patients and analyzed the relationship with PKC signaling. We found that AOPP was intensely expressed in vacuolated renal TECs as shown by Masson Trichrome Stain (MTS) and immunohistochemical staining (Fig. 1A). Correlation analyses revealed that the level of AOPP was positively correlated with serum creatinine (Scr) (Fig. 1B, r = 0.632, p < 0.001) and urinary N-acetyl-β-

Biological Parameters for Patients with Diabetic Nephropathy
p < 0.05, # p < 0.001.
BUN, blood urea nitrogen; DBP, diastolic blood pressure; DN, diabetic nephropathy; eGFR, estimated glomerular filtration rate; HDL, high-density lipoprotein; LDL, low-density lipoprotein; NAG, urinary N-acetyl-b-d-glucosaminidase; SBP, systolic blood pressure; Scr, serum creatinine; VLDL, very low-density lipoprotein.
Second, intrarenal AOPP upregulation caused activation of PKC signaling, mainly the PKCη isoform. Concomitantly, mitochondria-dependent apoptotic and profibrotic pathways were activated as evidenced by increased expression of glucose-regulated protein 78 (GRP78), caspase 3, and fibronectin (Fig. 1E). These changes were accompanied by increased fibrosis in renal tissues of DN compared with normal controls as examined by MTS (Fig. 1F). In addition, positive correlation between phosphorylated PKCη (pPKCη) and GRP78 (r = 0.82, p < 0.001) was found and the colocalization (Fig. 1G) was detected in renal TECs by immunofluorescence microscopy, indicating the interaction between these two molecules. The level of pPKCη was positively correlated with Scr (Fig. 1H, r = 0.507, p = 0.003) and urinary NAG (Fig. 1I, r = 0.377, p = 0.03), and negatively correlated with eGFR (Fig. 1J, r = −0.357, p = 0.041).
Third, in human renal biopsy tissues, we further analyzed the expression profiles of other molecules related to mitochondrial injury, oxidative stress, profibrosis and epithelial–mesenchymal transition (EMT). We found that the level of peroxisome proliferator-activated receptor-γ coactivator 1α (PGC1α), C/EBP homologous protein (CHOP), and 8 hydroxyguanosine (8OHdG) was increased. These changes were corresponded with the upregulation of collagen IV (COL IV), α-smooth muscle actin (α-SMA), and matrix metalloproteinase 7 (MMP7) (Supplementary Fig. S1A, B). In addition, intrarenal AOPPs accumulation significantly disrupted glomerular structure as exemplified by diminished staining of the slit diaphragm molecule, podocin and nephrin, diffusedly effaced podocyte foot processes, and increased glomerular basement membrane thickness in DN renal biopsy samples (Supplementary Fig. S1C–F).
Collectively, these data suggest that AOPPs-induced mitochondrial injury and oxidative stress might cause renal fibrosis via activation of PKC signaling and contribute to renal function decline in DN.
AOPPs promote TIF via PKC-mediated oxidative stress in diabetic rats in vivo
To investigate the mechanisms of AOPPs in mediating mitochondrial injuries and renal TIF, diabetic rats were first challenged with intraperitoneal injection of AOPPs and then treated with PKC inhibitors. We found that compared with those of normal controls, the levels of Scr, BUN, blood glucose, urinary NAG, urine albumin excretion rate (UAER), urine albumin to creatinine ratio (UACR), and creatinine clearance rate (Ccr) were increased in diabetic rats. Of note, AOPPs challenge further increased the level of Scr, BUN, urinary NAG, UAER, UACR, and Ccr. In addition, AOPPs stimulated lipid metabolism as illustrated by increased level of total cholesterol, triglyceride, LDL, VLDL, and decreased HDL in diabetic rats. It was also shown that the level of AOPP in plasma and tissue homogenates of the rats was significantly increased in AOPPs-challenged diabetic rats compared with controls. Significantly, these alterations were mitigated by a PKCη pseudosubstrate inhibitor myristoylated-calbiochem (Myr) but not by the selective inhibitor of PKCδ Rottlerin (Table 2). These results suggest the role of AOPPs in inducing proteinuria and renal tubule injuries and the effect of PKCη inhibition at the early stage of diabetes.
Biological Parameters for Diabetic Rats Treated with Protein Kinase C Inhibitor at Week 12
p < 0.001 vs. normal ctrl.
p < 0.01 vs. DM_RSA.
p < 0.001 vs. DM_AOPP.
Ccr, creatinine clearance rate; DM_AOPP, diabetic rats treated with advanced oxidation protein products; DM_AOPP+Myr, diabetic rats treated with advanced oxidation protein products and Myr; DM_AOPP+Rottlerin, diabetic rats treated with advanced oxidation protein products and Rottlerin; DM_Ctrl, diabetic rats; DM_RSA, diabetic rats treated with rat serum albumin; Myr, myristoylated-calbiochem; UACR, urine albumin to creatinine ratio; UAER, urine albumin excretion rate.
Second, we found that in renal tubules, Myr inactivated PKCη, downregulated GRP78, caspase 3, and fibronectin (Fig. 2A, B), increased collagen accumulation as shown by picrosirius red stain (Fig. 2C, D), and damaged mitochondria detected by transmission electron microscopy (Fig. 2E). However, Rottlerin had so such effects. Interestingly, colocalization of pPKCη and GRP78 was found in vacuolated renal tubules of AOPPs-challenged diabetic rat kidneys, whereas in undamaged tubules, no interaction between these two molecules was noticed, as seen by the periodic acid-Schiff and double immunohistochemical staining (Fig. 2F). Furthermore, there was a positive correlation between pPKCη and GRP78 expression (Fig. 2G, H), indicating the activation of the PKCη isoform in AOPPs-induced renal fibrosis in diabetic rats.
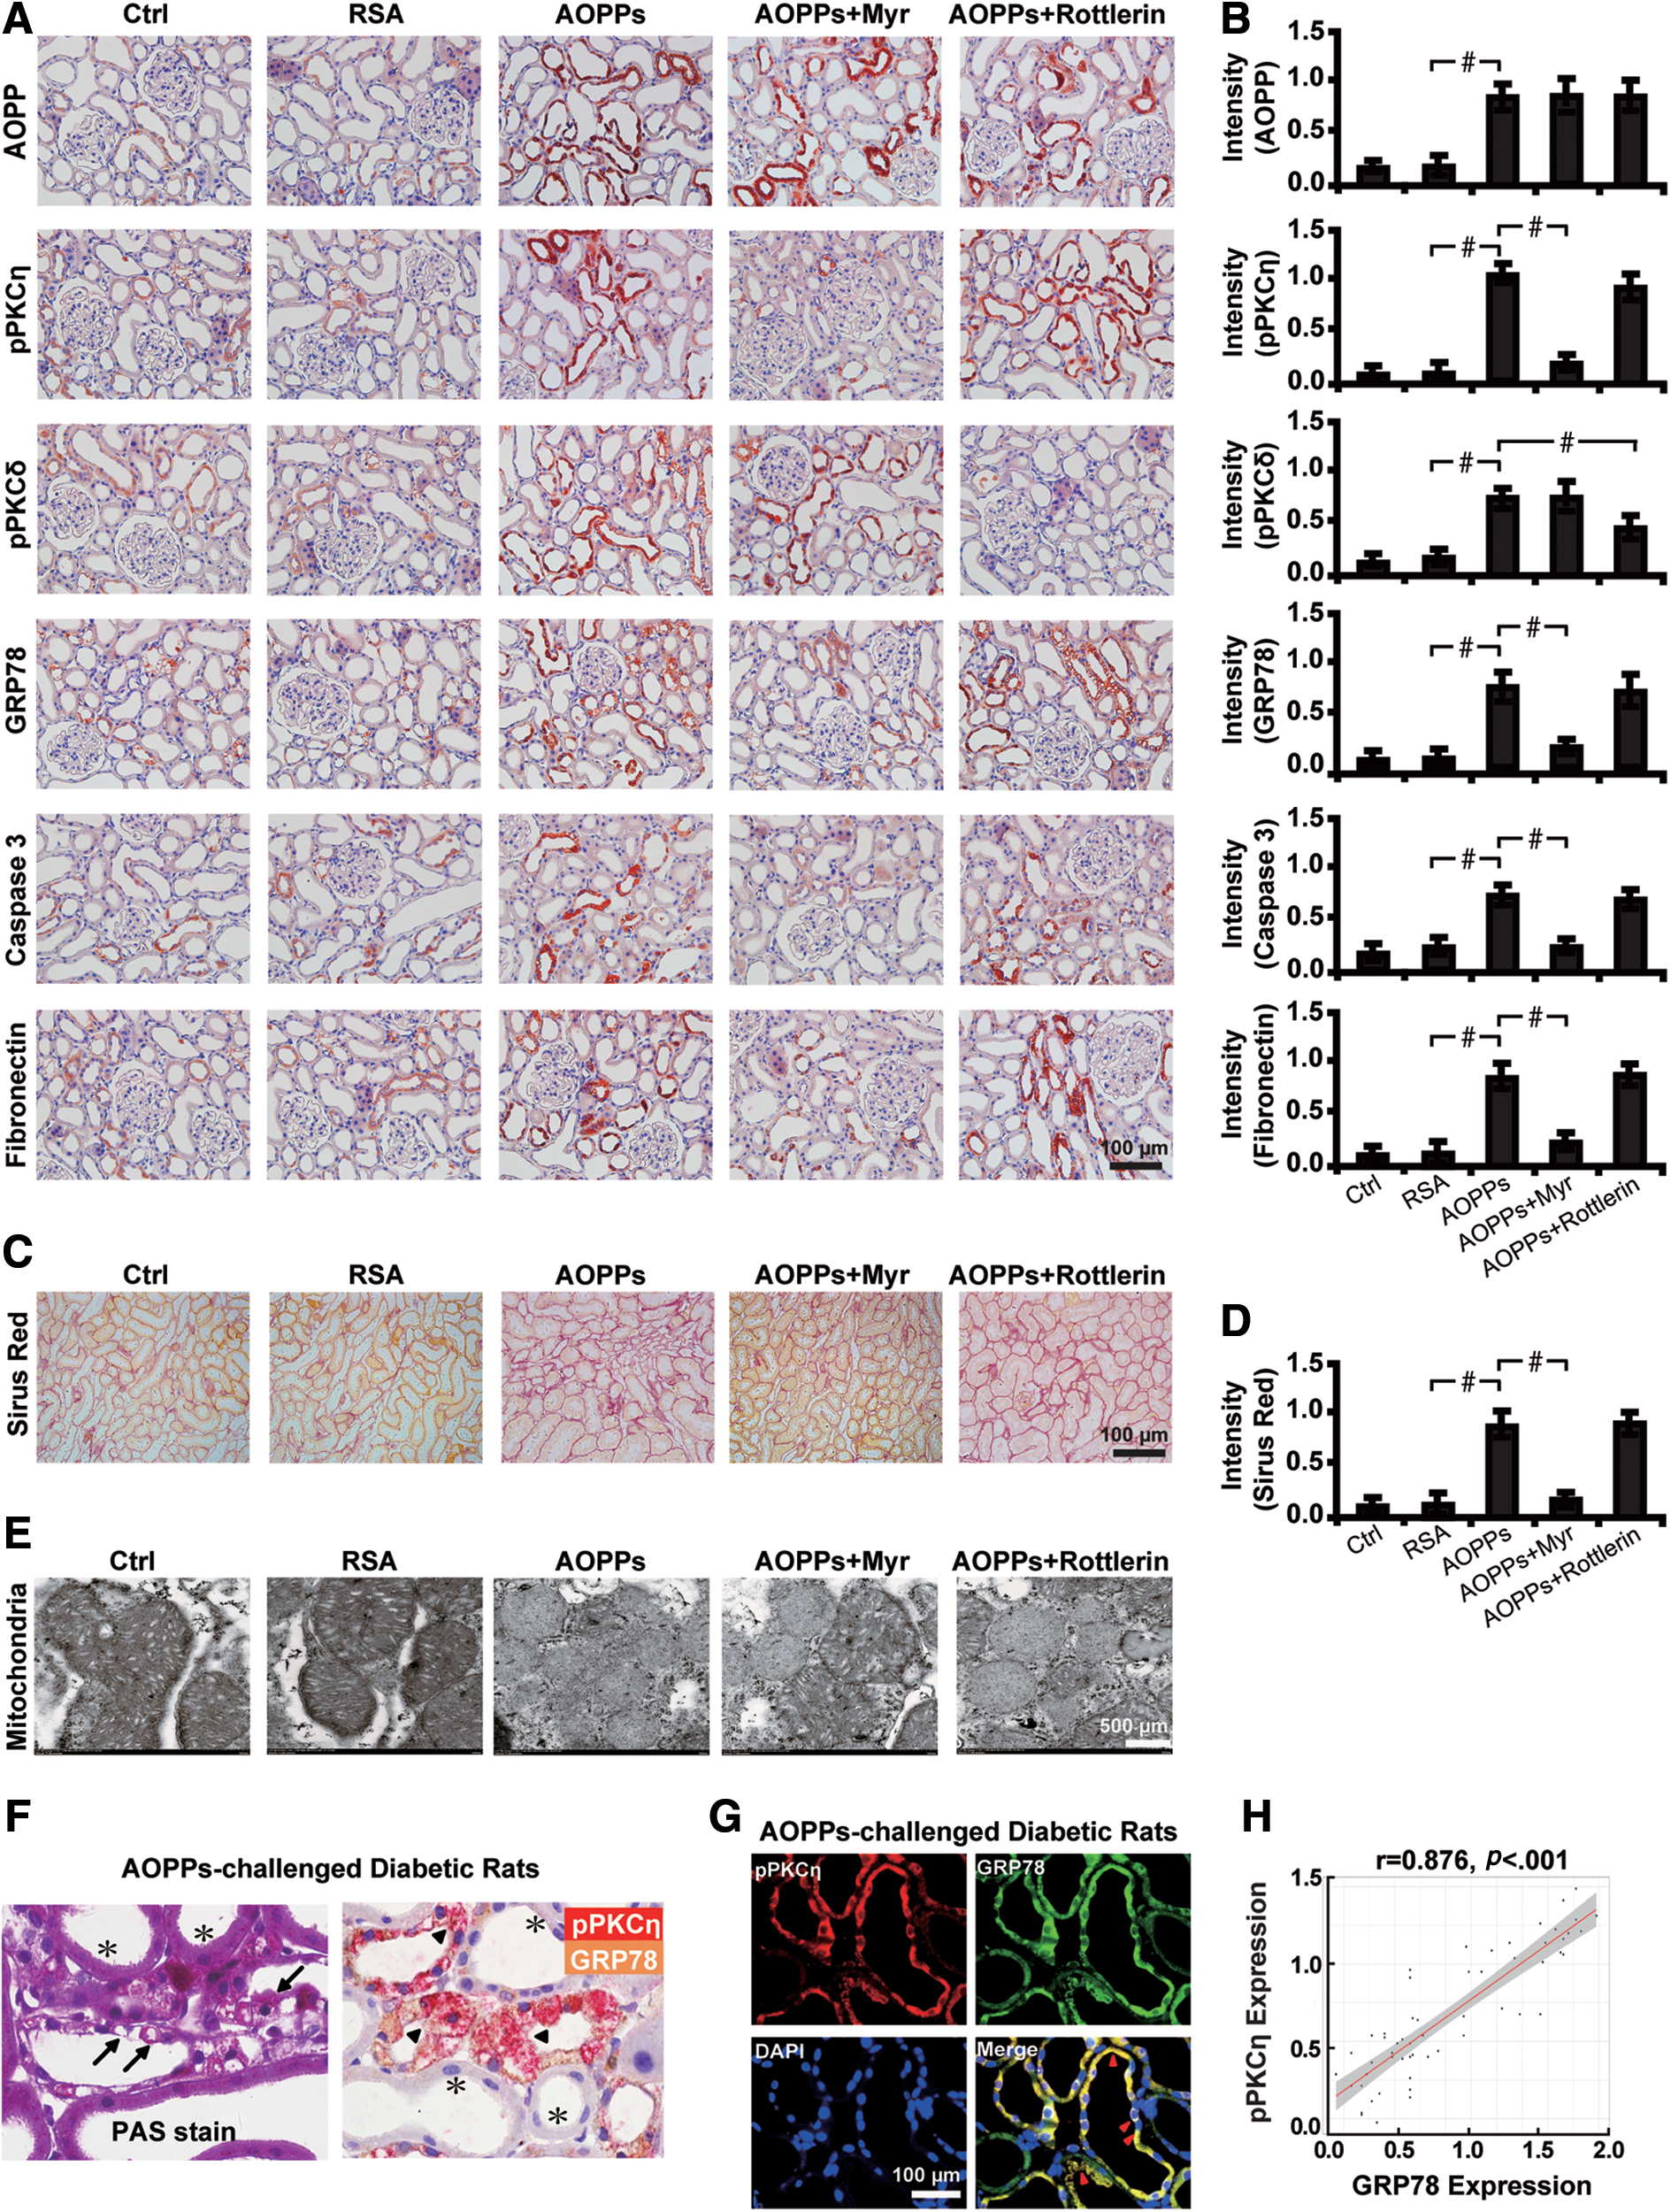
Third, we sought to investigate whether inhibition of PKC signaling could attenuate the expression of other molecules related to mitochondrial injury, oxidative stress, EMT, and profibrosis. Dramatically, AOPPs challenge caused an elevation in the level of PGC1α, CHOP, 8OHdG, COL IV, α-SMA, and MMP7, which was blocked by the PKCη inhibitor Myr (Fig. 3A, B). Intriguingly, AOPPs also increased the apoptotic rate of renal tubules in diabetic rats and the effect was abated by Myr (Fig. 3C, D). Moreover, inhibition of PKCη also restored glomerular damages in diabetic rats, as illustrated by an increased expression level of podocin and nephrin, reduced podocyte foot process effacement, and decreased glomerular basement membrane thickness (Fig. 3E, F and Supplementary Fig. S1G–J).

Taken together, these results indicate that AOPPs trigger mitochondrial injuries and tubular fibrosis in
Inhibition of PKCη attenuates AOPPs-induced mitochondrial injuries and renal fibrosis in diabetic rats
To further elucidate whether AOPPs-induced renal injuries and fibrosis depended on PKC signaling, we studied the biological effects of diabetic rats by knocking down the PKC signaling molecules. First, we found that silencing the PKCη isoform significantly decreased the expression of GRP78, caspase 3, and fibronectin. Renal fibrosis was also alleviated as illustrated by 75.1% decrease in the accumulation of collagen by the picrosirius red stain (Fig. 4A). These changes were accompanied with inactivation of PKC signaling as depicted by decreased level of pPKCη by 29.6% (Fig. 4B, C). Similarly, the expression level of molecules related to mitochondrial injuries, oxidative stress, profibrosis, and EMT was also decreased by siPKCη, whereas PKCδ silencing had no such effects (Fig. 4D–F). In addition, PKCη inhibition also destructed glomerular structures with decreased expression of podocin and nephrin by 79.7% and 73.4%, respectively (Fig. 4G, H).

Second, we examined the effects and involvement of cluster of differentiation 36 (CD36), the known receptor for AOPP, in mediating renal injuries. Silencing PKCη with siRNA significantly decreased the expression of intrarenal CD36 (Fig. 5A). Furthermore, the AOPP–CD36 colocalization was found in vacuolated renal tubules as shown by double immunohistochemical staining and the correlation analysis (Fig. 5B), suggesting the interaction between these two molecules. Concomitantly, inhibition of PKCη with siRNA decreased the number of apoptotic cells by 61.4% (Fig. 5C) and restored AOPPs-induced mitochondrial injuries (Fig. 5D).
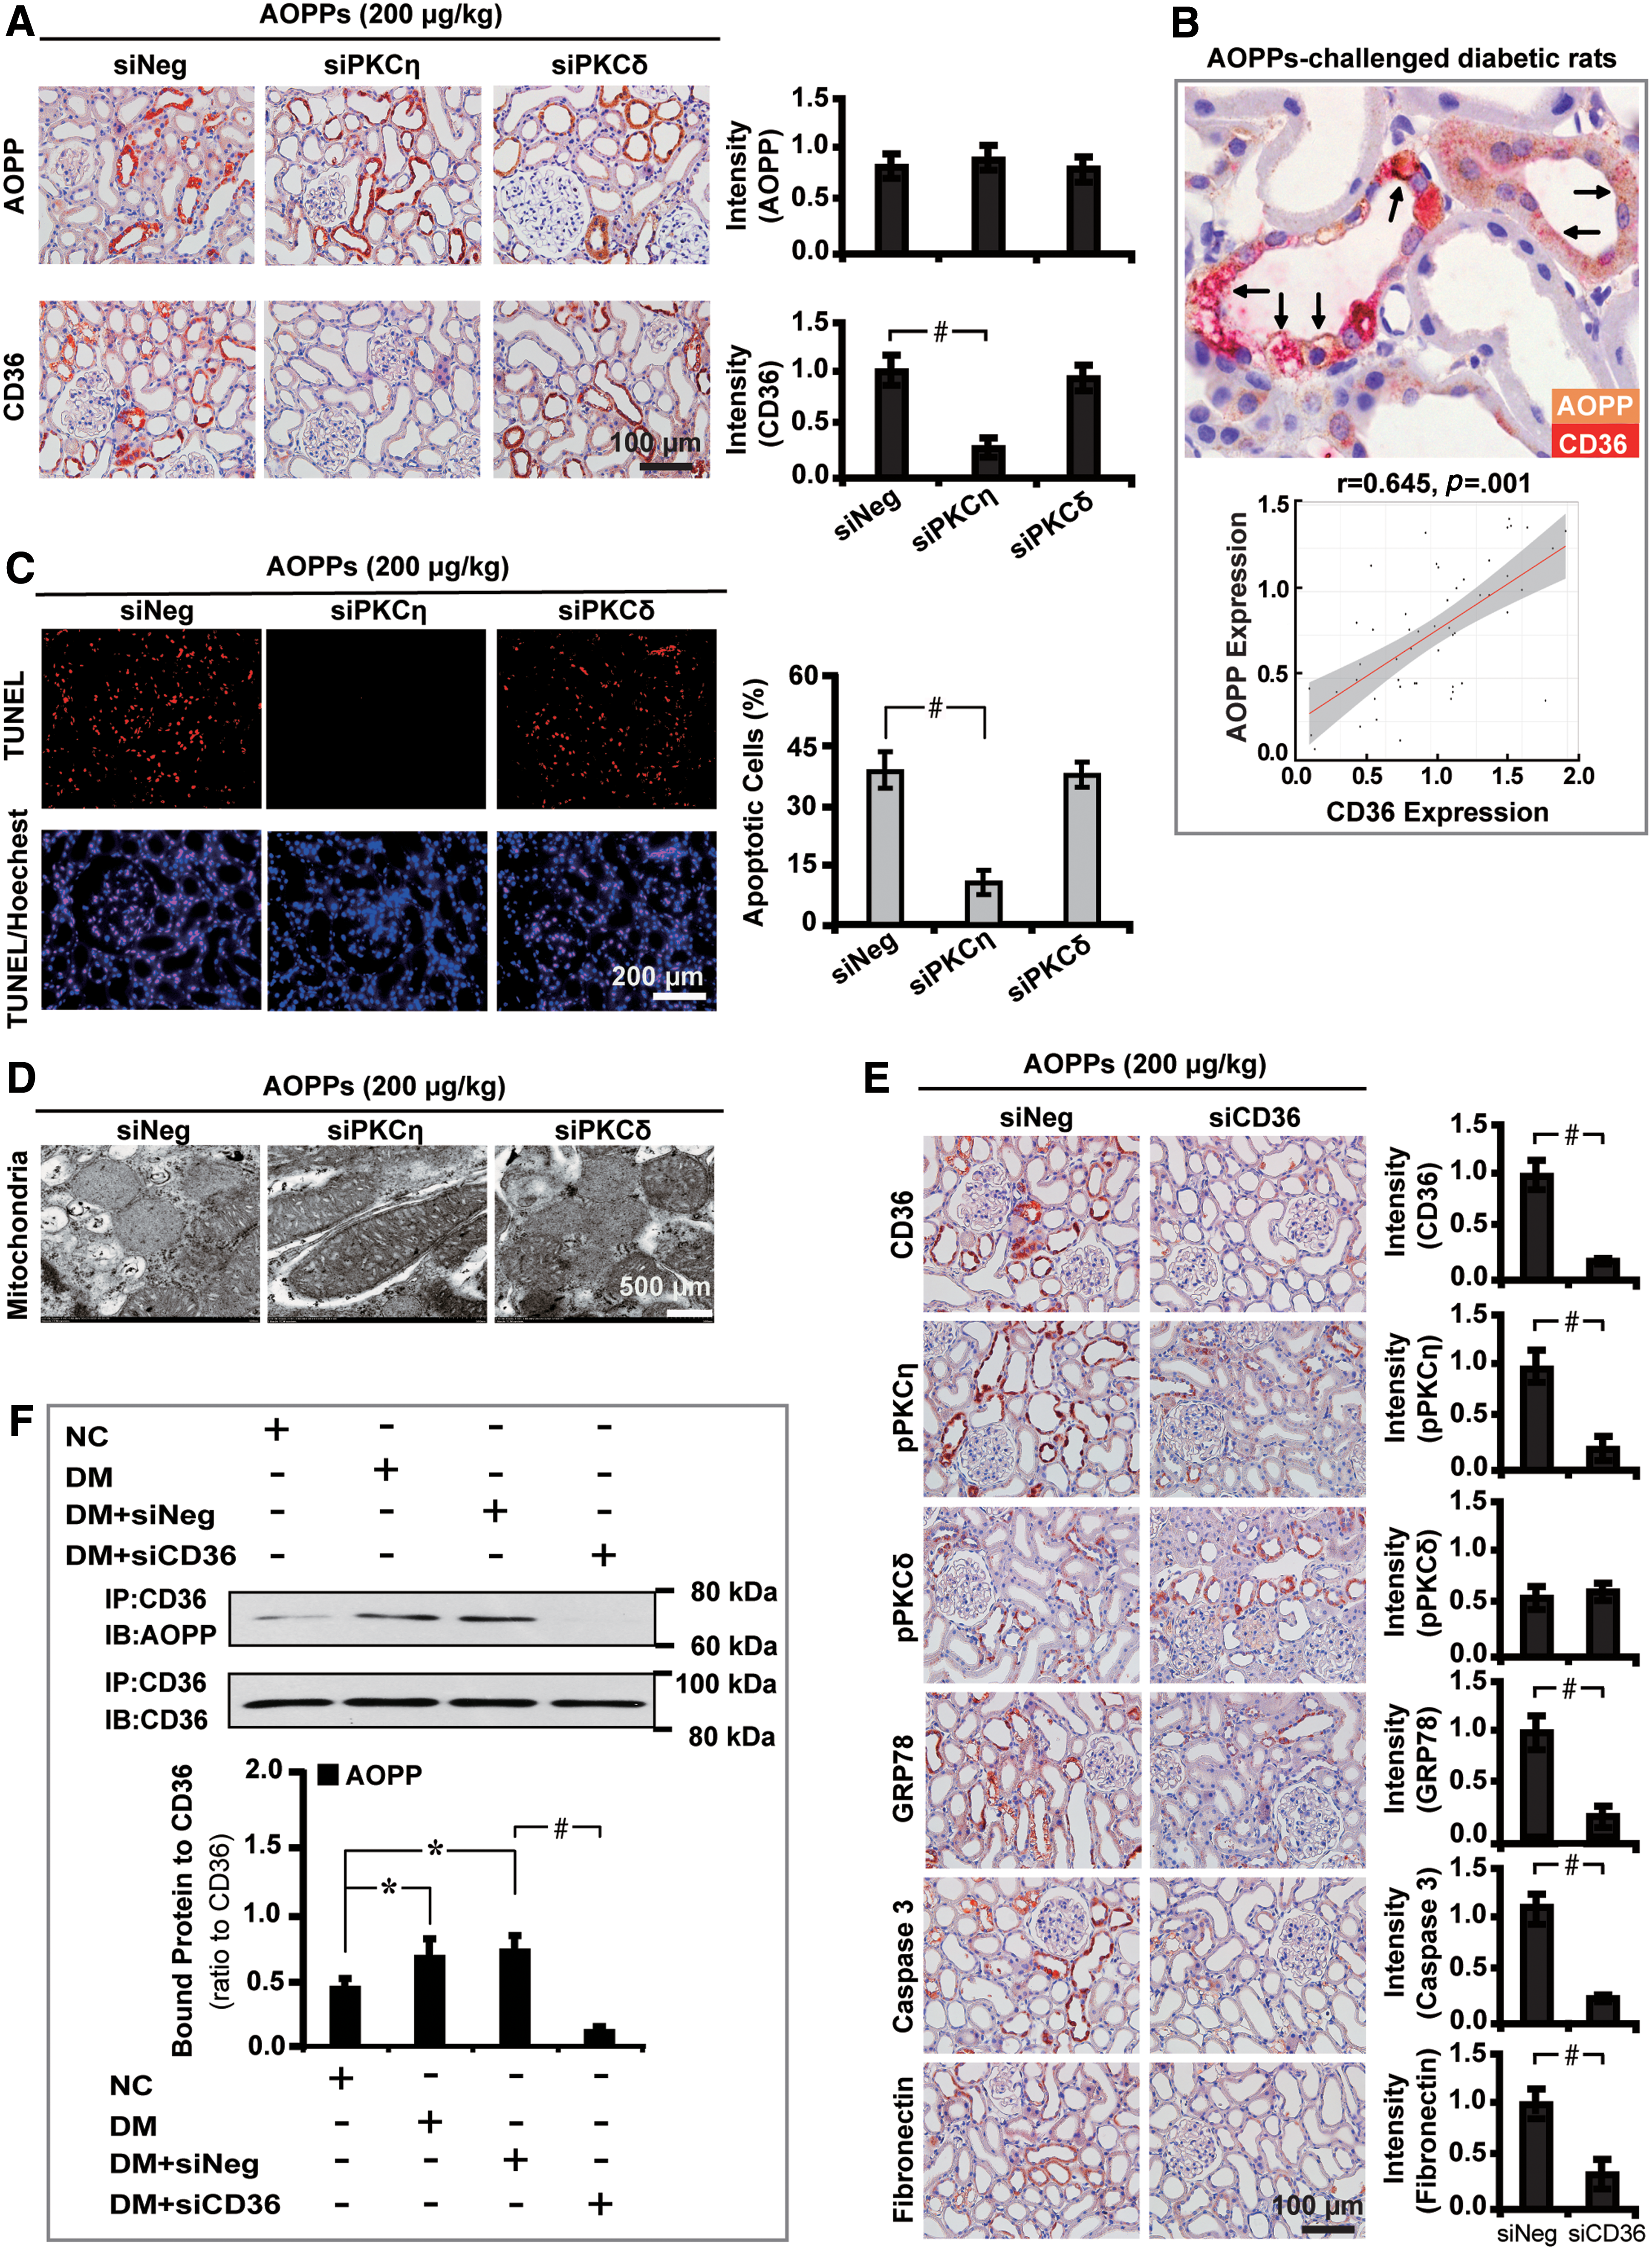
Last, we set out to decipher whether CD36 is involved in AOPPs-triggered downstream effects. To address this issue, CD36 siRNA was used to treat AOPPs-challenged diabetic rats. The results demonstrated that blockade of CD36 decreased the level of pPKCη by 74.3% and downregulated GRP78, caspase 3, and fibronectin (Fig. 5E). Furthermore, coimmunoprecipitation analysis confirmed the enhancement of AOPP–CD36 interaction in diabetic rat kidney tissues (Fig. 5F).
These findings demonstrate that CD36, the receptor for AOPP, plays a role in mediating mitochondrial injuries and renal fibrosis via activation of PKC signaling.
AOPPs promote PKC-mediated profibrosis in HG-cultured HK-2 cells
We next examined the effect of AOPPs on PKC signaling and profibrosis in vitro. AOPP–rat serum albumin (AOPP–RSA) was used to treat HK-2 cells in different conditions for 72 h. First, as shown by Western blot analysis, HG (30 mM) significantly stimulated the expression of AOPP and CD36 by 1.04- and 0.74-fold, respectively, with concomitant increased expression of genes related to oxidative stress GRP78, caspase 3, and the profibrotic marker fibronectin (Fig. 6A, B). Mannitol (MAN) (30 mM), however, had no such effects. Second, HG stimulated the expression of AOPP and related markers in a time- and dose-dependent manner as illustrated by real-time quantitative reverse transcription-polymerase chain reaction (qRT-PCR) (Supplementary Fig. S2A, B) and Western blot analyses (Fig. 6C–F). Third, we found that HG time- (Fig. 6G) and dose (Fig. 6H)-dependently caused the activation of PKC signaling with increased PKCη phosphorylation in HK-2 cells. In addition, HG stimulated the expression of EMT-related makers, α-SMA and vimentin, as detected by qRT-PCR (Supplementary Fig. S2C–G).
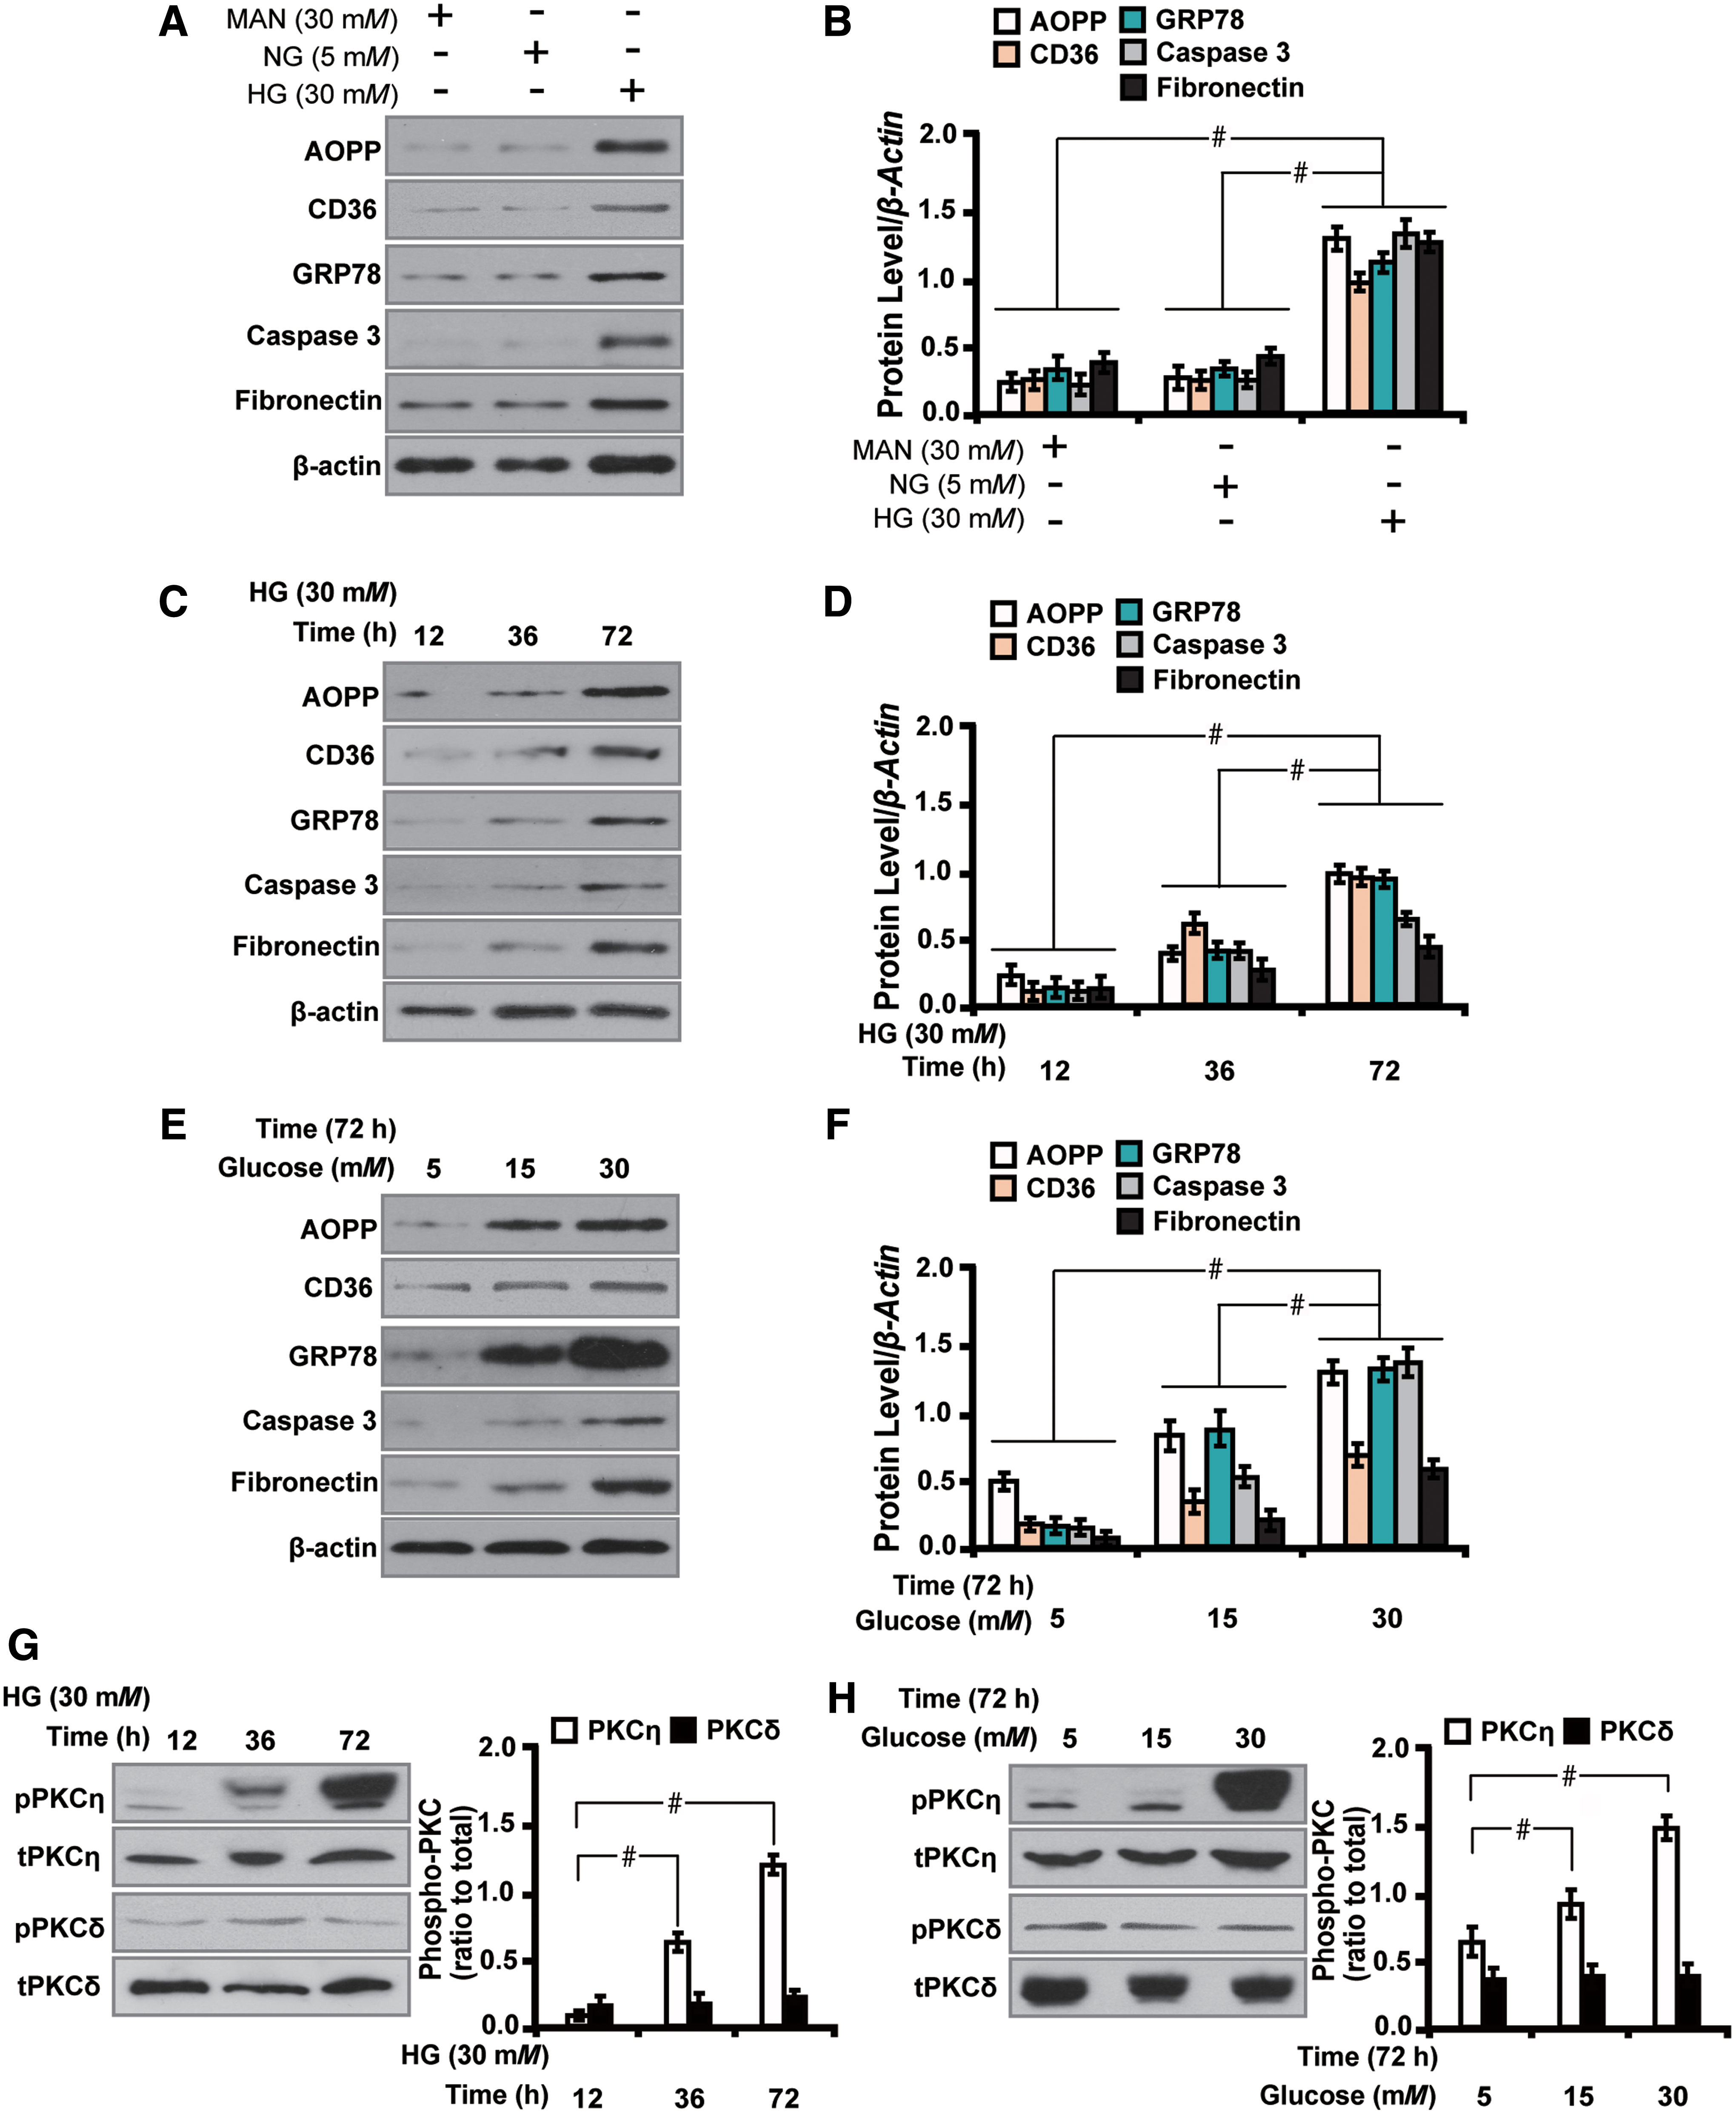
Therefore, consistent with the data observed in human renal biopsy samples and diabetic rats, AOPPs augment oxidative stress, EMT, and profibrosis via activation of PKC signaling in HG-cultured HK-2 cells in vitro.
HG is prerequisite for AOPPs-induced mitochondrial injury and apoptosis in HG-cultured HK-2 cells
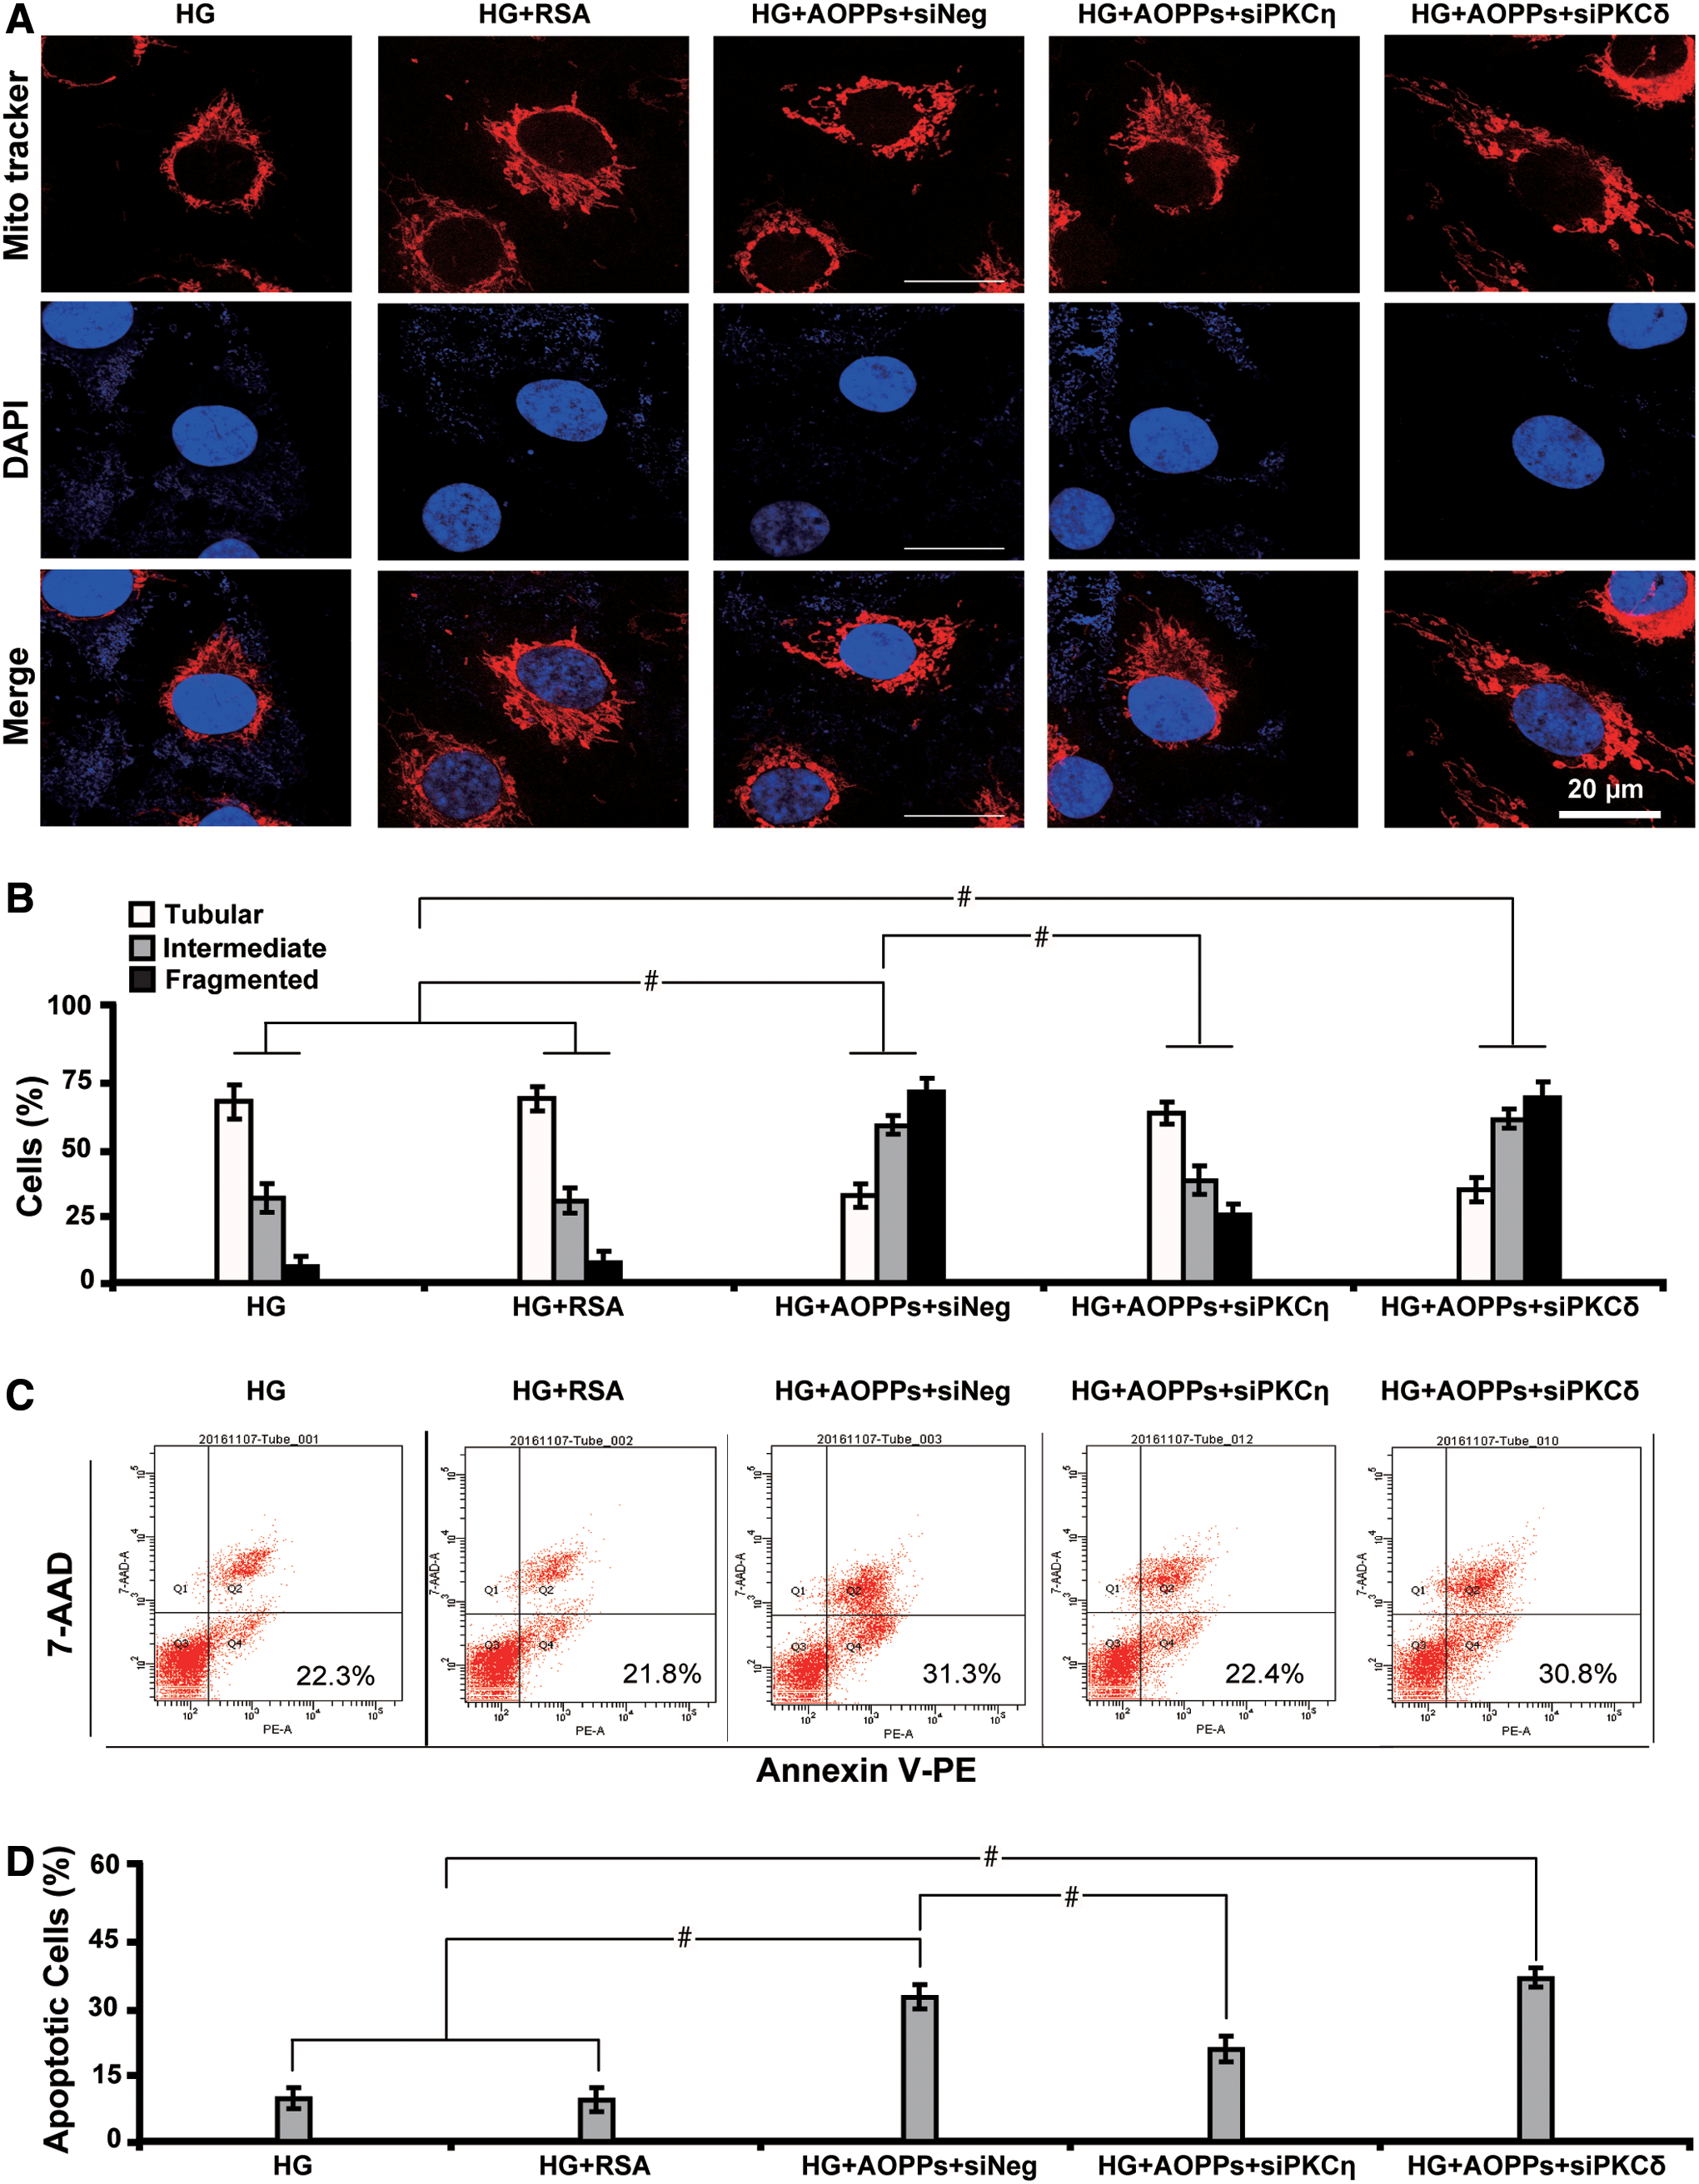
Since mitochondrial abnormalities have been shown to induce injuries in multiple cell types (35, 52) and AOPPs have been proved protein products formed during oxidative stress in diabetes, we thus hypothesized that AOPPs might cause mitochondrial injuries and trigger apoptosis in HG-cultured HK-2 cells. Herein, we found that an indicated amount of AOPP–RSA caused mitochondrial injuries as demonstrated morphologically by increased fragmented mitochondria versus tubular or intermediate mitochondria (Fig. 7A, B), detected by immunofluorescence microscopy using rosamine-based Mito-Tracker probe. In MAN or normal glucose (NG) (left panels, Fig. 7A, B), although AOPPs stimulation decreased the number of cells with tubular mitochondria, the number with fragmented mitochondria did not show significant changes as compared with controls. However, under HG condition, the effect of AOPPs was much more evident (right panels, Fig. 7A, B), with dramatically damaged mitochondrial structure and significantly increased fragmentation. Furthermore, AOPPs triggered apoptosis in HG-cultured HK-2 cells (Fig. 7C, D). These data suggest that HG is prerequisite for AOPPs-induced apoptosis possibly by triggering a series of reactions causing mitochondrial injuries in renal tubules.

AOPPs exacerbate mitochondrial injuries and profibrosis via CD36-dependent phosphorylation of PKCη in HG-cultured HK-2 cells
To decipher whether AOPPs augment oxidative stress and profibrosis via the PKC pathway, we treated HK-2 cells with several inhibitors of PKC signaling. First, with the increase of AOPPs concentration, CD36 was also dose-dependently upregulated (Fig. 8A, B) with correspondingly increased level of GRP78, caspase 3, and fibronectin (Fig. 8A, C) as detected by Western blot analysis. Intriguingly, AOPPs stimulation caused phosphorylation of PKCη in a dose-dependent manner, and no change was found in the expression of PKCδ isoform (Fig. 8D, E). Second, we further tested the pharmacologic effects of PKC inhibitors on downstream gene expressions. HG-cultured cells were treated with Gö6983, Myr, and Rottlerin. As was shown by Western blot analysis (Fig. 8F), Myr and the general PKC inhibitor Gö6983 significantly downregulated CD36 (Fig. 8G) as well as GRP78, caspase 3, and fibronectin, whereas Rottlerin had no such effects (Fig. 8H). Moreover, Myr and Gö6983 decreased the level of pPKCη by 61.1% and 54.4%, respectively, whereas Rottlerin had no effects (Fig. 8I, J).

Then we studied the morphological changes of mitochondria in response to PKC inhibition. We found that both PKCη inhibitor Myr (Fig. 9A, B) and siPKCη (Fig. 10A, B) restored AOPPs-induced mitochondrial injury and attenuated apoptosis (Figs. 9C, D and 10C, D), whereas PKCδ inhibitor Rottlerin or siPKCδ failed to exert similar effects. In addition, siPKCη caused a decrease in the level of CD36, GRP78, caspase 3, and fibronectin with inactivation of PKCη, but siPKCδ had no such effects (Fig. 11A, B). These results indicate that inactivation of PKCη alleviates AOPPs-induced mitochondrial injuries and apoptosis in HG-cultured HK-2 cells.

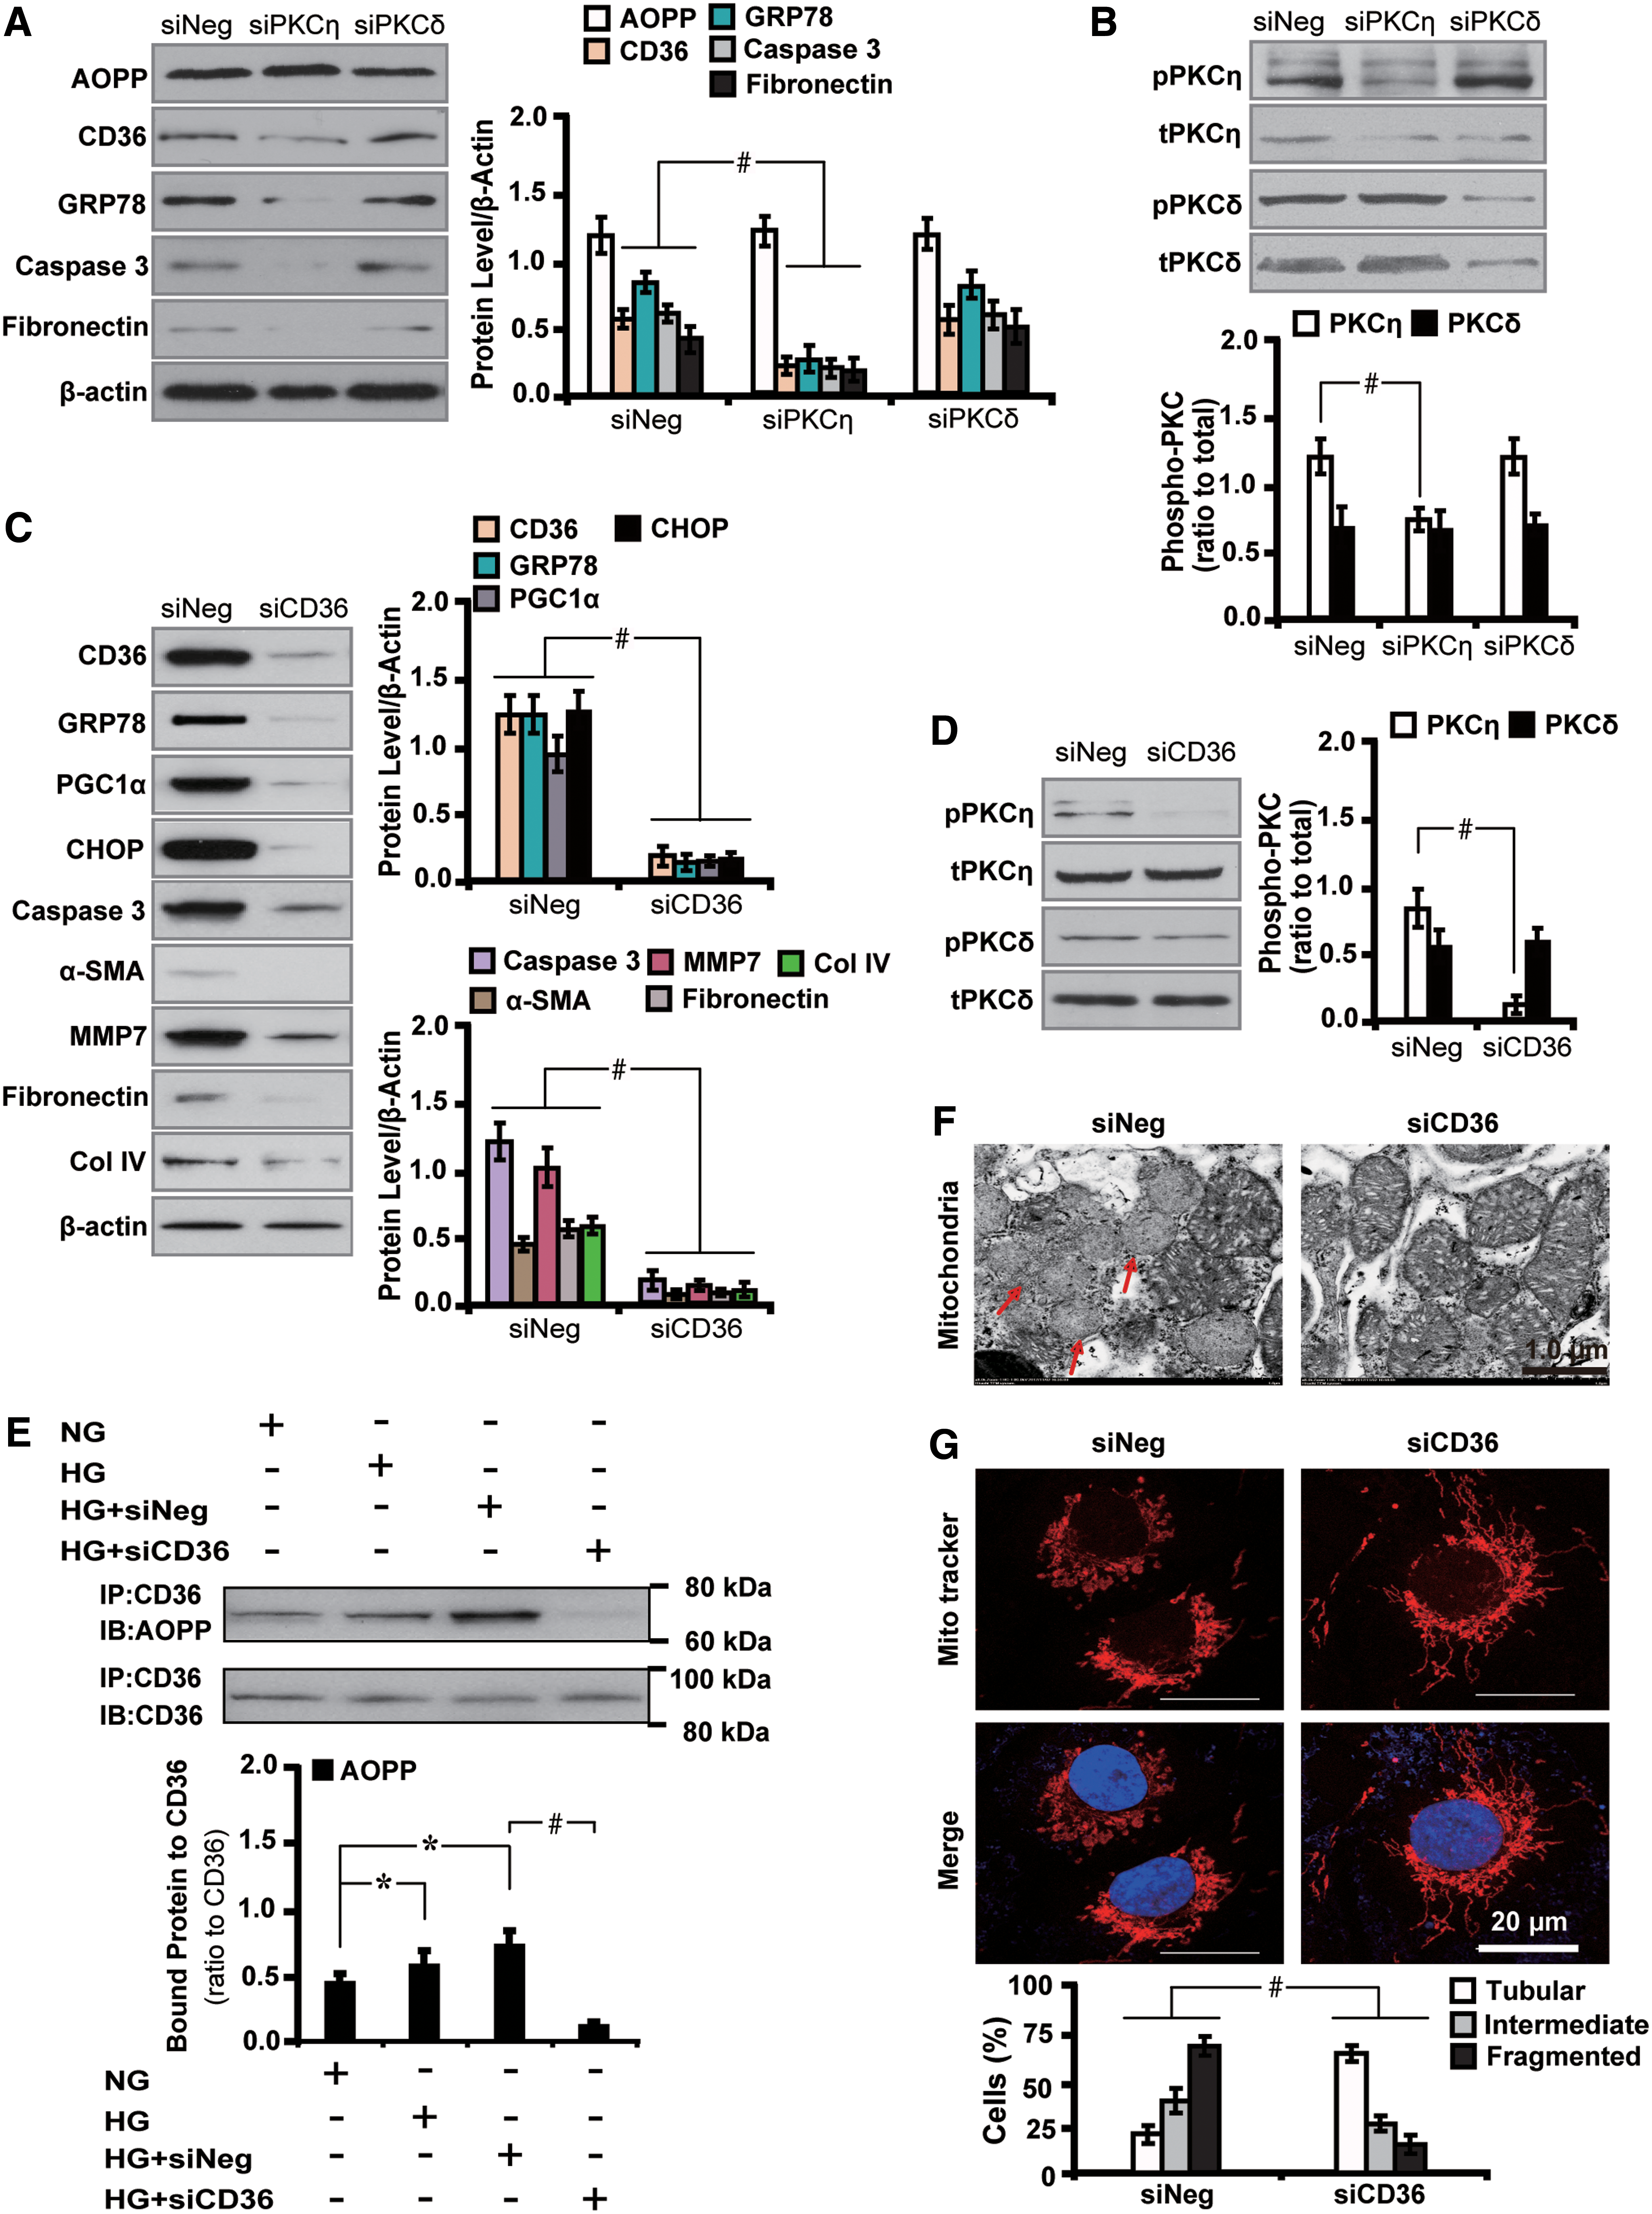
Next we set out to interrogate whether AOPPs-induced PKCη phosphorylation-mediated downstream effects depended on CD36. Notably, we found that CD36 siRNA significantly decreased the level of several molecules related to mitochondria injury (GRP78 and CHOP), oxidative stress and apoptosis (PGC1α and caspase 3), EMT (α-SMA and MMP7), and profibrosis (fibronectin and COL IV) (Fig. 11C). In addition, CD36 abolishment decreased the level of pPKCη by 82.2% (Fig. 11D). The AOPP–CD36 colocalization and interaction were further confirmed by coimmunoprecipitation analysis (Fig. 11E). Furthermore, CD36 repression improved the morphology of AOPPs-induced mitochondrial injuries (Fig. 11F) and increased the number of cells with tubular mitochondria (Fig. 11G). These results collectively suggest that AOPPs exacerbate mitochondrial injuries and profibrosis via CD36-dependent phosphorylation of PKCη in HG-cultured HK-2 cells.
Inactivation of PKC signaling ameliorates AOPPs-induced mitochondrial injuries and function in HG-cultured HK-2 cells
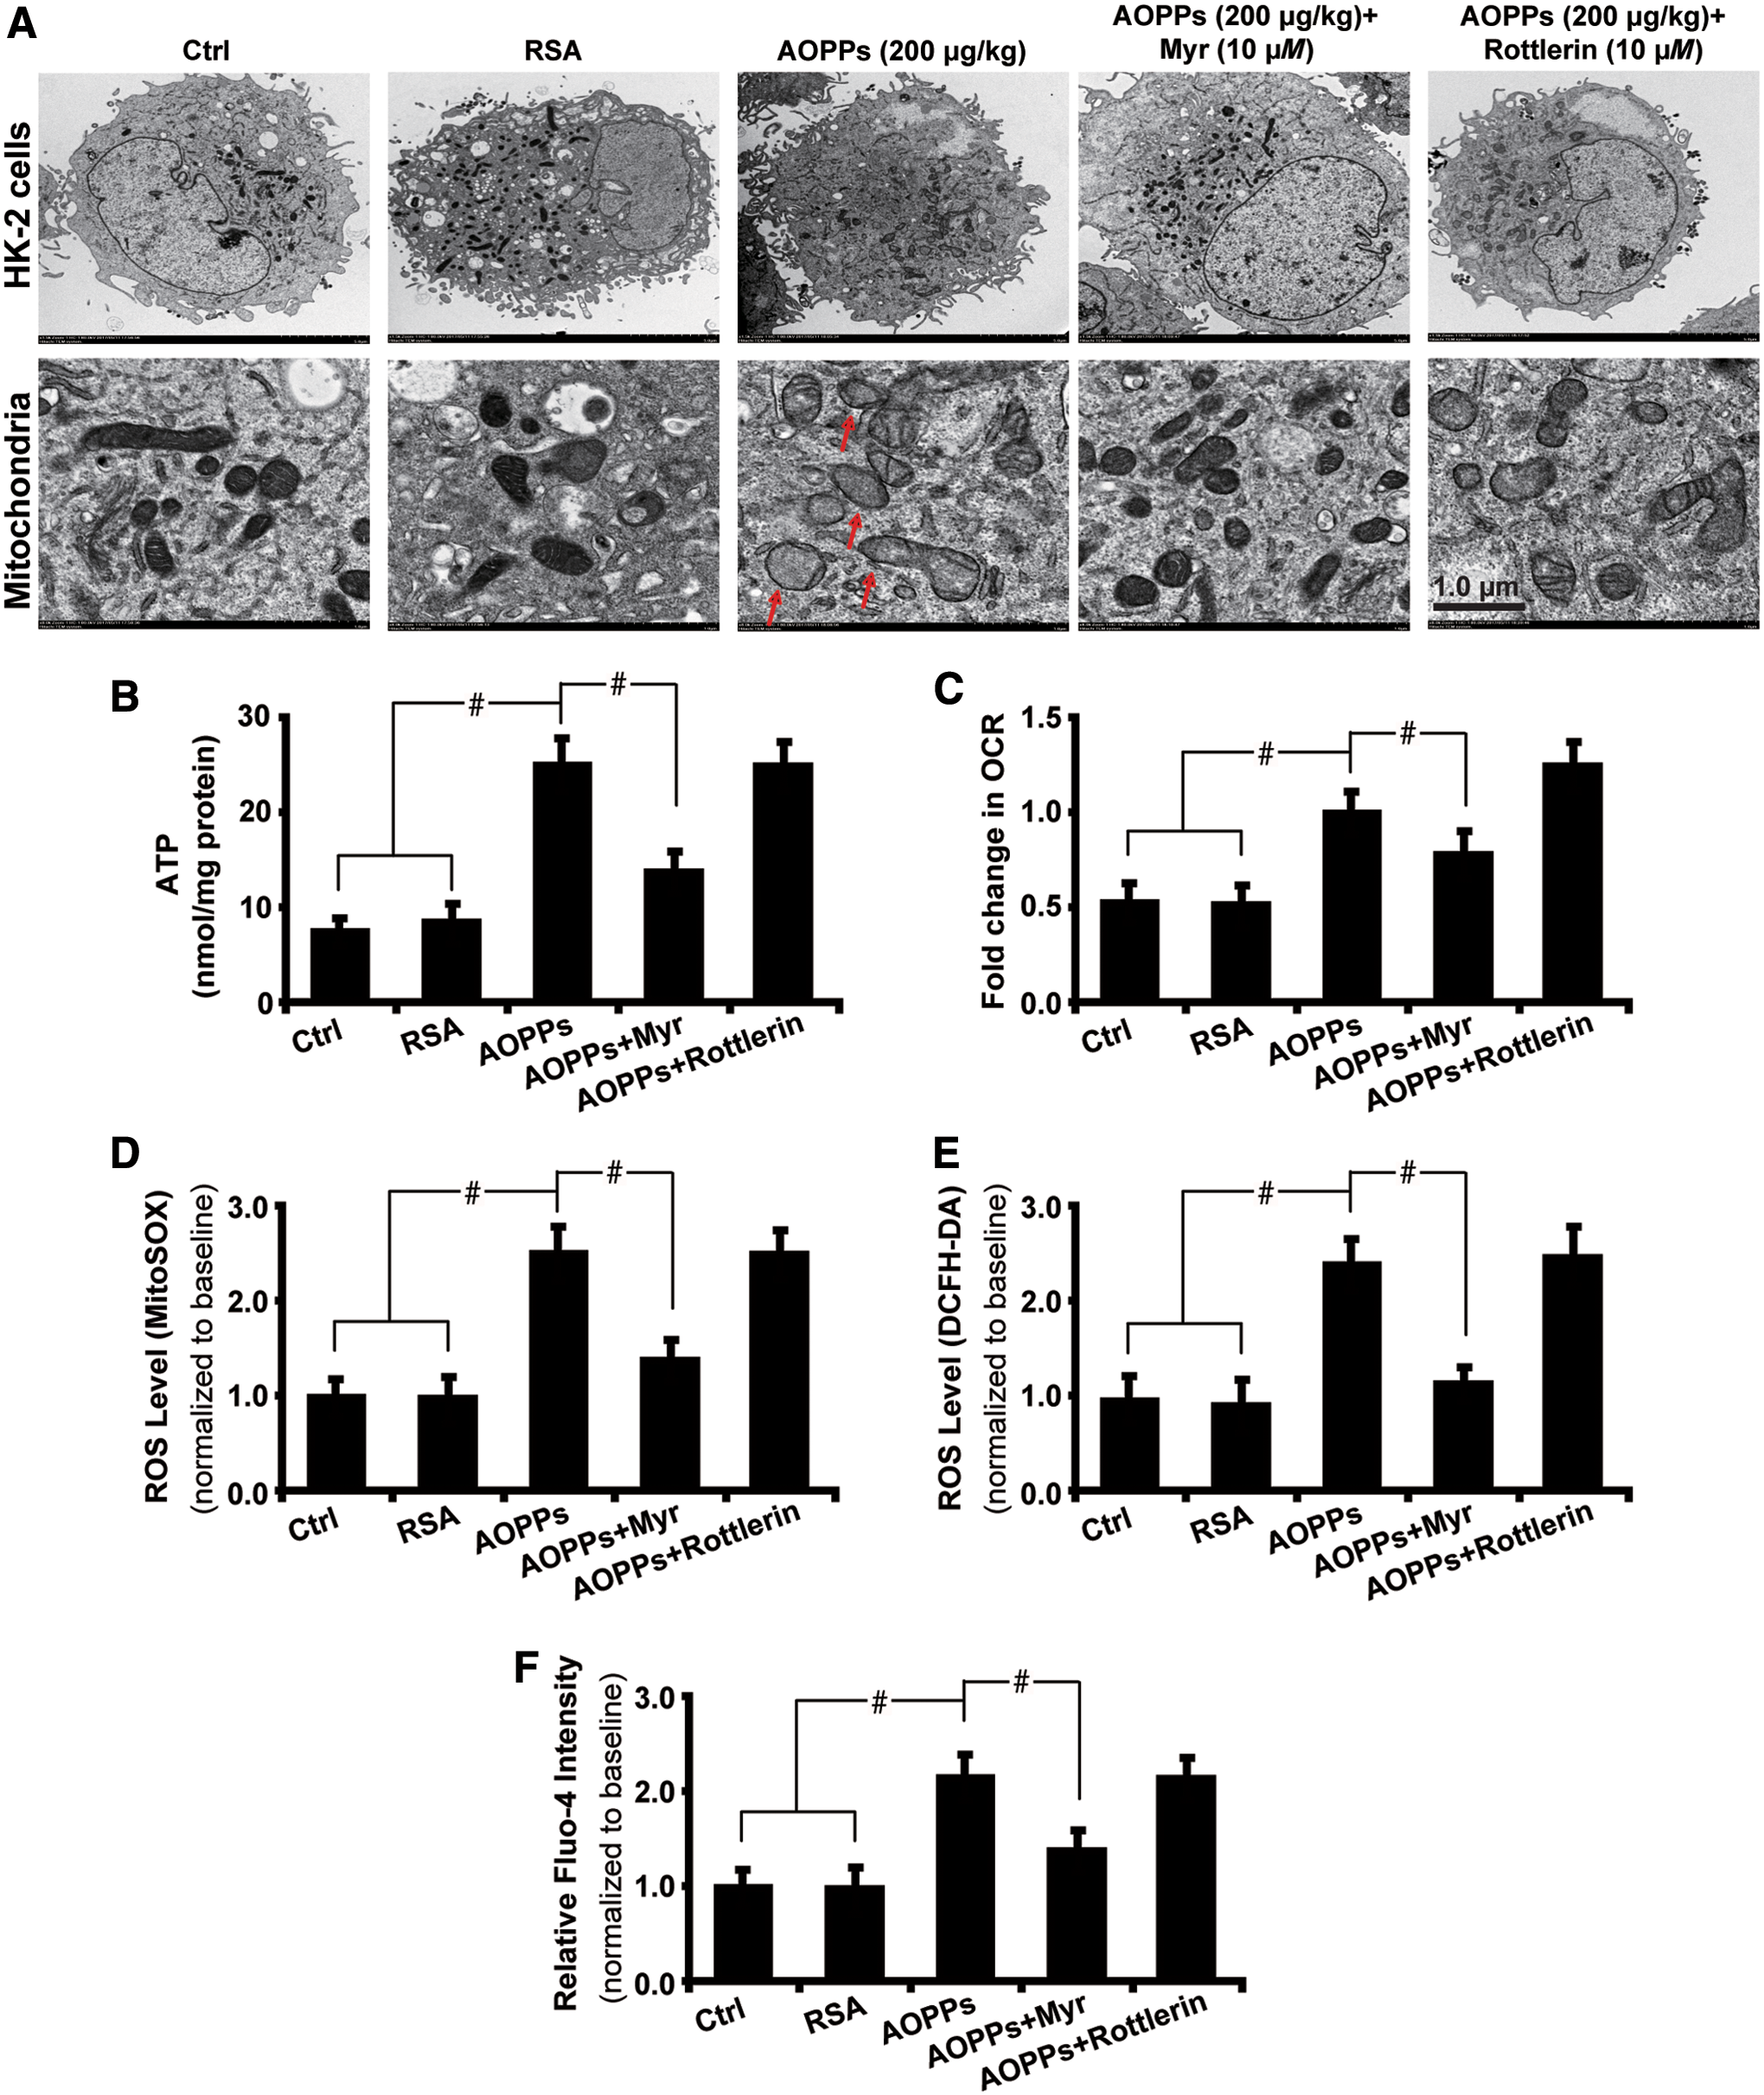
Having revealed the mechanism of AOPPs-induced mitochondrial injury and oxidative stress, we next sought to explore the effects of AOPPs accumulation on renal tubular cells in the setting of HG exposure. As shown by transmission electron microscopy (Fig. 12A), massive aggregation of fragmented and swollen mitochondria with derangement of the cristae was detected in AOPPs-treated cells with the effects being attenuated by PKCη inhibitor Myr. Next, AOPPs increased the susceptibility of HK-2 cells to mitochondrial injuries, resulting in significant generation of adenosine triphosphate (ATP) (Fig. 12B), increased oxygen consumption rate (OCR) (Fig. 12C), elevated ROS production as examined by mitoSOX (Fig. 12D), and dichlorodihydrofluorescein diacetate (DCFH-DA) assays (Fig. 12E). Membrane potential was damaged as evaluated by the increased intracellular calcium level with Fluo-4 flow cytometry analysis (Fig. 12F). These data illustrate that inhibition of PKCη could reverse AOPPs-induced mitochondrial injuries and hence improve mitochondrial function in vitro.
Discussion
Recent studies have characterized the role of AOPPs in podocytes (53), pancreatic β cells (19), and intestinal epithelial cells (50). AOPPs accumulation has been implicated to activate specific PKC isoforms, which play a significant role in diverse disorders, including CKD (45), metabolic syndrome (33), and obesity (8). However, the effects of AOPPs on mitochondrial dysfunction and resultant injuries to renal tubular cells and fibrosis have not yet been determined. In this study, we identified PKCη as a critical mediator of AOPPs-triggered mitochondrial dysfunction, oxidative stress, and TIF in
Our data also demonstrated that in renal biopsy samples of DN, intrarenal AOPP expression in TECs was increased with concomitant upregulation of pPKCη, pPKCδ, GRP78, caspase 3, and fibronectin. Concurrently, renal fibrosis was worsened as illustrated by increased collagen deposition with Sirius red stain. Similar results were found in kidney tissues of AOPPs-challenged diabetic rats. Furthermore, the level of AOPP and pPKCη was, respectively, correlated positively with Scr and urinary NAG, but negatively with eGFR in DN patients. These results suggest that in DN, AOPPs-induced PKC signaling activation confers unfavorable renal function and may serve as alternative approaches to reflect the severity of renal TIF.
Multiple stimuli could activate PKC signaling in diabetes, including hyperglycemia, elevation of free fatty acids, AGE products, oxidants, inflammation, and cytokines such as angiotensin II (15, 40, 41). AOPPs have been found to activate nicotinamide adenine dinucleotide phosphate (NADPH) oxidase through the PKC-dependent pathway, causing an excessive generation of intracellular superoxide in various renal cells, including the podocyte, endothelial cells, mesangial cells, and TECs (13, 48). In addition to kidney cells, AOPPs have also been found to trigger EMT in intestinal epithelial cells in Crohn's disease through PKCδ-mediated redox-dependent signaling (50). We found in this study that AOPPs accumulation induces the expression of EMT and profibrotic markers, hence contributing to the progression of TIF. Further studies are still needed to investigate whether AOPPs induce myofibroblast formation
This study is unique in that it demonstrates that elevation of AOPP expression in renal tubules of diabetic rats and DN patients is accompanied by phosphorylation of PKCη, confirming the intrinsic interaction between AOPP and PKC signaling. Moreover, we identified the receptor CD36 for AOPP in mediating these events, consistent with the previous study showing AOPPs as a strong trigger of intrarenal renin angiotensin system via a CD36-mediated, redox-dependent pathway (5). This study further highlights the receptor pathway of AOPP in mediating oxidative stress and renal fibrosis in DN. Noteworthy, we have shown that pPKCη–GRP78 colocalization is absent in intact renal TECs, whereas in injured tubules, enhanced pPKCη–GRP78 colocalization was detected. These data suggest that PKC signaling might be involved in protein/lipid synthesis in hyperglycemic condition and mediates AOPPs-induced renal tubule injuries in DN. Whether prolonged and chronic exposure to hyperglycemia in diabetes may result in deregulation of other pathways is unknown and warrants further exploration.
The finding that exogenous AOPPs overload could, to some extent, mimic the innate AOPPs accumulation during the progression of diabetes provides novel and mechanistic insights into how the resultant effect caused by AOPPs, for example, oxidative stress and renal fibrosis in diabetes might be reversed by blocking the downstream PKC signaling, either directly or indirectly. Thus, blockade of the PKCη has great therapeutic potential in the treatment of diabetes.
Materials and Methods
Antibodies and reagents
Antibodies to CD36 (ab80080), PKCη (ab172925), PKCη (phospho T655, pPKCη) (ab5798), PKCδ (ab182126), PKCδ (phospho S299, pPKCδ) (ab133456), GRP78 (ab21685), caspase 3 (ab13586), fibronectin (ab2413), PGC1α (ab54481), CHOP (ab11419), COL IV (ab6586), MMP7 (ab176325), 8OHdG (ab10802), α-SMA (ab5694), NPHS2 (ab50339), nephrin (ab58968), and β-actin (ab8226) were purchased from Abcam (Cambridge, MA). The general PKC inhibitor Gö6983 and PKCη pseudosubstrate inhibitor myristoylated-calbiochem were purchased from Millipore (Merck Millipore, Germany). The selective inhibitor of PKCδ Rottlerin, RSA, and streptozotocin and pentobarbital sodium (P3761) were from Sigma-Aldrich (St. Louis, MO). Small inferring RNA (siRNA) for PKCη (siPKCη), PKCδ (siPKCδ), and nontargeting siRNA (siNeg) was from Santa Cruz Biotechnology (Santa Cruz, CA).
Patients and renal biopsy studies
A total of 33 renal biopsy samples were obtained from type 2 diabetic patients including 10 from the first affiliated hospital of Inner Mongolia Medical University (Hohhot, China) and 23 from the King Medical Diagnostics Center (Guangzhou, China) from 2010 to 2016. The inclusion criteria were (i) type 2 diabetic patients with no history of using renal toxic or herbal medicine, (ii) the indications for performing the renal biopsy were proteinuria with or without microscopic hematuria and fast drop in renal function, and (iii) diabetic patients with no complications of other renal diseases. The antihypertensive medications these patients have been receiving mainly comprise angiotensin-converting enzyme inhibitors, angiotensin receptor blockers, and calcium channel blockers.
The morphological diagnosis of DN was confirmed by two individual renal pathologists (J.G. and X.B.). Renal biopsy tissues from subjects with thin basement membrane nephropathy (n = 10) were used as controls. Biological parameters including Scr, BUN, blood glucose, eGFR, systolic blood pressure, diastolic blood pressure, and 24 h proteinuria were analyzed. The Ethics Committee from Inner Mongolia Medical University (2016013, 2017010) and the Kingmed Diagnostic Center (20150316-P) specifically approved the use of patient tissue samples in this study and written informed consent was obtained from each patient.
Preparation of AOPPs–RSA
RSA (Sigma Chemical, St. Louis, MO) was incubated with hypochlorous acid (Fluke, Buchs, Switzerland) to prepare AOPPs–RSA in vitro. Free amino acid/carbohydrates/lipids were eliminated to exclude the formation of AGEs-like structures. Free hypochlorous acid and contaminated endotoxin were removed from prepared samples by being dialyzed against phosphate-buffered saline (PBS) through a DetoxiGel column (Pierce, Rockford, IL). Endotoxin levels in the preparation were determined with the amebocyte lysate assay kit (Sigma) and were found to be <0.025 EU/mL. The components of AGE products were undetectable in the samples as previously described (13).
In this study, AOPP–RSA preparation was carried out in vitro as follows. First, RSA (80 mg/mL; Sigma Chemical) was first exposed to hypochlorous acid (HOCL; Fluke) for 30 min at room temperature. Second, any free HOCL was removed by an overnight dialysis against PBS (pH = 7.4) and free amino acid/carbohydrates/lipids were eliminated to exclude the formation of AGE-like structures. Then, the samples were passed through a DetoxiGel column (Pierce) to remove any contaminated endotoxin so as to ensure its level <0.025 EU/mL tested by the amebocyte lysate assay kit (Sigma). Next, the absorbance at 340 nm of the mixture with 200 μL of prepared sample or chloramine-T (standard curve; Sigma) and 20 μL of acetic acid was immediately read in a 96-well microplate reader (Wallac 1420; PerkinElmer, Turku, Finland). The content of AOPPs in the AOPP–RSA preparation in our study was 5.07 ± 0.4 versus 0.4 ± 0.02 nmol/mg protein in unmodified RSA. The AGE product components were undetectable in the samples. Although AOPPs used in the study were prepared in vitro by exposure of albumin to high concentration of HOCl, our previous study has demonstrated that the biological effect of the AOPPs prepared by this method is similar to that isolated from the patients (18).
Preparation of AOPPs monoclonal antibody
Monoclonal antibody against AOPPs (Clone 3F2) was generated as described previously (9, 21). In brief, the ascites were purified by affinity chromatography using HiTrap protein G Hp (GE Healthcare Bioscience, Piscataway, NJ). The mouse antibody (mAb) isotypes were determined using a Monoclonal Antibody Isotype Kit (Pierce).
Animal studies
Male Sprague Dawley rats (6–8 weeks of age) were kept in the Animal Center of Nanfang Hospital according to the policy of the Committee for Animal Usage. Streptozotocin (65 mg/kg) was intraperitoneally injected to induce diabetes according to the protocol described previously (42, 54). AOPPs (200 μg/kg) were injected peritoneally to rats every day 1 week after the induction of diabetes. Dimethyl sulfoxide (DMSO, 0.05%) and RSA (200 μg/kg) were included as controls. To investigate the effect of inhibiting PKC signaling on mitochondrial injuries and renal fibrosis, 50 nM of Gö6983, myr, Rottlerin, and 4 μg/g of siPKCη, siPKCδ, and siNeg were used to treat diabetic rats intraperitoneally once every 2 days, respectively, until the animals were sacrificed. The Animal Ethics Committee at Nanfang Hospital, Southern Medical University (Guangzhou, China) specifically approved the study protocol according to the Guide for the Care and Use of Laboratory Animals published by the U.S. National Institutes of Health (NIH Publication No. 85-23, revised 1996).
Seven groups with six to seven animals each were studied: diabetic rats were treated with DMSO, RSA, AOPPs, AOPPs+Myr, AOPPs+Rottlerin, AOPPs+siPKCη, and AOPPs+siPKCδ, respectively. Rats were kept in metabolic cages and urine was collected for analysis of UAER and UACR. Blood glucose level was measured every week. The treatment continued after the streptozotocin injection until the rats were euthanized at 12 weeks. Blood was drawn from the orbit vein and plasma samples were prepared for analyzing Scr, BUN, and glucose level using a Beckman Coulter AU480 Chemistry Analyzer (Beckman, CA). A creatinine assay kit (ab65340; Abcam) was used to determine serum creatinine. An enzyme-linked immunosorbent assay (ELISA) kit specific for rat albumin (E111-125; Bethyl Laboratories, Montgomery, TX) was used to determine urine albumin. Ccr was calculated as urinary creatinine (μM) × urine volume (mL/min)/serum creatinine (μM), and was expressed as mL/(min·kg).
At 12 weeks after the induction of diabetes, rats were anesthetized with pentobarbital sodium (30 mg/kg). Left kidneys were harvested and fixed in 10% formalin in PBS for 24 h and embedded in paraffin for histological and immuhistochemical analyses. The right kidney was snap-frozen and stored at −80°C for further analysis. The level of AOPPs in plasma and tissue homogenates was analyzed by ELISA using the antibody to AOPP.
Cell culture studies
Human renal proximal TECs (HK-2; American Type Culture Collection, Rockville, MD) were cultured in NG for 1 week, supplemented with Dulbecco's Modified Eagle's medium/F-12 containing 10% fetal bovine serum (FBS), penicillin (200 U/mL), and streptomycin (200 μg/mL) (Gibco BRL, Grand Island, NY). HK-2 cells were grown to 80%–90% confluence and made quiescent by incubation overnight in a serum-free medium before experimentation.
Cells were then cultured in NG (5 mM), MAN (30 mM), or HG (30 mM) according to each experiment. HG-cultured HK-2 cells were treated with AOPPs at indicated times and concentrations.
Transfection of siRNAs and drug treatment
Exponential growth phase HK-2 cells were plated in six-well plates at a density of 0.5 × 10⁵ cells/mL and cultured for 24 h before experimentation. Expression of murine genes was knocked down with siRNA oligonucleotides using Lipofectamine RNAiMAX (Invitrogen, Carlsbad, CA). Cells were transfected with 1 μg of siRNA in reduced serum medium (OPTI-MEM-I; Invitrogen, Carlsbad, CA) and then harvested for further study after 48 h of transfection according to the manufacturer's protocol. Gö6983, Myr, and Rottlerin were used to treat cells for 72 h and then harvested for further analyses. Total RNA and protein were extracted, respectively, and used for transgene expression analysis.
Mitochondrial morphology and function studies
Mitochondrial fragmentation studies
Mitochondrial morphology was observed by incubating HK-2 cells with rosamine-based MitoTracker probe (Invitrogen, Cambridge, MA) at 100 nM for 30 min. Cells were then washed with PBS and fixed with 3.7% formaldehyde in growth medium after incubation. Mitochondrial fragmentation was quantified according to a protocol described previously (7, 36). In brief, mitochondrial morphology in each cell was evaluated by an investigator blinded to the experimental procedure. The following criteria were used: tubular (>75% of mitochondria with tubular length >5 mm), intermediate (25%–75% of mitochondria with tubular length >5 mm), or fragmented (<25% of mitochondria with tubular length >5 mm). The categorization of mitochondrial morphology was evaluated and analyzed in each cell.
ATP quantification assay
ATP levels were examined in cells with or without treatment using a luciferase-based ATP Determination Kit (Invitrogen, Cambridge, MA) according to the manufacturer's protocol. In brief, HK-2 cells were grown to 70%–80% confluence in a 24-well plate. Cells were then washed with PBS and treated with ATP-releasing agent (Sigma-Aldrich, St. Louis, MO). ATP levels were determined in 10 μL of cells in the ATP-releasing agent and the remainder was used to quantify protein levels using a Pierce BCA Protein Assay Kit (Thermo Fisher Scientific, Waltham, MA) with bovine serum albumin as a standard.
Oxygen consumption rate
The phosphorescent oxygen-sensing probe MitoXpress (Cayman Chemical, MI) was used to measure extracellular oxygen consumption as previously described (22). In brief, HK-2 cells were first treated with serum-free medium containing either control or AOPPs. Then, mineral oil was used to prevent the loss of extracellular oxygen. Next, fluorescence was measured with 380 nm excitation every 3 min for a 3-h period. The slope of the curve represented the rate of oxygen consumption (μs/h). The relative change in OCR over control cells was recorded and presented.
Measurement of intracellular ROS and membrane potential
Cells were incubated with 10 μM of DCFH-DA at 37°C for 15 min. Intracellular ROS level or membrane potential was determined by measuring 10,000 events per sample by flow cytometer (FACS Calibur; BD Biosciences, San Jose, CA) with a 488-nm excitation laser. Membrane potential was evaluated by examining the intracellular Ca2+ concentration using a Ca2+ indicator, Fluo-4 AM (Thermo Fisher Scientific). In brief, cells were grown in a 96-well microplate and incubated with 4 mM Fluo-4 AM at 37°C for 50 min. Cells were then washed twice with Fluo-4 AM-free HBS medium before analysis. Fluo-4 was excited at 494 nm and fluorescence was measured at 516 nm. The Ca2+ concentration was used to evaluate the membrane potential of cells, expressed as a ratio value of the fluorescence intensity divided by the baseline average fluorescence intensity. Flow cytometry data were analyzed using CellQuest Pro software (BD Biosciences, Franklin Lakes, NJ).
Apoptosis assay using flow cytometry
HK-2 cells in different groups (AOPPs-treated, drug-treated, siRNAs-transfected, and corresponding controls) were harvested after 72 h and used for apoptosis analysis. Annexin V-PE/7-AAD apoptosis kit (BD Biosciences, Franklin Lakes, NJ) was used to evaluate apoptosis and the percentage of apoptotic cells was examined. An FAC Scan flow cytometer (BD Biosciences, Franklin Lakes, NJ) with Cell Quest software was used for data acquisition and analysis. Viable, dead, early apoptotic, or late apoptotic cells were identified and the results were analyzed with the ModFit 3.0 software (Verity Software House, Topsham, ME).
TUNEL assay
HK-2 cells and renal tissues were fixed with 4% paraformaldehyde and detected using terminal deoxynucleotidyl transferase dUTP nick end labeling (TUNEL) assay with an Apoptag Peroxidase in situ Apoptosis Detection kit (Chemicon International, Temecula, CA) as described previously (28). The nuclei were counterstained with 4, 6-diamidino-2-phenylindole (DAPI; Sigma-Aldrich, St. Louis, MO).
Semiquantitative real-time reverse transcription-PCR analysis
Total RNA from cells was extracted using TRIzol reagent (MRC, Cincinnati, OH) and first-strand cDNA was synthesized using 2 μg of total RNA according to the manufacturer's instructions. Semiquantitative real-time RT-PCR analysis was performed in triplicate with Power PCR SYBR Green Master Mix (Applied Biosystems, Carlsbad, CA) using the ABI PRISM 7500 FAST Real-Time PCR System (Applied Biosystems). The ΔΔCT method was used to calculate relative expression and the results were normalized to β-actin expression. Primer sequences used in RT-PCR are shown in Table 3 and Supplementary Table S1.
Primer Sets Used in Real-Time Reverse Transcription-Polymerase Chain Reaction
PKC, protein kinase C.
Immunoblot analyses and immunoprecipitation
Cell lysates were separated in parallel on two 10% denaturing sodium dodecyl sulfate-polyacrylamide gels and probed with anti-AOPP, anti-CD36, anti-PKCη, anti-pPKCη, anti-PKCδ, anti-pPKCδ, anti-GRP78, anticaspase 3, antifibronectin, anti-PGC1α, anti-CHOP, anti-COL IV, anti-MMP7, anti-α-SMA, anti-NPHS2, antinephrin, and anti-β-actin for 16 h at 4°C overnight. The secondary antibody (horseradish peroxidase-labeled IgG antirabbit/mouse antibody; Invitrogen, Cambridge, MA) was used at 1:3000 dilution for 1 h after thorough washing in tris-buffered saline Tween 20 buffer. The supersignal-enhanced chemoluminescent substrate (Pierce Biotechnology, Inc., Rockford, IL) was applied to the probed membrane and exposed before the protein bands were observed on radiograph films (Super Rx; Fuji Photo Film, Tokyo). Quantification was performed by measuring the intensity of the bands using Image J analysis software (Image J 1.44; National Institute of Health).
Immunofluorescence and immunohistochemical analysis
HK-2 cells as well as tissue samples from patients and rats were labeled with primary antibodies. For immunofluorescence staining, Alexa Fluor 594-conjugated goat antimouse IgG and Alexa Fluor 488-conjugated goat antirabbit IgG (1:1000; Invitrogen, Cambridge, MA) were used for secondary antibodies, nuclei were counterstained with DAPI and coverslipped with aqueous mounting medium (CTS011; BD Bioscience, Minneapolis, MN). For immunohistochemistry EnVision™ Detection Systems, peroxidase/diaminobenzidine, Rabbit/Mouse kit (K4065; Dako, Carpinteria, CA), was used. Nuclei were counterstained with hematoxylin and coverslipped with Permount mounting medium (00-4960-56; eBioscience, San Diego, CA).
Samples were evaluated semiquantitatively by systematically selecting without bias 20 fields for analysis. Images were taken with a BX51 light microscope (Olympus, Tokyo) with appropriate filters. Staining intensity was measured with Image J analysis software. PBS instead of primary antibodies served as a negative control.
Renal fibrosis evaluation
Formalin-fixed paraffin-embedded kidney tissues from rats and patients were cut into 5 μm-thick sections and stained with Picric acid-Sirius red or MTS. The degree of fibrosis was evaluated in eight representative fields (magnification 40 × ) fitted with an Olympus digital camera (BX51; Olympus). TIF was semiquantitatively evaluated by calculating the ratio between the Sirius red-positive surfaces or the blue-stained areas in MTS sections and the total section area examined (Image J 1.44, National Institute of Health).
Transmission electron microscopy
HK-2 cells in different groups were made into cell blocks and mitochondrial morphology was observed using a Hitachi 7700 transmission electron microscope (Tokyo, Japan). For kidney tissues from rats, several 1-mm cubes from cortex of kidneys were processed as previously described (3). Representative micrographs were examined and imaged.
Statistical analysis
Data are presented as mean ± standard deviation values. Independent samples t-test and one-way ANOVA followed by Student–Newman–Keuls post hoc test was used to test statistical significance between groups. Pearson correlation analysis was used to analyze the expression levels of AOPP and PKCη in correlation with patients' biological parameters, as well as the expression level of AOPP/CD36 and pPKCη/GRP78. All statistical tests were performed using SPSS 12.0 (SPSS, Inc., Chicago, IL). The significance level is set at p < 0.05 to indicate statistical significance.
Footnotes
Acknowledgments
This study was supported by National Nature and Science Young Investigator Grant (no. 81100496) from the National Natural Science Foundation of China, Special Fund from Chinese Society of Nephrology (no. 13030370422), Guangdong Natural Science Foundation (no. 2016A030313581), Guangzhou Science and Technology Planning Project-Key Projects of Scientific Research (201607020019), Outstanding Youths Development Scheme of Nanfang Hospital, Southern Medical University (no. 2015J009) to X.B., President Foundation of Nanfang Hospital, Southern Medical University to X.B. (no. 2017Z001) and X.L. (no. 2017B002), and Guangdong Science and Technology Planning Project (no. 2017ZC0070) to J.T.
Author Disclosure Statement
No competing financial interests exist.
Abbreviations Used
References
Supplementary Material
Please find the following supplemental material available below.
For Open Access articles published under a Creative Commons License, all supplemental material carries the same license as the article it is associated with.
For non-Open Access articles published, all supplemental material carries a non-exclusive license, and permission requests for re-use of supplemental material or any part of supplemental material shall be sent directly to the copyright owner as specified in the copyright notice associated with the article.