




Abstract
Aims:
We aim here to demonstrate that radiation (RT) enhances tumor sensitization by only those Mn complexes that are redox active and cycle with ascorbate (Asc), thereby producing H2O2 and utilizing it subsequently in protein S-glutathionylation in a glutathione peroxidase (GPx)-like manner. In turn, such compounds affect cellular redox environment, described by glutathione disulfide (GSSG)/glutathione (GSH) ratio, and tumor growth. To achieve our goal, we tested several Mn complexes of different chemical and physical properties in cellular and animal flank models of 4T1 breast cancer cell. Four other cancer cell lines were used to substantiate key findings.
Results:
Joint administration of cationic Mn porphyrin (MnP)-based redox active compounds, MnTE-2-PyP5+ or MnTnBuOE-2-PyP5+ with RT and Asc contributes to high H2O2 production in cancer cells and tumor, which along with high MnP accumulation in cancer cells and tumor induces the largest suppression of cell viability and tumor growth, while increasing GSSG/GSH ratio and levels of total S-glutathionylated proteins. Redox-inert MnP, MnTBAP3− and two other different types of redox-active Mn complexes (EUK-8 and M40403) were neither efficacious in the cellular nor in the animal model. Such outcome is in accordance with their inability to catalyze Asc oxidation and mimic GPx.
Innovation:
We provided here the first evidence how structure-activity relationship between the catalytic potency and the redox properties of Mn complexes controls their ability to impact cellular redox environment and thus enhance the radiation and ascorbate-mediated tumor suppression.
Conclusions:
The interplay between the accumulation of cationic MnPs and their potency as catalysts for oxidation of Asc, protein cysteines, and GSH controls the magnitude of their anticancer therapeutic effects.
Introduction
M
With progression into clinical trials, redox-active drugs have emerged as potential therapeutics. Yet, little is known about the interactions of their complex redox reactions with an even more complex cellular redox milieu. There are hardly any data available on the correlation of redox properties and therapeutic effects of such compounds. As a continuation of our efforts to establish structure/activity relationships between the catalytic potency of Mn-based redox-active drugs and their redox properties, we provided here the first evidence how such relationship controls their therapeutic effects, such as their ability to enhance the radiation- and ascorbate-mediated tumor suppression. To substantiate our findings, we compared several Mn complexes of different chemical and physical properties in cellular and animal studies.

Cationic ortho isomeric Mn(III) meso-tetrakis(N-ethylpyridinium-2-yl)porphyrin (MnTE-2-PyP5+, or AEOL10113, BMX-010, MnE; Fig. 1) sensitized 4T1 breast cancer to ascorbate (Asc) in a mouse flank tumor model (50). Such effect was due to the ability of MnTE-2-PyP5+ to produce H2O2 while cycling with Asc (50, 60). It subsequently uses H2O2, in the presence of glutathione (GSH), to oxidatively modify/S-glutathionylate cysteines of a variety of proteins affecting their activities (24). Our redox proteomics data on 4T1 breast cancer cells show that a large number of proteins are S-glutathionylated by MnTE-2-PyP5+/Asc system (48), among which nuclear factor κB (NF-κB) was mostly affected (56). In addition to MnTE-2-PyP5+, we have also explored here another ortho isomeric cationic porphyrin, MnTnBuOE-2-PyP5+ (Fig. 1) (37).
We aim here to achieve two goals. First, we want to show that the redox activity of Mn porphyrins is critical for their anticancer effects and is controlled by the metal-centered reduction potential, E 1/2 of the MnIIIP/MnIIP redox couple. MnTE-2-PyP5+ and MnTnBuOE-2-PyP5+ have the same E 1/2 and are similarly potent SOD mimics, able oxidants of Asc, and mimics of glutathione peroxidase (GPx) (10, 50). In contrast, an SOD-inactive Mn porphyrin (MnP), Mn(III) meso-tetrakis(4-carboxylatophenyl)porphyrin (MnTBAP3−), cannot catalyze Asc oxidation, and therefore is not expected to contribute to the production of H2O2 and impose cytotoxicity to cells and tissues (50). Second, we wanted to improve our understanding of the differential effects of Mn porphyrins on normal versus cancer tissues. Finally, we aim here to demonstrate that preferential accumulation of MnP and higher levels of reactive species in tumor over normal tissue (3, 10, 15, 49 –51) thermodynamically favor a much larger impact of MnPs on tumor redox environment, favoring apoptotic processes.
Based on the existing data on MnPs (24, 48, 50) and assessment of oxidative stress (21, 43), we have decided to access the cellular redox environment via evaluation of glutathione disulfide (GSSG)/GSH ratio and levels of protein S-glutathionylation as those are intimately related and associated with MnP actions. As both RT and Asc are in clinical trials, we aim here to show that RT-mediated tumor growth inhibition can be significantly enhanced when redox-active MnPs are combined with Asc.
To further our understanding of redox-active therapeutics, we have also explored representatives of two other classes of redox-active drugs: Mn(III) salen, EUK-8, and Mn(II) cyclic polyamine (pentaazamacrocycle), M40403 (Fig. 1). While EUK-8 is a modest SOD mimic, M40403 has a similarly high SOD-like activity as MnTE-2-PyP5+ and MnTnBuOE-2-PyP5+ (3). Yet, M40403 has an entirely different structure and thus cannot reduce Asc, dismute H2O2 (49), or mimic GPx (10). For details on the properties and therapeutic effects of different classes of SOD mimics, please see reviews by Batinic-Haberle et al. (3 –5, 7) and Tovmasyan et al. (51).
Results
Redox properties of Mn complexes: aqueous chemistry
Redox-based properties of Mn complexes (Fig. 1), which control their anticancer therapeutic effects, are listed in Table 1. Those are as follows: metal-centered reduction potential for the MnIIIP/MnIIP redox couple; ability to catalyze the superoxide (O2 •−) dismutation in SOD-like manner; ability to reduce peroxynitrite (ONOO−); ability to oxidize Asc (Fig. 2); ability to catalyze H2O2 dismutation in catalase-like manner, and the ability to mimic GPx. Our data clearly show that only cationic MnPs (but not MnTBAP3−, EUK-8, and M40403) are involved in easy shuttling of electrons with major reactive species and cellular reductants. While interacting with thiols, MnPs mimic GPx, whereas MnP-driven catalysis of Asc oxidation gives rise to H2O2 production.

Data were obtained at 25°C ± 1°C, except log k red(ONOO−), which was measured at 37°C ± 1°C. Related equations are given in Batinic-Haberle et al. (4, 5).
Lipophilicity expressed as the log value of the partition of MnP between water and n-octanol (saturated with each other), and determined as described in Batinic-Haberle et al. (3); P OW of M40403 was determined between n-octanol in PBS and PBS, saturated with each other (55).
Metal-centered reduction potential (E 1/2) for the MnIII/MnII redox couple is determined as described in Tovmasyan et al. (49).
The log k cat(O2 •−) describes the ability of Mn complex to mimic SOD enzyme in the catalysis of O2 •− dismutation and is determined as described in Tovmasyan et al. (49).
The log k red(ONOO−)red represents the ability of MnP to reduce ONOO− one electronically to •NO2 employing the O = MnIVP/MnIII redox couple and is determined as described in Ferrer-Sueta et al. (17).
v 0(Asc)ox describes initial rates of ascorbate oxidation by Mn complex employing MnIIIP/MnIIP redox couple in 0.05 M phosphate buffer and is measured as reported in Tovmasyan et al. (50). V 0(Asc)ox values determined in Tris buffer are given in parentheses.
Ability of Mn complex to catalyze H2O2 dismutation, employing the O = MnVP = O/MnIIP redox couple via two-electron process, is expressed as initial rates of oxygen evolution.
Ability of MnPs to mimic GPx, the data are given as percent of GPx activity and as initial rates for NADPH oxidation (in parenthesis), v o in μM·min−1, v o(GPx) = 17, 762 μM·min−1. The ability of compound to oxidize NADPH was measured in 0.05 M Tris buffer, pH 7.4, which contained 0.2 mM NADPH, 1 mM GSH, 1 U/mL GSH reductase, 10 μM MnP, and 0.5 mM H2O2. Reaction was followed at 25°C ± 1°C by ultraviolet/visible spectrometry for 300 s at 340 nm, which corresponds to NADPH absorbance (10).
Carballal Ferrer-Sueta, Batinic-Haberle, et al. unpublished.
Values taken from Bueno-Janice et al. (10) and Tovmasyan et al. (49, 50) and log P OW was estimated based on values in Rosenthal et al. (38).
Values for M40403 were taken from Batinic-Haberle et al. (3, 4) and Maroz et al. (33) except log k cat(H2O2) from (49), and v o(Asc)ox, which was determined here. E 1/2 is +840 vs. NHE in methanol and +940 mV vs. NHE in DMSO (30); E ox = +1.14 V and E red = +0.88 V vs. NHE in 60 mM PIPES buffer, pH 7 of an analog of M40403 (30).
For data on MnCl2 please see (3). The E 1/2 relates to oxidation potential of MnII/MnIII couple, which suggests no ability of Mn to reduce/oxidize H2O2 in catalase- or GPx-like manner (10, 49). In other words, Mn in +2 oxidation state in MnCl2 cannot be reduced to oxidize ascorbate.
Asc, ascorbate; EUK-8, Mn(III) salen complex; GPx, glutathione peroxidase; GSH, glutathione; M40403, Mn(II) cyclic polyamine (pentaazamacrocycle); MnP, Mn porphyrin; MnTBAP3−, Mn(III) meso-tetrakis(4-carboxylatophenyl)porphyrin; MnTE-2-PyP5+, Mn(III) meso-tetrakis(N-ethylpyridinium-2-yl)porphyrin; MnTnBuOE-2-PyP5+, Mn(III) meso-tetrakis(N-(2′-n-butoxyethyl)pyridinium-2yl)porphyrin; NHE, normal hydrogen electrode; O2 •−, superoxide anion; ONOO−, peroxynitrite; PBS, phosphate-buffered saline; SOD, superoxide dismutase.
In addition, the bioavailability of Mn complexes also controls their therapeutic effects. The bioavailability is largely controlled by their lipophilicities and is here described in terms of the log value of the partition of the compound between n-octanol and water —log P OW (Table 1). We have determined the log P OW for cationic MnPs, while the method is not available for anionic MnTBAP3−. It has been a challenge to directly compare the bioavailabilities of cationic and anionic MnPs due to large differences in their charges and structures. The liquid chromatography tandem mass spectroscopy (LC-MS/MS) is presently the only methodology that directly measures the molecular ions of MnPs in tissues, cells, and cellular compartments and was thus used herein.
Redox environment of cells and tissues
Glutathione disulfide/GSH
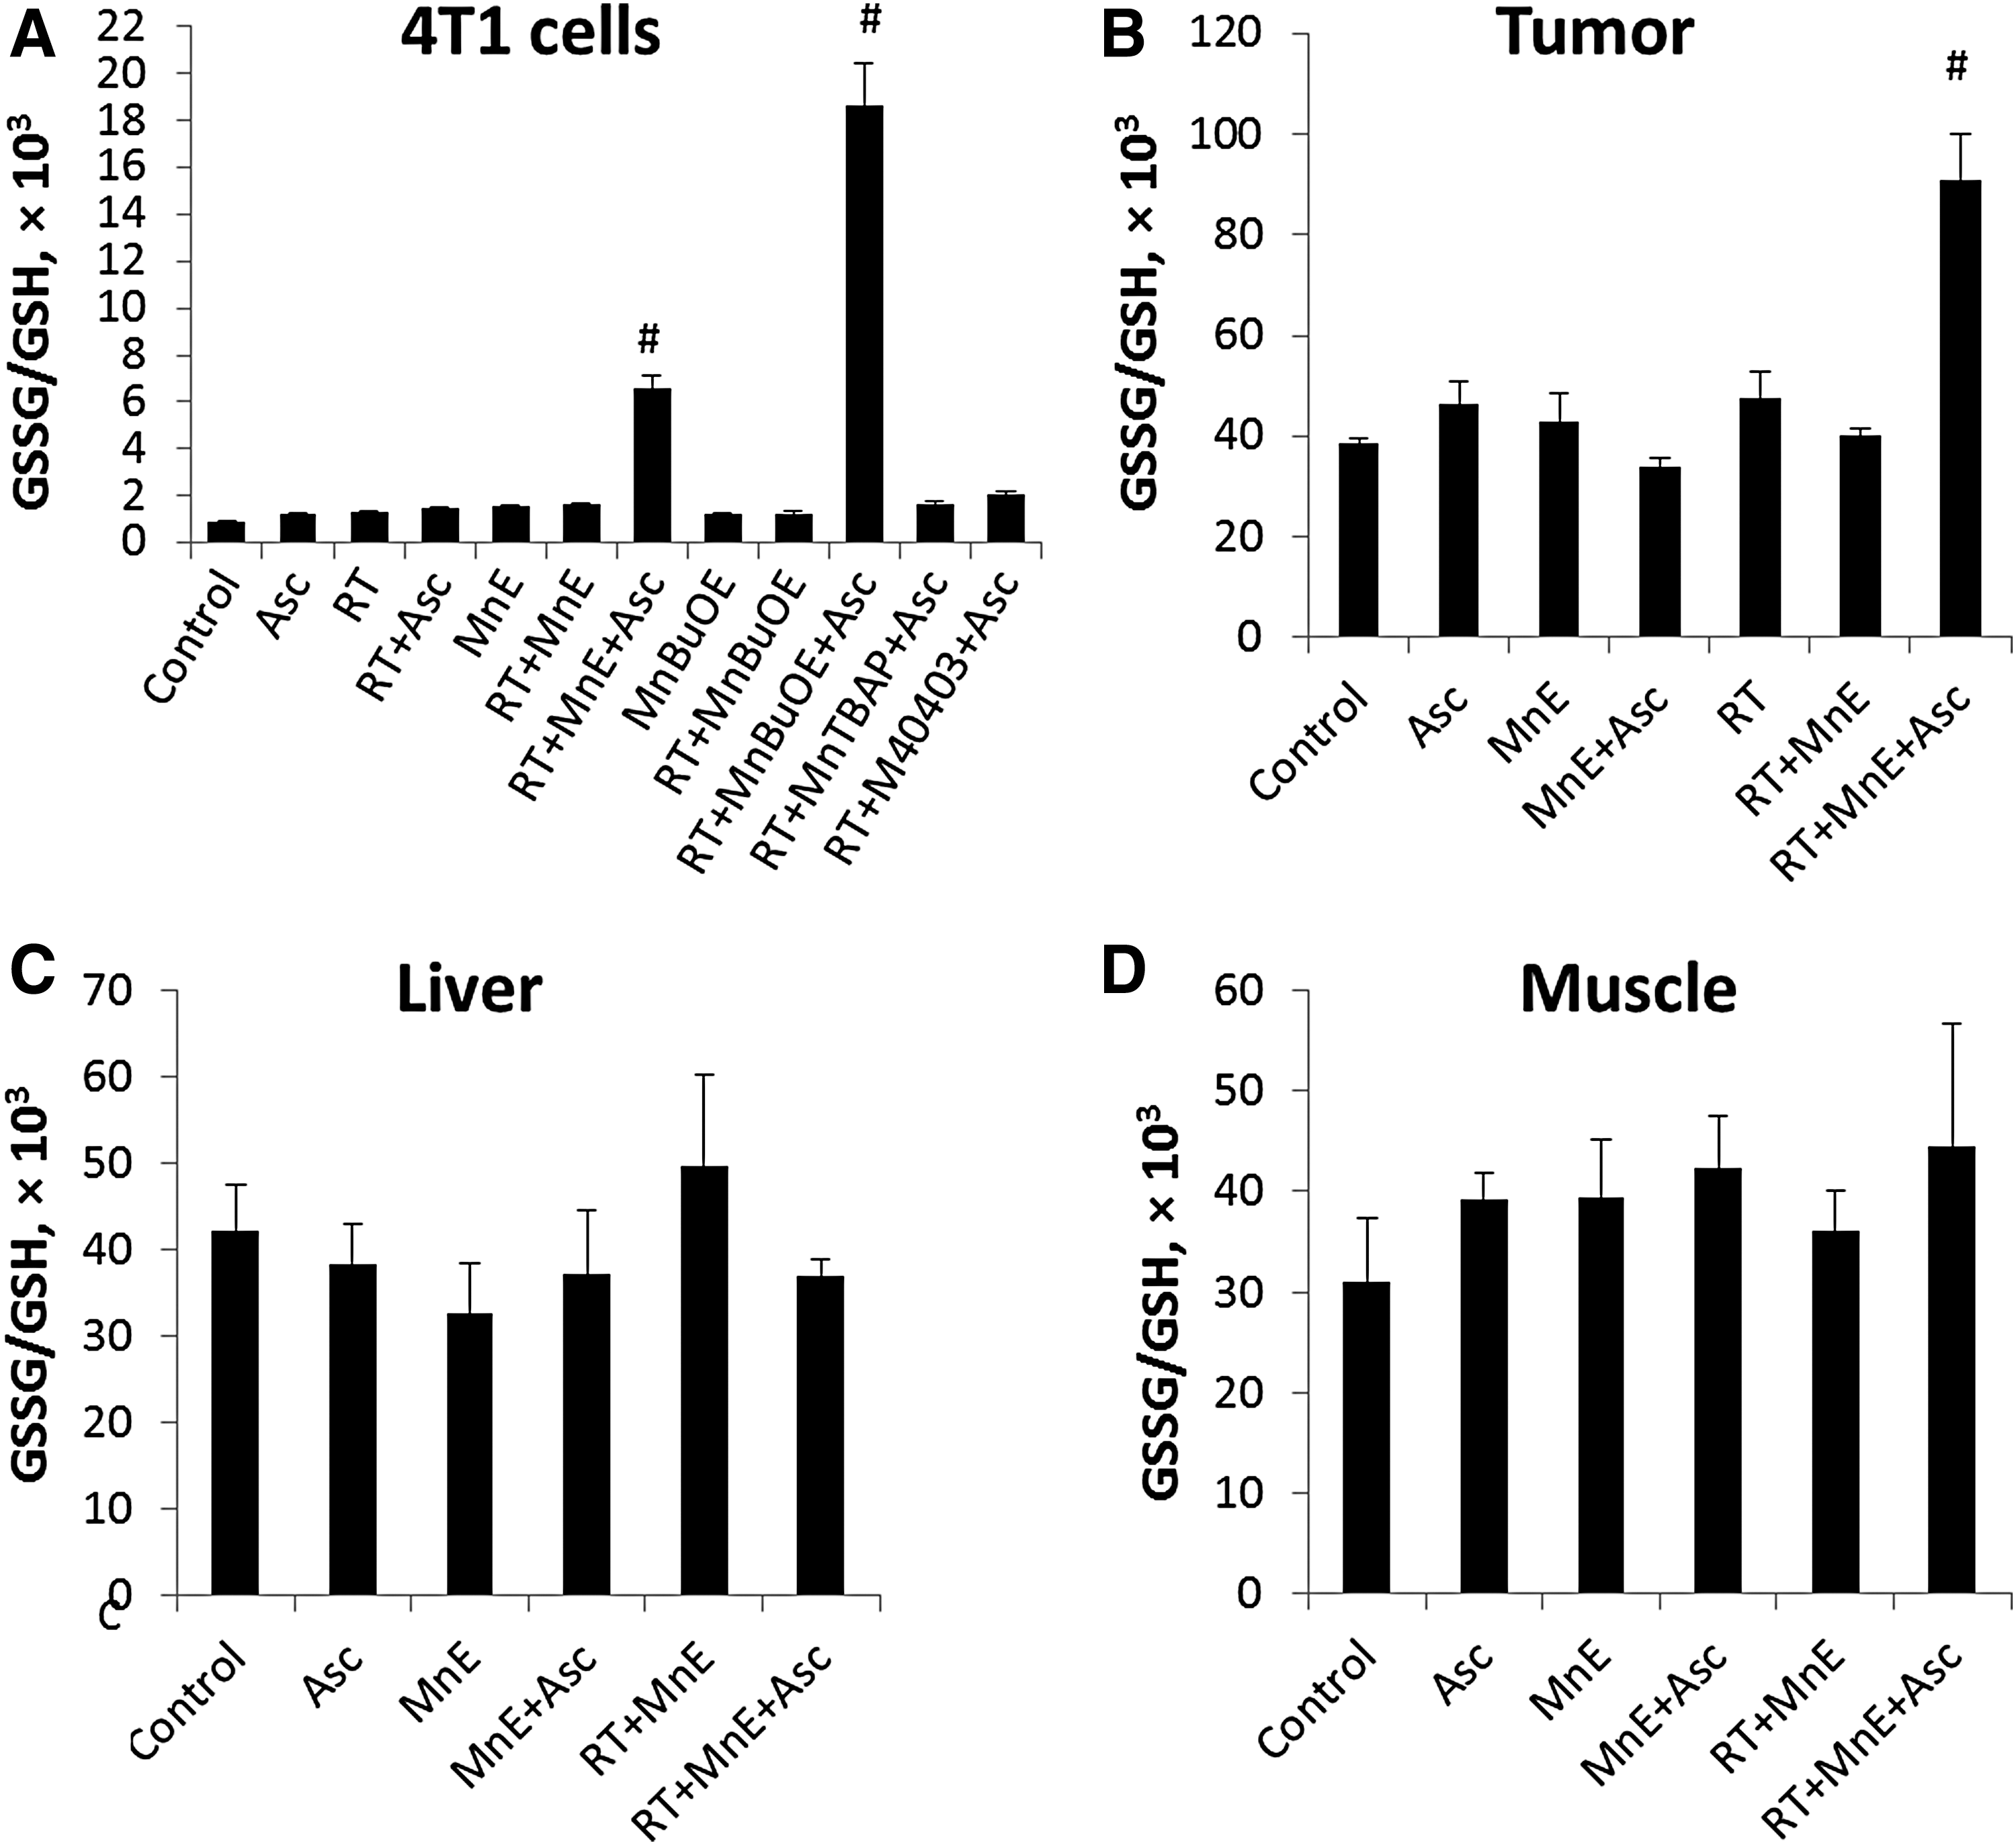
The higher extent of GSH oxidation, as described by GSSG/GSH ratio (Fig. 3), and the larger magnitude of protein S-glutathionylation by MnPs (Fig. 4) in cellular extracts are the consequences of the higher cellular accumulation of MnTnBuOE-2-PyP5+ than MnTE-2-PyP5+ (Fig. 5). Only the most aggressive combination of MnP/Asc/RT-induced significant changes in GSSG/GSH ratios in cells (Fig. 3A) and in tumors (Fig. 3B). Tissues that were not exposed to RT (muscle and liver) have unchanged GSSG/GSH ratios across all treatment groups (Fig. 3C, D). No change in GSSG/GSH ratio was demonstrated with MnTBAP3− and M40403 (Fig. 3A).
S-glutathionylation of protein cysteines
In the presence of Asc and/or RT, the redox-active Mn porphyrins, MnTE-2-PyP5+ and MnTnBuOE-2-PyP5+, induce changes in GSSG/GSH ratios (Fig. 3), at least in part, via S-glutathionylation of protein cysteines (Fig. 4). The S-glutathionylation is an oxidative modification of protein cysteines, catalyzed by MnPs in the presence of H2O2 and GSH. Possible reactions are given by Equations [1]–[7], where Pr stands for protein, PrS− for deprotonated protein cysteine, and GS− for deprotonated form of GSH. Due to the high reducibility of cationic MnPs and high intracellular levels of cellular reductants, such as Asc (see below Eq. [10]), GSH, and tetrahydrobiopterin, only redox-active cationic MnPs would in vivo be readily reduced to Mn +2 oxidation state. We thus listed below the more biologically relevant reactions, where reduced MnIIP, instead of MnIIIP, reacts with H2O2. For other reactions of MnIIP and MnIIIP, see Batinic-Haberle et al. (4, 5, 7).
Cells
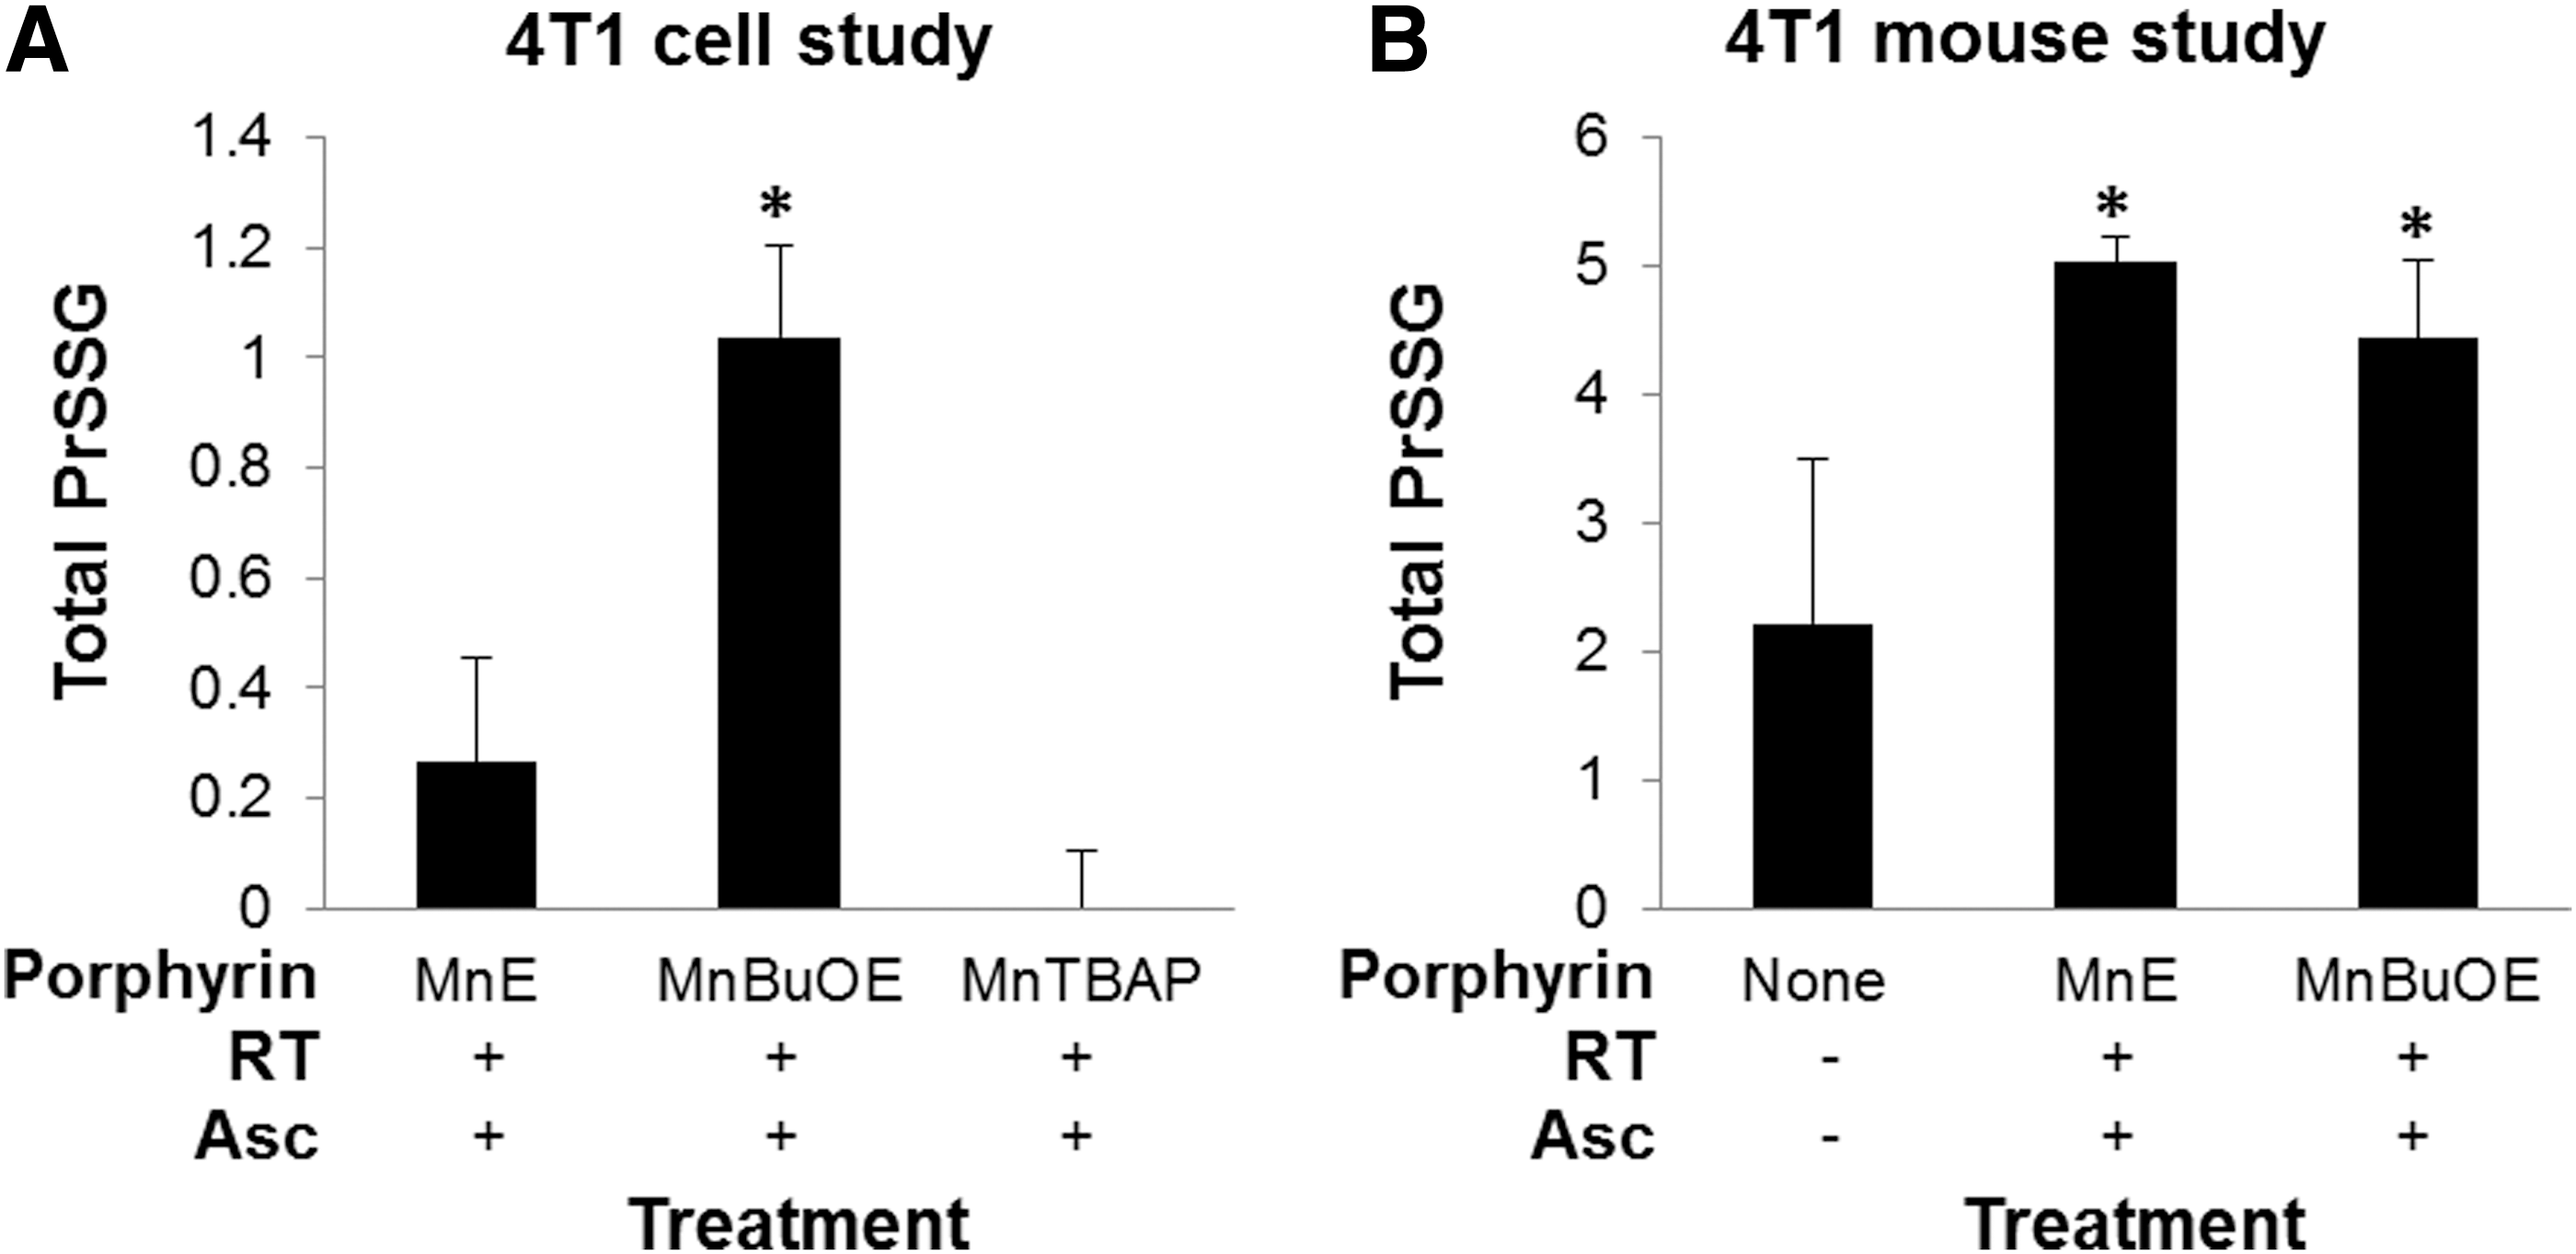
The MnP-driven S-glutathionylation was quantified in cells exposed to most aggressive treatment, MnP/Asc/RT, which induced changes in GSSG/GSH (Fig. 4A). Significance was reached with MnTnBuOE-2-PyP5+, while trend toward significance was demonstrated with MnTE-2-PyP5+; the magnitude of S-glutathionylation was directly proportional to the accumulation of MnPs within cells. As anticipated, no change in S-glutathionylation was observed with redox-inert MnTBAP3−.
Animals
We also compared the S-glutathionylated proteins in tumor samples of mice treated with MnTE-2-PyP5+/Asc/RT and MnTnBuOE-2-PyP5+/Asc/RT to those in control untreated tumors (Fig. 4B). Tumor samples from the MnP/Asc/RT groups have a trend toward increased total S-glutathionylated proteins, with p-values ∼0.1. Samples from mice treated with MnTBAP3− were not analyzed as this compound did not induce changes in cellular GSSG/GSH and S-glutathionylation levels.
Bioavailability of Mn complexes in cells and tissues
In addition to lipophilicity, the structure, size, shape, and stability of Mn complexes affect their bioavailabilities (7). While MnPs are extremely stable compounds, both M40403 and EUK-8 have low metal/ligand stability (3), for details see the Discussion section, Mn(II) cyclic polyamine, M40403.
Cells
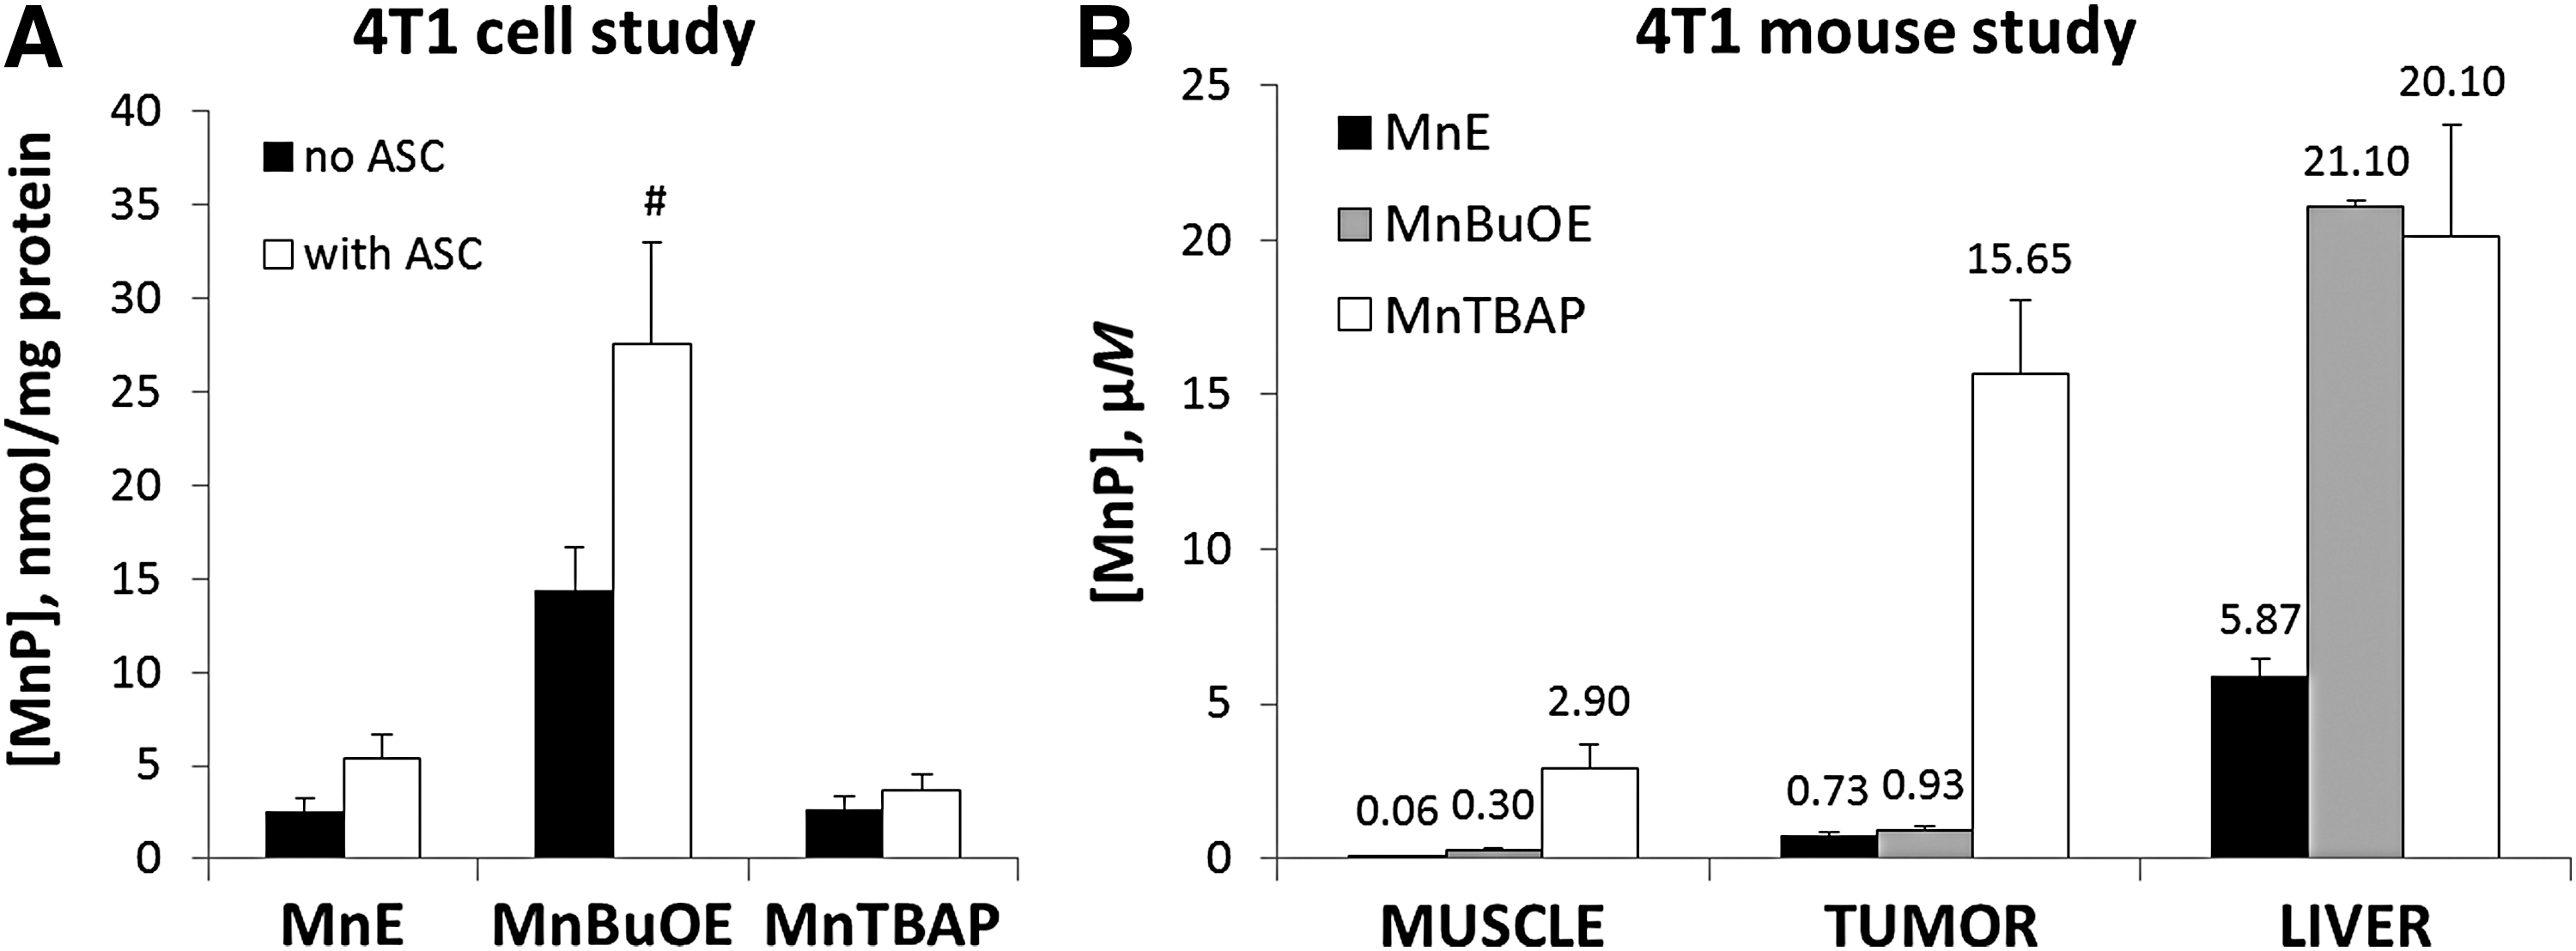
Lipophilic MnTnBuOE-2-PyP5+ accumulated in 4T1 cells sixfold more than do MnTE-2-PyP5+ and MnTBAP3− (Fig. 5A). The accumulation of MnPs is significantly affected by the Asc only with lipophilic MnTnBuOE-2-PyP5+ (Fig. 5A). Such data are in agreement with our earlier results (46, 60). MnTBAP3− does not cycle with Asc, thus its accumulation is not affected by Asc.
Animals
MnPs
We aimed here to show a different uptake of MnPs in tumor versus normal tissue. Tumor was implanted on the muscle of one leg, while muscle of the other leg served as a corresponding normal muscle tissue. Bioavailability data in Figure 5B relate to the mice that were treated only with MnPs but not with RT and Asc. All three MnPs accumulate more in tumor than in normal tissue (Fig. 5B). Accumulation of three MnPs in a very heterogeneous tumor mass did not entirely reflect their accumulation in 4T1 cells. MnTnBuOE-2-PyP5+ accumulated in tumors to a slightly higher level than MnTE-2-PyP5+. MnTBAP3− accumulated in tumors at a 20-fold higher level that MnTE-2-PyP5+, while their accumulation in 4T1 cells was very similar. The ratio of tumor versus normal tissue levels was the highest for MnTE-2-PyP5+ (12.2), followed by MnTBAP3− (5.4) and MnTnBuOE-2-PyP5+ (3.1) (Fig. 5B). The accumulation of cationic MnTE-2-PyP5+ and MnTnBuOE-2-PyP5+ in tissues of other groups of mice, exposed to MnP, Asc, and RT, is shown in Supplementary Figure S1 (Supplementary Data are available online at
Neither Asc nor RT affected the tissue accumulation of MnPs for the following reasons. While cycling with Asc, cationic MnPs get reduced to a more lipophilic, di-valent tetracationic MnIIP, which rapidly reoxidizes to pentacationic MnIIIP. In the presence of H2O2 (or ONOO−), either MnIIP or MnIIIP get oxidized to tetra- or pentavalent species, which bear either similar or smaller charge and may be thus of different lipophilicities (tetracationic O = MnIVP4+ or tricationic O = MnVP = O3+). Yet, due to the brief transient existence of reduced and oxidized species neither treatment impacts the biodistribution of cationic MnPs; these data are in agreement with our earlier reports (46, 60). MnTBAP3− cannot cycle with Asc and H2O2, which could have affected the changes in its charge and possible biodistribution (Table 1). We therefore did not analyze its levels in the tumors of mice treated with MnTBAP3−/Asc/RT.
We assessed liver levels of MnPs as it serves as a depot organ for the redistribution of MnPs into other tissues (29, 45, 56). As recapitulated here (Fig. 5B), and seen in our earlier pharmacokinetics, the levels of cationic MnPs found in liver are the highest among the organs thus far explored (29, 45, 56). While accumulation of MnPs causes Kupffer cell discoloration, liver toxicity has not been reported [(4, 7) and references therein]. The reported data on MnTE-2-PyP5+ and MnTnBuOE-2-PyP5+ demonstrate their good safety/toxicity profiles (18, 19).
EUK-8 and M40403
The accumulation of these Mn complexes was not measured here due to the lack of effects on the cellular and tissue redox environment, cell viability, and tumor growth. As a result of their low metal/ligand stabilities, the therapeutic effects of Mn salens and Mn pentaazamacrocycles, seen elsewhere (3, 20, 55), may be the consequence of the moderate SOD-like activity of released manganese.
Bioavailability of ascorbate in cells and tissues
Plasma levels of Asc fluctuate around 80 μM under normal physiological conditions. Cells concentrate Asc between 0.5 and 10 mM utilizing SVCT1, 2, and 3 transporters. There is approximately 5–10% of the oxidized dehydroascorbate in plasma, which is transported into the cell via GLUT glucose transporters (27, 59). Only three studies report on SVCT protein status in human cancer tissue, but do not report the associated Asc levels; only two studies report Asc levels in tumors of patients [see references in review, Wohlrab et al. (59)].
Pharmacokinetic modeling suggests that accumulation of Asc in poorly vascularized tumors may require high plasma levels of ∼100 μM (27). This may be achieved by either longer infusion of 1–4 g or high single dosing of 10–50 g Asc. Modeling suggests that tumors have 55–83% of the normal tissue Asc levels; such data agree well with 67% Asc measured by the same authors in high-grade endometrial and colorectal tumor tissue (27). In better vascularized low-grade tumors, the ratio was close to 100% (27). We thus anticipated achieving high enough tumor levels of Asc when dosing it at 4 g/kg/day for 5 days and continuing for the rest of the study at 1 g/kg/day; the latter dose has been used in an ongoing clinical trial NCT02344355.
Efficacy studies
Cell viability
Redox-active MnPs sensitize breast cancer cells to RT and Asc
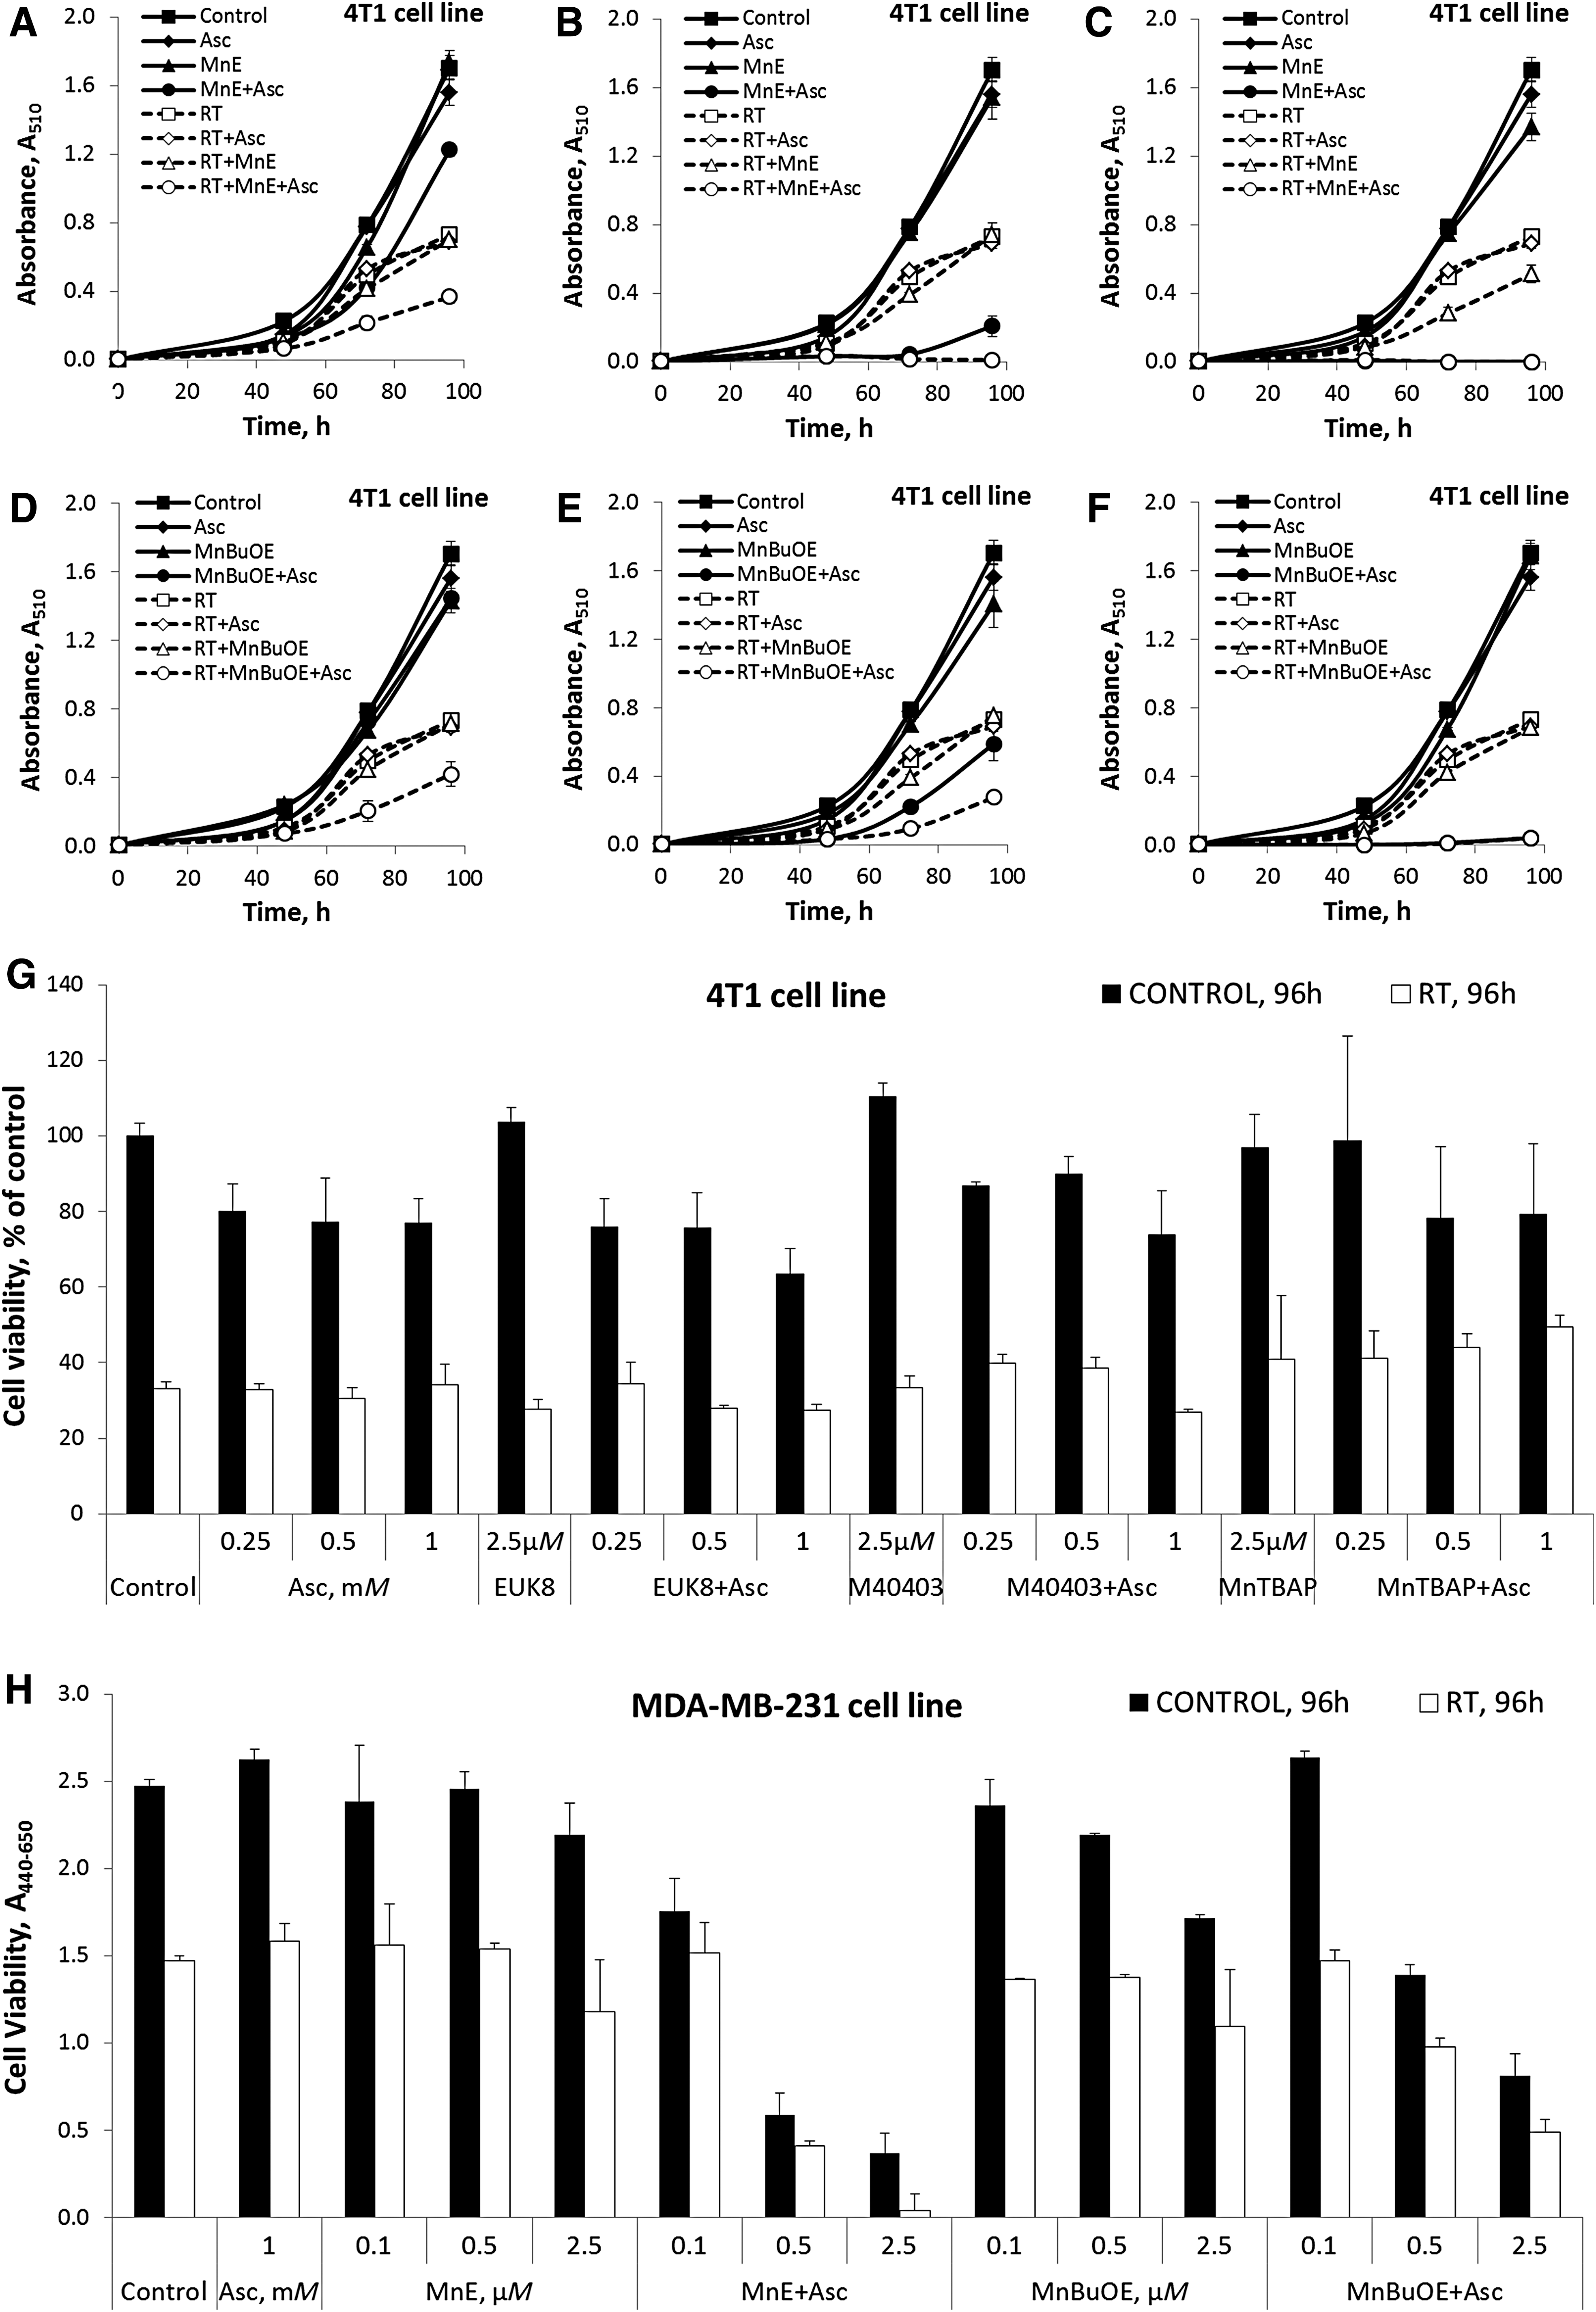
The effect of Mn complexes on estrogen receptor, progesterone receptor, and human epidermal growth factor receptor 2-negative mouse 4T1 and human MDA-MB-231 breast cancer cells is demonstrated in Figure 6. Figure 6A–F shows data on 4T1 and Figure 6H on MDA-MB-231 cells. MnTE-2-PyP5+ (Fig. 6A–C, H) and MnTnBuOE-2-PyP5+ (Fig. 6D–F, H) sensitize both cell types to Asc and RT to a similar extent. The effect is due to their ability to cycle with Asc and produce H2O2 (Table 1 and Fig. 2). The effect is dependent on the concentrations of MnP (0.1, 0.5, and 2.5 μM) and Asc (0.25–2 mM, shown for 1 mM Asc). The redox-inert MnTBAP3− has no effect as it can neither cycle with Asc nor react with H2O2 (Figs. 2 and 6G and Table 1). The treatment is not cell-type specific as similar effects were seen with the squamous cell carcinoma cell line FaDu, Lewis lung carcinoma cell line LLC1, and the prostate carcinoma cell line DU145. Data are shown in Supplementary Figure S2.
Mn salen and Mn(II) cyclic polyamine are inefficacious
To further elaborate our conclusions, we tested EUK-8 (3, 7) and M40403 (3, 55). The effect of these Mn complexes on cell viability is due entirely to the RT and not to their coupling with Asc (Fig. 6G) and is the result of the inability of these Mn complexes to catalyze Asc oxidation and react with H2O2, which is a first step in S-glutathionylation (Eq. [1]) (Table 1 and Fig. 2) [(49, 50) and this study].
Animal tumor growth
Similar ability of cationic MnPs to enhance the RT- and Asc-induced suppression of tumor growth (Fig. 7A, B, F) correlates well with their ability to oxidize Asc, mimic GPx, and accumulate in tumor (Figs. 2 and 5 and Table 1). While MnTE-2-PyP5+ showed a modest anticancer effect in its own right if given at 15 mg/kg/day (6, 51), neither cationic MnP was efficacious at a much lower dosing of 2 mg/kg/day in the absence of Asc and RT. The largest effect was observed when MnPs were combined with RT and Asc. MnTBAP3− sensitized tumors to neither Asc nor RT (Fig. 7E) as it is not capable of oxidizing Asc and mimicing GPx (Table 1). The cellular effects of EUK-8 and M40403 are recapitulated in a mouse tumor model where these Mn complexes neither sensitize tumors to Asc nor to RT (Fig. 7C, D); the effects are solely due to RT. However, both compounds reportedly have therapeutic efficacy in different models of oxidative stress disorders (1, 3, 35), and enantiomer of M40403 is being tested in trials on radioprotection of normal tissue; further explorations are therefore justified.

Statistical analysis
MnTE-2-PyP5+ (MnE) and MnTnBuOE-2-PyP5+ (MnBuOE)
Statistical analysis suggests that both MnE/Asc/RT and MnBuOE/Asc/RT demonstrated significant tumor growth suppression compared to the control group (Fig. 7A, B). By the end of the analyzed period, all the mice in the control group reached a tumor volume of 400 mm3, with 0% remaining below this threshold. At the same time, 83% of mice treated with MnE/Asc/RT and 75% of mice treated with MnBuOE/Asc/RT (Fig. 7F) had tumor volumes below 400 mm3 by the 13th and 14th days, respectively. In comparison, among mice treated with RT only, <30% remained below this threshold by the end of the studies. These results suggest a strong impact of MnE/Asc and MnBuOE/Asc on tumor radiosensitization. With M40403 and EUK8, mice from all groups had tumor volumes larger than 400 mm3 by the end of the studies (Fig. 7C, D, G).
In addition, we compared treatment-specific tumor growth curves (depicted in Fig. 7A), using mixed-effects repeated-measures models, as described in the Experimental under the Animal studies and Statistical analysis sections. The results showed that the MnE/Asc/RT treatment had a statistically significant inhibiting effect on tumor growth in comparison to the control group and other single- and double-treatment groups. In particular, the effect of the MnE/Asc/RT treatment was significantly stronger than the Asc (p < 0.0001), the RT (p = 0.0028), and the MnE (p < 0.0001) single treatments, or the MnE/Asc (p = 0.0006) and MnE/RT (p = 0.0261) double treatments.
The differences in the tumor growth curves became particularly pronounced toward the end of the experiment. In particular, during the 11th to 13th days, the MnE/Asc/RT treatment had a statistically significant effect on tumor growth relative to the control and single-treatment groups with p-value below 0.0001 for all those comparisons; moreover, the triple combination group, MnE/Asc/RT, also demonstrated a significantly stronger impact on tumor growth suppression relative to the MnE/Asc (p < 0.0001) or MnE/RT (p = 0.0036) treatments.
The MnBuOE/Asc/RT treatment also demonstrated a statistically significant inhibition of tumor growth relative to single treatments, that is, the control (p < 0.0000), the MnBuOE (p < 0.0001), the Asc (p < 0.0001), and the RT (p < 0.0001) (Fig. 7B). Tumor growth inhibition by the triple combination MnBuOE/Asc/RT was also significantly stronger than the effects of double treatment, namely the MnBuOE/Asc (p < 0.0001) and MnBuOE/RT (p = 0.0133). The better performance of the MnBuOE/Asc/RT treatment versus single or double treatment becomes even more noticeable during the last days of the experiment, that is, after day 11. For instance, the tumor growth inhibition with MnBuOE/Asc/RT treatment group was significantly greater in the MnBuOE/RT group (p < 0.0006). Overall, the results of these studies suggest that the combination of Asc with either MnE or MnBuOE treatments significantly sensitizes tumor to RT.
MnTBAP3− (MnTBAP)
In contrast, a similar analysis for MnTBAP/Asc/RT suggests that even though the effect of MnTBAP/Asc/RT treatment on tumor volume was statistically significant relative to the control group (p < 0.0001), it was not significantly different from the RT (p = 0.2937) or MnTBAP/RT (p = 0.3628) groups (Fig. 7E). The differences between MnTBAP/Asc/RT and other treatments using RT did not become significant even by the end of the experiment, namely during the 11th to 13th day period (p = 0.1351 relative to RT and p = 0.3660 relative to MnTBAP/RT). These results thus suggest that the combination of MnTBAP/Asc with RT does not significantly improve the effects of the latter.
EUK-8 and M40403
Statistical analyses of radiosensitizing effects of EUK-8 and M40403 in combination with Asc showed similar results (Fig. 7C, D) to those seen with MnTBAP (Fig. 7E).
Ascorbate/RT
In addition, we conducted a similar analysis, using mixed-effects repeated-measures models, for the control and three treatment groups Asc, RT, and Asc/RT. The pairwise comparisons between tumor growth curves show that the double combination, Asc/RT, is significantly stronger relative to the control group (p < 0.0001), but is not significantly stronger relative to single treatments Asc (p = 0.0783) and RT (p = 0.5644) (Supplementary Fig. S3A). However, during the 11th to 13th days of experiment, the combination Asc/RT demonstrates a significantly stronger effect relative to Asc treatment (p = 0.0075), but not relative to RT treatment (p = 0.4344) (Supplementary Fig. S3B).
Discussion
The representatives of three different classes of redox-active drugs, Mn(III) porphyrins, Mn(III) salens, and Mn(II) pentaazamacrocycles, were explored in this study. The differences among these compounds arise from their different structures, charges, shapes, sizes, redox properties, and lipophilicities. The interplay of these properties affects cellular redox environment (such as redox-sensitive thiol-driven master switches, nuclear factor E2-related factor 2 [Nrf2]/Kelch-like ECH-associated protein 1 [Keap1], or NF-κB), which in turn controls cellular proliferative and apoptotic processes (21, 43).
Redox properties of Mn complexes control their anticancer effects
MnTE-2-PyP5+ and MnTnBuOE-2-PyP5+
The anticancer therapeutic effects of these Mn complexes arise from the interplay of the following kinetic and thermodynamic properties of MnPs: (i) ability to cycle with Asc and thereby produce H2O2, (ii) ability to catalyze protein cysteine S-glutathionylation in a GPx-like manner, utilizing H2O2 generated from MnP/RT/Asc, and (iii) cellular and/or tissue accumulation (Table 1). These compounds are extremely stable with regard to the loss of redox-active Mn center which is essential for the integrity and operability of these Mn complexes (4). The redox abilities of these two cationic Mn porphyrins are nearly identical, while they differ largely with regard to their lipophilicities.
Being approximately four orders of magnitude more lipophilic, MnTnBuOE-2-PyP5+ accumulates in cells and tissues to a higher extent than MnTE-2-PyP5+ (Table 1). This in turn affects the cellular and tissue uptake of cationic MnPs (Fig. 5). The higher cellular accumulation of MnTnBuOE-2-PyP5+ relative to MnTE-2-PyP5+ may be the major cause for the higher GSSG/GSH ratio and higher yield of S-glutathionylation in a cellular study (Figs. 3 and 4). Yet, MnTE-2-PyP5+ reduces cellular viability to a larger extent than MnTnBuOE-2-PyP5+ (Fig. 6) for the following reason: H2O2 generated by the action of MnP and Asc was mostly produced in the medium from which it entered the cell (49). Thus, the amount of H2O2 produced during MnP/Asc cycling was directly proportional to the higher catalytic potency of MnTE-2-PyP5+ than MnTnBuOE-2-PyP5+ in oxidizing Asc, and did not depend on the intracellular accumulation of MnP, as did the magnitude of S-glutathionylation. However, with similar redox properties (Table 1 and Figs. 3 and 4) and similar tumor accumulation (Fig. 5), MnTE-2-PyP5+ and MnTnBuOE-2-PyP5+ generate similar anticancer effects in animal study (Fig. 7).
MnTBAP3− is not an SOD mimic as it has a too negative metal-centered reduction potential (4, 7), which precludes its reduction with Asc (Table 1 and Fig. 2). Furthermore, MnTBAP3− cannot be oxidized with H2O2–a prerequisite for the catalysis of S-glutathionylation (3, 4, 49, 50). In turn, regardless of its high cellular and intratumoral accumulation, MnTBAP3− neither impacts the magnitude of S-glutathionylation (Fig. 3) nor sensitizes cells and tumors to Asc and RT (Figs. 6 and 7). While a fair amount of data exist on the ability of MnTBAP3− to reduce normal tissue injuries (9, 12, 53, 61, 64), this MnP may not have the potential as an anticancer therapeutic.
Mn(III) salen, EUK-8
We have decided to test EUK-8 for two reasons. First, exploring compounds of different structures and different redox properties helps us gain insight into the actions of redox-active drugs in general. Second, a very similar compound, EUK-134, is in use in humans—in Estee Lauder cosmetic products. When compared with EUK-8, in EUK-134, both hydrogen atoms are replaced with OCH3 groups (Fig. 1). With an E 1/2 for the MnIII/MnII redox couple of −130 mV versus normal hydrogen electrode (NHE), EUK-8 has modest SOD-like activity, k cat(O2 •−) = 2 × 10⁶ M −1·s−1 (3), which is lost in the presence of EDTA due to its low metal/ligand stability (3, 8). Furthermore, EUK-8 has negligible catalase-like activity (49), as well as ability to oxidize Asc and mimic GPx (10, 50) (Table 1 and Fig. 2). The reactivity of EUK-8 is not specific to O2 •−; it also reacts with hypochlorite and ONOO− (3).
In a study on temperature-sensitive MnSOD-knockout eukaryotic Cryptococcus neoformans, EUK-8 was the only compound protective against temperature-induced assault. Several different Mn porphyrins, nitroxide (Tempol) and MnCl2, failed (20). These results could only be explained in the following way. EUK-8 transported Mn into the mitochondria where Mn released acted as an MnSOD mimic. Yet, such data cannot help explain the lack of anticancer efficacy in this work (Figs. 6 and 7), as neither EUK-8 nor Mn are catalysts of Asc oxidation and protein S-glutathionylation (Table 1).
Mn(II) cyclic polyamine, M40403
The SOD-like activity of M40403 is similar to that of two cationic MnPs. However, their redox chemistries are quite different and arise from the existence of Mn center in a +2 oxidation state in M40403, and +3 oxidation state in cationic MnPs. For an SOD mimic, the E 1/2 of the MnIIIP/MnIIP redox couple (Table 1 and Fig. 2) should be preferentially in the middle of oxidation (−180 mV vs. NHE) and reduction potentials of O2 •− (+890 mV vs. NHE) (4). Such is true for cationic MnPs. E 1/2 of M40403 is too high and would not support the catalysis of O2 •− dismutation on thermodynamic grounds. Yet, the catalysis is reportedly kinetically facilitated (2). Furthermore, bearing Mn in the +2 oxidation state, M40403 cannot be reduced with Asc. In a first step of its catalytic cycle with O2 •−, the Mn site of M40403 gets oxidized to Mn +3, while reducing O2 •− to H2O2 (Eq. [8]). While cycling back it can be reduced with O2 •−, but preferentially with monodeprotonated form of ascorbic acid [Asc (HA−), which is a major species in aqueous solution at pH 7.8], due to its much higher cellular concentration (Eq. [9]). The amount of O2 •− would limit the yield of H2O2 formation by M40403.
Conversely, MnPs are readily reduced with Asc (HA−) (Eq. [10]). While closing the catalytic cycle, MnPs get reoxidized with either O2
•− or oxygen (Eq. [11]), producing H2O2 or O2
•−, respectively. O2
•− gets then readily dismuted to H2O2 and O2. The MnP cycling will continue as long as Asc and oxygen are available. Due to the high levels of Asc and oxygen, the yield of MnP-driven production of cytotoxic H2O2 (primary player in S-glutathionylation) will be significantly higher than that of M40403 (limited by sub-μM levels of O2
•−).
In aqueous chemistry studies, M40403 is neither able to oxidize Asc nor mimic GPx (10) and has a very low ability to catalyze dismutation of H2O2 (49) (Table 1). Such data agree well with the lack of anticancer effects in our cellular and animal studies (Figs. 6 and 7). Recent data substantiate the low metal/ligand stability of Mn(II) pentaazamacrocyclic complexes (55). The log K ML is reportedly in between 10.09 (55) and 13.6 (3) depending on the conditions applied; being lower in the presence of phosphate (55). M40403 can easily lose Mn given the similar or higher stability constant for Mn(II) complex with EDTA (log K MnEDTA = 13.56), and the high in vivo concentrations of carboxylates and phosphate. Manganese itself has a modest SOD-like activity (log k cat in between 6.11 and 6.95) (3) and in its own right can neither oxidize Asc nor mimic GPx (Fig. 2 and Table 1) (10, 50).
Interaction of redox-active Mn porphyrins with redox-sensitive transcription factors
NF-κB
Major cysteines modified by the action of MnTE-2-PyP5+ in the presence of chemotherapy (glucocorticoids, temozolomide and Asc) are p50 and p65 subunits of NF-κB, with p65 the major one identified in a lymphoma study (3, 23 –26, 48, 50, 57). Other proteins bearing cysteines were found to be also S-glutathionylated. Such are complexes I and III of mitochondrial respiration. They were subsequently inactivated, which resulted in the loss of ATP (23, 48). The same oxidative modification is likely involved in the inhibition of some of the glycolysis proteins; in turn, MnP affects both sources of energy in lymphoma cell (23). Similar was seen with diffuse large B cell lymphoma and multiple myeloma study (25). Importantly, cytotoxicity was not seen with normal lymphocytes (23). As expected, similar effects were also seen with MnTnBuOE-2-PyP5+ (Jaramillo and Tome, personal communication).
The redox proteomics indicated also that NF-κB was a major S-glutathionylated protein when 4T1 breast cancer cells were exposed to MnP/Asc (50). In addition, numerous proteins were S-glutathionylated, including NF-κB, p38 mitogen-activated protein kinase (MAPK), Keap1, and 2A phosphatase, as well as peroxiredoxin 4 and precursors of peroxiredoxin 5 and 6 (6, 48). Such data agree well with the report on MnP/RT-driven inhibition of several MAPKs in 4T1 cells followed by tumor growth suppression (42). The death gene array results from the patient-derived glioblastoma multiforme xenograft subcutaneous (sc) mouse study showed the MnP/RT-driven induction of different pathways, including NF-κB and apoptosis (4).
Nrf2/Keap1
Numerous references have already suggested that synthetic redox-active therapeutics, such as porphyrin-based SOD mimics, instead of serving exclusively as antioxidants, act in vivo predominantly as pro-oxidants, oxidizing/S-glutathionylating cysteines of Keap1, thereby activating Nrf2 and subsequently upregulating endogenous antioxidant defenses [discussions in Batinic-Haberle et al. (4, 5, 7)]. A study on kidney ischemia/reperfusion model showed that Mn(III) meso-tetrakis(N-n-hexylpyridinium-2-yl)porphyrin contributed to the upregulation of numerous endogenous antioxidant defenses that are, at least in part, controlled by Nrf2 (14). Such scenario was reportedly operative with redox-active curcumin, nitroxides, and flavonoids (22, 26, 31, 39, 44, 63).
Numerous studies demonstrated the activation of Nrf2 in tumors with subsequent suppression of anticancer therapy. The inhibition of Nrf2 activation was though reported with the flavonoid wogonin in a cellular head and neck cancer study (26). Recently, St. Clair's group provided first evidence that such differential effects of MnTnBuOE-2-PyP5+ on normal versus malignant cells may be operative; her data may help us gain additional insight into why MnP does not protect tumors (4, 5, 7, 57, 58). Thus, MnTnBuOE-2-PyP5+ activated Nrf2 in a hematopoietic stem/progenitor cell population (62). While our redox proteomics on 4T1 cells treated with MnP/Asc shows S-glutathionylation of Keap1 by MnP/Asc in 4T1 cancer cells (48), numerous other pathways and mutations may control the regulation of Nrf2 in tumor (28).
Mn porphyrins in normal versus tumor tissue
While we have not addressed tumor and normal tissue injury in the same model, available data, including those from this work, would support the following conclusions. Due to (i) increased oxidative stress (thus higher H2O2 levels), and (ii) larger MnP accumulation in tumor versus normal tissue, the yield of S-glutathionylation is anticipated to be larger in tumor than normal tissue. Based on earlier studies of us and others, the catalysis of S-glutathionylation of NF-κB seems to be at least one of the major actions of MnPs in both types of tissues (4, 23, 24, 36, 40, 41, 52).
In normal tissue, due to a lower yield of MnP-driven S-glutathionylation of NF-κB, the suppression of excessive inflammation would restore physiological redox environment of normal tissue (40, 41). In cancer, though, the induction of apoptotic processes by MnP (in the presence of exogenous sources of H2O2) would happen as demonstrated with hematological malignancies, mouse 4T1 and human inflammatory breast cancer cells, and human glioblastoma multiforme (16, 23, 24, 42).
St. Clair's group provided direct evidence that MnP also activates Nrf2 in normal hematopoietic stem cells, presumably via S-glutathionylation of Keap1 (11, 13, 62). This in turn results in upregulation of endogenous antioxidative defenses that suppress excessive inflammation (14, 28). The regulation of Nrf2 by MnP in tumor has not yet been explored.
Conclusions
Only redox-active MnPs, when given along with Asc and RT, alter GSSG/GSH ratio and catalyze protein S-glutathionylation. The redox abilities (kinetics and thermodynamics) of two cationic MnPs that control reactions involved in S-glutathionylation are nearly identical. Yet, large differences in their ability to catalyze S-glutathionylation in cellular extracts are due to the differences in their lipophilicity, structure, and shape, which control their cellular uptake [(50) and references therein]. In turn, MnTnBuOE-2-PyP5+ is the best catalyst of S-glutathionylation in a cellular setting. No protein oxidation was observed with redox-inert MnTBAP3−.
Accumulation of three MnPs in a very heterogeneous tumor mass does not entirely reflect their accumulation in 4T1 cells. MnTBAP3− accumulated in a tumor tissue at a 20-fold higher level than MnTE-2-PyP5+, while their accumulation in 4T1 cells was very similar. Yet, MnTBAP3− is redox inert and neither sensitizes cells nor tumors to Asc and RT. MnTnBuOE-2-PyP5+ and MnTE-2-PyP5+ accumulated in tumors to a similar magnitude. Given their similar redox properties, these MnPs produce similar anticancer effects, sensitizing cells and tumors to Asc and RT. Neither EUK-8 nor M40403 was able to sensitize cells and tumors to Asc and RT due to the inability to oxidize Asc and mimic GPx.
Materials and Methods
Mn complexes
MnTnBuOE-2-PyP5+, MnTE-2-PyP5+, and MnTBAP3− were synthesized as previously reported and referenced in Tovmasyan et al. (49). EUK-8 was purchased from Cambridge Chemicals and M40403 from ASTATECH.
Redox properties of Mn complexes
Aqueous chemistry: Asc oxidation and GPx mimicking by Mn complexes
The catalysis of Asc oxidation by MnPs, EUK-8, and M40403 was performed in phosphate and Tris buffers as described in Tovmasyan et al. (50). The ability of compounds to mimic GPx is measured via oxidation of NADPH in 0.05 M aqueous Tris buffer, pH 7.4, which contained 0.2 mM NADPH, 1 mM GSH, 1 U/mL GSH reductase, 10 μM MnP, and 0.5 mM H2O2 (10). The reaction was followed at 25°C ± 1°C for 300 s spectrophotometrically at 340 nm, which corresponds to NADPH absorbance. Data are expressed as percent of GPx enzyme activity and as initial rates for NADPH oxidation. The initial rate for NADPH oxidation by enzyme is v o(GPx) = 17,762 μM·min−1. The experiments were performed in triplicate.
Redox environment of cells and tissues
GSSG/GSH
Cellular study
The 4T1 cells were plated in six-well plates at 250,000 cells/well in Dulbecco's modified Eagle's medium (DMEM) with 10% fetal bovine serum (FBS) at 37°C. The following day, 5 μM Mn complex and 1 mM Asc were added to the medium, cells were incubated at 37°C for 1 h, and then irradiated with 10 Gy (1.93 Gy/min). After 4 h of incubation at 37°C, the cells were washed twice with 2 mL of ice-cold phosphate-buffered saline (PBS), and 200 μL of GSH-trapping agent solution (20 mM N-ethylmaleimide [NEM; Sigma], 2% sulfosalicylic acid [SSA; Sigma], and 2 mM EDTA in 15% methanol) added to wells and agitated for 1 h at room temperature. The supernatant was centrifuged at 14,000 × g for 10 min at room temperature and stored at −80°C. On the day of LC-MS/MS analysis, the supernatant was diluted 1:4 (GSSG) or 1:100 (GSH) by mobile phase A (see the LC-MS/MS Assay of GSH and GSSG section) with an appropriate amount of the corresponding internal standard (0.25 μM GSSG-d6 or 0.7 μM GSH-NEM-d3), placed into the autosampler at 4°C, and 10 μL (GSSG) or 5 μL (GSH) injected into the LC-MS/MS instrument. The experiments were performed in triplicate.
Animal study
Tissues from 12 mice were pooled into groups of 3. Tumor, muscle, and liver tissues were snap-frozen, cryopulverized in a Bessman tissue pulverizer (BioSpec Products, Bartlesville, OK) under liquid nitrogen, homogenized in a rotary homogenizer (PTFE pestle and glass tube) with four volumes of GSH-trapping agent (see the Cellular Study section), incubated for 30 min at room temperature, and stored at −80°C. On the day of LC-MS/MS analysis, 50 μL of tissue homogenate, 200 μL of formic acid in water, and 500 μL of chloroform were added into a 2-mL polypropylene screw-cap vial and agitated in a FastPrep (Thermo-Savant) homogenizer at a speed 5 for 40 s. After 30 min of incubation at room temperature and centrifugation at 14,000 × g for 5 min, the supernatant was diluted 1:1 (GSSG) or 1:5000 (GSH) by mobile phase A with an appropriate amount of the corresponding internal standard (1.1 μM GSSG-d6 or 0.65 μM GSH-NEM-d3), placed into the autosampler at 4°C, and 20 μL (GSSG) or 5 μL (GSH) injected into the LC-MS/MS instrument.
LC-MS/MS assay of GSH and GSSG
A published assay for the analysis of GSH and GSSG in blood (34) was adopted for the analysis of cell, tumor, muscle, and liver samples. The measurement of GSH (as GSH-NEM derivative) and GSSG was performed on Shimadzu 20A series LC and Applied Biosystems/SCIEX API5500 QTrap MS/MS. LC conditions: column Agilent ZORBAX Eclipse Plus, C18 4.6 × 50 mm 1.8 μm particle size (P/N 959941-902) analytical column and Phenomenex, C18 4 × 3 mm guard cartridge (P/N AJ0-4287) at 45°C. Mobile-phase solvents (all MS-grade): A—0.1% formic acid in water, 2% acetonitrile (ACN); B—ACN. Elution gradient at 1 mL/min: 0–3 min 0–50% B, 3–3.1 min 50–95% B, 3.1–3.5 min 95% B, 3.5–3.6 min 95–0% B. Run time: 7 min. MS/MS conditions: multiple reaction monitored mode (MRM) transitions (m/z) followed for GSH-NEM, GSH-NEM-d3, GSSG, and GSSG-d6 were 433–304, 436.2–307.1, 613.1–355, and 619.1–361, respectively. Calibration samples (n = 6) in mobile phase A were prepared in the following appropriate ranges: 0.375–6.00 mM for GSH and 1.88–30 μM for GSSG analyses and analyzed alongside the study samples. Quantification was performed by Analyst 1.6.2 software.
S-glutathionylation of protein cysteines
Cellular study
Cell growth and treatment for the assessment of S-glutathionylation of protein cysteines
The 4T1 cells were plated in six-well plates at 250,000 cells/well density. MnP was added at 5 μM, followed by 1 mM Asc. One hour afterward, cells were radiated at 10 Gy. Cells were then incubated for 4 h, the media aspirated, and cells washed twice with 2 mL ice-cold PBS. After the PBS was aspirated, 0.2 mL of lysis buffer was added. After 30 min of incubation on ice (with agitation), the suspensions were transferred into 2-mL vials and centrifuged in a Horton centrifuge at 10,000 × g for 15 min at 4°C. The 200 μL supernatant was transferred into the 0.5-mL Eppendorf tube and stored at −80°C. The lysis buffer contained 0.25 M sucrose, 10 mM Tris-HCl, pH 7.5, 1 mM EDTA, and 1.0% Triton X-100.
Three sets of experiments were done. Polyacrylamide gel electrophoresis (PAGE) and immunoblotting on S-glutathionylated proteins were performed as previously described (24), where bands were quantitated and the signal in each lane corrected for the signal from the actin-loading control. S-glutathionylated protein cysteines were measured and quantitated as previously described (23, 24). Protein was measured in the clarified lysate using the Pierce BCA kit (Thermo Fisher) according to the manufacturer's protocol. Laemmli sample buffer was added to each sample, 20 μg total protein was separated by sodium dodecyl sulfate/polyacrylamide gel electrophoresis (SDS-PAGE), and immunoblotting was performed as previously described (24). Bands were quantitated using ImageJ software, and the signal in each lane corrected for the signal from an actin loading control as previously described (24).
Animal study
Each sample contained equal portions of cryopulverized tumors pooled from 3 mice (total number of mice per group was 12). Tumor homogenates were resuspended in lysis buffer at a concentration of 1 mL lysis buffer/100 mg tissue. Samples were placed on ice for 30 min and vortexed vigorously several times during incubation. Lysates were clarified by centrifugation (10,000 × g) for 15 min at 4°C. The protein amount in the supernatant was measured using the Pierce BCA kit according to the manufacturer's instructions. Twenty-five micrograms of protein was separated by SDS-PAGE, and immunoblotting on S-glutathionylated proteins was performed as previously described (24). Bands were quantitated and the signal in each lane corrected for the signal from the actin loading control.
Bioavailability of MnPs
Cellular study
Cellular uptake was assessed with 4T1 cells treated with MnPs alone and in the presence of Asc. Cells were seeded at a density of 3 × 10⁵ cells per well in a six-well plate. Cells were left for 24 h in a CO2 incubator to adhere. Then, 5 μM MnP alone or in combination with 1 mM Asc was added. After incubation in a CO2 incubator, the wells were washed with PBS. Then, 1 mL of 2% SDS was added to each well to solubilize the cells. After 24 h, the content of each well was centrifuged for 10 min at 75,000 × g. The clarified supernatant was used to measure the MnP content as previously described (7). In brief, ultraviolet/visible spectra were recorded and the area under Soret band quantified. A standard curve was used to assess the concentration of MnP in each sample. The standard curve was constructed by adding a known concentration of MnP to solubilized, untreated cells as described in Ref. (7). Separate standard curves were prepared for each compound. Protein levels were measured by the Lowry method (32). Experiment was repeated three times with each sample run in triplicate.
Animal study
Four samples were analyzed for each tissue type (N = 4). Each sample contained equal portions of cryopulverized tissue (livers, tumors, or muscles from opposite legs) pooled from 3 mice (total number of mice per group was 12).
Tissue preparation for the LC-MS/MS analysis of MnPs in different mouse tissues
MnTE-2-PyP5+
Liver
Homogenate from nontreated liver samples was used to prepare the calibration samples in 0–10 μM range for all MnPs. An aliquot of tissue homogenate was transferred into a 2-mL polypropylene screw-cap vial and then water was added to dilute 10 times. To a 500-μL polypropylene vial, 50 μL of diluted homogenate and 200 μL of 200 nM Mn(III) meso-tetrakis(N-methylpyridinium-2-yl)porphyrin (MnTM-2-PyP5+; Internal Standard) in 1% HCl in methanol was added and vigorously mixed in Fast Prep (Thermo-Savant) agitator for one cycle at speed 6.5 for 40 s and subsequently centrifuged 10 min at 13,200 rpm to separate proteins. Fifty microliters of supernatant and 150 μL 0.1% aqueous heptafluorobutyric acid (HFBA) were transferred into a polypropylene autosampler vial equipped with silicone/PTFE septum. There followed another cycle of centrifugation for 5 min at 5000 g (4°C), after which the sample was immediately analyzed by LC-MS/MS. Homogenate from nontreated liver samples was used to prepare calibration samples in 0–10 μM range.
Muscle and tumor
To a 500-μL polypropylene vial, 50 μL homogenate and 200 μL of 200 nM MnTM-2-PyP5+ in 1% HCl in methanol were added and vigorously mixed in Fast Prep (Thermo-Savant) agitator for one cycle at a speed 6.5 for 40 s. After centrifugation for 10 min at 13,200 rpm to separate proteins, 50 μL of supernatant and 150 μL of 0.1% HFBA in water were transferred into a polypropylene autosampler vial equipped with silicone/PTFE septum. There followed another cycle of centrifugation for 5 min at 5000 × g (4°C), after which the sample was immediately analyzed by LC-MS/MS. Homogenate from nontreated muscle samples was used to prepare calibration samples in 0–160 nM range. Homogenate from nontreated tumor samples was used to prepare calibration samples in 0–800 nM range.
MnTBuOE-2-PyP5+
Liver
An aliquot of homogenate tissue was transferred into a 2-mL polypropylene screw-cap vial and diluted 10-fold with water. To a 500-μL polypropylene vial with two Zr 2.5 mm beads, 50 μL of diluted homogenate and 200 μL of 100 nM MnTnBuOE-2-PyPd8 (internal standard) in 1% HCl in methanol were added and vigorously mixed in Fast Prep (Thermo-Savant) agitator for 1 cycle at speed 6.5 for 40 s and centrifuged 10 min at 13,200 rpm to separate proteins. Fifty microliters of supernatant and 150 μL of 0.1% aqueous HFBA were transferred into a polypropylene autosampler vial equipped with silicone/PTFE septum. There followed another cycle of centrifugation for 5 min at 5000 × g (4°C), after which the sample was immediately analyzed by LC-MS/MS. Homogenate from nontreated liver samples was used to prepare calibration samples in 0–77 μM range.
Muscle and tumor
In a 200-μL polypropylene blunted vial, 50 μL of homogenate and 50 μL of a solution comprising 1% aqueous HFBA, 70% can, 30% and 100 nM MnBuOE-2-PyPd8. Then, 200 μL chloroform/isopropanol (4/1) was added and vigorously mixed in Fast Prep (Thermo-Savant) agitator for one cycle at a speed 6.5 for 40 s. After centrifugation for 5 min at 13,200 rpm to separate proteins, the inorganic layer was discarded. The 150 μL of organic layer was transferred to a polypropylene tube and evaporated to dryness under nitrogen for 40 min. The dried material was dissolved with 60 μL solution that comprised mobile phase A (0.05% HFBA in H2O, ACN 10%) + ACN 30%, and sonicated for 5 min. Then, an aliquot was transferred into a polypropylene autosampler vial equipped with silicone/PTFE septum. There followed another cycle of centrifugation for 5 min at 5000 × g (4°C), after which the sample was immediately analyzed by LC-MS/MS. Homogenate from nontreated muscle samples was used to prepare calibration samples in 0–600 nM range and homogenate from nontreated tumor samples was used to prepare calibration samples in 0–1.8 μM range.
MnTBAP3−
Liver
Fifty microliters of homogenate was transferred into a 2-mL polypropylene screw-cap vial and diluted 10-fold with 450 μL of water. To a 2-mL polypropylene vial (with two Zr 2.5 mm beads), the following solutions were added and vigorously mixed in a Fast Prep (Thermo-Savant) agitator for one cycle at a speed 5 for 40 s: 50 μL diluted homogenate, 150 μL of 1% aqueous formic acid, 100 μL of 1 μM meso-tetrakis(4-carboxylatophenyl)porphyrin (H2TBAP4+) (internal standard) in methanol, and 100 μL of chloroform/isopropanol (4/1). After centrifugation for 5 min at 13,200 rpm, upper (aqueous) layer and interface layer were aspirated out and 100 μL of organic layer was transferred to polypropylene tube and evaporated to dryness under nitrogen for 40 min. The dried material was dissolved in a 50 μL solution that comprised mobile phase A (see below) +50% ACN, and sonicated for 5 min. Then, 40 μL was transferred into a polypropylene autosampler vial equipped with silicone/PTFE septum. There followed another cycle of centrifugation for 5 min at 5000 × g (4°C), after which the sample was immediately analyzed by LC-MS/MS. Homogenate from nontreated liver samples was used to prepare calibration samples in 0–200 μM range.
Muscle and tumor
Fifty microliters of homogenate was transferred into a 2-mL polypropylene screw-cap vial and diluted 10-fold with 450 μL of water. In a 2-mL polypropylene vial (with two Zr 2.5 mm beads), 50 μL of diluted homogenate, 150 μL 1% formic acid in water, 100 μL of 1 μM H2TBAP (internal standard) in methanol, and 100 μL chloroform/isopropanol (4/1) were added and vigorously mixed in a Fast Prep (Thermo-Savant) agitator for one cycle at a speed 5 for 40 s. After centrifugation for 5 min at 13,200 rpm, upper (aqueous) layer and interface layer were aspirated out and 100 μL of organic layer was transferred to a polypropylene tube and evaporated to dryness under nitrogen for 40 min. The dried material was dissolved with 50 μL of a solution that comprised of mobile phase A (0.1% formic acid in H2O, 5% ACN) +50% ACN, and sonicated for 5 min. Then, 40 μL was transferred into a polypropylene autosampler vial equipped with silicone/PTFE septum. There followed another cycle of centrifugation for 5 min at 5000 × g (4°C), after which the sample was immediately analyzed by LC-MS/MS. Homogenate from nontreated muscle samples was used to prepare calibration samples in 0–10 μM range, and homogenate from nontreated tumor samples was used to prepare calibration samples in 0–30 μM range.
LC-MS/MS analysis of MnPs
LC-MS/MS analyses were performed on Shimadzu 20A series LC and Applied Biosystems MDS Sciex 4000 Q Trap MS/MS spectrometer at Duke Cancer Institute, Pharmaceutical Research Shared Resource, PK/PD Core Laboratory. The use of heptafluorobutyric acid, HFBA, as an ion-pairing agent increases overall lipophilicity/volatility and greatly improves retention and ionization efficiency of pentacationic MnPs, affording an abundance of [MnP5 + + 2HFBA−]3+ and [MnP5+ + 3HFBA−]2+ ions. Using a two Phenomenex C18, 3 × 4 mm precolumn cartridges (AJ0-4287) and the chosen solvent gradient allowed all four atropoisomers of MnPs (47) to collapse into a single peak enhancing the sensitivity (signal to noise) of the method. Elution solvents were A = 0.05% HFBA, 5% ACN in water, B = 0.05% HFBA in ACN. Elution gradient: 0–1 min 5–70% B, 1–2 min 70% B, 2–2.1 min 70–90% B, 2.1–2.6 min 90% B, 2.6–2.8 min 90–5% B. Run time: 5 min. Specific fragmentation mass transitions m/z [MnP5+ + 3HFBA−]2+ to m/z [MnP5+ − alkyl+] were MnTE-2-PyP5+ at m/z 713.3/363.6 with MnTM-2-PyP5+ as internal standard at m/z 685.3/356.6. MnBuOE-2-PyP5+ at m/z = 857.3/599 with MnBuOE-2-PyPd8 as internal standard at m/z = 862.2/603.9. Instrument-specific MS/MS parameters (voltages and gas flow) were optimized within Analyst 1.6.2 software by 10 μL/min infusion of 100 nM MnP in 50% 0.05% HFBA/50% ACN. Calibration samples, typically in 1–300 nM or 0.1–30 μM range (depending on the expected levels of MnP in a particular organ), were prepared by adding known amounts of serially diluted pure analyte standards into homogenates of tissues and were analyzed along with study samples. MnTBAP3−·MnTBAP3− at m/z at 843.0/677.1, with H2TBAP4− as internal standard at m/z 791.2/670.1. The mobile phase A for LC-MS/MS was 0.1% formic acid in H2O, 5% ACN, while mobile phase B was ACN only.
Efficacy studies
Cell viability
Cell lines
We have chosen to continue working with the 4T1 cell line where plenty of mechanistic data already exist. Due to the major impact of MnPs on the inflammatory and immune transcription factor NF-κB, the use of 4T1 mouse cell line allowed us to work with mice having fully functional immune system. 4T1 cells were obtained from the Cell Culture Facility at Duke University and were cultured as previously described at 37°C, 5% CO2 in DMEM (4.5 g/L glucose,
To show that the observed cytotoxic effects are not cell-type specific, we have explored several other types of cancer cells: LLC1 (Lewis lung carcinoma, ATCC® CRL-1642™), FaDu (squamous cell carcinoma, ATCC HTB-43™), DU 145 (prostate carcinoma derived from metastatic site: brain, ATCC HTB-81™), and MDA-MB-231 (mammary gland/breast adenocarcinoma; derived from metastatic site: pleural effusion, ATCC HTB-26™). LLC1 cells were cultured as described for the 4T1 cells. FaDu, MDA-MB-231, and DU145 cells were cultured at 37°C, 5% CO2 in the MEM medium (Earle's salts,
Cell viability
One thousand cells/well (200 μL) were seeded in triplicate onto a 96-well plate and left overnight to adhere. Then, 10 μL of MnP (0.1–5 μM), followed with 10 μL of Asc (0.25–2 mM), was added. One hour afterward, the cells were radiated at 5 Gy. Plates were then kept in a CO2 incubator for 96 h. Cells attached to the plastic substratum were fixed by gently layering 50 μL of cold 50% trichloroacetic acid (TCA; 4°C) on top of the growth medium in each well to produce a final TCA concentration of 10%. Plates were kept in a refrigerator for an hour. They were then washed five times with deionized water and left to air dry until no standing moisture was visible. Fixed cells were stained with 100 μL of 0.4% sulforhodamine B (SRB; Alfa Aesar) dissolved in 1% acetic acid and dark incubated for 30 min. Plates were washed quickly, but carefully, fivefold with 1% acetic acid to remove the excess dye, and left to air dry until no standing moisture was visible. The bound dye was solubilized with 200 μL of 10 mM unbuffered Tris base (pH 10.5) for 30 min on a gyratory shaker. The absorbance was measured in a microplate reader at 690 nm for the background and 510 nm for the dye. Experiments were done in triplicate. The SRB method was effective for in vitro testing with a sensitivity comparable to that of the clonogenic assay [(54) and Refs. within].
Animal tumor growth
Mouse 4T1 breast cancer model
Female 6- to 8-week-old Balb/c mice, weighing on average 20 g (Jackson Laboratory), were used, 12 per group. The doses of MnP, Asc, and RT were based on those previously reported (50). Tumors were established via sc injection of 100 μL suspension of 106 mouse breast cancer cells into the mouse hind leg muscle. We used the muscle from another hind leg as a corresponding normal muscle tissue in all experiments. The treatments with MnP and Asc started 24 h before RT once the tumor volume reached on average 80 mm3 and continued for the rest of the study (50). Mn complexes were injected sc at 2 mg/kg/day. Asc was injected intraperitoneally at 4 g/kg/day for 5 days and continued for the rest of the study with a clinically more relevant dose of 1 g/kg/day; this dose has been used in clinical trial NCT02344355.
Mice were randomized to the following four groups, which were in common with all three MnPs: (i) Control group, (ii) RT, (iii) Asc, and (iv) RT+Asc. Four treatment groups contained MnP: (i) MnP, (ii) MnP+RT, (iii) MnP+Asc, and (iv) MnP+RT+Asc. In a separate study, mice were randomized to the following groups: (i) Control, (ii) RT, (iii) EUK-8+RT, (iv) M40403+RT, (v) EUK-8+RT+Asc, and (vi) M40403+RT+Asc. Tumor volumes were measured daily with Vernier digital calipers and calculated with the following formula: V = length × width × width × 1/2. The humane endpoint was set at an average tumor volume of 1500 mm3. To allow for the clearance of MnP from plasma (that would have affected the evaluation of MnP levels in tissues) (56), mice were sacrificed at 24 h after last treatment and livers, tumors, and muscles from the opposite leg excised and snap-frozen in liquid nitrogen. Mouse weights were measured twice weekly. No significant differences in mouse weights were found among treatment groups during the course of experiments (Supplementary Fig. S4). Animal handling and procedures were approved by the Duke University Institutional Animal Care and Use Committee.
Statistical analysis
The mixed-effects repeated-measures models were estimated for the logarithm of tumor volume. The models are estimated for the experiments performed with MnTE-2-PyP5+ (MnE), MnTnBuOE-2-PyP5+ (MnBuOE), MnTBAP3− (MnTBAP), EUK-8, and M40403 treatments, including the control groups in all five studies, as well as various combinations of these redox drugs with Asc and RT. All estimated models include treatment arms with a linear time trend (baseline being the control group). The model also assumes two mouse-specific random effects, and an autoregressive correlation structure, of order one, within a mouse. In particular, two mouse-specific random effects include random intercept and a random slope on the time variable at a mouse level (the effect of time is thus supposed to be mouse specific). Despite its low value, the variance of this random coefficient on time trend is statistically significant at the level of 5%; the variance of the random intercept is also statistically significant from zero. This is true for all animal studies. The model is estimated using the maximum-likelihood method.
In addition, pairwise comparisons between tumor growth curves in treatment and control groups were conducted. These pairwise comparisons were conducted for the entire period of the experiments, as well as at various points of time, to evaluate the differences after specific durations of the treatment, namely during last periods of the animal studies. Furthermore, additional t-tests were conducted for comparing treatment and control groups at each time point. Finally, the survival curves were constructed for control and for each of the treatment groups (MnE, MnBuOE, M40403, and their combinations with Asc, RT, or Asc/RT) describing fractions of mice with a tumor volume reaching the endpoint at 400 mm3. Statistical analysis was carried out with STATA 14.0 Data Analysis and Statistical Software package.
Footnotes
Acknowledgments
I.B.-H., A.T., and I.S. acknowledge North Carolina Biotechnology BIG Award (No. 2016-BIG-6518) and BioMimetix JVLLC. I.B.-H. and A.T. acknowledge radiation oncology departmental funds. I.S. is grateful for the support to 5-P30-CA14236-29. J.S.R., J.C.B.-J., and R.S.S. acknowledge the Brazilian National Council for Scientific and Technological Development (CNPq, Brazil, 402976/2012-6, 485443/2012-0, 552500/2011-9, 307348/2013-0) and CAPES Foundation (Ministry of Education, Brazil, 24001015030P-4). L.B. acknowledges support from grant MB02/12 from Kuwait University.
Author Disclosure Statement
I.B.-H. and I.S. are consultants with BioMimetix JVLLC and hold equities in BioMimetix JVLLC. I.B.-H., I.S., A.T., and Duke University have patent rights and have licensed technologies to BioMimetix JVLLC.
Abbreviations Used
References
Supplementary Material
Please find the following supplemental material available below.
For Open Access articles published under a Creative Commons License, all supplemental material carries the same license as the article it is associated with.
For non-Open Access articles published, all supplemental material carries a non-exclusive license, and permission requests for re-use of supplemental material or any part of supplemental material shall be sent directly to the copyright owner as specified in the copyright notice associated with the article.
