
Abstract
Aims:
The NOD-like receptor family pyrin domain containing 3 (NLRP3) inflammasome, which is activated by reactive oxygen species (ROS) and repressed by autophagy, has been identified as a novel agent of pulmonary fibrosis. Angiotensin II (AngII), the bioactive pro-oxidant in the renin–angiotensin system, aggravates lung fibrosis. However, the effect of AngII on NLRP3 inflammasome and autophagy in lung fibrosis remains unknown.
This study investigates the potential link between AngII-induced autophagy in the regulation of NLRP3 inflammasome/IL-1β axis in lung fibrosis.
Results:
In vivo, autophagy and the NLRP3 inflammasome were activated in fibrotic patients and positively correlated with oxidation. Treatment with rapamycin promoted autophagy but inhibited oxidation, NLRP3 inflammasome, and lung fibrosis after bleomycin (BLM) infusion. The autophagy inhibitor 3-methyladenine reduced BLM-induced lung fibrosis and concurrently facilitated NLRP3 inflammasome activation and oxidation in fibroblasts. In vitro, AngII promoted intercellular ROS, hydrogen peroxide, and NADPH oxidase 4 (NOX4) protein levels and reduced the glutathione concentration, thereby leading to NLRP3 inflammasome activation and consequent collagen synthesis. AngII induced autophagy, while VAS2870, NOX4, small-interfering RNA (siRNA), and compound C eliminated AngII-induced LC3B augmentation. Moreover, blocking autophagy with bafilomycin A1 or LC3B siRNA resulted in oxidant accumulation, NLRP3 inflammasome hyperactivation, and collagen deposition. Finally, AngII induced P62/SQSTM1, targeting ubiquitinated apoptosis-associated speck-like protein containing a CARD for degradation, thereby contributing to NLRP3 inflammasome inactivation.
Innovation and Conclusion:
Autophagy attenuates pulmonary fibrosis by regulating NLRP3 inflammasome activation induced by AngII-mediated ROS via redox balance modulation.
We demonstrated for the first time that autophagy activated by upregulating the NADPH oxidase-4 (NOX4)-derived, reactive oxygen species (ROS)-mediated ROS/AMP-dependent protein kinase (AMPK) pathway via angiotensin II (AngII)-induced redox imbalance eliminated excessive ROS, contributing to NOD-like receptor family pyrin domain containing 3 (NLRP3) inflammasome inactivation, consequently alleviating pulmonary fibrosis.
Introduction
A
However, little is known regarding the effects of AngII on redox balance or NLRP3 inflammasome activation in lung tissue. Furthermore, AngII has been recognized as an inducer of autophagy (62, 71), serving as a cell protector to suppress excess collagen deposition in cardiomyocytes (47), podocytes (61), vascular smooth muscle cells (65), and macrophages (69), and autophagy deficiency has been reported to contribute to ROS accumulation (70) and exacerbation of cardiac inflammation (70) and cardiac fibrosis (36) induced by AngII. These findings prompted us to investigate the role of AngII-induced autophagy in NLRP3 inflammasome activation during the process of pulmonary fibrosis.
The NLRP3 inflammasome, the most fully characterized member of the inflammasome family, consists of the NOD-like receptor NLRP3, the adaptor molecule apoptosis-associated speck-like protein containing a CARD (ASC), and the effector molecule procaspase-1. This multiprotein complex mediates the cleavage and activation of caspase-1, resulting in the maturation and secretion of inflammatory cytokines such as interleukin (IL)-1β and IL-18 (17, 54, 56). Emerging evidence (15, 56, 60) has suggested that the NLRP3/IL-1β secretion axis may promote pulmonary fibrosis (9, 20) by amplifying the proinflammatory response cascade.
Various pathways have been proposed to regulate the NLRP3 inflammasome, among which ROS represent one of the most important activators. Mitochondrial ROS have been widely implicated in NLRP3 activation (21, 44, 59, 72), whereas the role of NADPH oxidase (NOX) in NLRP3 activation remains controversial (1, 58). In addition, recent studies have provided evidence for the potential role of Nrf2 in the regulation of the NLRP3 inflammasome (49, 64, 69). However, clarification of how the imbalance of redox leads to NLRP3 inflammasome activation and subsequent progression to chronic and devastating diseases remains necessary.
Autophagy, a lysosome-dependent degradation pathway for damaged cytoplasmic constituents resulting from various physiological stresses (13, 30), has been identified as a novel pathogenic process in organ fibrosis. Defective autophagic activity and few autophagosomes were detected in both idiopathic pulmonary fibrosis (IPF) lung tissues (46) and bleomycin (BLM) (7)-treated mice. However, in amiodarone-treated mice, autophagy was activated to promote fibrosis pathogenesis (37). Hence, it is not yet clear whether defective autophagy is causal or merely coincident with IPF.
Recent reports have indicated that autophagy plays an inhibitory role in NLRP3 inflammasome activation and IL-1β secretion (19, 44). The suppression of autophagy, either by knocking out indispensable genes, such microtubule-associated protein1A/1B-light chain 3 (LC3) (44), beclin1 (44), and Atg16L1 (50), or by using pharmaceutical drugs, such 3-methyladenine (3-MA), contributed to NLRP3 inflammasome hyperactivation.
The mechanisms of autophagy-based suppression of inflammasome activation may be indirect and appear to rely on autophagy-dependent mitochondrial homeostasis, which typically suppresses the release of ROS (72) and mitochondrial DNA (44), both of which may activate the inflammasome. Alternatively, autophagic degradation of the inflammasome components (19, 53) has also been proposed. However, some literature suggests that selective autophagy activation contributes to an NLRP3-dependent inflammatory response (11, 33, 68).
Consequently, we hypothesized that the NLRP3 inflammasome, activated by NOX4-derived ROS and suppressed by the Nrf2/antioxidant response element (ARE) pathway, is centrally involved in lung fibrogenesis. Furthermore, we inferred that autophagy ameliorated pulmonary fibrosis via inhibiting NLRP3 inflammasome activation.
The present study aimed to investigate the role of AngII-induced autophagy in the regulation of NLRP3 inflammasome and fibroblast collagen synthesis. We demonstrated that autophagy activated by upregulation of the NOX4-derived ROS-mediated ROS/AMP-dependent protein kinase (AMPK) pathway via AngII-induced redox imbalance eliminated excessive ROS, contributing to NLRP3 inflammasome inactivation, consequently alleviating pulmonary fibrosis.
Results
NOX4 and NLRP3 expression and fibroblast autophagy were elevated in patients with lung fibrosis
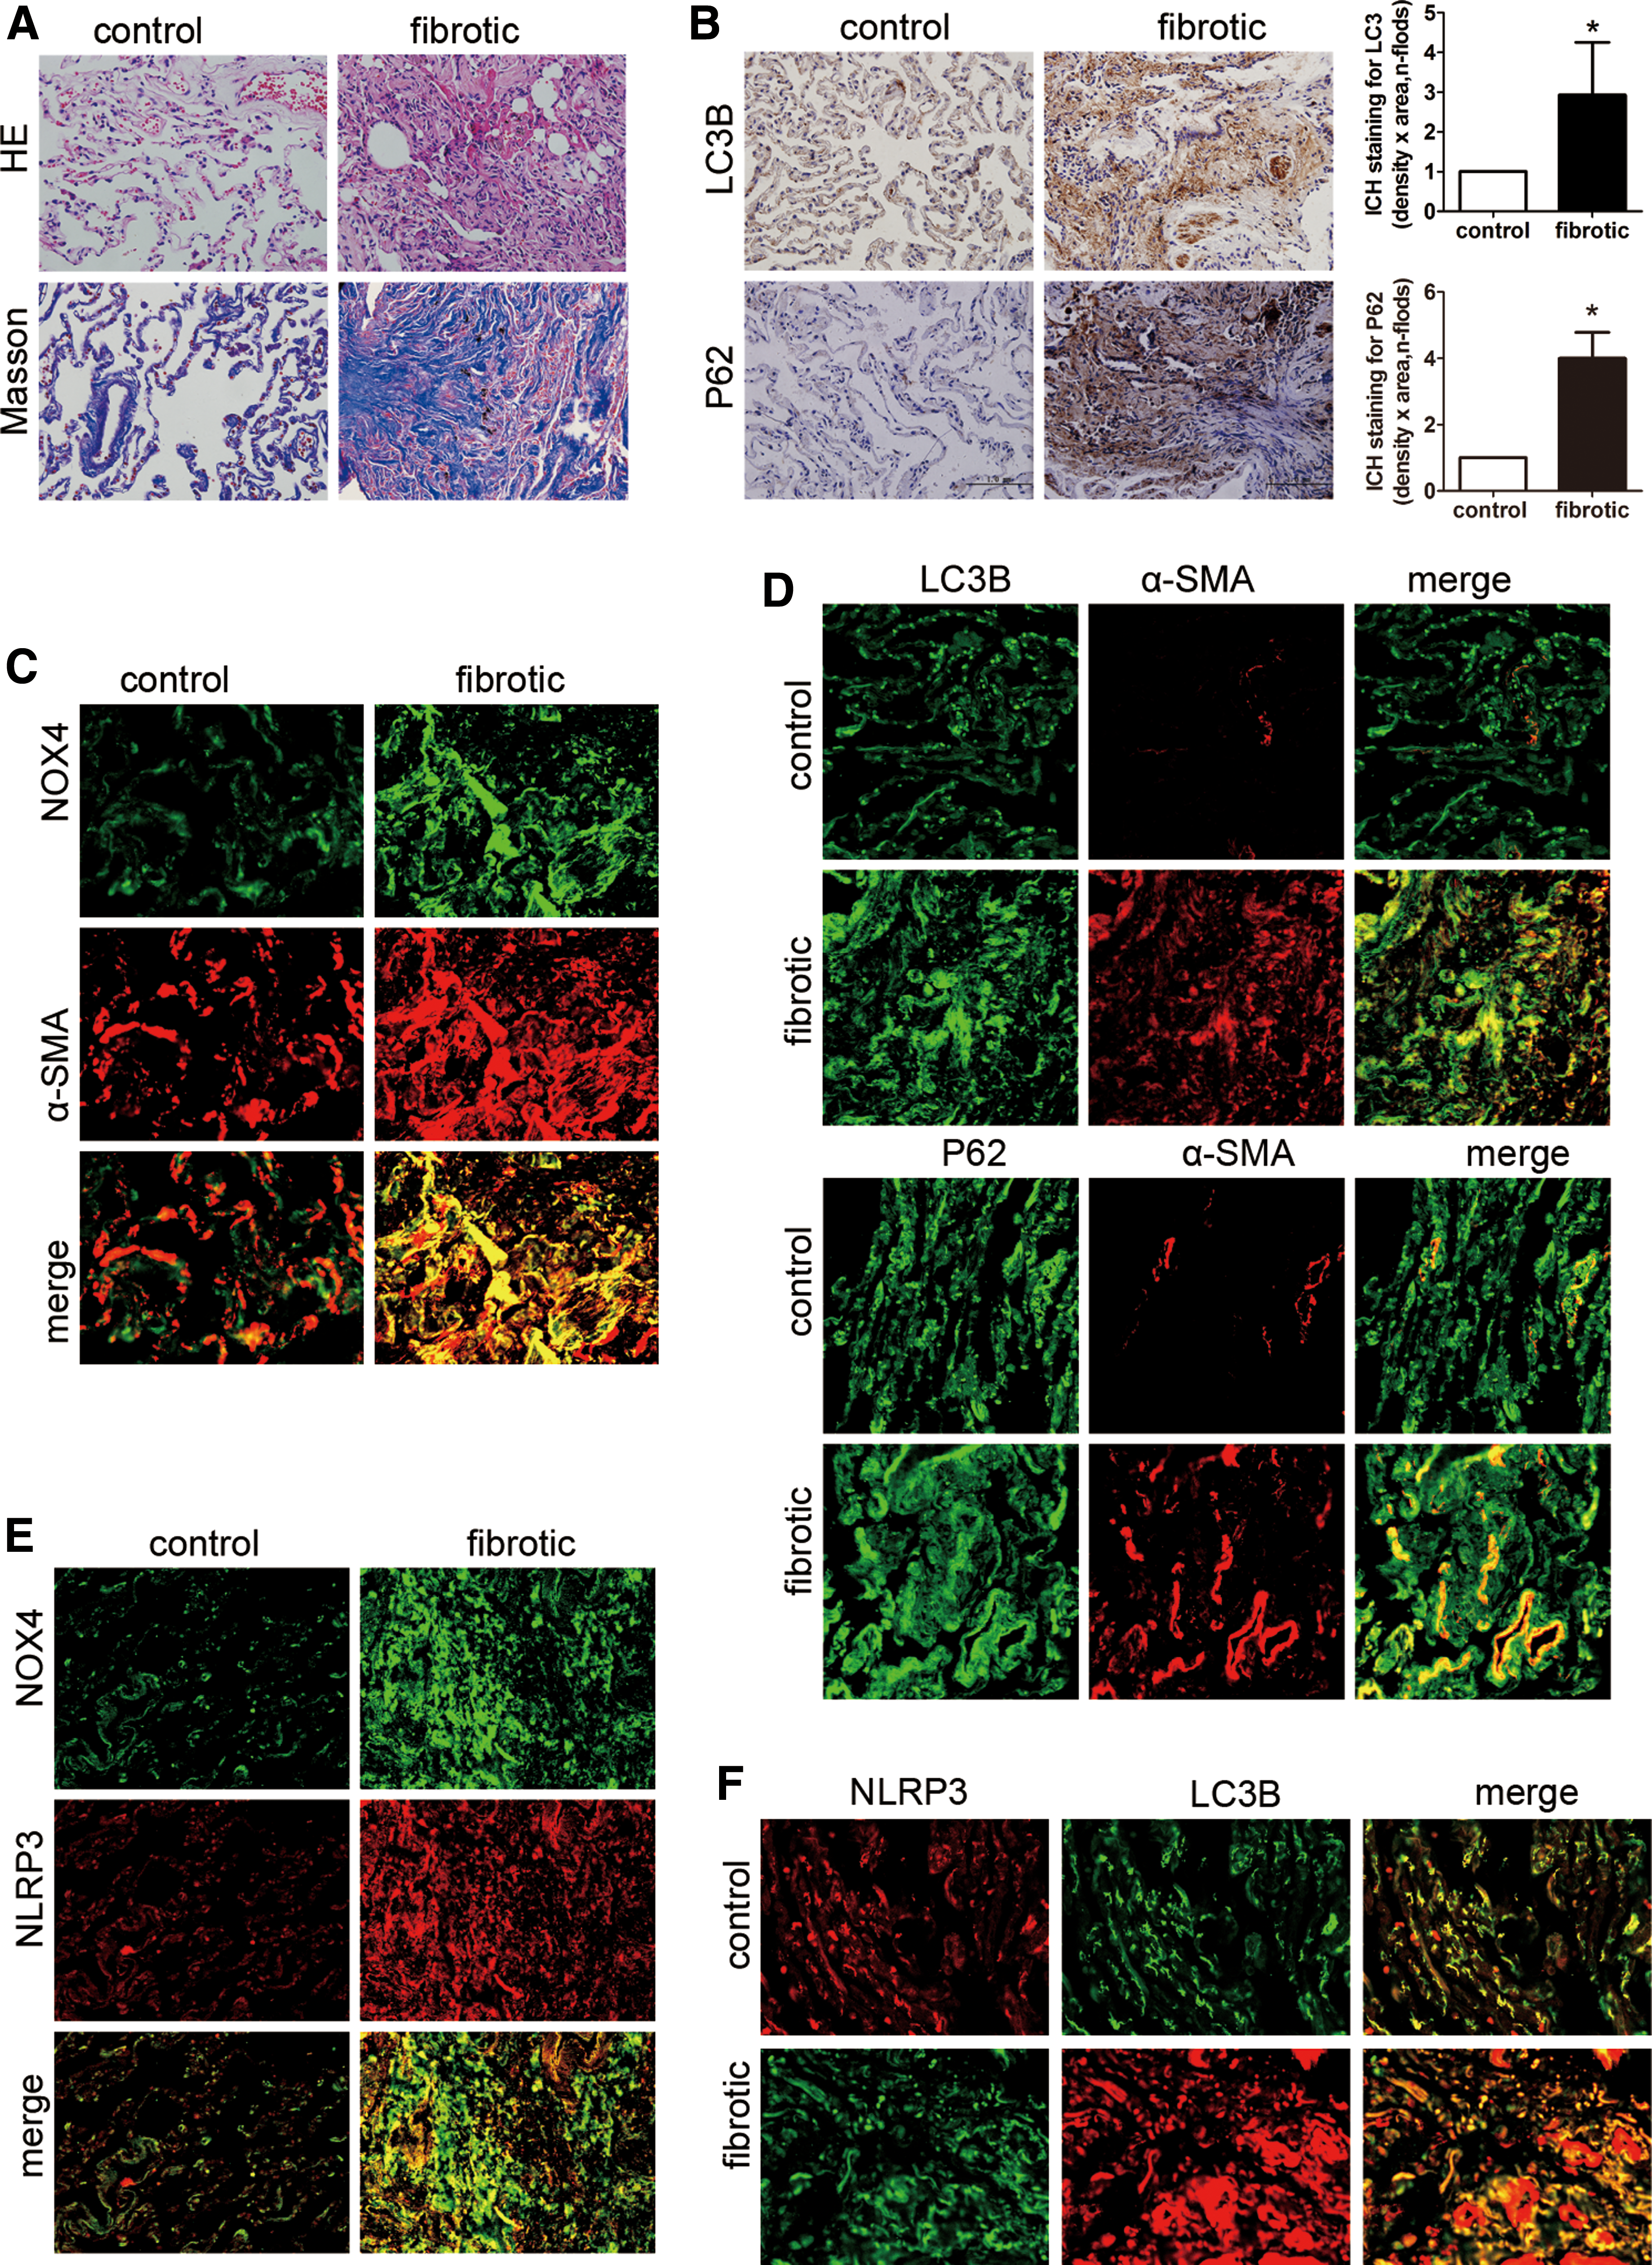
Pulmonary fibrosis in the patients was confirmed by hematoxylin and eosin and Masson's trichrome staining (Fig. 1A). Immunohistochemical staining indicated that the LC3B and P62/sequestosome1 (SQSTM1) protein levels were elevated in fibrotic lung tissue (Fig. 1B), indicating increased autophagosomes in lung fibrogenesis. Double staining showed that NOX4, LC3B, and P62/SQSTM1 proteins colocalized with α-smooth muscle actin (α-SMA)-positive cells (Fig. 1C, D), indicating that in lung fibrogenesis, NOX4-derived ROS, NLRP3 inflammasome/IL-1β axis secretion, and autophagy activation are closely linked in fibroblasts. The increased colocalization of NLRP3 with NOX4 and LC3B confirmed this conclusion (Fig. 1E, F).
AngII infusion aggravated the redox imbalance, NLRP3 inflammasome activation, and autophagy in BLM-induced lung fibrosis
Compared with the control rats, BLM-treated rats displayed higher Ashcroft scores and severe collagen deposition, with marked mononuclear infiltration and thickened alveolar septa throughout the lung parenchyma. These findings were strikingly aggravated by AngII infusion (Fig. 2A). In addition, NOX4 protein and hydrogen peroxide (H2O2) production was increased in BLM-induced rats and augmented by AngII infusion (Fig. 2B, C). Furthermore, increased colocalization of NOX4 and α-SMA was detected in the fibrotic lung tissue compared with the negative groups (Fig. 2E). These findings implied that NOX4 mediated the fibrotic effects of lung fibroblasts. Enhanced Nrf2 and glutamate-cysteine ligase catalytic subunit (GCLC) protein levels were identified in both the BLM and BLM + AngII groups (Fig. 2B), indicating that increases in these antioxidants tend to compensate for the harmful stimulation. Interestingly, glutathione (GSH) production was substantially reduced in the BLM group and further decreased after AngII infusion (Fig. 2D). Thus, AngII promoted the redox imbalance in BLM-induced lung fibrosis.
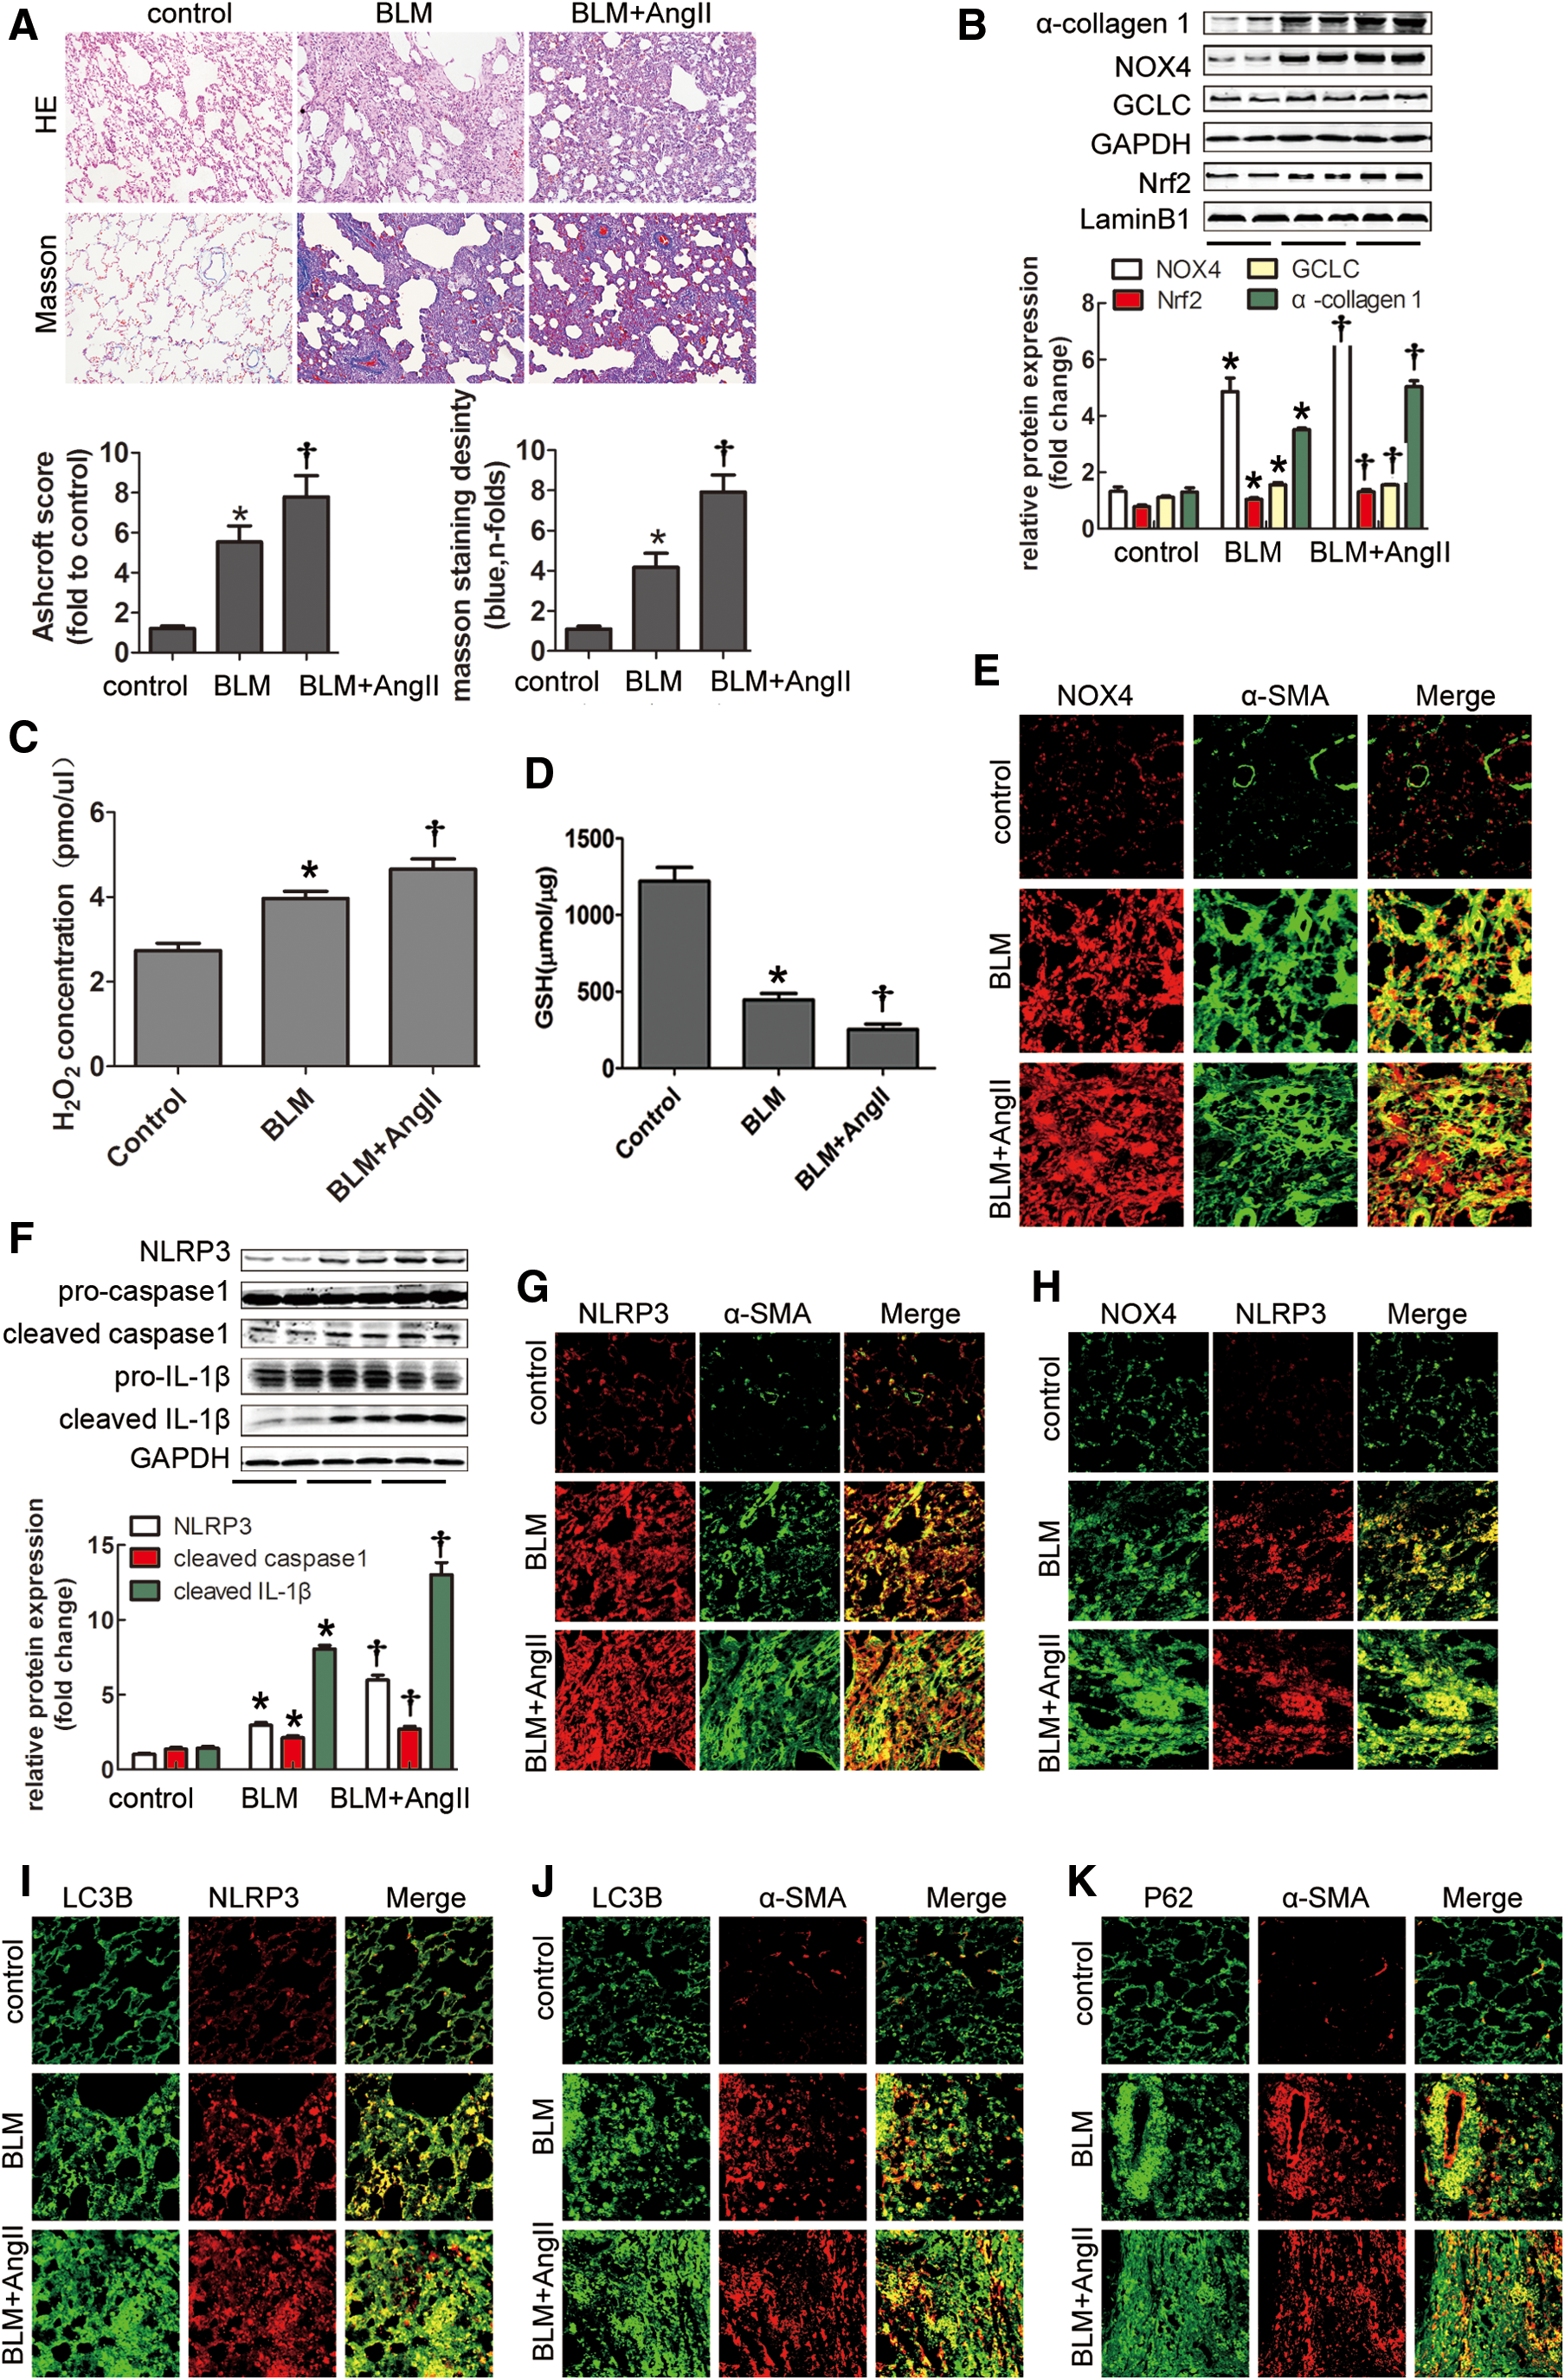
Consistent with the results observed in patients, the components of the NLRP3 inflammasome were prominently upregulated by BLM and aggravated by AngII administration (Fig. 2F). Furthermore, NLRP3 was colocalized with α-SMA, as well as NOX4 (Fig. 2G, H), indicating that NLRP3 participated in the fibrotic effects of lung fibroblasts and may be NOX4 dependent. Moreover, enhanced colocalization of NLRP3 and LC3B was detected in the fibrotic lungs induced by BLM or AngII supplementary infusion (Fig. 2I), implying that autophagy may participate in NLRP3 inflammasome regulation in lung fibrosis.
More α-SMA-positive cells coexpressing LC3B or P62/SQSTM1 protein were observed in fibrotic rat lungs (Fig. 2J, K), indicating increased autophagosomes in lung fibrogenesis induced by BLM or AngII treatment. To clarify whether the increase in autophagosomes reflected an increase in autophagy flux or a reduction in autophagosome turnover, the lysosomal pathway was examined. Immunocytochemistry showed an increased number of cathepsin D- or lysosomal-associated membrane protein 1 (LAMP1)-positive dots in the lung tissue after BLM or AngII infusion (Supplementary Fig. S1A; Supplementary Data are available online at
Effect of autophagy on BLM-induced pulmonary fibrosis
To investigate the role of autophagy in lung fibrosis, rapamycin and 3-MA were administered via intraperitoneal injection. Consistent with the findings in rats, the fibrosis score, area density of Masson’ trichrome staining, hydroxyproline content, and collagen protein levels were augmented in BLM-infused mice. When the autophagic activity was blocked with 3-MA, the fibrosis score and collagen deposition were substantially increased. However, the profibrotic effect of BLM was reversed by rapamycin (Fig. 3A, B). These findings confirmed the antifibrotic role of autophagy in pulmonary fibrosis.

To further investigate the particular mechanism that is regulated by autophagy in lung fibrosis, we measured the protein expressions in the tissue homogenate. Western blotting and immunohistochemical staining demonstrated that BLM-induced NOX4 and NLRP3 inflammasome was suppressed by rapamycin and enhanced by 3-MA (Fig. 3C, D). In addition, BLM-induced H2O2 production could be inhibited by rapamycin but increased by 3-MA, illustrating that autophagy negatively regulated NLRP3 inflammasome activation and oxidation (Fig. 3E). Moreover, immunohistochemical staining of LC3B, α-SMA, SP-C (a marker for type II alveolar epithelial cells), and F4/80 (a marker for alveolar macrophages) in serial sections (Supplementary Fig. S2) showed that LC3B mainly localized in α-SMA-positive and SP-C-positive cells. Overall, autophagy could protect the lungs from fibrogenesis by inhibiting NLRP3 inflammasome hyperactivation and oxidation induced by BLM.
Redox imbalance was required for AngII-induced α-collagen I synthesis in lung fibroblasts
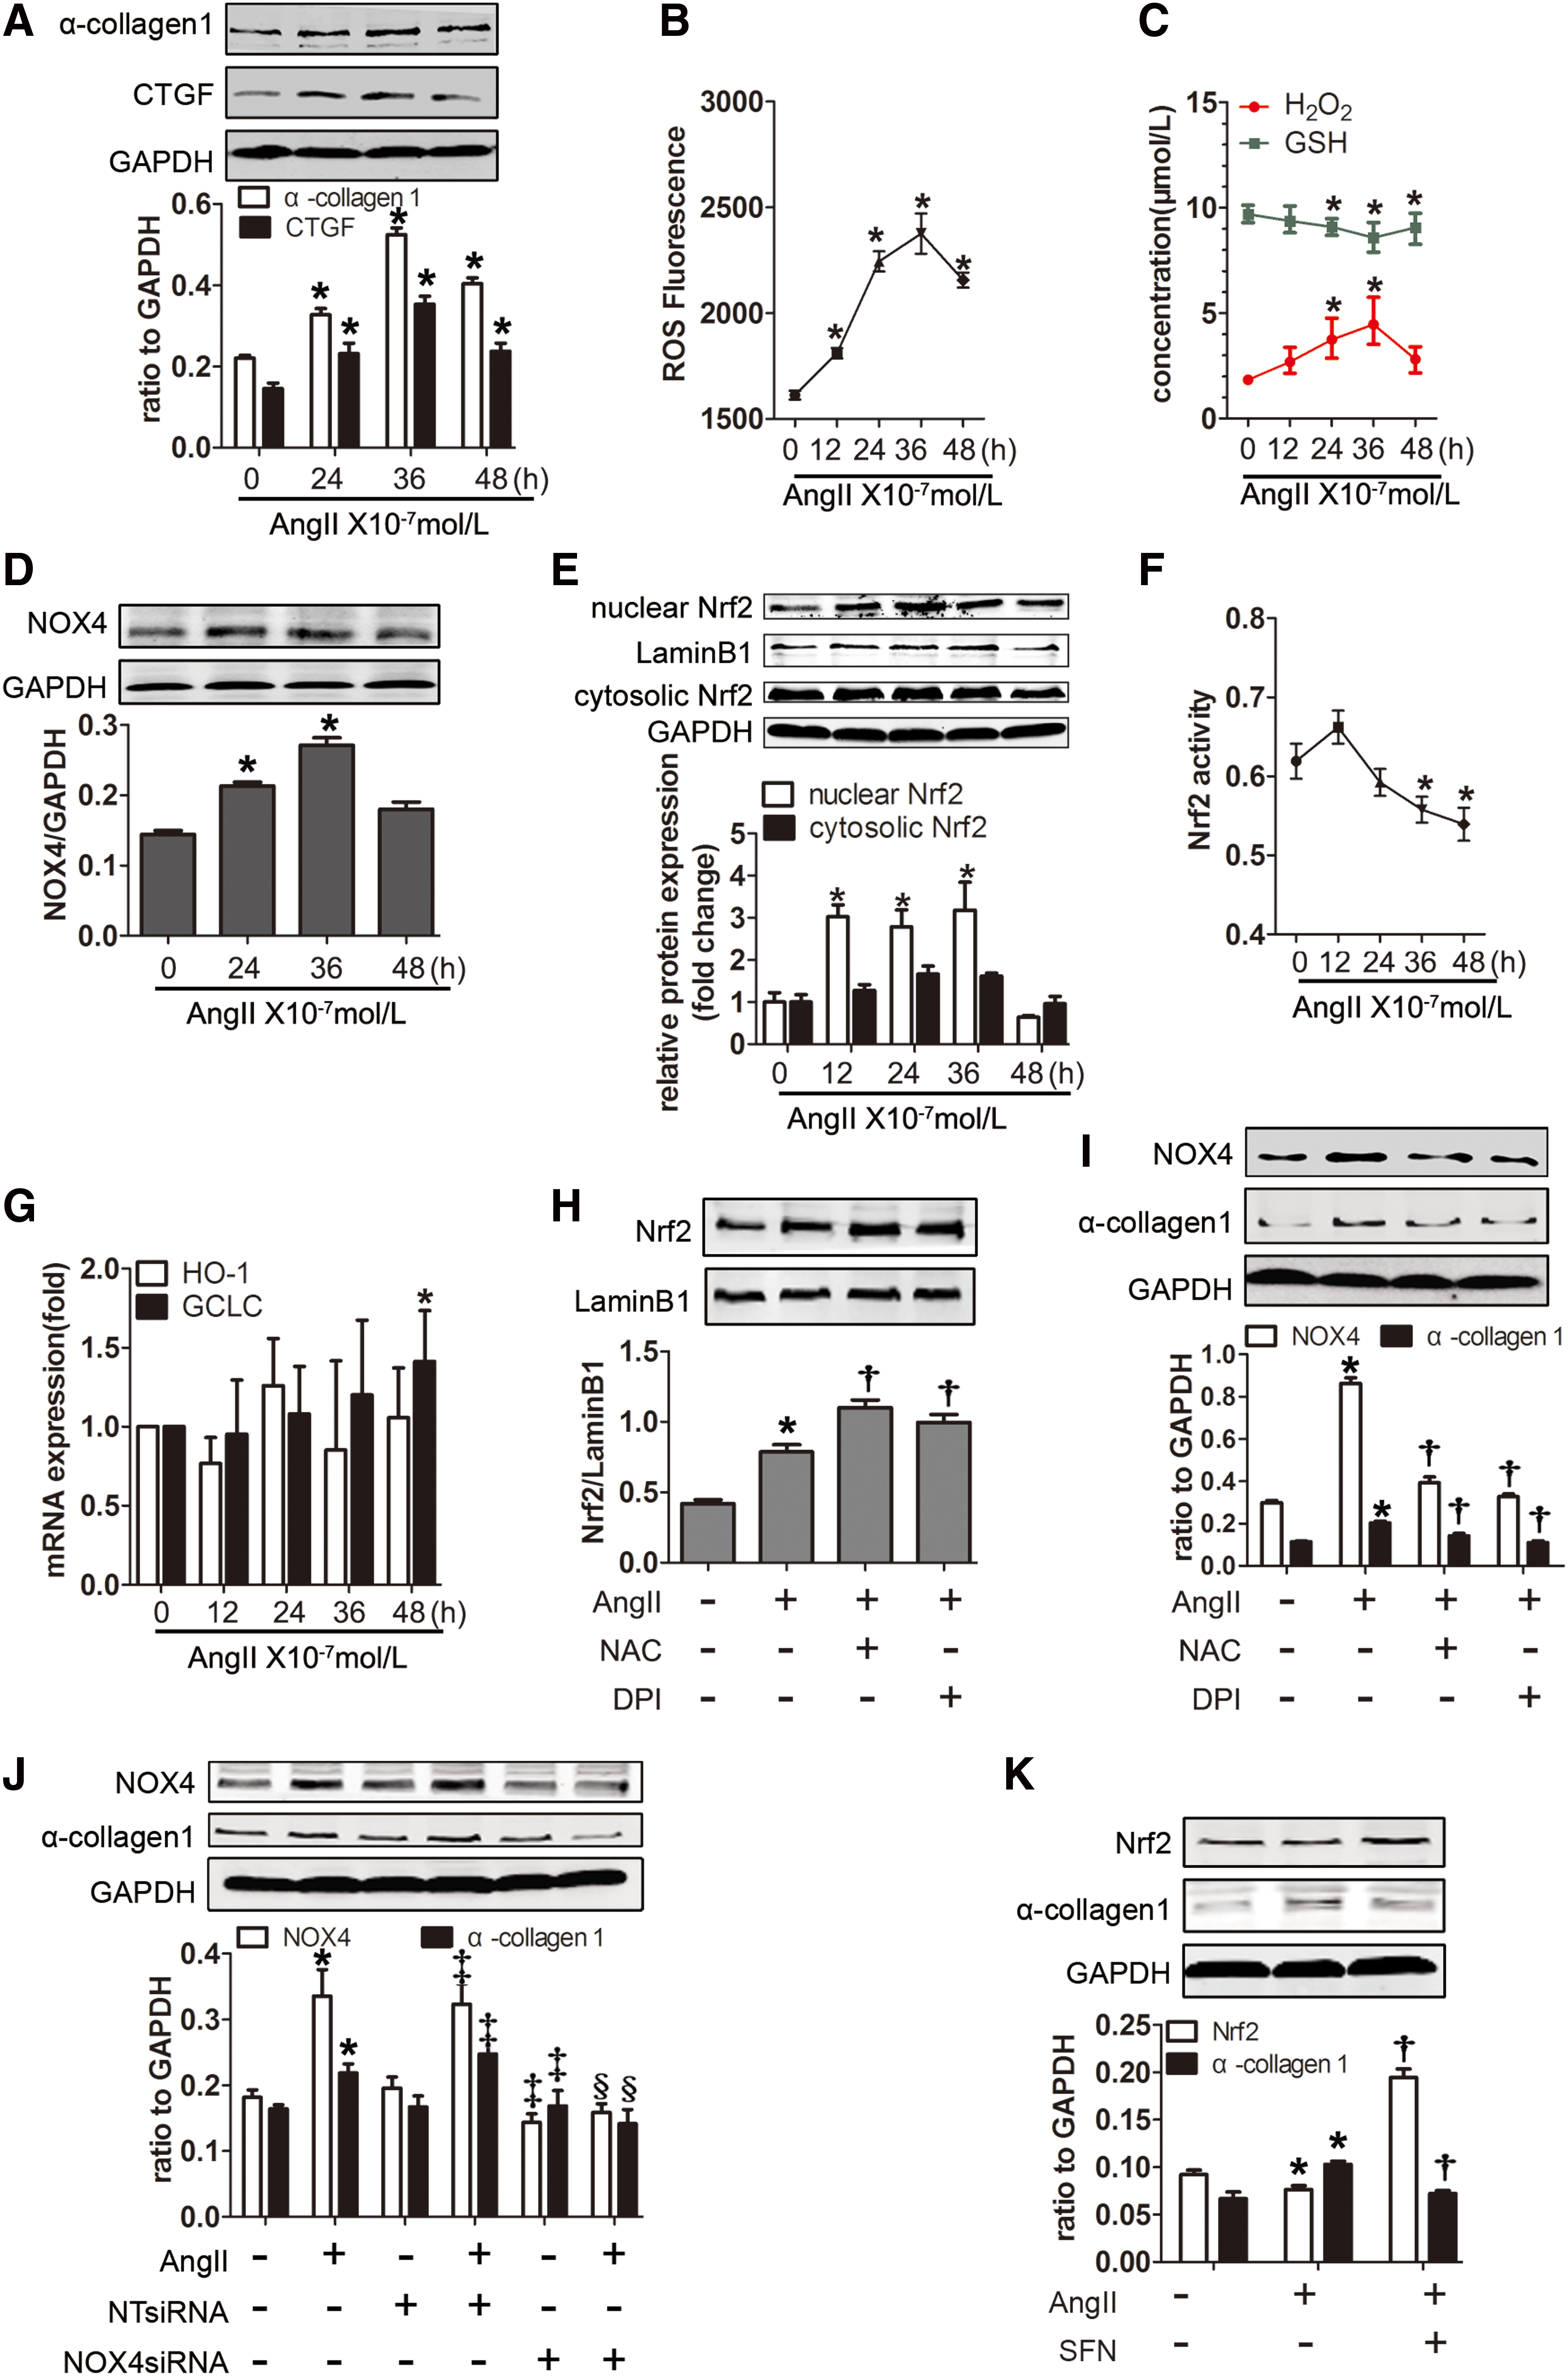
We showed in vivo that redox imbalance was critical for the process of lung fibrosis; thus, we subsequently investigated whether AngII could induce a redox imbalance and thus leading to collagen synthesis in lung primary fibroblasts. First, the enhancement of connective tissue growth factor (CTGF) and α-collagen I protein induced by AngII confirmed its profibrotic effect in fibroblasts (Fig. 4A). We subsequently determined that treatment with AngII enhanced the production of ROS and H2O2, whereas the GSH content declined (Fig. 4B, C). Accordingly, NOX4 was remarkably increased in response to AngII treatment (Fig. 4D). The levels of intranuclear Nrf2 protein expression increased after 12 h of incubation with AngII, while no changes were detected in the cytosolic fractions (Fig. 4E). The Nrf2 activity mildly increased at 12 h after exposure to AngII but dropped down after 36 h (Fig. 4F). Similarly, heme oxygenase 1 (HO-1) and GCLC, Nrf2-ARE-responsive products, were slightly increased, yet fluctuated (Fig. 4G). Moreover, the Nrf2 expression was increased by antioxidants (Fig. 4H). We also determined that blocking ROS with N-acetylcysteine (NAC), diphenyleneiodonium (DPI), or NOX4 small-interfering RNA (siRNA) or elevating the antioxidative capacity with the Nrf2 activator sulforaphane (SFN) notably inhibited the AngII-induced α-collagen I protein expression (Fig. 4I–K). These findings indicate that AngII induced a strong pro-oxidant effect and a minor antioxidant effect, which may be regarded as an incomplete negative feedback for the oxidation.
AngII treatment mildly impairs mitochondrial homeostasis
The AngII-induced NLRP3 inflammasome was colocalized with mitochondria; thus, the effect of AngII on mitochondrial function was detected. As shown in Supplementary Figure S3A, AngII had only a minor effect on mitochondrial membrane depolarization, whereas the respiratory chain uncoupler carbonyl cyanide 3-chlorophenylhydeazone (CCCP) resulted in a significantly decreased mitochondrial membrane potential. Furthermore, unlike rotenone, AngII only increased mitochondrial ROS by a small amount (Supplementary Fig. S3B). Rotenone treatment decreased the percentage of intact (MitoTracker Deep Red-MitoTracker Green positive) mitochondria from 87.6% to 68.9% of the total mitochondria, reflecting increase in mitochondrial injury index. In contrast, AngII failed to increase the damaged mitochondrial index (Supplementary Fig. S3C). Finally, AngII decreased the adenosine triphosphate (ATP) level (Supplementary Fig. S3D), which represents the mitochondrial function. Together, these findings suggested that the effect of AngII on mitochondrial function was mild compared with its positive control (CCCP and rotenone).
Redox disequilibrium was required for NLRP3 inflammasome activation-induced collagen synthesis in lung fibroblasts
As shown in Figure 5A and B, AngII-induced NLRP3 aggregated in the cytoplasm and colocalized with ASC and caspase-1. Interestingly, a majority of the complexes where located in mitochondria, suggesting that NLRP3 inflammasome may assemble in mitochondria. Western blotting demonstrated that NLRP3 and the active, cleaved form of caspase-1 were significantly enhanced by AngII (Fig. 5C). Moreover, caspase-1 activity and IL-1β production were abundantly increased after AngII treatment (Fig. 5D, E).

Furthermore, AngII induced NOX4 and NLRP3 colocalization in mitochondria (Fig. 6A), which indicated a close connection between NOX4 and NLRP3 in mitochondria. To confirm the NLRP3 and NOX4 association with the mitochondria observed via confocal microscopy, subcellular fractionation studies were performed. The expression of NOX4 and NLRP3 in mitochondria was enhanced by AngII, while abolished by preincubation with DPI or mitochondria 2,2,6,6-tetramethylpiperidinyloxy (mito-TEMPO) (Fig. 6B), indicating that both NOX4-derived ROS and mitochondrial ROS (mito-ROS) contributed to NLRP3 localization in mitochondria. Pretreatment with antioxidants such as NAC, DPI (Fig. 6C), and NOX4 siRNA (Fig. 6D) abolished AngII-induced NLRP3 inflammasome component expression. Amplifying the antioxidative capacity with SFN also inhibited caspase-1 activity, IL-1β cleavage, and NLRP3 expression (Fig. 6E), demonstrating that ROS, particularly NOX4-dependent ROS, play an indispensable role in NLRP3 inflammasome activation.

Finally, pretreatment with either NLRP3 siRNA (Fig. 6F) or the caspase-1-targeted inhibitor AC-YVAD-CMK (Fig. 6G) attenuated AngII-induced collagen synthesis, with less caspase-1 activation and IL-1β cleavage, implying the essential role of NLRP3 inflammasome in AngII-induced collagen synthesis.
AngII activated autophagy in an ROS/AMPK-mediated pathway
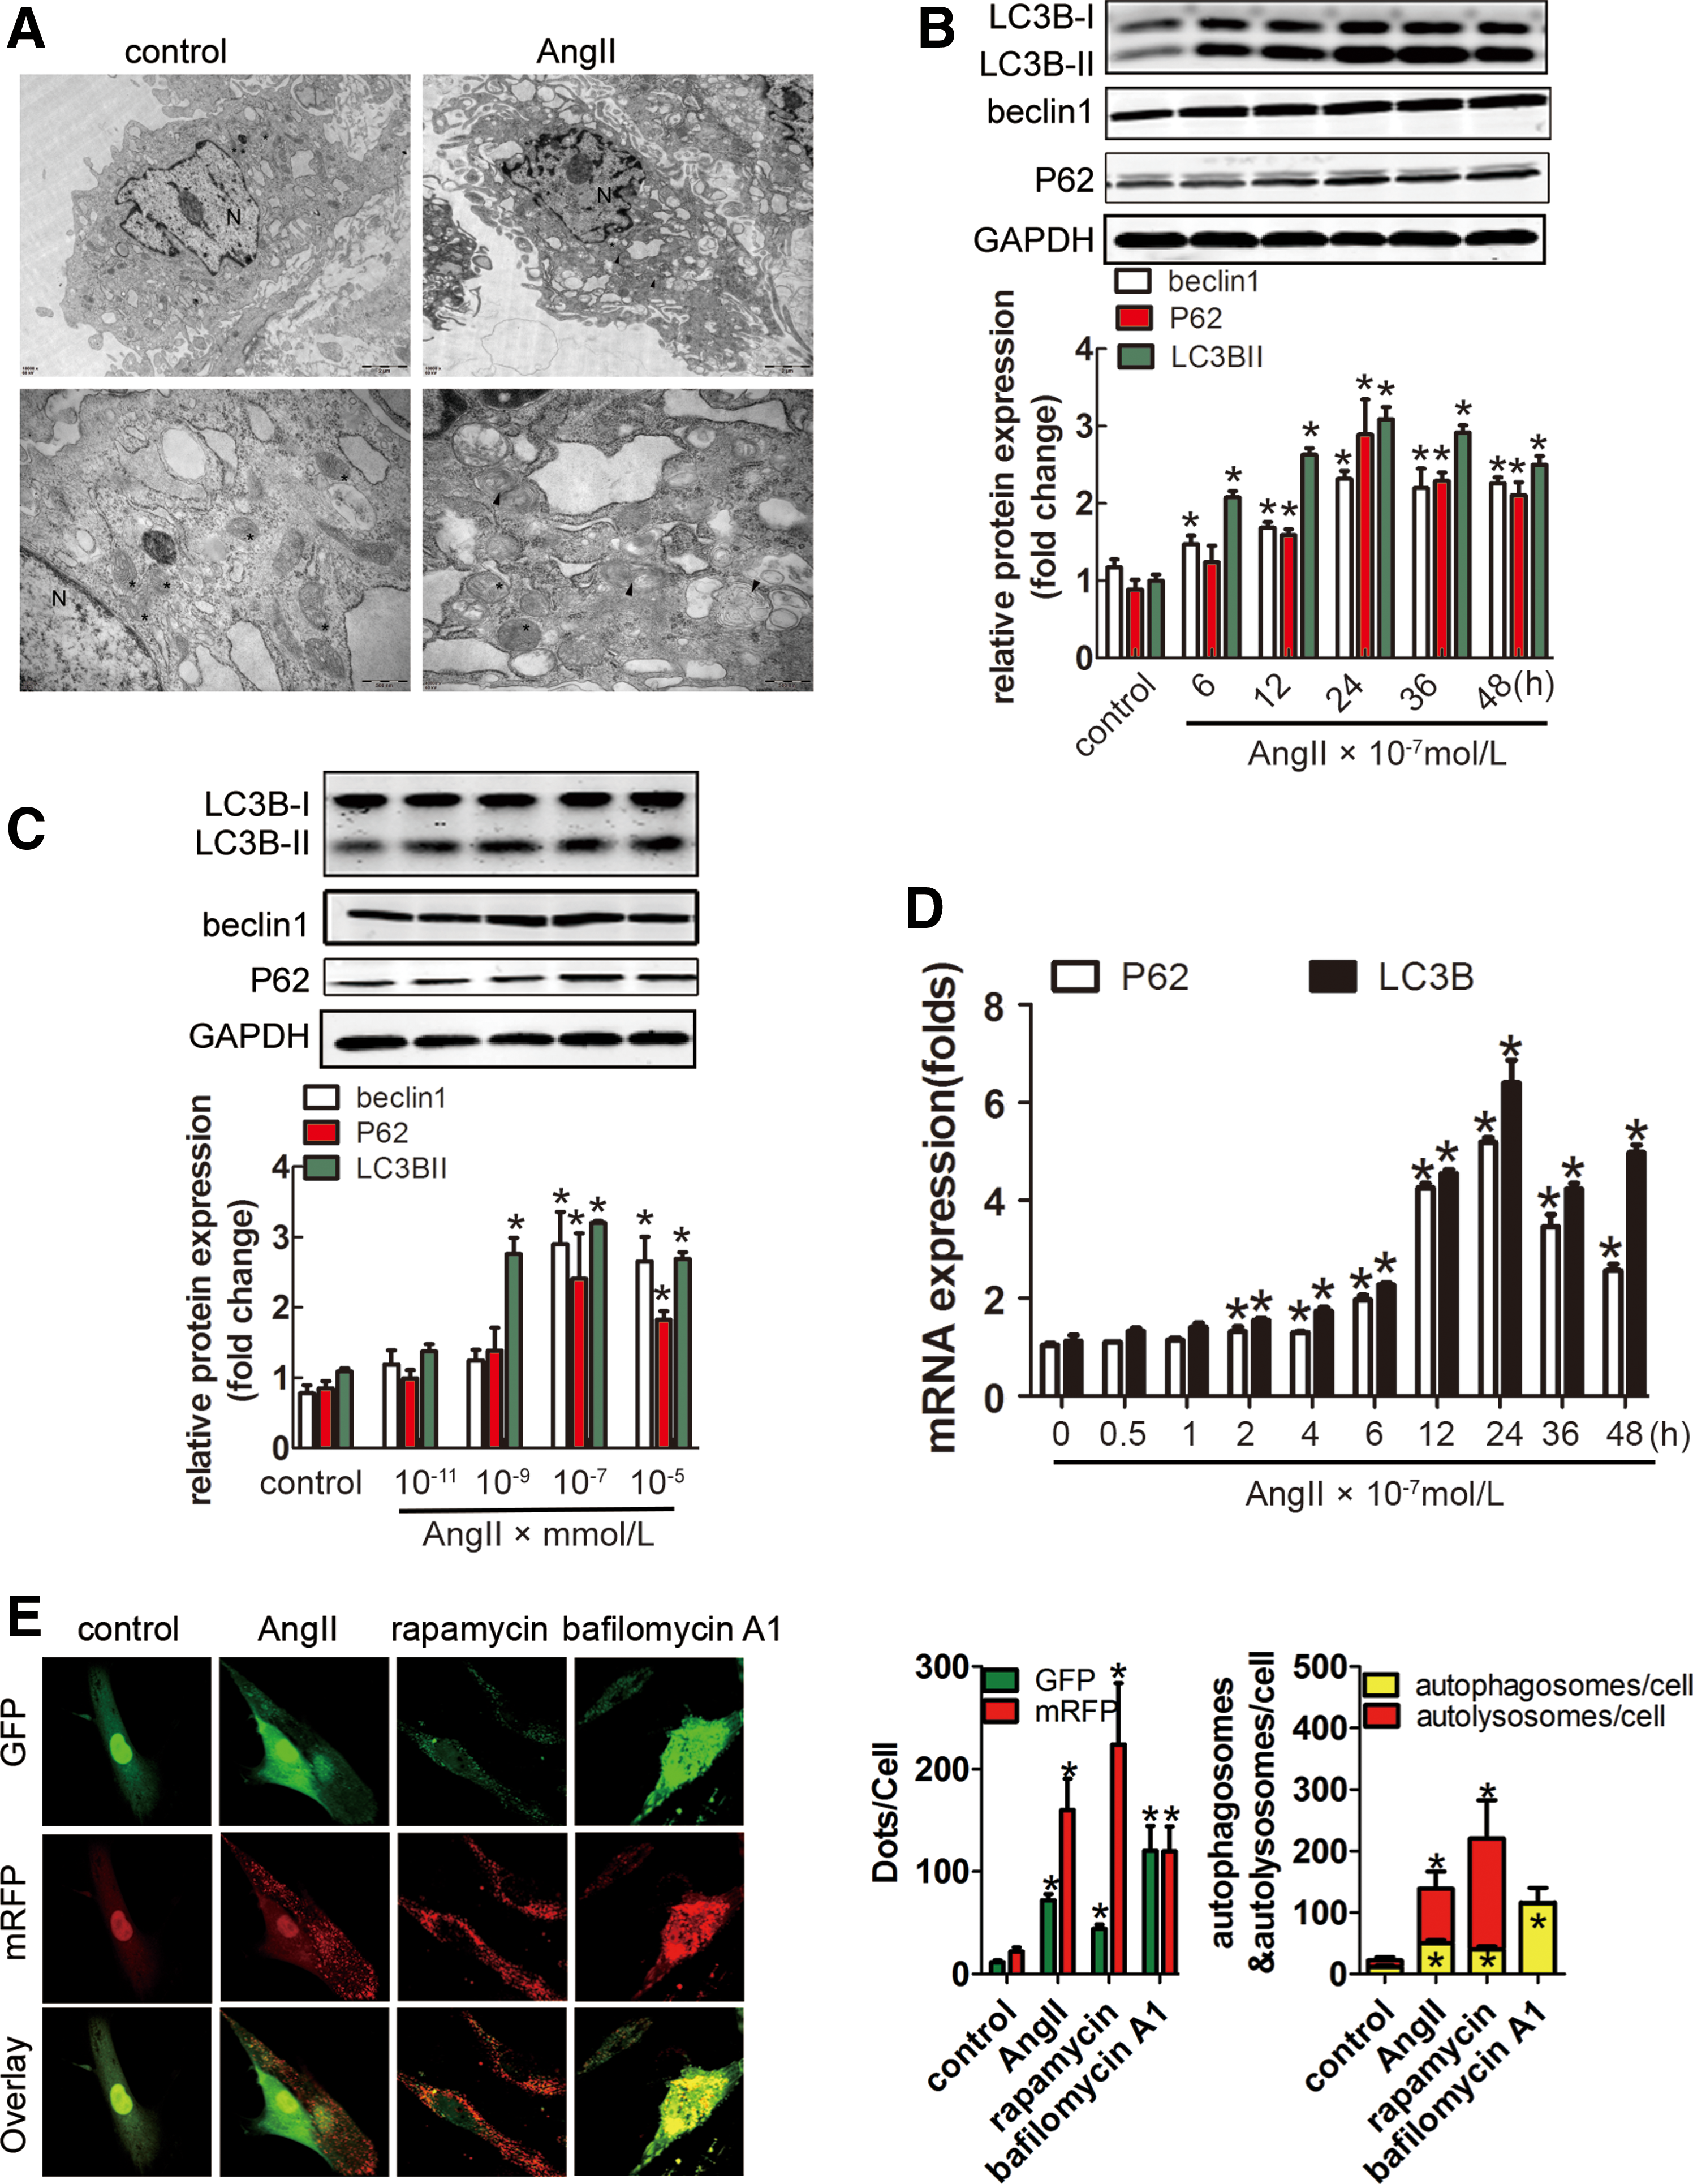
Transmission electron microscopy (TEM) showed increasing numbers of autophagosomes induced by AngII (Fig. 7A). LC3 processing (indicated by an increase in the ratio of LC3-II to LC3-I), as well as beclin1 protein, was enhanced after AngII stimulation (Fig. 7B, C). Levels of P62/SQSTM1 (a chaperone molecule carrying cargo to the autophagosome for degradation) negatively correlate with autophagic activity. However, we observed higher amounts of P62/SQSTM1 in AngII groups than control. This finding raised a question of whether autophagy AngII induction was impaired or not. However, the transcript levels of LC3B and P62 were increased by AngII (Fig. 7D). In addition, autophagic flux test showed that AngII induced complete autophagic flux in lung fibroblasts, similar to the autophagic flux inducer rapamycin (Fig. 7E).
We subsequently investigated how AngII induced fibroblast autophagy. First, AngII increased the phosphorylation of AMPK and the expression of downstream molecules, including unc-51 like autophagy activating kinase 1 (ULK1) and beclin1 (Fig. 8A). In addition, the AngII-intensified AMPK phosphorylation level and subsequent enhancement of LC3B were abolished by VAS2870, the NOX4-targeted inhibitor, or NOX4 siRNA (Fig. 8B, C). Meanwhile, DPI could neutralize AngII-induced LC3B-II augmentation (Fig. 8D). mito-TEMPO was also identified to eliminate AngII-induced AMPK pathway activation (Fig. 8E). Finally, when pretreated with compound C, an AMPK inhibitor, the increased expression of LC3B-II was eliminated (Fig. 8F), indicating that AngII-induced autophagy relied on AMPK pathway activation. Altogether, these results reveal that AngII-induced ROS, from both mitochondria and NOX, particularly NOX4, were requisite for AMPK/ULK1 pathway activation and subsequent autophagy induction.

Autophagy suppressed NLRP3/IL-1β secretion by eliminating ROS and alleviating mitochondrial dysfunction
Double staining revealed that LC3 colocalized with NLRP3 and ASC, suggesting a close link between autophagy and NLRP3 inflammasome (Fig. 9A, B). Blocking autophagy with bafilomycin A1 or LC3B siRNA increased NLRP3 and IL-1β in the cell lysate (Fig. 9C, D), indicating that autophagy negatively regulated NLRP3 inflammasome activation.

How does autophagy negatively regulate NLRP3 inflammasome activation? The use of rapamycin resulted in a substantial reduction in ROS, H2O2 production, and ATP accumulation, whereas bafilomycin A1 displayed the opposite tendency (Fig. 9E), suggesting that autophagy could clear the excessive accumulation of oxidant products induced by AngII.
The finding that bafilomycin A1 notably reduced the ATP concentration prompted us to assess the effect of autophagy on the other mitochondrial index. Consistent with the results in Supplementary Figure S3. A, the green fluorescence was not significantly altered by AngII treatment. However, a significant increase was identified in the bafilomycin A1 pretreatment group, indicating that impaired autophagy could lower the mitochondrial membrane potential (Supplementary Fig. S4A). Furthermore, compared to AngII alone, bafilomycin A1 pretreatment increased the mitochondrial superoxide levels in cells (Supplementary Fig. S4B). In addition, the growing overlap between LC3B and mitochondria after AngII stimulation indicated that mitophagy may be induced by AngII (Supplementary Fig. S4C). Mitochondrial fractionation studies confirmed this hypothesis. LC3B and P62/SQSTM1 were detected in mitochondria and increased after AngII treatment but were notably enhanced when preincubated with bafilomycin A1 (Supplementary Fig. S4D), indicating that mitophagy may be induced by AngII. Taken together, these findings indicated that NLRP3 inflammasome could be inactivated by autophagy via eliminating the ROS (both intracellular and mitochondrial ROS) and being destroyed by mitophagy.
Autophagy limits IL-1β production by targeting the ubiquitinated inflammasome for degradation
The autophagic adaptor P62/SQSTM1 links ubiquitinated substrates to the autophagy pathway, which was confirmed by the double immunofluorescence staining of P62/SQSTM1 and ubiquitin in Figure 9F. In addition, increased colocalization between P62/SQSTM1 and ASC was induced by AngII (Fig. 9G), suggesting that ASC or an ASC-associated protein was ubiquitinated after NLRP3 inflammasome induction through binding to P62/SQSTM1. Immunoblot analysis was performed to investigate whether ASC underwent ubiquitination. Without AngII, small amounts of ubiquitinated proteins immunoprecipitated together with ASC; however, after AngII treatment, we identified a prominent smear of ubiquitinated proteins (Fig. 9H). Furthermore, pretreatment with MG132, an ubiquitin–proteasome inhibitor, exerted no additional ubiquitinated protein accumulation. These indicated that autophagy but not the proteasome regulated the degradation of the polyubiquitinated ASC aggregates.
Despite delivering ubiquitinated ASC to autophagosomes for degradation, P62/SQSTM1 positively facilitates Nrf2-ARE-mediated antioxidation. The protein expression of both Nrf2 and GCLC was diminished by P62/SQSTM1 siRNA pretreatment (Supplementary Fig. S5A). However, NOX4 and cleaved IL-1β protein levels were increased by P62/SQSTM1 siRNA (Supplementary Fig. S5A). Interestingly, P62/SQSTM1 expression was controlled by Nrf2. P62/SQSTM1 augmentation was eliminated by Nrf2 siRNA (Supplementary Fig. S5B). These results indicated that P62/SQSTM1 might also negatively regulate the NLRP3 inflammasome through a positive feedback loop between P62/SQSTM1 and Nrf2-ARE, leading to the activation of antioxidant reactions.
Autophagy affects inflammasome activity in primary human cells
Next, we investigated whether autophagy regulates inflammasome activity in primary human fibroblasts. Increased IL-1β secretion and LC3B processing were induced in MRC-5 cells treated with AngII (Supplementary Fig. S6A). Autophagic flux test further demonstrated that autophagy flux induced by AngII is sufficient (Supplementary Fig. S6B). Exposure to either bafilomycin A1 or LC3B siRNA increased IL-1β production and collagen deposition in human fibroblasts (Supplementary Fig. S6C, D). These results indicated that, similar to the results obtained with rat primary fibroblasts, inflammasome activation in human fibroblasts was modulated by the amount of autophagy.
Discussion
In the present study, the multiple roles of AngII in lung fibrosis were investigated, demonstrating AngII as an inducer of both collagen synthesis and autophagy and collagen degradation. The following principal findings were obtained. (i) Redox imbalance is critical for AngII-induced lung fibroblast α-collagen I synthesis via NLRP3 inflammasome activation. (ii) The NLRP3 inflammasome was downregulated by ROS/AMPK-mediated autophagy. (iii) AngII induced mitophagy to maintain mitochondrial homeostasis and thus limit mito-ROS production. (iv) P62/SQSTM1 plays a pivotal role in the downregulation of NLRP3 inflammasome activation by creating a positive feedback loop between P62/SQSTM1 and Nrf2-ARE, as well as by delivering ubiquitinated ASC to autophagosomes for degradation.
ROS, which resulted from an imbalance between oxidation reactions and antioxidation reactions, were crucial for the pathogenesis of lung fibrosis (6, 8, 24, 28). A previous study established that NOX4, rather than the other four forms of NOX, played a key role in BLM- or AngII-induced lung fibrosis (39, 40). Here we confirmed that NOX4-derived ROS were required for AngII-induced collagen generation in vivo and in vitro. Nrf2-ARE activated cellular rescue responses against oxidative injury, which sequentially alleviated lung fibrosis. Increasing evidence has indicated that the absence or decline of Nrf2 contributed to lung fibrosis progression (3, 55). Inconsistent with these studies (35), we determined that the Nrf2 messenger RNA (mRNA) and protein levels were augmented after AngII treatment in both rats and fibroblasts. However, the concentration of GSH, the most significant ARE encoded by Nrf2, was decreased by AngII. Thus, the impaired Nrf2 activation may be considered a compensation for oxidative stress and was insufficient to protect against lung fibrosis.
How does the AngII-induced redox disproportion aggravate lung fibrosis? Novel evidence has suggested that the NLRP3 inflammasome plays a critical role in lung fibrosis progression (10, 15, 20, 54). By blocking the inflammasome with the caspase-1 inhibitor YVAD or NLRP3 siRNA, the present study was the first to demonstrate that NLRP3 inflammasome complex depletion ameliorated AngII-induced collagen deposition, consistent with the indispensable role of NLRP3 inflammasome in fibrosis progression.
ROS play a key role in NLRP3 inflammasome activation (10, 31, 57). A previous report has shown that NLRP3 inflammasome activation is NOX1-4 independent (58); however, the present results clearly indicated that AngII-induced NLRP3 assembly was NOX4 driven and ROS dependent. NAC, DPI, or NOX4 depletion substantially suppressed the expression of AngII-induced NLRP3 inflammasome components. Furthermore, a similar suppression was identified on mito-TEMPO pretreatment, which indicated that mito-ROS contributed to the AngII-induced NLRP3 activation. However, AngII induced a mild increase in mitochondrial ROS and robust H2O2 production. Therefore, NOX4-driven ROS represented the major resource of ROS engaged in AngII-induced NLRP3 inflammasome complex assembly.
We subsequently examined how the Nrf2-mediated antioxidant reaction regulates NLRP3 inflammasome activation. Freigang et al. (14) and Zhao et al. (69) suggested that Nrf2 was required for NLRP3 inflammasome activation and could improve IL-1β secretion. Here we determined that the application of SFN, an Nrf2 activator, suppressed AngII-induced NLRP3 inflammasome component protein expression, suggesting that Nrf2 may have a protective effect on the NLRP3 inflammasome. Recent studies have indicated that Nrf2 negatively regulated NLRP3 inflammasome activity by inhibiting ROS-induced NLRP3 priming, consistent with a previous study (64). Apart from promoting the antioxidant response, in the present study, Nrf2 induced P62/SQSTM1-dependent selective autophagy degradation to restrict NLRP3 inflammasome activation. The specific mechanism is discussed later. Collectively, we demonstrated that a redox imbalance was required for AngII-induced NLRP3 inflammasome activation, which subsequently led to the pathogenesis of pulmonary fibrosis.
To limit the excessive inflammation induced by the hyperactivated NLRP3 inflammasome, AngII initiated autophagosome formation while promoting NLRP3 inflammasome activation. Accumulating evidence has indicated that autophagy is involved in NLRP3 inflammation activation (26, 72). The inhibition of autophagy by 3-MA promoted NLRP3-dependent IL-1β secretion with Mycobacterium tuberculosis infection (53) or without proinflammatory stimuli (19, 72). Consistent with these data, Giegerich et al. (16) and Shi et al. (53) demonstrated that autophagy constrained IL-1β production through its adaptor protein P62/SQSTM1 by targeting E3 ubiquitin-protein ligase Pellino homologue 3 (PELI3) or ubiquitinated NLRP3 inflammasome component degradation. The genetic deletion of autophagy proteins (i.e., Beclin1, LC3B-II, and autophagy-related gene [Atg]16L) caused mitochondrial ROS accumulation and subsequent IL-1β and IL-18 secretion (44, 50, 72). In the present study, elevated oxidant levels, NLRP3 activation, and autophagy were identified in the lung tissues of patients with pulmonary fibrosis and BLM-treated animals, implying a strong link among the three pathways. To illuminate this complicated relationship, we treated mice with an autophagy agonist and inhibitor. Consistent with a previous study, autophagy downregulated oxidation and NLRP3 inflammasome expression in lung tissues. Furthermore, DPI or NOX4 deletion substantially suppressed LC3 expression, whereas bafilomycin A1 enhanced H2O2 production. These findings suggest an accumulation of ROS-induced autophagy that in turn serves to reduce the ROS level. Through this mechanism, autophagy acts as a first step to limit NLRP3 inflammasome activation.
As previously discussed, mitochondria-dependent ROS play critical roles in NLRP3 inflammasome activation (72). However, in the present study, few mito-ROS were detected in fibroblasts treated solely with AngII. In contrast, when autophagy was blocked with bafilomycin A1, the mito-ROS increased at a remarkable rate along with the decline of ATP and membrane potential. In addition, AngII increased the colocation of LC3B and P62/SQSTM1 in mitochondria. These findings indicate that AngII may induce the mitochondria-selective autophagy, termed mitophagy, to maintain mitochondrial homeostasis, thereby limiting mito-ROS production and inducing NLRP3 inflammasome activation.
To date, few studies have investigated the effect of AngII on autophagy. AngII enhances the autophagic activity in myocytes (34, 36, 47, 48, 62), podocytes (52, 61), and vascular endothelial cells (51, 66). Cotreatment with the AngII type 1 receptor blocker olmesartan inhibited the augmentation of ROS, the increased conversion of LC3B-II to LC3B-I, the formation of autophagosomes, and the expression of beclin1 induced by AngII (65), suggesting that AngII-induced autophagy may depend on the AT1 receptor and ROS. However, the precise mechanism has remained undefined. AMPK is an energy sensor activated by increased levels of AMP and ADP that originate from ATP reduction (41). Increasing literature has established that AMPK signaling is the major inducer of autophagy (12, 25, 41). Activated AMPK may stimulate autophagic formation via different mechanisms: (i) direct phosphorylation of the mTORC1 component raptor (18); (ii) phosphorylation of tuberous sclerosis protein 2, another mTORC1 inhibitor (22); or (iii) direct binding to the ULK1 complex and phosphorylation of ULK1 (12, 25). Nagata et al. demonstrated increasing phosphorylated AMPK after AngII stimulation, which was diminished by the AT1 receptor antagonist valsartan, NAC, and DPI and suggests that AMPK was redox sensitive (43). AMPK is activated following H2O2 exposure (5, 74) and mitochondrial dysfunction (32). In the present study, we showed that AngII increased phosphorylated AMPK levels and induced subsequent ULK1 expression. The ATP reduction may contribute to AMPK activation. Furthermore, mito-TEMPO prominently suppressed the AngII-induced activation of AMPK and its downstream signaling, further indicating that AngII-induced AMPK depends on mitochondrial ROS. Interestingly, a similar suppression was also identified in the cells treated with VAS2870, an NOX4-specific inhibitor, which suggests that NOX4 functions upstream of AMPK. This finding was further confirmed by NOX4 siRNA. Herein, we provided the first evidence that NOX4-derived ROS were indispensable for AngII-induced AMPK signaling activation.
P62/SQSTM1 and P62/SQSTM1-bound polyubiquitinated proteins become incorporated into the completed autophagosome and are degraded in autolysosomes, serving as a readout for autophagic degradation. Nevertheless, P62/SQSTM1 contains six domains necessary for its interactions with autophagic machinery and several signaling pathways (38, 42). As the first reported protein to recognize polyubiquitinated targets during autophagy (45), P62/SQSTM1 links the autophagic machinery to ubiquitinated substrates to promote selective degradation of these proteins via its C-terminal ubiquitin-binding domain (UBA) and its LC3-interacting region. The present study showed that the activation of NLRP3 inflammasome induced by AngII led to the ubiquitination of ASC and perhaps other inflammasome components. The ubiquitinated inflammasome subsequently recruited P62/SQSTM1, which, by virtue of its LC3-binding domain, delivered the inflammasome to the autophagy pathway. Apart from targeting ubiquitinated ASC for degradation, P62/SQSTM1 limits NLRP3 inflammasome hyperactivation via its vital role in antioxidant reactions. Under quiescent conditions, Nrf2 is constitutively degraded through the ubiquitin–proteasome pathway, and its binding partner, kelch-like ECH-associated protein 1 (Keap1), is an adaptor of the ubiquitin–ligase complex that targets Nrf2. Through its Keap1-interacting region motif, P62/SQSTM1 binds to Keap1. As a result, Keap1-promoted polyubiquitination and subsequent proteasomal degradation of the transcription factor Nrf2 are inhibited (23, 29). Moreover, the P62/SQSTM1 gene is a target of the transcription factor Nrf2 (23). In the present study, we identified increases in both the protein and mRNA levels of P62/SQSTM1, confirming that AngII unquestionably induced P62/SQSTM1 gene transcription via Nrf2 instead of impairing its degradation by autophagosome–lysosome fusion. We suspected that the AngII-induced P62/SQSTM1 augmentation contributes to the enhancement of Nrf2-ARE, which consequently initiates the antioxidant response and results in the suppression of NLRP3 inflammasome activation. Thus, P62/SQSTM1 exerts dual effects on the downregulation of NLRP3 inflammasome activation by creating a positive feedback loop between P62/SQSTM1 and Nrf2-ARE, as well as transporting ubiquitinated ASC to the autophagosome–lysosome system for degradation.
We also demonstrated multiple functions of AngII in the present study. Its profibrotic role is well established. Consistently, AngII was demonstrated as an inducer of autophagy in vascular smooth muscle cells (65), macrophages (70), and cardiomyocytes (47). Similar to the well-known dual function of transforming growth factor-beta (TGF-β), which induces autophagy to limit the collagen accumulation provoked by TGF-β itself (27), AngII serves as an inducer of collagen synthesis via activating the NLRP3 inflammasome and an inducer of autophagy to promote collagen degradation. The induction of autophagy serves as a cytoprotective mechanism to maintain cellular homeostasis.
There are several inconsistencies between the present study and previous studies showing reduced LC3 expression together with P62/SQSTM1 accumulation in IPF patients (2, 46). Here the six specimens from pulmonary fibrosis patients, the BLM-induced fibrosis model, and primary fibroblasts all showed an LC3B augmentation associated with P62/SQSTM1 accumulation, and the autophagy flux clearly demonstrated that the autophagy induced by AngII is enhanced instead of impaired. The role of autophagy in disease pathogenesis is likely multifaceted and complex. The paradoxical autophagy status presented here may be associated with age, time window, oxidant stress level, and different cell phenotypes.
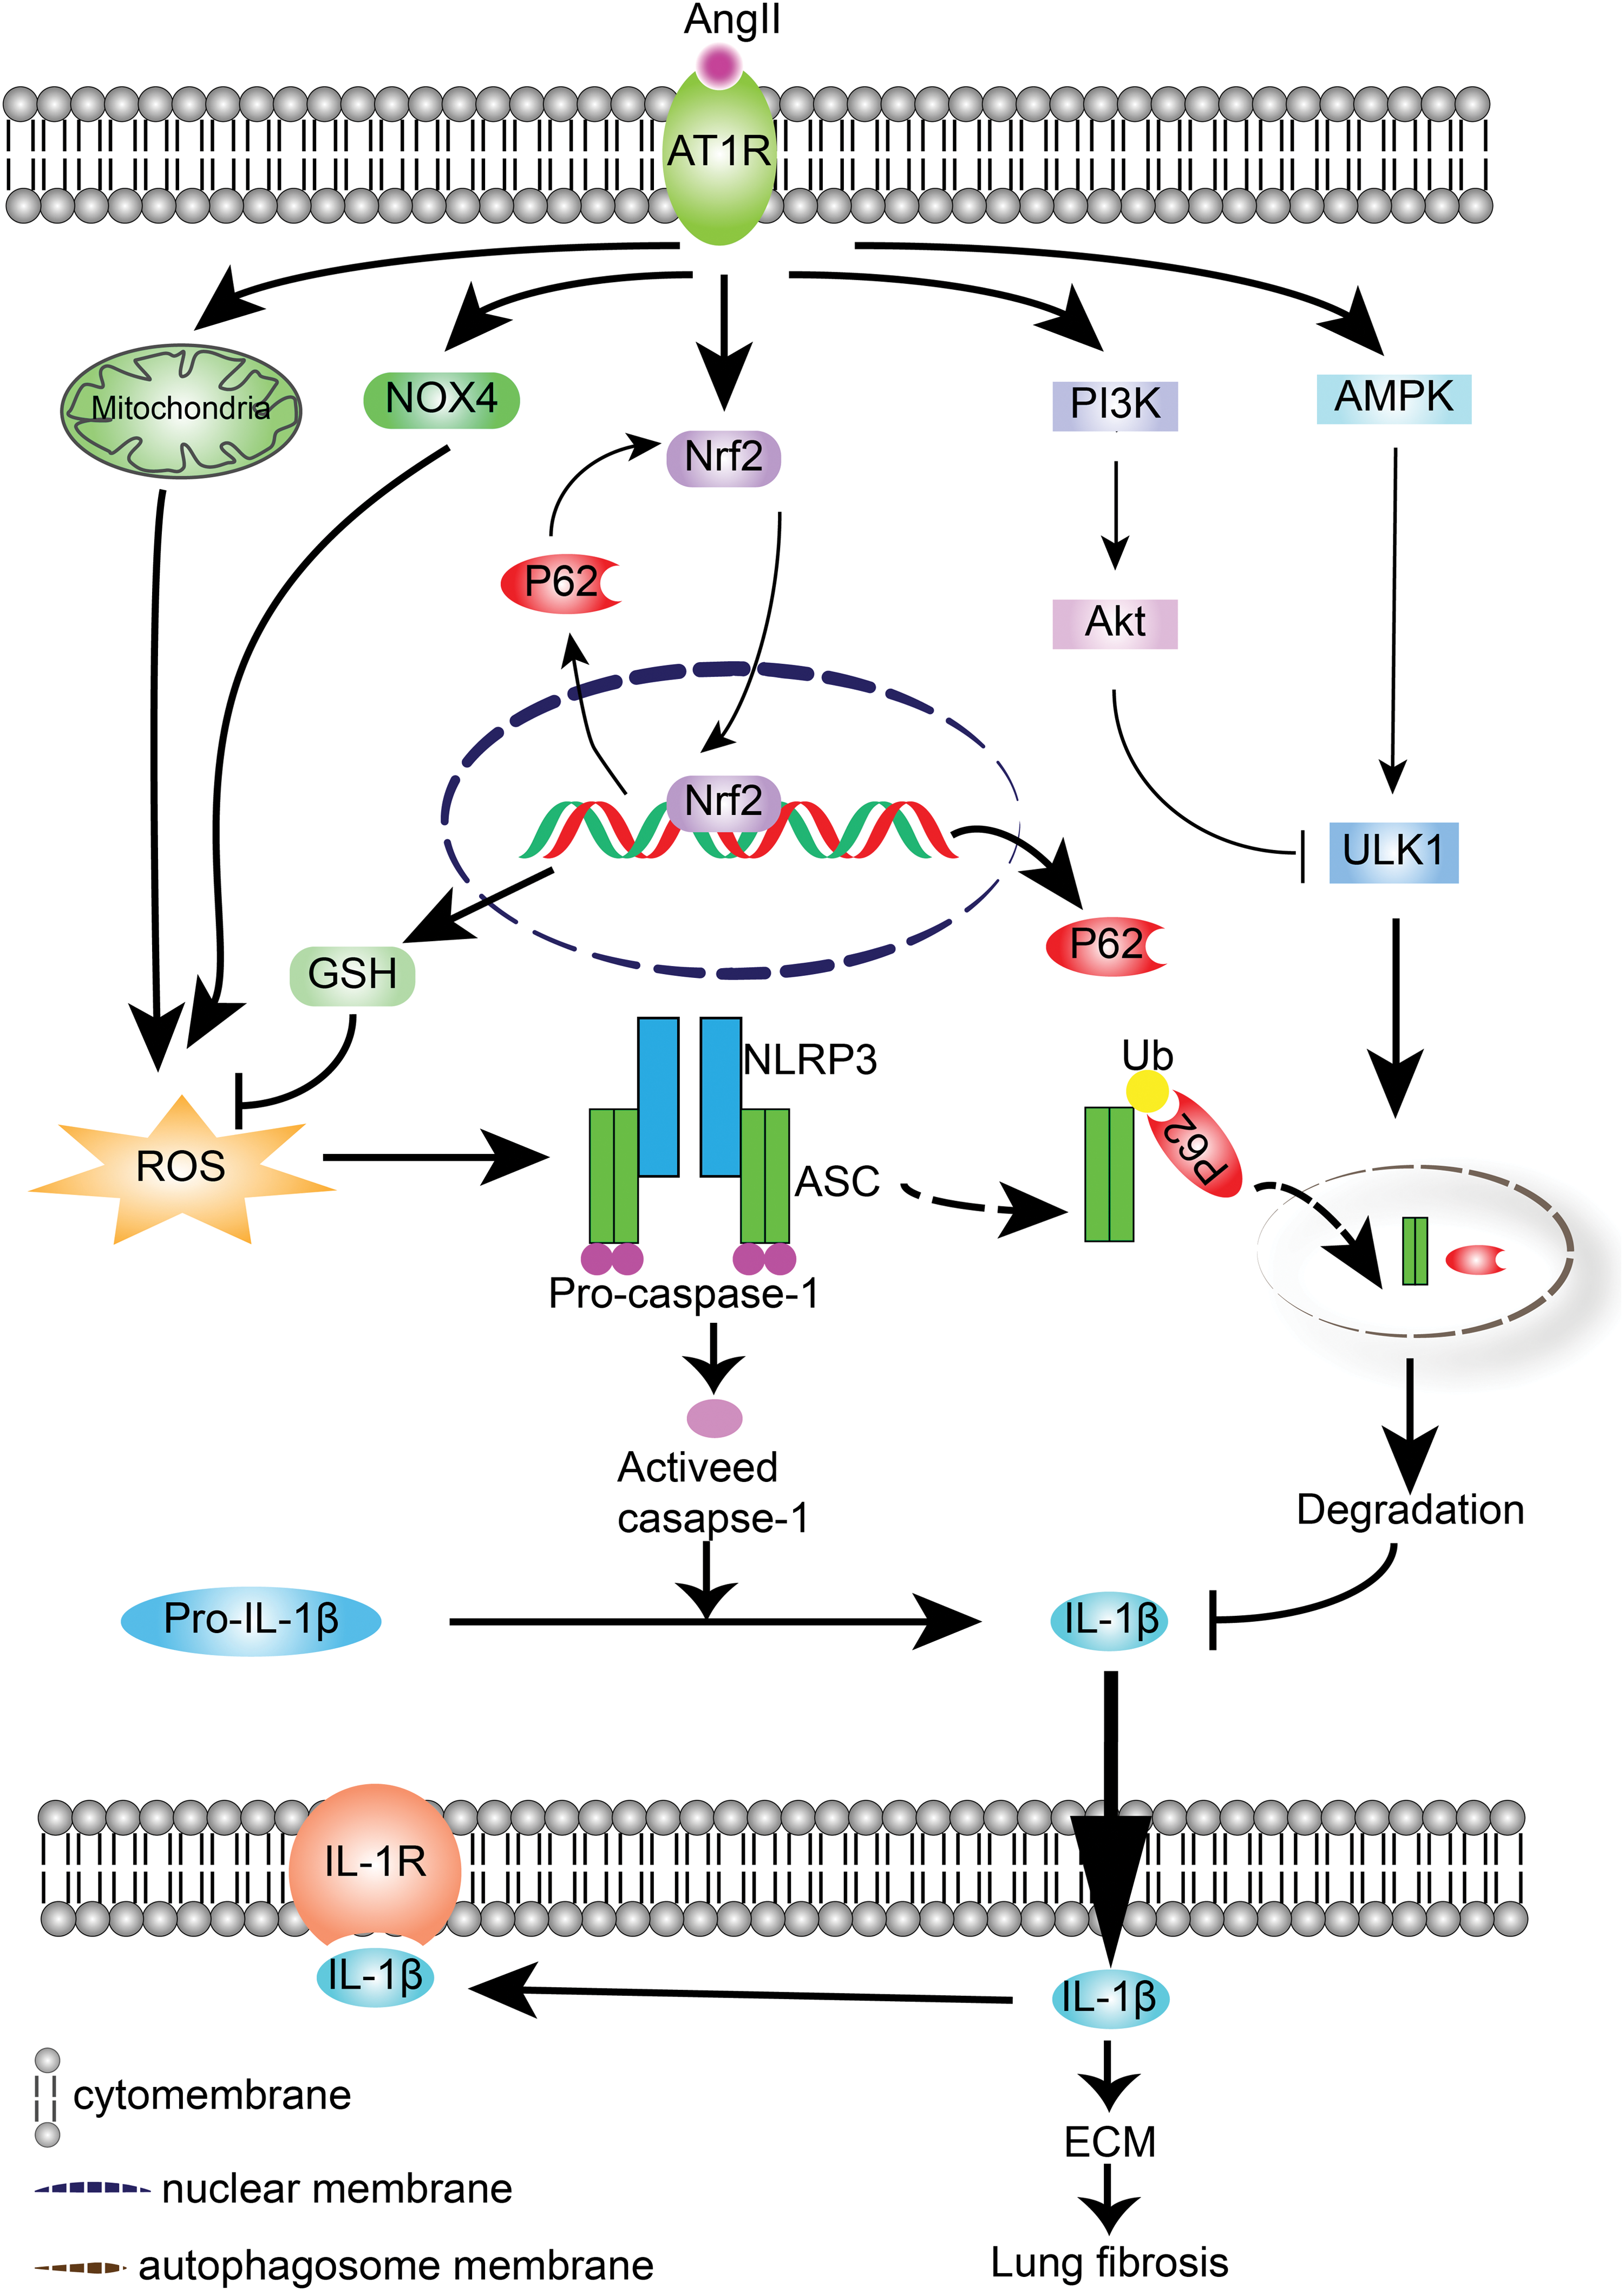
In conclusion, the present study demonstrated that NLRP3 inflammasome activation, triggered by an AngII-induced redox imbalance, was centrally involved in lung fibrogenesis. Furthermore, autophagy ameliorated AngII-induced lung fibrosis by inhibiting NLRP3 inflammasome through the maintenance of mitochondrial homeostasis and elimination of excessive ROS (Fig. 10). Notably, AngII-induced P62 served as a multifunctional signaling hub by creating a positive feedback loop between P62/SQSTM1 and Nrf2-ARE, as well as delivering ubiquitinated ASC to the autophagic degradation pathway. The present study indicated that P62/SQSTM1 might represent a promising therapeutic target to prevent or mitigate the pathogenesis of lung fibrosis.
Materials and Methods
Human lung specimens
We retrospectively assessed tissue sections from thoracoscopic lung biopsies or transbronchial lung biopsies of 12 patients, including 6 patients with lung fibrosis and 6 patients who underwent a partial lung resection for lung cancer. The demographic characteristics of the patients are shown in Supplementary Table S1.The study was approved by the local ethics committees.
Animals
All experimental animal protocols were approved by the Ethics Committee of Animal Experiments of Southern Medical University and were performed in accordance with the Declaration of Helsinki. Male Wistar rats weighing 200–300 g and 6–8-week-old male C57 mice were purchased from the Central Animal Care Facility of Southern Medical University. The animals were housed in a controlled environment (12-h light/dark; temperature, 22°C–24°C) and provided food and water ad libitum.
Animal treatment regimens
We established two animal models. The first model was established as previously described (39). Briefly, 36 male Wistar rats were randomly divided into three groups with 12 rats per group: a control group, a BLM treatment group, and a BLM + AngII treatment group. Initially, 200 μL of sterile saline containing BLM at a single dose of 5 mg/kg was instilled into the trachea of the two BLM groups; an equivalent amount of sterile saline was administered to the control group. AngII was continuously infused to the BLM + AngII rats using a subcutaneously implanted micro-osmotic pump at a rate of 25 μg/kg/h. The other two groups simultaneously received the same dose of saline as a control.
In the second model, we established four groups using male C57 mice: a control group (n = 12), a BLM group (n = 12), a BLM +3-MA group (n = 12), and a BLM + rapamycin group (n = 12). The three BLM groups also received an intratracheal instillation of BLM as previously described in the first model; however, the sterile saline volume was reduced to 100 μL. The BLM +3-MA group was intraperitoneally injected with 3-MA at a dose of 10 mg/kg, whereas the rapamycin group was subjected to 1 mg/kg rapamycin in 100 μL sterile saline for the next 35 days. The mice in the control and BLM treatment groups received constant subcutaneous saline infusions.
Histological and immunochemical analyses
Lung specimens were incubated with primary antibody against P62, F4/80, SP-C (1:100; Proteintech), α-SMA (1:200; Boster), LC3B, NOX4, and IL-1β (1:100; Abcam), followed by incubation with the streptavidin–peroxidase complex. Peroxidase conjugates were subsequently visualized by utilizing diaminobenzidine solution. The degree of lung fibrosis and the number of positive cells were quantified with Image-Pro Plus 6.0 software (Media Cybernetics).
Cell isolation and culture
Normal rat primary fibroblasts were prepared from the lungs of male Wistar rats as described (39). The cells were cultured in Dulbecco's modified Eagle's medium (DMEM) containing 15% fetal bovine serum (FBS; GIBCO BRL, Life Technologies, Inc.).
Immunofluorescence histochemistry
The lung tissue was embedded in optimal cutting temperature medium (Sakura, Japan) for serial frozen sectioning and processed for staining. The tissue was subsequently incubated with a primary antibody against P62/SQSTM1 (1:100; Proteintech), LAMP1 (1:200; Proteintech), α-SMA (1:200; Boster), NOX4, NLRP3, and LC3B (1:100; Abcam) at 4°C overnight. After probing with the appropriate fluorescein isothiocyanate (FITC)-conjugated and Cy3-conjugated antibodies (1:100; Beyotime), the fluorescent signals were detected using an OLYMPUS FV10i-W confocal microscope (Olympus, Japan).
H2O2 assay
The H2O2 concentration was assessed using a hydrogen peroxide assay kit (Biovision; K265-200). The cells were dispersed and centrifuged to obtain a cell pellet; the supernatant was discarded, and the cell pellet was maintained at −80°C for several hours. The cell pellet was subsequently resuspended in 100 μL of lysis buffer that contained protease inhibitor and centrifuged at 12,000 g for 3 min at 4°C. The right lung lobes (10 mg) were ground in liquid nitrogen and homogenized in 100 μL of lysis buffer that contained protease inhibitor, followed by centrifugation at 12,000 g for 3 min at 4°C. Then, 50 μL of the reaction mix (48 μL assay buffer, 1 μL OxiRed™ Probe solution, and 1 μL horseradish peroxidase solution) was added to each well, followed by 50 μL of supernatant. The wells were gently mixed and incubated at room temperature for 10 min. Finally, fluorescence was detected using a multiwell fluorescence scanner (SpectraMax M5/M5e; Molecular Devices) at an excitation wavelength of 535 nm and an emission wavelength of 587 nm. The concentration of released H2O2 was calculated based on the standard concentration curve of triplicate experiments.
GSH assay
The GSH concentration was assessed using a GSH-Glo™ Glutathione Assay Kit (Promega; V6911). Approximately 5000 cells/well were cultured in a 96-well white plate in DMEM, supplemented with 10% FBS with or without AngII. The culture medium was carefully removed from the wells, and 100 μL of prepared 1 × GSH-Glo™ Reagent (98 μL GSH-Glo reaction buffer, 1 μL luciferin-NT (a luciferin derivative) substrate, and 1 μL glutathione S-transferase) was added to each well. The right lung lobes (10 mg) were ground in liquid nitrogen, homogenized in 100 μL of lysis buffer that contained protease inhibitor, and centrifuged at 14,000 g for 15 min at 4°C. Then, 50 μL of 2 × GSH-Glo Reagent (48 μL GSH-Glo reaction buffer, 1 μL luciferin-NT substrate, and 1 μL glutathione S-transferase) was added to each well, followed by 50 μL supernatant. The reactions were gently mixed and incubated at room temperature for 30 min. Next, 100 μL of reconstituted luciferin detection reagent was added to each well. The wells were briefly mixed and incubated for 15 min. Finally, luminescence was detected using a multiwell fluorescence scanner (SpectraMax M5/M5e; Molecular Devices). The GSH concentration was calculated based on the standard concentration curve of triplicate experiments.
Intracellular ROS detection
Intracellular ROS production was detected via 2,7-dichlorofluorescein diacetate (DCF-DA; Applygen, Beijing, China), an oxidation-sensitive probe. Briefly, following stimulation by AngII for the indicated times, the cells were incubated with 10 μmol/L DCF-DA for 30 min at 37°C, and the DCF-DA fluorescence was quantified using a multiwell fluorescence scanner (SpectraMax M5/M5e; Molecular Devices). The DCF-DA fluorescence was detected at an excitation wavelength of 480 nm and an emission wavelength of 525 nm.
Measurement of mitochondrial membrane potential (▵ψm)
The mitochondrial membrane potential was measured by JC-1, a mitochondrion-specific cationic probe fluorochrome. Briefly, cells cultured in DMEM were stained with JC-1 for 20 min at 37°C and washed with phosphate-buffered saline (PBS). The stained cells were subsequently visualized using an OLYMPUS FV10i-W confocal microscope. The intensities of red fluorescence (excitation/emission wavelength = 525/590 nm) and green fluorescence (excitation/emission wavelength = 490/530 nm) were analyzed for at least 10 microscopic fields in each sample, and the green fluorescence represented the loss of mitochondrial ▵ψm.
Measurement of intracellular ATP level
The intracellular ATP levels were determined via a luminometric ATP assay kit. Cells were dispersed and centrifuged to obtain a cell pellet; the cells were then resuspended with 100 μL lysis buffer and centrifuged at 12,000 g for 5 min at 4°C. One hundred microliters of ATP detection working solution was subsequently added to the wells of a white 96-well culture plate and preincubated for 5 min at room temperature to reduce the background. Then, 50 μL of supernatant was added, and the luminescence value was measured after 2 s by a luminometer (SpectraMax M5/M5e; Molecular Devices). The ATP level was calculated based on the standard concentration curve of triplicate experiments.
Flow cytometry
Mitochondrial ROS were assessed in cells via MitoSOX Red reagent (Invitrogen) staining (2.5 μmol/L at 37°C for 15 min). For determination of the mitochondrial mass, cells were stained with 200 nM MitoTracker Green FM and MitoTracker Deep Red FM (Invitrogen) at 37°C for 30 min. After staining, the cells were analyzed via flow cytometry (BD LSRFortessa™ X-20; BD Biosciences), and the data were analyzed with FlowJo analytical software (TreeStar).
Isolation of mitochondria
The fibroblast mitochondria were isolated using a mitochondrial isolation kit (Beyotime) according to the manufacturer's instructions. Briefly, cells were dispersed and centrifuged to obtain cell pellets; they were then resuspended with 1 mL lysis buffer and transferred into a glass grinder for homogenization. The homogenate was subsequently centrifuged at 800 g for 5 min at 4°C. The collected supernatant was then centrifuged at 15,000 g for 10 min at 4°C, followed by the addition of medium buffer. The resulting pellet was mitochondrion. To obtain the mitochondrial protein, 60 μL of lysis buffer that contained protease inhibitor was used to resuspend the pellet.
Measurement of caspase-1 activity
The caspase-1 activity was measured using a Caspase-1 Colorimetric Assay Kit (Biovision, CA). Briefly, cells were homogenized in lysis buffer and centrifuged for 1 min at 10,000 g. The supernatant was collected, and the protein concentration was measured. A volume of 50 μL of protein sample (which contained 100–200 μg protein) was added to 2 × caspase-1 reaction buffer (which contained 10 mmol/L DL-dithiothreitol) in a 96-well plate. Then, 5 μL of the 4 mmol/L YVAD-pNA substrate was added to each sample, followed by 1–2 h of incubation at 37°C. The caspase-1 activity was measured using a SpectraMax M5 plate reader (Molecular Devices Corporation) at 400 nm. The fold increase in the caspase-1 activity was determined by comparing the results of the treated samples with the level of untreated control.
Measurement of Nrf2 activity
The Nrf2 activity in cells was assessed using an Nrf2 Transcription Factor Assay Kit (Cayman) according to the manufacturer's instructions.
IL-1β measurement via enzyme-linked immunosorbent assay
The IL-1β level in the culture supernatant was determined with an ELISA kit (RayBiotech) according to the manufacturer's instructions.
Immunocytochemistry
Cells cultured on glass coverslips were stained with 200 nM MitoTracker Deep Red FM (Invitrogen) at 37°C for 30 min. After staining, the cells were fixed with 4% paraformaldehyde in prewarmed DMEM at 37°C for 10 min. The cells were subsequently incubated for 10 min in PBS containing 0.25% Triton® X-100. The cells were blocked with 5% bovine serum albumin for 30 min–1 h at room temperature, followed by incubation with primary antibodies in a moist chamber overnight at 4°C. The primary antibodies included mouse anti-caspase-1 (1:50; Santa Cruz), rabbit anti-ASC (1:50; Santa Cruz), goat anti-NLRP3 (1:100; Abcam), rabbit anti-NOX4 (1:100; Abcam), rabbit anti-LC3 (3:400; Abcam), rabbit anti-P62 (1:100; Proteintech), and mouse anti-P62 (1:100; Abcam). After washing with phosphate buffered saline with Tween-20, the cells were incubated with goat anti-rabbit immunoglobulin G (IgG; 1:200) and goat anti-mouse IgG (1:200) or donkey anti-goat IgG (1:200) labeled with Cy3 or FITC (Beyotime) for 1 h at room temperature. Fluorescence was visualized using an OLYMPUS FV10i-W confocal microscope, and images were analyzed using the accompanying FV10i-ASW 3.0 Viewer software.
Evaluation of fluorescent LC3 puncta
Primary fibroblasts cultured on a glass bottom culture were transduced with GFP-mRFP-LC3 at 100 multiplicity of infection. Twenty-four hours after adenovirus transduction, the cells were stimulated with AngII (10−7 mol/L) for an additional 24 h. The cells were subsequently washed with PBS, fixed with 4% paraformaldehyde, and viewed under an OLYMPUS FV10i-W confocal microscope. The numbers of green fluorescent protein (GFP) and mRFP dots were determined by manual counting of fluorescent puncta in 10 fields from three different fibroblast preparations with a 1200 × objective. The number of dots per cell was obtained by dividing the total number of dots by the number of nuclei in each microscope field.
Coimmunoprecipitation
The primary fibroblasts were stimulated with or without 1-h MG132 pretreatment, followed by 24-h AngII exposure. Immunoprecipitation and immunoblotting were performed as previously described (24).
Electron microscopy
The cells were fixed with 2.5% glutaraldehyde, dehydrated, and coated with gold in the coating apparatus. The samples for the TEM test stained with uranyl acetate and lead citrate, and autophagosomes and autolysosomes were observed under the TEM at an 80-kV acceleration voltage.
Cell transfection with siRNA
To suppress endogenous NOX4, NLRP3, and LC3B expression, specific siRNAs against NOX4 (sense 5′-GGACCUUUGUGCCUAUACUTT-3′; antisense 5′-AGUAUAGGCACAAAGGUCCTT-3′), NLRP3 (sense 5′-CCCUGGGAUUUCUCCACAATT-3′; antisense 3′-TTGGGACCCUAAAGAGGUGUU-5′), and LC3B (sense 5′-GGACAAGCAGGCAGAUGAATT-3′; antisense 3′-UUCAUCUGCCUGCUUGUCCTT-5′) were designed. Scrambled siRNA (nonhomologous to the rat genome) was used as control. Cells were transfected as previously described (46).
Western blot analysis
Western blot was performed as previously described (39) with use of the following antibodies: α-collagen I, CTGF, IL-1β, P62/SQSTM1, GAPDH (1:1000; Proteintech); Nrf2, NOX4, NLRP3, caspase-1, LC3B, and beclin1 (1:1000; Abcam). All Western blot experiments were repeated at least three times. All Western blot original bands are shown in Supplementary Figures S7–S10.
Quantitative real-time PCR analysis
The HO-1, GCLC, LC3B, and P62/SQSTM1 mRNA was quantified via quantitative real-time reverse transcription–polymerase chain reaction as previously described (39). PCRs that consisted of 95°C for 10 min (one cycle), 95°C for 15 s, and 60°C for 1 min, 72°C for 30 s (40 cycles) were performed on an ABI Prism 7500 Sequence Detection System (Applied Biosystems, Carlsbad, CA). The mRNA expression was normalized to the GAPDH expression.
Statistical analysis
All data are represented as the means ± standard deviations. In statistical analysis of two groups, a two-tailed Student's-t test was utilized. In analysis of more than two groups, analysis of variance was performed. p < 0.05 was considered statistically significant. All data were analyzed using SPSS 22.0®.
Footnotes
Acknowledgments
This work was supported by the National Natural Science Foundation of China (No. 81370158; No. 81570064) and the Guangdong Province Natural Science Foundation of China (No: 2014A030313269).
Author Disclosure Statement
No competing financial interests exist.
Abbreviations Used
References
Supplementary Material
Please find the following supplemental material available below.
For Open Access articles published under a Creative Commons License, all supplemental material carries the same license as the article it is associated with.
For non-Open Access articles published, all supplemental material carries a non-exclusive license, and permission requests for re-use of supplemental material or any part of supplemental material shall be sent directly to the copyright owner as specified in the copyright notice associated with the article.