




Abstract
Aims:
Chronic traumatic encephalopathy (CTE) is a progressive neurodegenerative disease thought to be caused by repetitive traumatic brain injury (TBI) and subconcussive injuries. While hyperphosphorylation of tau (p-Tau), which is attributed to astrocytic tangles (ATs) and neurofibrillary tangles, is known to be involved in CTE, there are limited neuropathological or molecular data. By utilizing repetitive mild TBI (rmTBI) mouse models, our aim was to examine the pathological changes of CTE-associated structures, specifically the ATs.
Results:
Our rmTBI mouse models showed symptoms of depressive behavior and memory deficit, alongside an increased p-Tau expression in their neurons and astrocytes in both the hippocampus and cortex. rmTBI induced oxidative stress in endothelial cells and nitric oxide (NO) generation in astrocytes, which were mediated by hypoxia and increased hypoxia-inducible factor 1-α (HIF1α). There was also correlated decreased regional cerebral tissue perfusion units, mild activation of astrocytes and NFκB phosphorylation, increased expression of inducible nitric oxide synthase (iNOS), increased endothelial nitric oxide synthase (eNOS) uncoupling with decreased tetrahydrobiopterin, and increased expression of nitrotyrosine, NADPH oxidase 2 (Nox2)/nuclear factor (erythroid-derived 2) factor 2 (Nrf2) signaling proteins. Combined, these effects induced peroxynitrite formation and hyperphosphorylation of tau in the hippocampus and cortex toward the formation of ATs.
Innovation:
Our model features molecular pathogenesis events of CTE with clinically relevant latency periods. In particular, this is the first demonstration of an increased astrocytic iNOS expression in an in vivo model.
Conclusion:
We propose a novel mechanism of uncoupled eNOS and NO contribution to Tau phosphorylation and AT formation in rmTBI brain, toward an increased molecular understanding of the pathophysiology of human CTE.
Introduction
Chronic traumatic encephalopathy (CTE) is a progressive neurodegenerative disease thought to be caused by repeated traumatic and subconcussive brain injuries (24, 25, 51). Clinically, this disease is deeply associated with various pathological symptoms, including irritability, depression, aggression, impulsivity, and short-term memory loss (51). Based on the clinical diagnosis, CTE is generally divided into four stages: (i) the formation of hyperphosphorylated Tau (p-Tau)-immunoreactive (IR) astrocytic tangles (ATs) and neurofibrillary tangles (NFTs) in the perivascular foci; (ii) the inappropriate cortical distribution of p-Tau-IR ATs and NFTs deep within the cerebral sulci; (iii) the formation of clusters of subpial and periventricular ATs in the cerebral cortex, brainstem, and basal ganglia; and (iv) the formation of NFTs in superficial layers of the cerebral cortex (49, 50, 56). Therefore, CTE is characterized by a neuropathological change in p-Tau, which is due to aforementioned ATs and NFTs (49, 50, 56).
Molecular mechanisms leading to astrocyte activation and hyperphosphorylation of tau in chronic traumatic encephalopathy (CTE) have thus far remained unclear. In this study, we developed a clinically relevant in vivo CTE model that explains the role of astrocytic inducible nitric oxide synthase in the production of oxidant peroxynitrite by interacting with the uncoupled endothelial nitric oxide synthase, and provides a novel insight into the progressive neuropathogical changes associated with CTE.
Although progressive tauopathy in CTE is suggested to occur as a consequence of repetitive mild traumatic brain injury (rmTBI), not all injury occurs at the time of initial impact. Rather, a complex cascade of pathophysiological effects unfolds over the ensuing hours and days following injury, and results in further tissue damage (23, 47). Factors thought to be important in the secondary injury cascade are secretions of excitatory amino acids, including glutamate, calcium homeostasis imbalance, mitochondrial dysfunction, and oxidative stress (23). In addition, an increased glucose utilization at a time of decreased cerebral blood flow may also exacerbate this pathological condition (36). On the contrary, astrocytes generally play an essential role in the structural and functional maintenance of neurons and the brain tissue by glucose supplying from the cerebral vessels (36). Therefore, the dysfunction and/or abnormal activation of the astrocytes by repetitive traumatic brain injury (TBI) may be key factors of the progressive neuropathological alterations into CTE. Until recently, however, there were few neuropathological or molecular studies on mild TBI or on astrocyte activation in rmTBI.
In response to brain tissue damage under the pathophysiological conditions of stroke, trauma, or neurodegenerative disease, the astrocytes not only actively proliferate at the site of damage but also excessively generate free radical molecules such as nitric oxide (NO) and reactive oxygen species (ROS) (65). Oxidative stress is evoked by an imbalance between oxidation and antioxidant system due to excessive ROS production and depletion of antioxidant components (48). Therefore, the aforementioned harmful molecules are the main source of oxidation that can rapidly lead to brain tissue damages. In addition, brain tissue is the main target organ against oxidative stress due to relative lack of antioxidant components, its high rate of oxygen consumptions, and the abundance of polyunsaturated fatty acid and metal ion transition (21, 30). Prolonged oxidative stress condition also can lead to inflammatory reactions by secretion of proinflammatory cytokines, including tumor necrosis factor (TNF)-α, interleukin (IL)-6, and IL-1β.
On the contrary, glial fibrillary acidic protein (GFAP), known as an intermediate filament protein, is excessively accumulated in activated astrocytes during “reactive gliosis” under the pathological conditions of brain tissue oxidation (10, 65). Furthermore, the activated astrocytes can induce neuroinflammatory responses following TBI as well (9). In addition, abnormal productions of NO and ROS and related proinflammatory cytokines from astrocytes are thought to be key factors in astrocytic tau tangle accumulation and progression of CTE.
In particular, the role of NO on the progress of oxidative stress is mainly due to inducible NO synthase (iNOS) and this also can affect the inflammatory response through various organs. Only a few studies reported that the uncoupled endothelium NOS (eNOS) plays critical roles in vascular oxidative stress (39, 41, 43), but not in the brain. Even though both oxidative stress and inflammatory cytokine secretion are important in CTE, their pathophysiological mechanisms remain unclear. Therefore, we herein aimed to investigate the astrocytic activation and astrocyte-related pathophysiological condition of CTE, with particular focus on the increase of uncoupled eNOS.
Results
CTE model acquires depression following rmTBI
Our rmTBI model was mainly characterized by an increased exploratory behavior, impaired balance, and worse spatial memory that persisted up to 3 months after injury (37, 46). Previous study revealed that single moderate/severe TBI induced cis p-Tau expression, starting at 12 h and peaking at 48 h, but sustaining high levels over time (40). However, both rmTBI and blast TBI also expressed robust and persistent cis p-Tau induction, with more profound effects in the latter. Based on these reasons, we decided to sacrifice our rmTBI models at 2 weeks after the final insult (Fig. 1A). A 54 g metal ball delivered to the dorsal aspect of the skull resulted in a sudden head acceleration, but no hemorrhages and skull fractures were observed at the time of sacrifice. The loss of consciousness, dizziness, and falling with forelimb/jaw clonus were defined as the time from removal of anesthesia to spontaneous righting. To verify our model, we examined the depressive-like behavior by using forced swimming test (Fig. 1B), since CTE is associated with violent behaviors, loss of control, depression, explosivity, suicide, memory loss, and cognitive changes (51). Immobility was used as a surrogate metric of depressive-like behavior in this test and was measured during the last 5 min of the total 6-min observation period. Immobility was significantly increased in the CTE model mice compared with the control mice (Fig. 1C, p < 0.001).

Tail suspension tests also showed that the immobility time of the CTE group was around twofold higher than that of the control group (Fig. 1D, p < 0.001). To test memory deficit ability, we further performed a Y-maze test. Mice of the CTE group significantly deterred the alternations compared with the control group (Fig. 1E, p < 0.01). We also measured the memory deficit-related molecules, such as BDNF and phospho-CREB, by Western blot analysis of the hippocampus. Interestingly, our results showed that phospho-CREB was significantly increased in the CTE group compared with the control group (Supplementary Fig. S1, p < 0.01), but not BDNF. Our data suggest that rmTBI results in a depressive and in learning and spatial memory-deficient behavioral phenotypes that were well correlated with the clinical syndrome of CTE.
Increased p-Tau expression in the brains of CTE model observed only at 2 weeks after rmTBI
As p-Tau expression is well known to occur particularly in the brain tissues of human CTE patients (51), we assessed whether rmTBI would lead to an increased p-Tau IR in our model at 2 weeks following the last head impact (Fig. 2A). In the control group, there was no detectable p-Tau IR in the hippocampus and cortex (Fig. 2A.a); however, positive signals of p-Tau were notably increased in both the cortex (Fig. 2A.b1, A.b2) and the hippocampus (Fig. 2A.b3, A.b4) of brains of CTE model mice compared with control mice. Specifically, p-Tau IR was shown in the pyramidal neuronal layer of hippocampus and neuronal layer of cortex. The p-Tau IR in the inset of Figure 2A.b2 and A.b4 showed typical dot-like structure of hyperphosphorylated tau. Quantification of the significant increase in the mean immunostaining intensity of p-Tau was shown in Figure 2B. These data indicate that p-Tau expression was increased following rmTBI, and our rmTBI mice may be suitable models of CTE.

Interestingly, we did not find any change in p-Tau expression when the mice were sacrificed at 1 day post-rmTBI. However, we found an increased p-Tau expression when the animals were sacrificed at 2 weeks post-rmTBI (Fig. 2). These results were consistent regardless of the duration of rmTBI; that is, there was no significant difference whether the injury was applied for 4 weeks or for 8 weeks (Supplementary Fig. S2). These data suggest that the p-Tau upregulation is not directly affected by physical simulation or stress from rmTBI, but by biochemical or molecular alteration cascade that induces pathophysiological and microenvironmental changes. It appears that some latency period is needed for these molecular alterations to be acquired postinjury. This suggests that our CTE model mimics human clinical conditions, namely that changes are not immediately observable but are manifested at a later time (e.g., after aging) (55).
Astrocytes and microglia in CTE model appear to be moderately activated
To examine p-Tau expression in the astrocytes of the brain after rmTBI, we first performed GFAP immunostaining to identify morphological changes in the astrocytes (Supplementary Fig. S3). The results showed the classic resting morphology, with faintly stained cell bodies and thin cellular processes in GFAP-positive astrocytes in the control mice (Supplementary Fig. S3A.a3, A.a4). Conversely, GFAP-positive astrocytes in the cortex and hippocampus of CTE mice showed moderately activated morphology with more round nuclei, enlarged cell bodies, and short, thickened processes (Supplementary Fig. S3A.b3, A.b4). In addition, we also found mild microgliosis in the cortex and hippocampus (Supplementary Fig. S4). These data are consistent with previous studies that showed chronic astrogliosis and microgliosis in the hippocampus induced by rmTBI (46, 58). Our results suggest that astrocyte activation may be related to p-Tau expression in the cortex and hippocampus of the rmTBI model.
To address whether p-Tau is expressed in the astrocytes and contributes to the formation of ATs in rmTBI model, we double labeled the hippocampus with p-Tau and GFAP antibodies. The results showed hippocampal astrocytic expression of p-Tau in CTE mice after rmTBI (Fig. 3). p-Tau expression in the astrocytes was primarily observed in the stratum radiatum (SR), and was sometimes observed in the stratum oriens (SO) (Fig. 3B). p-Tau appeared to be widely expressed from the nucleus to the cytoplasm (Fig. 3B, third panel). Thus, this suggested that rmTBI may upregulate p-Tau expression in hippocampal astrocytes in our CTE model.

Brain oxidation and inflammation are enhanced in the hippocampus of CTE model
Recent reports reported that hypoxic brain injury is accompanied by an inflammatory response and abnormal oxidative metabolism (74). NFκB and iNOS are molecules well known to target inflammatory reactions, leading to the activation of glial cells in TBI (27, 31). In addition, our data above suggested that astrocytic p-Tau upregulation is not directed by physical stimulation but by biochemical or molecular alterations after stress. Therefore, we measured oxidative stressors such as ROS and nitrite in the cortex and hippocampus of the brain to examine the effects of oxidative injury. Our data showed that ROS levels did not show significant changes in the cortex and hippocampus (except for the serum level) (Fig. 4A), while nitrite levels were increased significantly in the hippocampus of CTE model mice compared with the control mice (Fig. 4B). Next, we also measured lipid peroxidation, a final product of oxidation, in the protein levels of both cortex and hippocampus, and serum levels. The protein levels of malondialdehyde (MDA), as a final product of lipid peroxidation, significantly increased only in the hippocampus of CTE mice, but not in the cortex (Fig. 4C). There was a correlative trend, but no statistical significance in the serum MDA concentration between CTE and CTE with vitamin E treatment (Supplementary Fig. S5A). We further examined the nitrotyrosination as a result of peroxynitrite formation as an early event of our CTE model via Western blot analysis. As expected, the nitrotyrosine in the hippocampus protein levels was significantly increased compared with the control group (Supplementary Fig. S6).
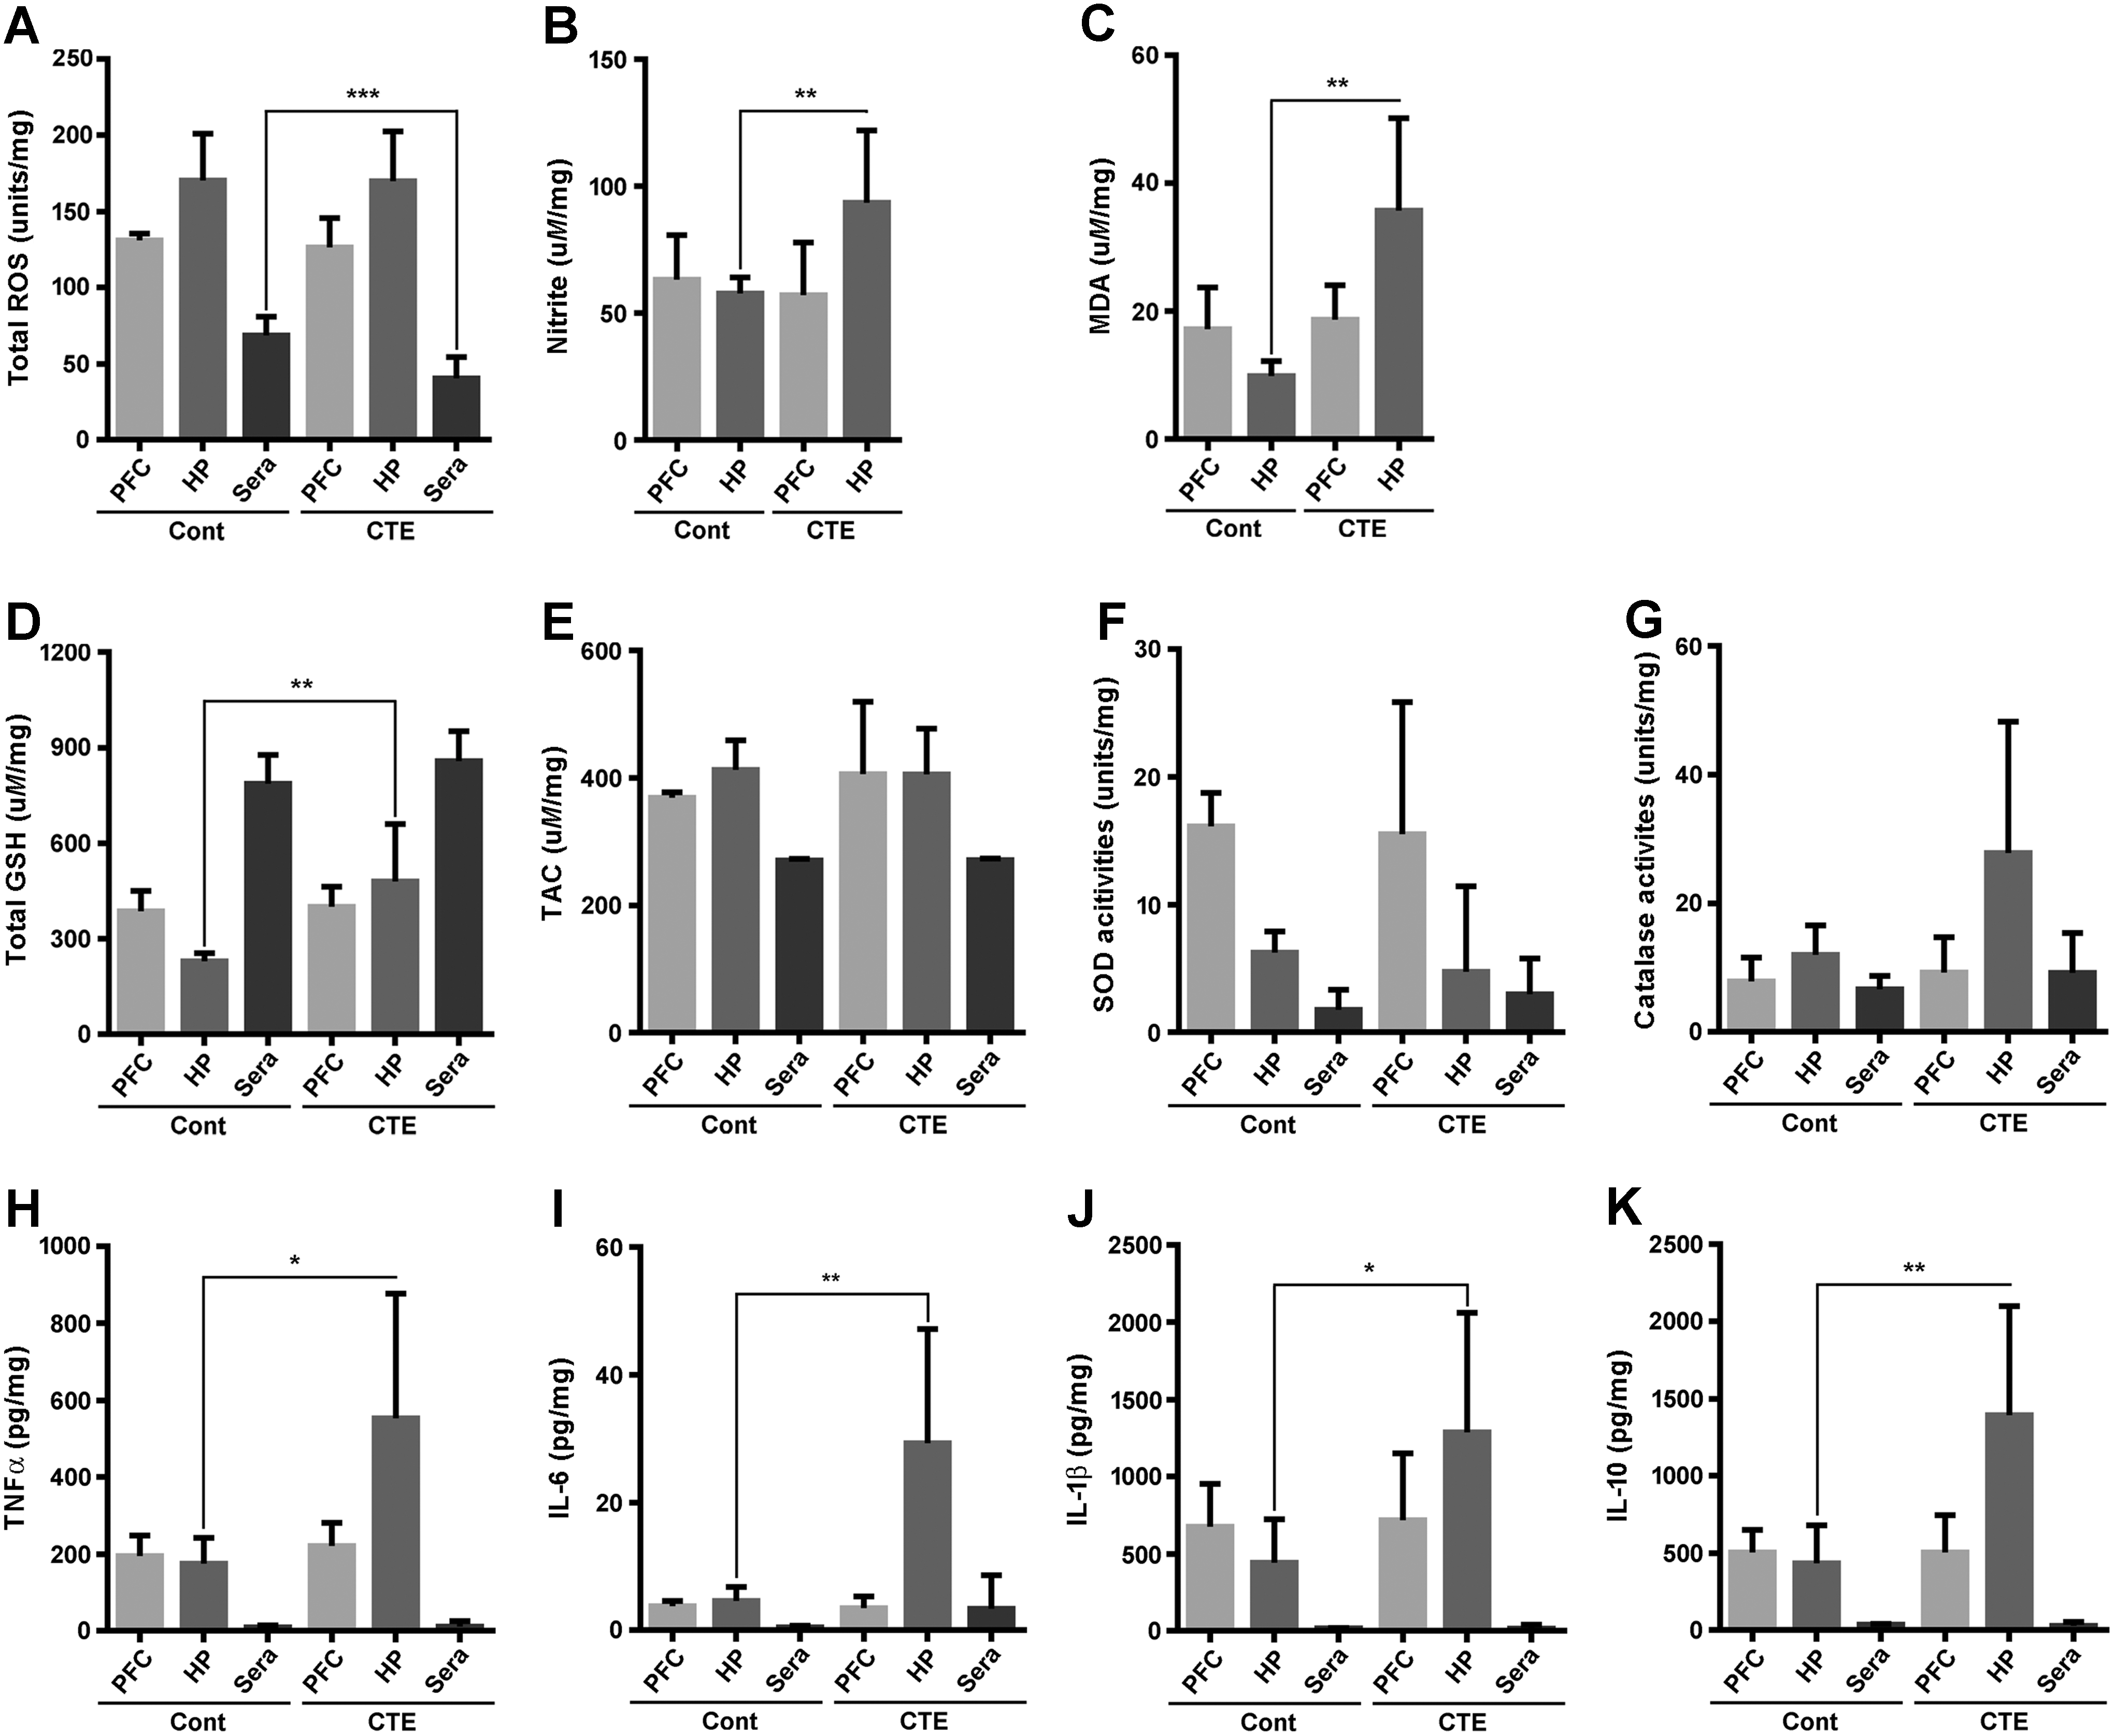
In response to oxidative stress, it is well documented that the antioxidant system prevents acceleration of tissue oxidation. Thus, we also measured total glutathione (GSH) contents, Trolox equivalent antioxidant capacity, superoxide dismutase (SOD), and catalase activities in the cortex, hippocampus, and serum. The total GSH contents in the hippocampal protein levels were only significantly increased in the CTE group compared with the control group (Fig. 4D), but no changes were observed in others (Fig. 4E–G). Western blot analysis of the nuclear factor (erythroid-derived 2) factor 2 (Nrf2) and NADPH oxidase 2 (Nox2) significantly changed, not Nox4 (Supplementary Fig. S6). Since continuous oxidative stress damage is deeply related to inflammation, we next measured the levels of pro- and anti-inflammatory cytokines, including TNF-α, IL-6, IL-1β, and IL-10, in the same manner as above. Results showed that the proinflammatory cytokines TNF-α, IL-6, and IL-1β were significantly increased in only the hippocampal protein of CTE compared with the control group (Fig. 4H–J). IL-10, as an anti-inflammatory cytokine, was also significantly higher than that of CTE mice (Fig. 4K). Next, we checked glutamate concentration in rmTBI mice, since rmTBI-induced secondary injury cascades are thought to result in secretions of glutamate (23). There are no significances on glutamate concentration between rmTBI model mice and control mice (Supplementary Fig. S5B). Our results suggest that oxidative stress is the main pathological phenotype of our CTE model, particularly with damages of the hippocampal area, and that these alterations are closely linked to the progression of inflammation.
Increase in astrocytic iNOS in the CTE model
To evaluate whether iNOS is involved in the astrocyte activations and contributes to the pathogenesis of our CTE model, we further performed double immunofluorescence staining of GFAP and iNOS in both the cortex and hippocampus. Excessive generation of NO, which is mainly produced by iNOS, is well known to the pathogenesis of neurodegenerative diseases, and this condition also eventually accelerates inflammatory response (63). Immunofluorescence results displayed a higher expression of iNOS in GFAP-positive astrocytes in both the cortex and the hippocampus of CTE model mice than in those of the control mice (Fig. 5). Previous study based on in vitro analysis showed that iNOS expression is particularly found in astrocytes (2), but such observation has not been reported in in vivo models as shown here.

Next, we examined the localization of p-Tau and dihydroethidium (DHE) on reaction with superoxide anions. p-Tau and the aforementioned iNOS were colocalized with GFAP-positive astrocyte (Supplementary Figs. S7 and S8), while upregulated DHE signals matched CD31-positive endothelial cell, not a reactive astrocyte/astrocyte in rmTBI model (Supplementary Figs. S9 and S10). To verify that pathophysiological features of our CTE model were initially evoked by abnormal production of free radicals, we adapted free radical scavengers such as vitamin E in mineral oil to mice of CTE group. Interestingly, astrocytic p-Tau, astrocytic iNOS, and DHE signals in endothelial cells were dramatically reduced in the free radical scavenger treatment group compared with the control group (Supplementary Figs. S7–S10). Our data suggest that astrocytes are actively involved in the pathogenesis of CTE via NO production with endothelial oxidative stress.
Enhancement of uncoupled eNOS after rmTBI
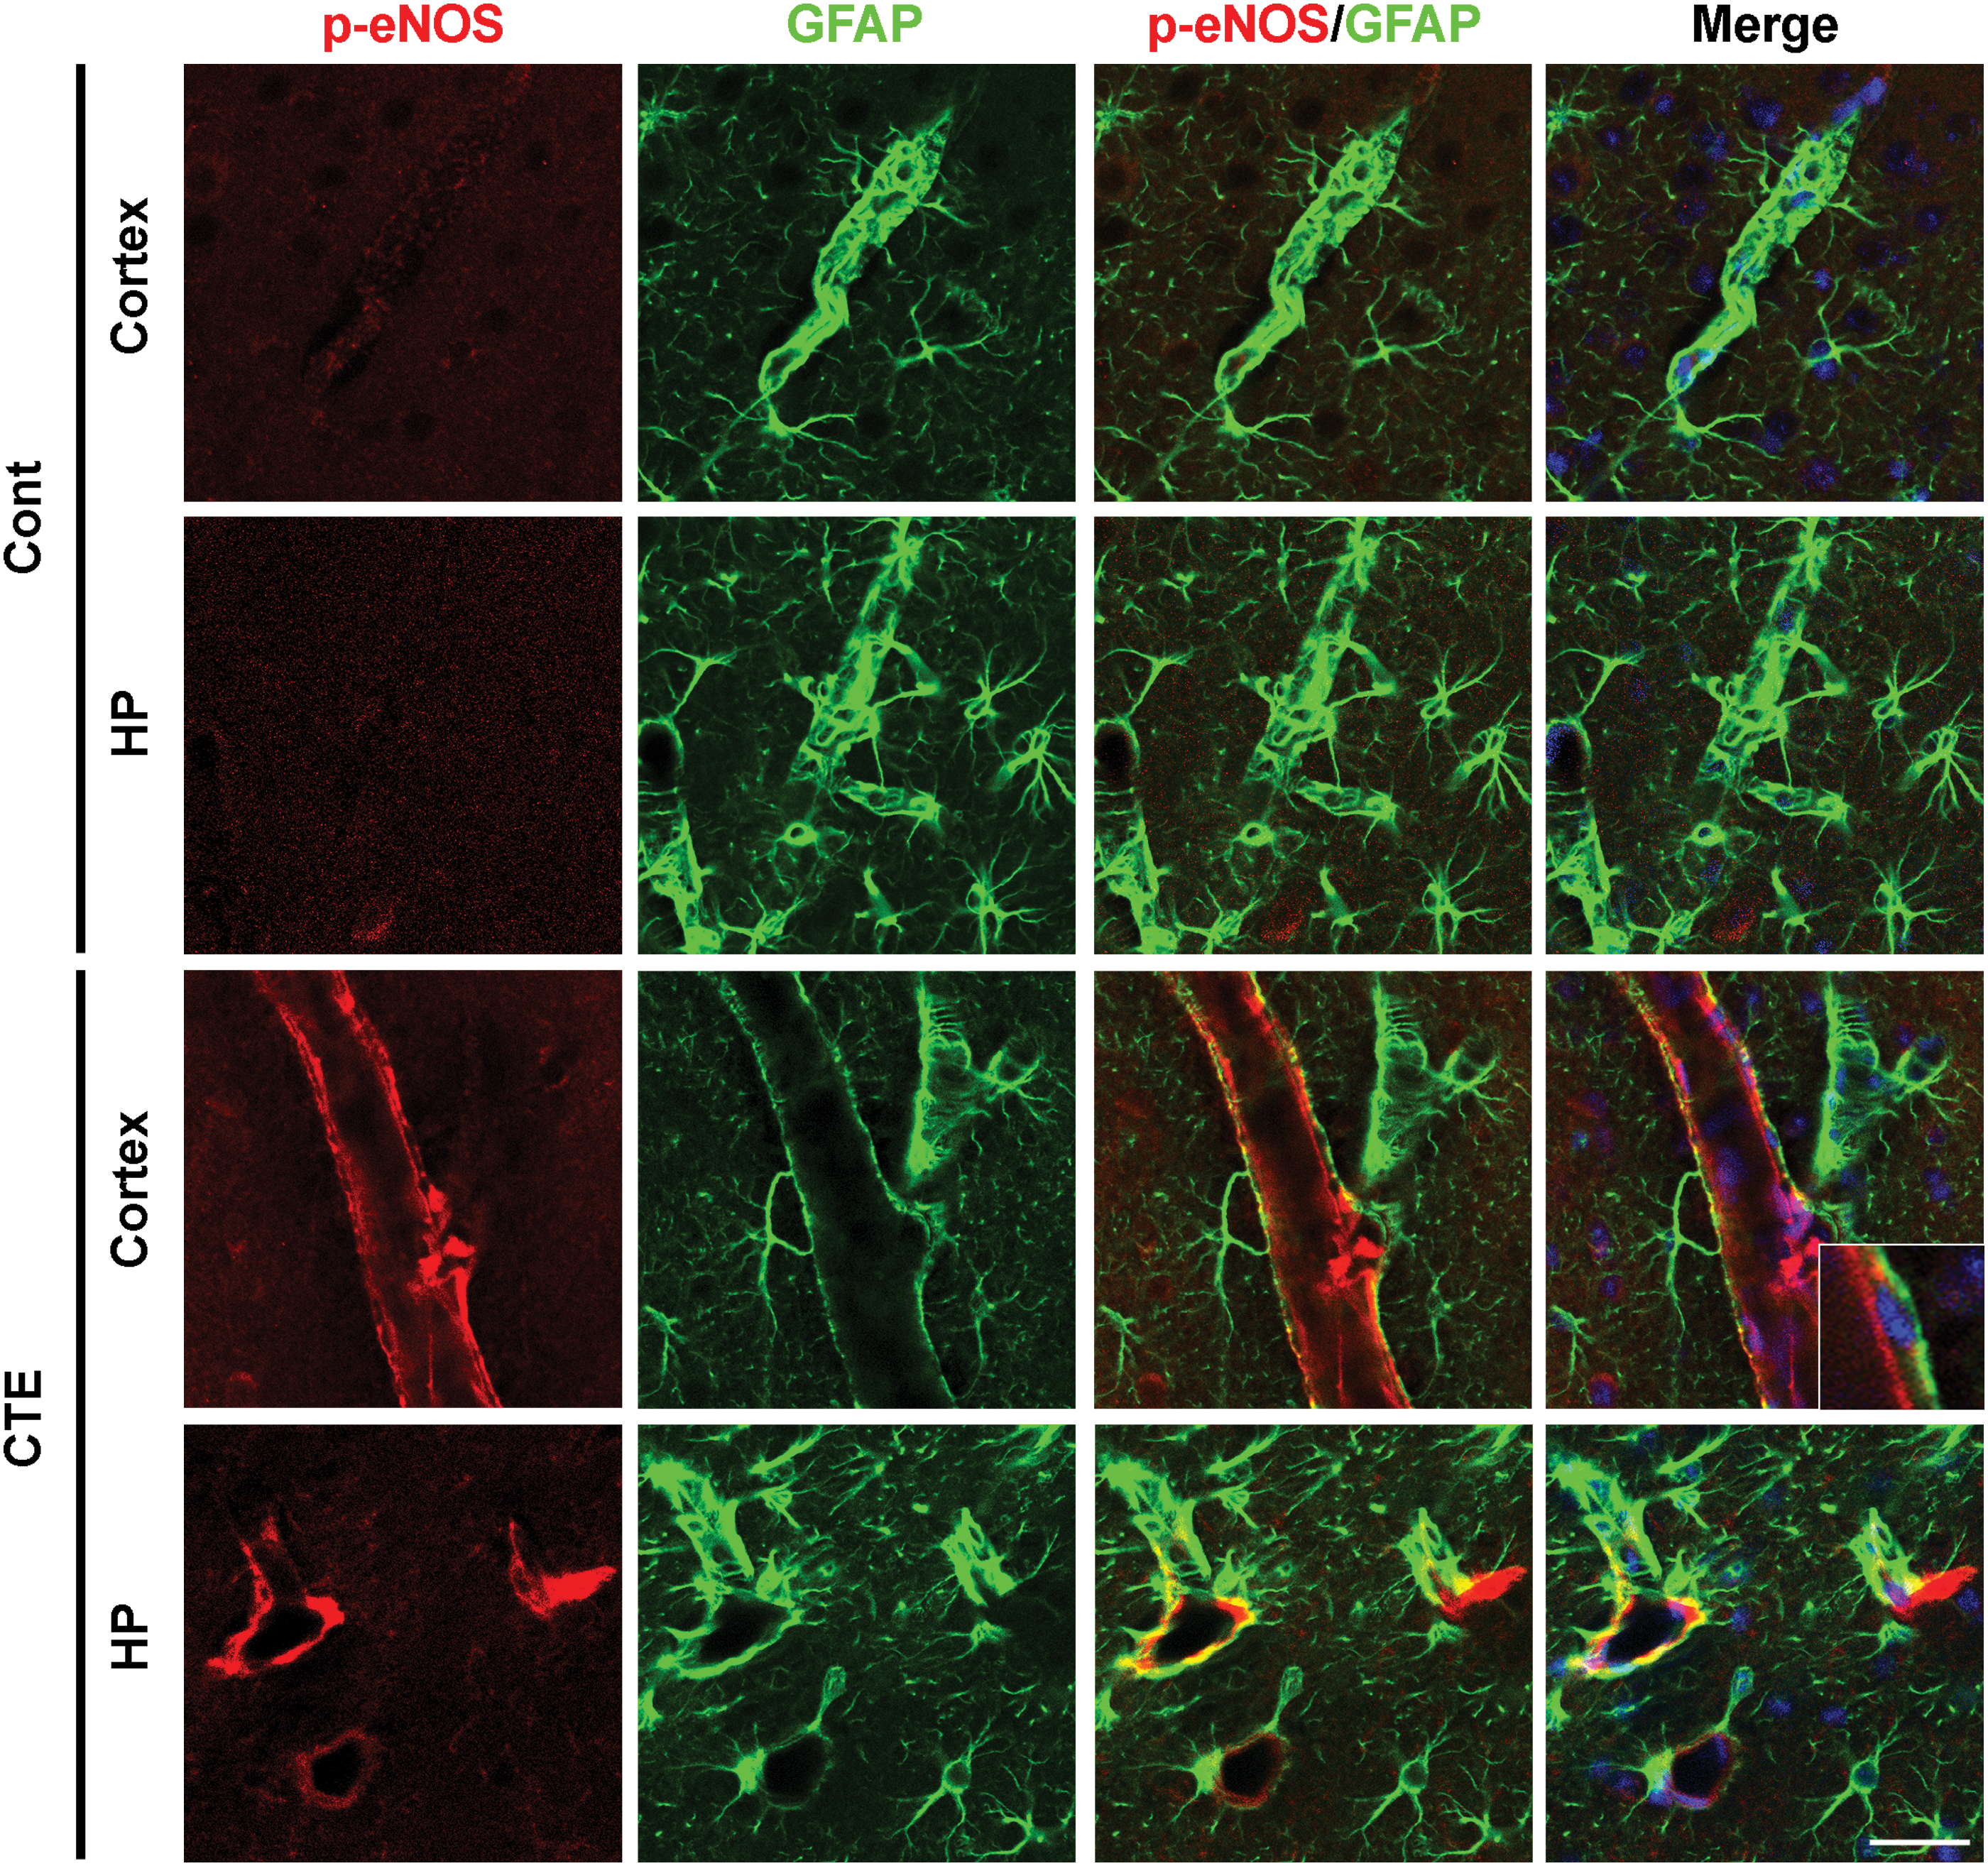
It is well known that excessive generations of NO due to astrocytes can easily react with the superoxide (•O2 −) free radical superoxide to form ONOO− peroxynitrite (67), and astrocytic NO triggers Tau hyperphosphorylation in hippocampal neurons (62). Under certain pathological conditions, eNOS enzymatic activity becomes uncoupled rapidly, resulting in abnormal production of •O2 −. Uncoupled eNOS-derived superoxide leads to the development and progression of cardiovascular diseases, including atherosclerosis, hypertension, and subarachnoid hemorrhage (15, 57, 61). Thus, herein, we investigated eNOS expression and eNOS uncoupling in our CTE model. eNOS activity is regulated by a complex mechanism involving a shift between an uncoupled monomeric form and a biochemically active dimeric form. Phosphorylation status of eNOS provides an indirect evidence of the monomer/dimer ratio (11). We observed a significantly increased expression of p-eNOS, which indicates uncoupling of eNOS, in both CTE mice cortex and hippocampus (Fig. 6), and the Western blot analysis result was also well correlated with upregulation of p-eNOS in CTE model mice compared with control mice (Fig. 7).
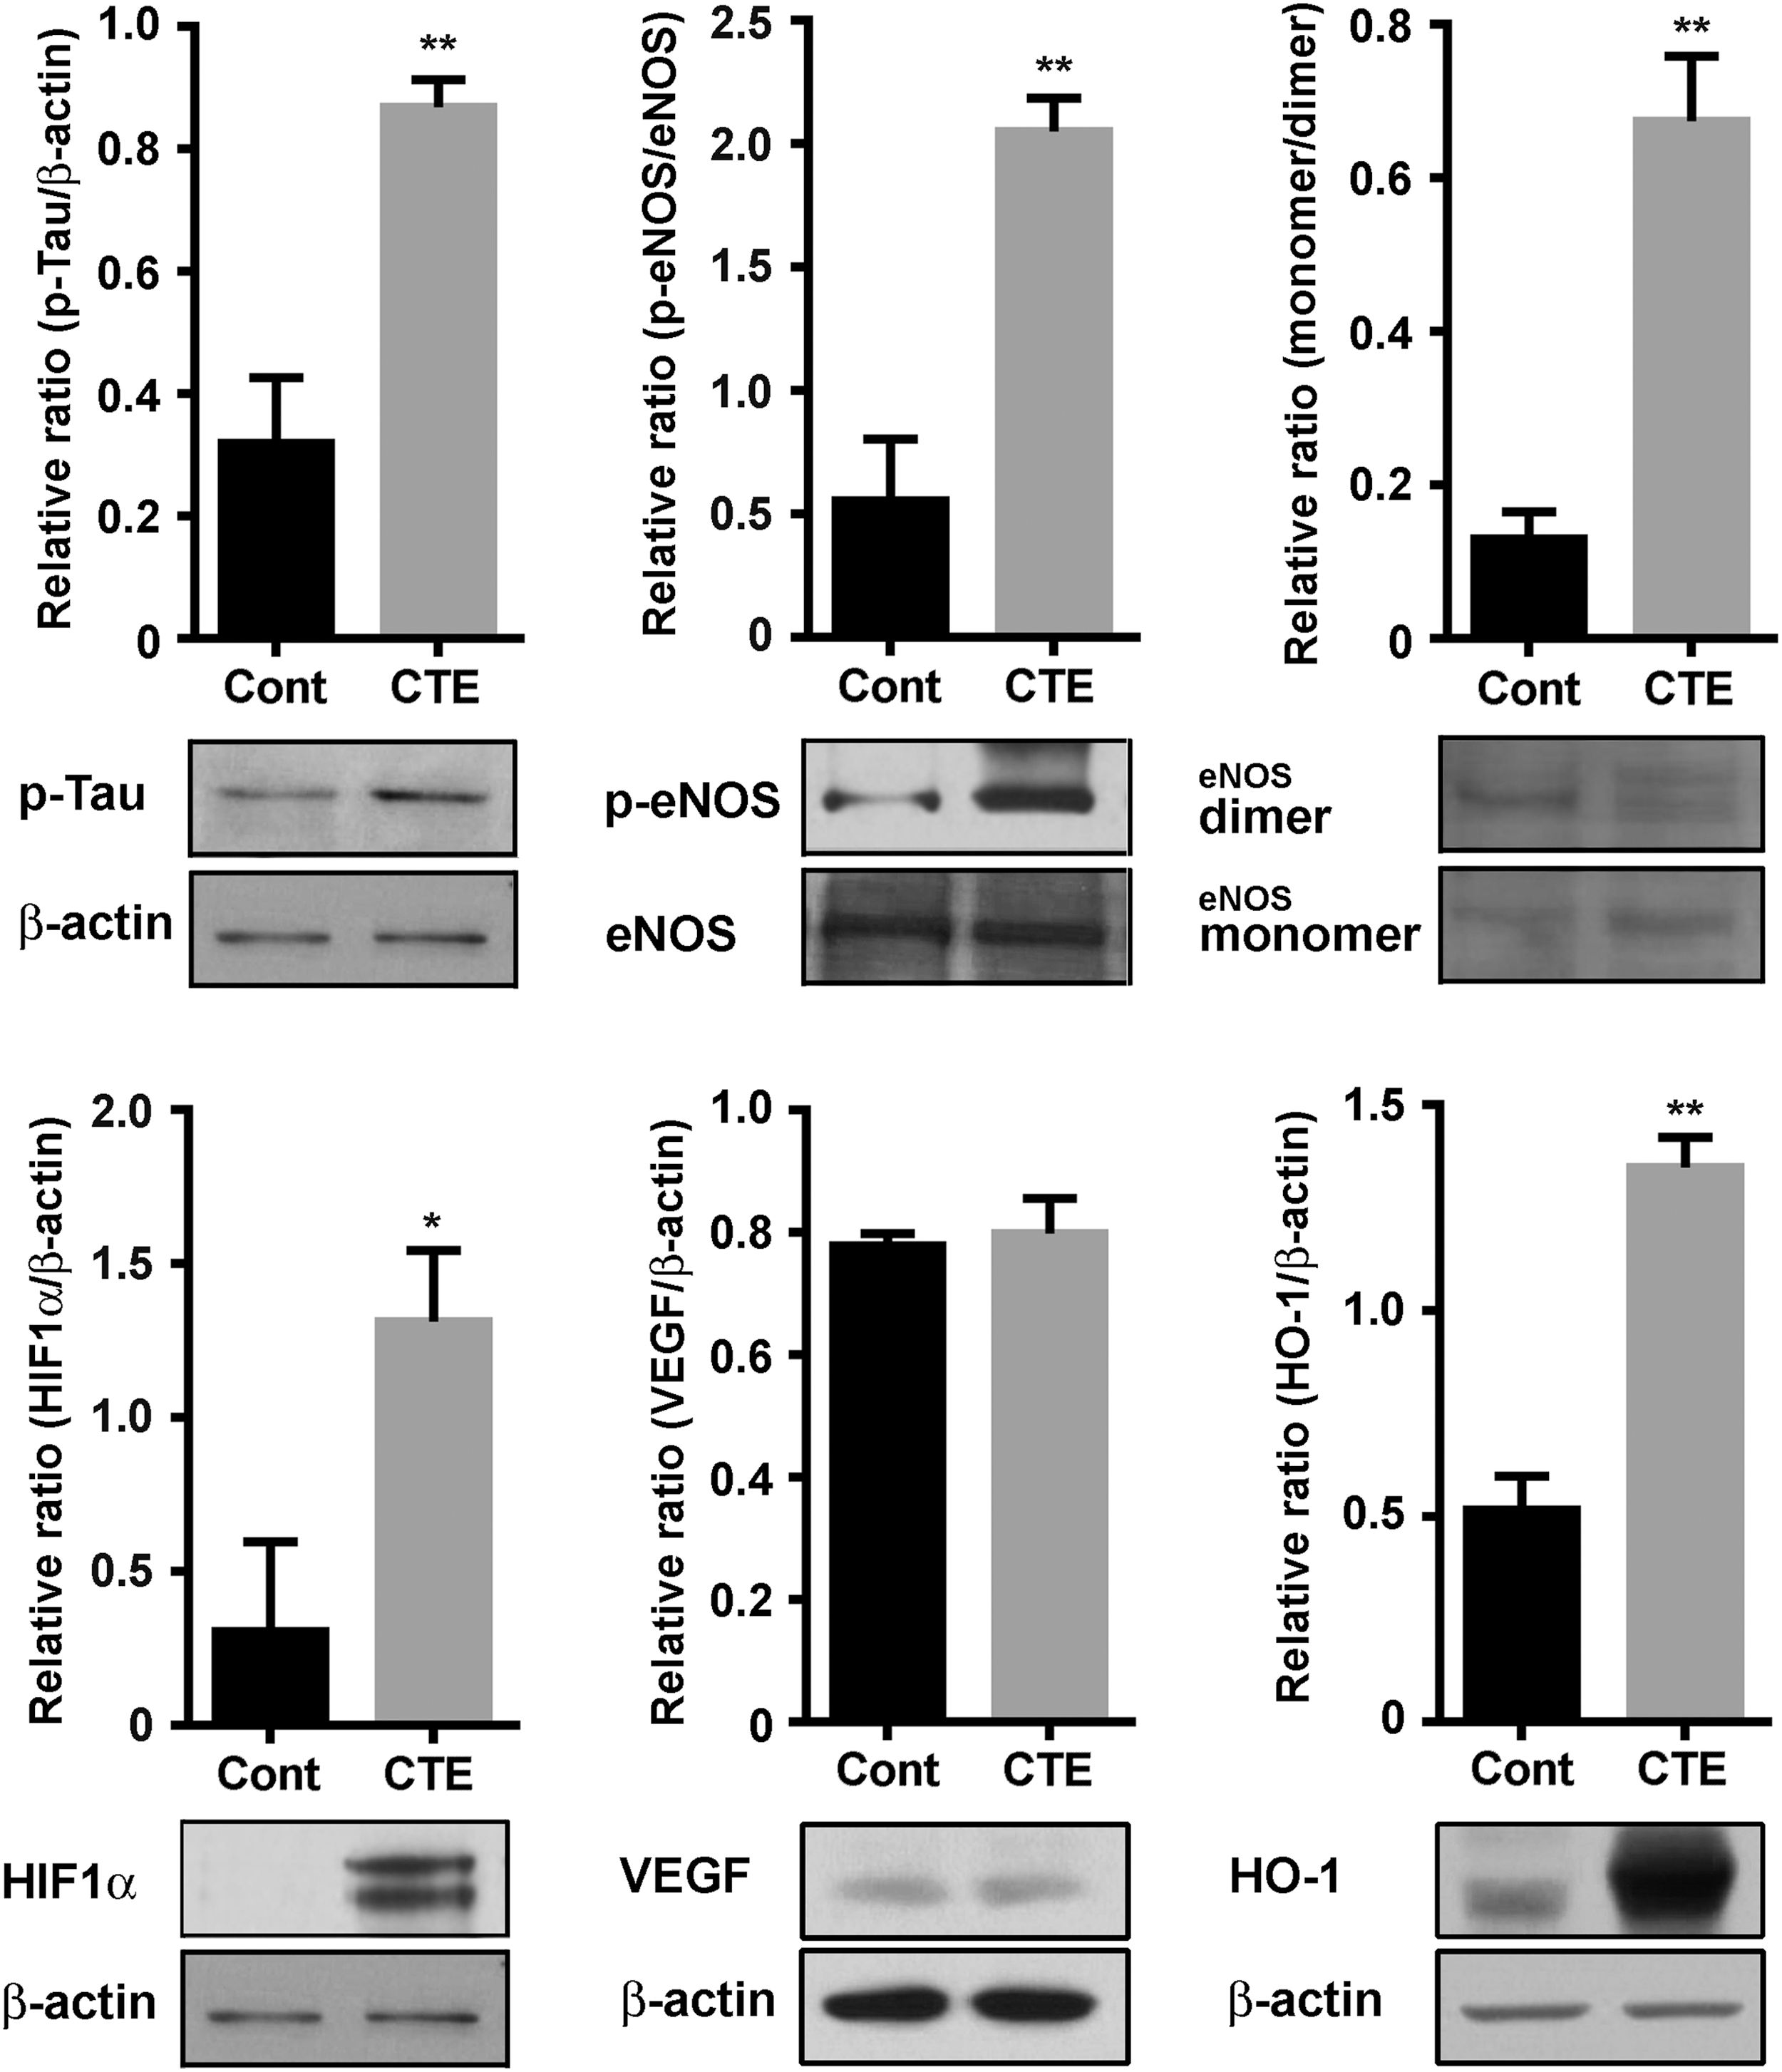
Next, we examined the ratio of monomer/dimer of eNOS, since eNOS coupling is linked to an increased monomerization of the enzyme, with or without changes in eNOS expression (71, 75). As shown in Figure 7, a significant difference in the formation of monomer was exhibited between the control and CTE model. In addition, a tetrahydrobiopterin (BH4) is a crucial factor in eNOS coupling and it also has been used in clinical practice on patients with endothelial dysfunctions (69). Loss of BH4 function can lead to enhancement of oxidative stress conditions by excessive generations of superoxide radicals (14). Therefore, we examined plasma BH4 concentrations via high-performance liquid chromatography (HPLC) analysis to evaluate if rmTBI mice had the expected phenotype of reduced BH4 synthesis. Data showed that rmTBI mice had significantly lower BH4 concentrations compared with controls (Supplementary Fig. S11A). Based on the eNOS uncoupling data, we further investigated markers of BH4 synthesis, including GCH, PIPS, SPR, and DHFR, by Western blot analysis. In the hippocampal protein levels of CTE group, the PIPS, SPR, and DHFR were significantly decreased compared with the control group, but not GCH (Supplementary Fig. S11B).
Reduced cerebral tissue perfusion units after rmTBI
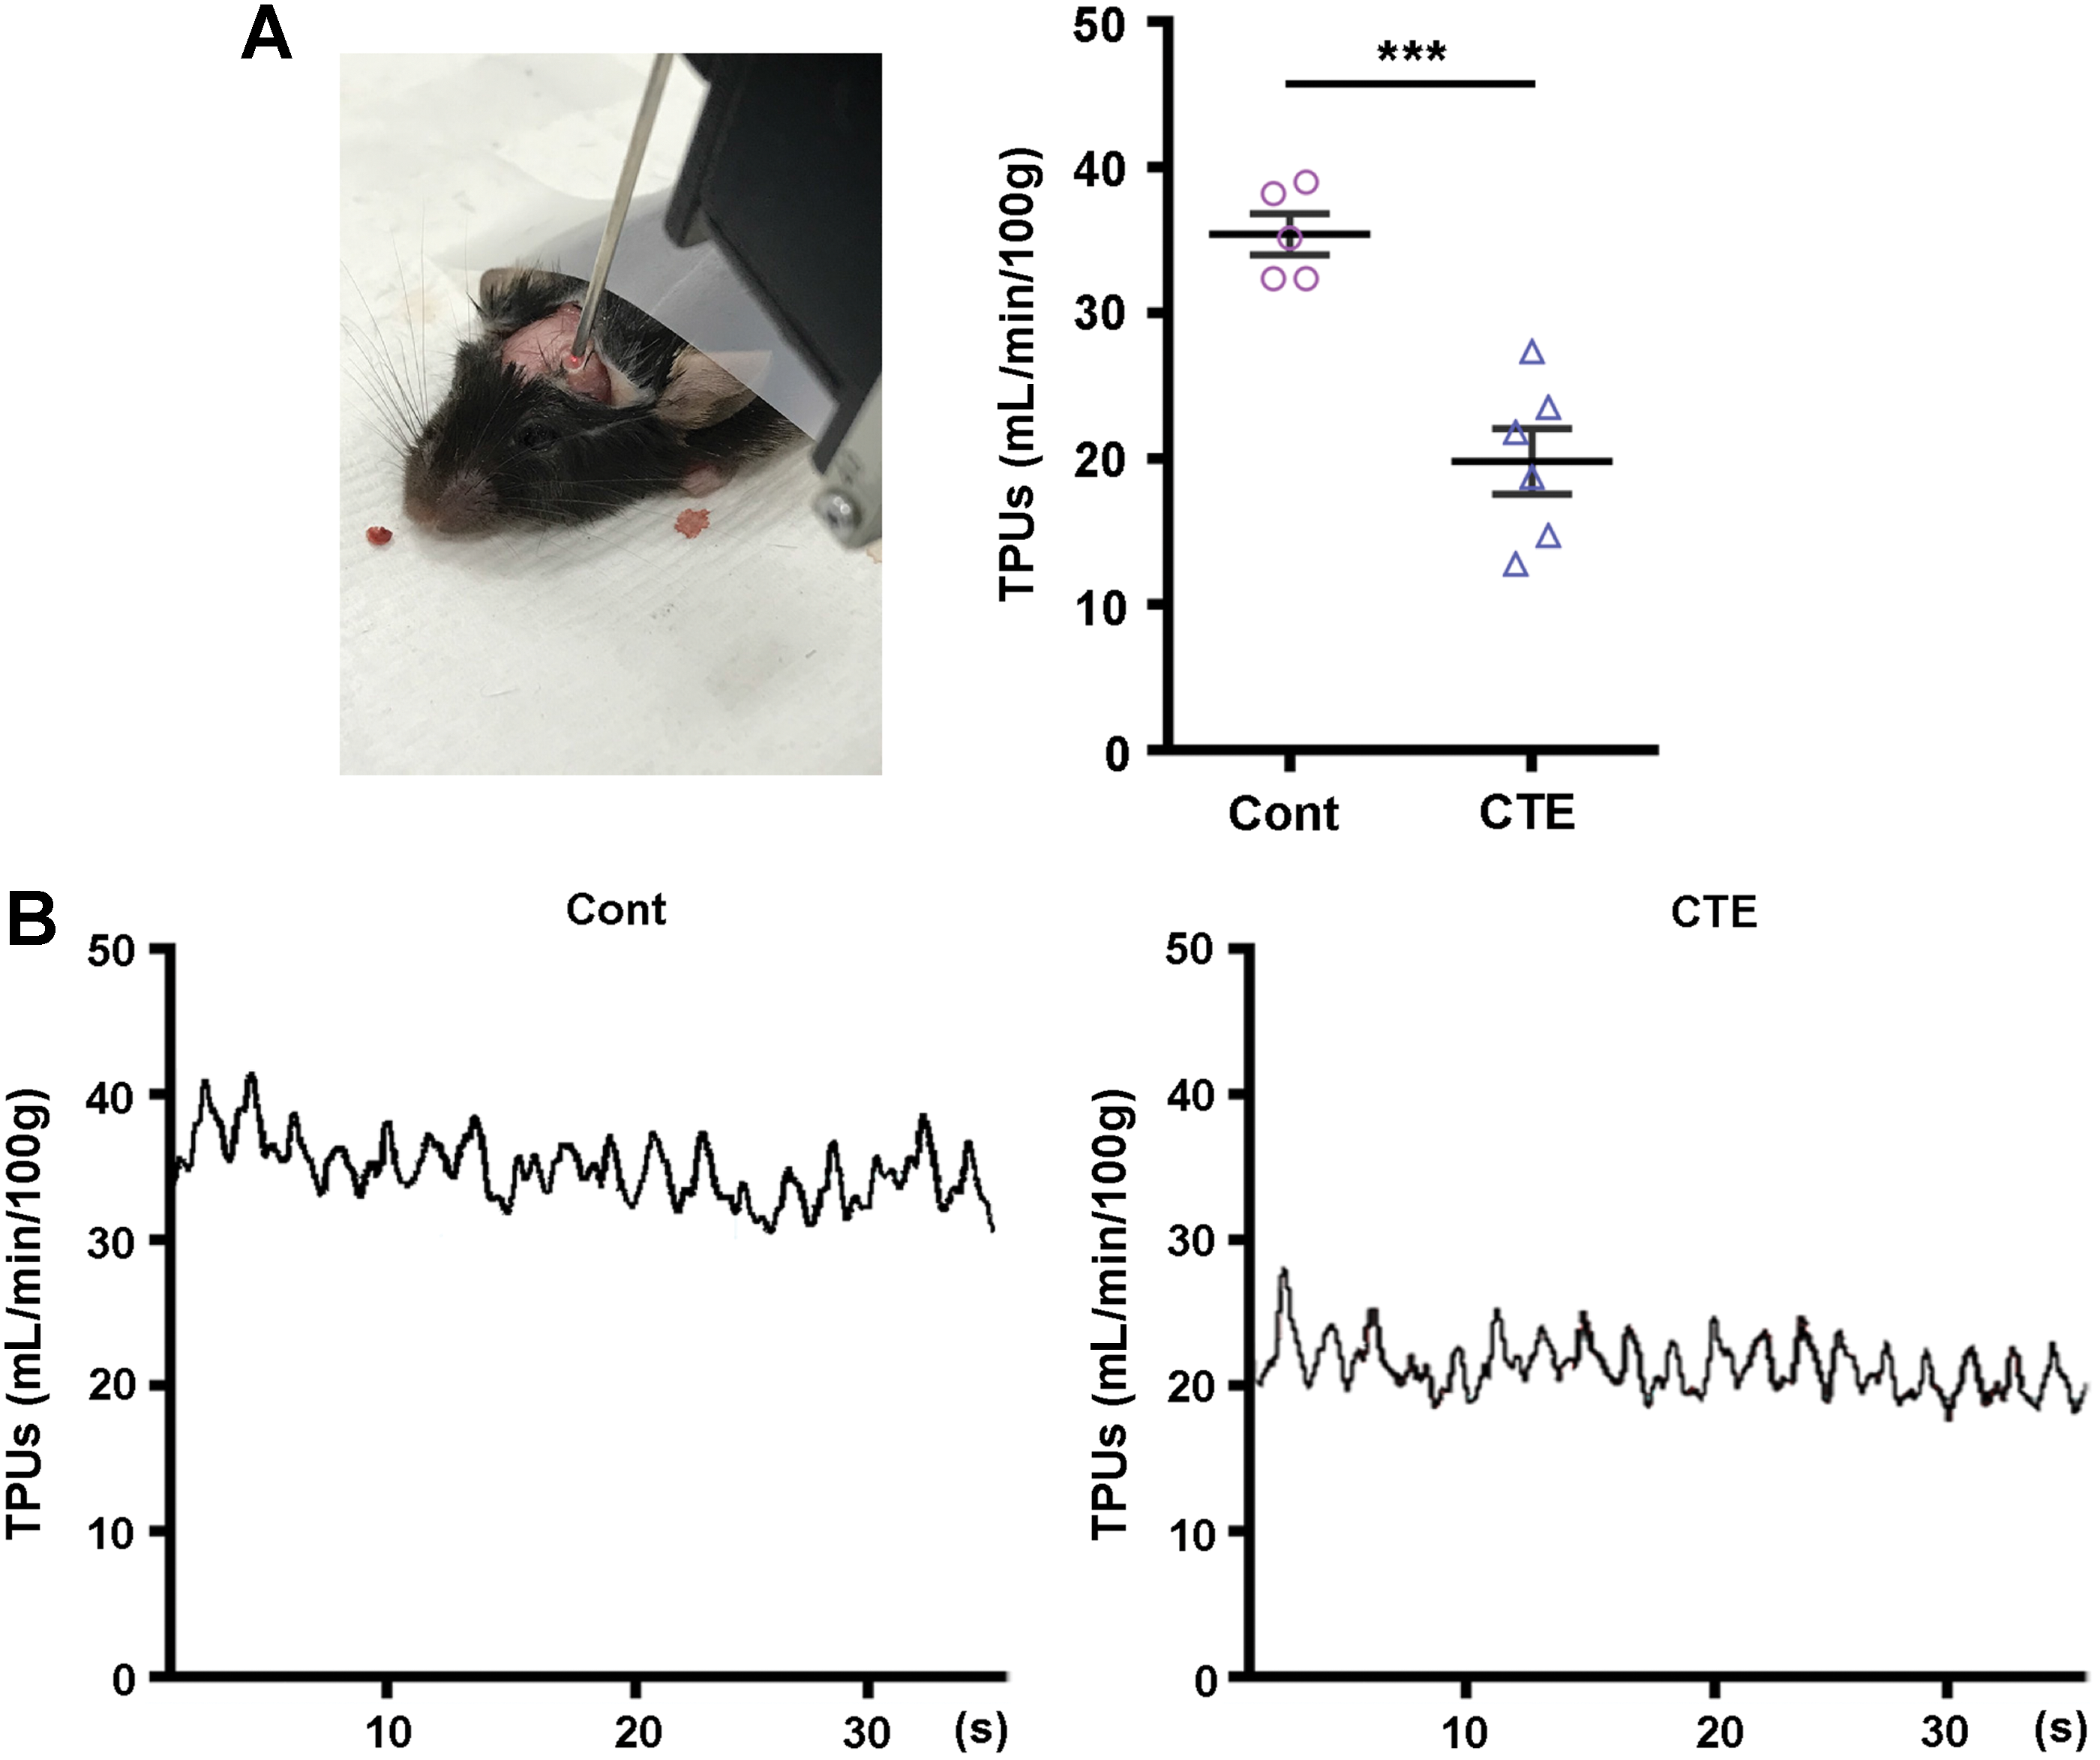
At the same time, we also investigated whether hypoxia can evoke Tau hyperphosphorylation and eNOS uncoupling in our rmTBI model. Evidence from our Western blot analysis, which targeted hypoxia-inducible factor 1-α (HIF1α) as a master transcriptional regulator of cellular and developmental response to hypoxia, was notably increased in the CTE group of hippocampal protein levels compared with the control group. Vascular endothelial growth factor (VEGF) and heme oxygenase-1 (HO-1) are target proteins of HIF1α-dependent signaling pathways (34). Our result showed that the VEGF in the hippocampal protein levels was not altered, but HO-1 levels were significantly increased compared with the control group (Fig. 7, lower panel). Furthermore, the reduced cerebral tissue perfusion unit (TPU) values of our CTE mice also well supported the above pathophysiological alterations (Fig. 8). Taken together with superoxide product in endothelial cells (Supplementary Figs. S9 and S10), these data suggest that uncoupled eNOS of the endothelial cells plays a critical role in pathogenesis progression of CTE after rmTBI, and these phenomena are deeply related to HIF1α expression by hypoxia.
Increase of both p-Tau and iNOS expression in astrocytes in accordance with NFκB signaling in the hypoxic state
Previous studies reported that an overproduction of NO directly or indirectly impairs physiological homeostasis and can lead to neurodegenerative disorders (17, 29). Particularly, iNOS, which is mainly triggered by NFκB, is closely linked to oxidative stress and inflammation progression. In addition, iNOS is especially increased abnormally in brain tissue under the hypoxic state (27). Thus, we examined both the in vitro and in vivo responses of astrocytes in the hypoxic state. Evidenced by double immunostaining for detecting p-Tau in reactive astrocytes under hypoxic condition, the positive signals in both the nucleus and cytoplasm were considerably increased (Fig. 9A). The above results correlated well with protein-level alterations found in Western blot analysis, including NFκB, IκB, p-Tau, iNOS, and HIF1α, but not Cox2 (Fig. 9B). Astrocytic expression of p-Tau increased in a time-dependent manner in the hypoxic state. To verify the molecular cascade events, an investigation of the NFκB pathways on Tau phosphorylation and hypoxia insults was undertaken. Phosphorylated p65 also increased and IκB degradation decreased after 24 h in the hypoxic state, while increased iNOS protein levels were apparent after 48 h. HIF1α protein levels increased peaking at 24 h.

The above alterations are also deeply associated with oxidative stress signaling pathways. We thus evaluated various markers of oxidative stress under hypoxic conditions in a time-dependent manner using primary cell cultures of astrocytes, neurons, and microglia cells, respectively. We used CellROX®, fluorogenic probes designed to reliably measure oxidative stress in live primary astrocytes, neurons, and microglia cells. CellROX staining showed increased level of oxidative stress in astrocytes, neurons, and microglial cells, however, mostly astrocytes under hypoxic conditions (Supplementary Fig. S12). Furthermore, hypoxic conditions increased the level of nitrotyrosine, Nrf2, and Nox2, not Nox4, in astrocytes (Supplementary Fig. S13), and nitrotyrosine and Nrf2, not Nox2 and Nox4, in microglia (Supplementary Fig. S14). Western blot analysis and immunocytochemistry data also supported that oxidative stress was excessively evoked through all cell types, and the related molecules were also remarkably altered under hypoxic conditions (Supplementary Figs. S12–S14). We additionally measured the calcium ion (Ca2+) efflux assay using glutamate treatment and hypoxia. The astrocyte was more considerably enhanced with the signals of Ca2+ disturbances in both conditions than other cell types (Supplementary Fig. S15).
Enhanced p-Tau expression with astrocytic NO and endothelial uncoupling by hypoxic state
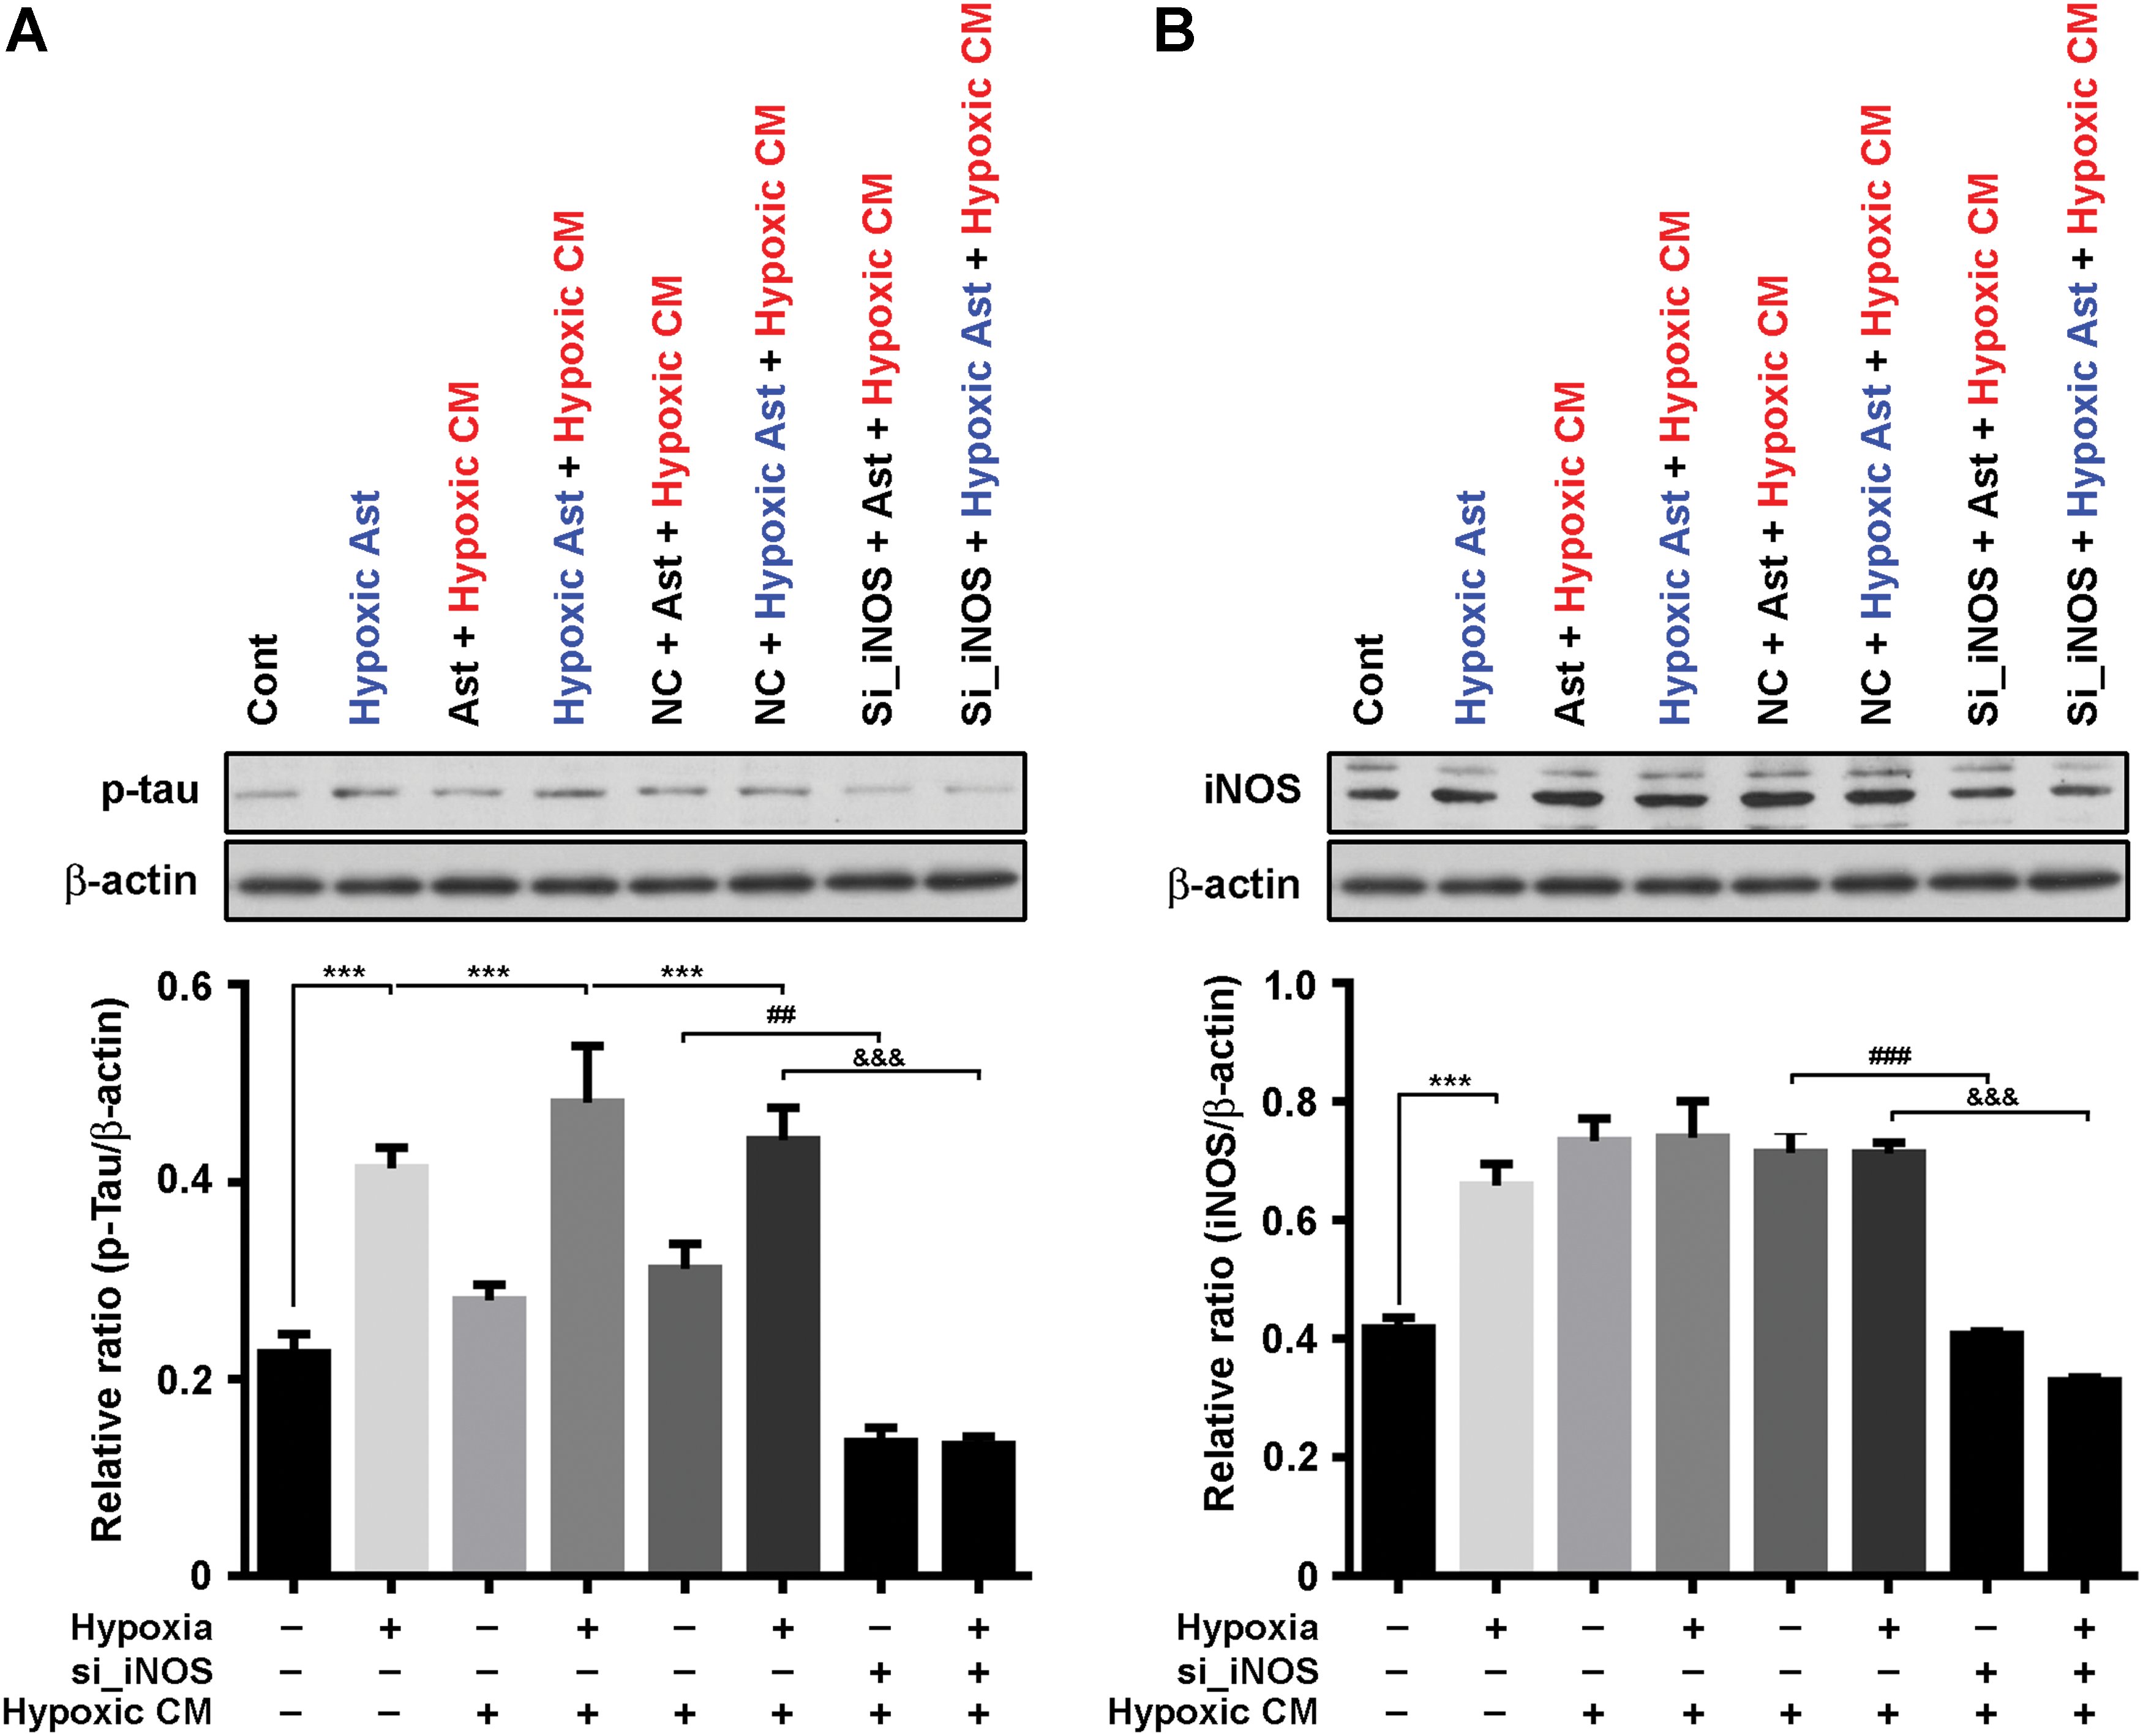
Next, we sought to determine whether astrocytic NO and endothelial eNOS uncoupling contribute to phosphorylation of Tau in astrocyte. We cultured primary astrocytes using conditioned media (CM) collected from hypoxic human umbilical vein endothelial cell (HUVEC) for 48 h, known to have increased level of eNOS uncoupling in hypoxic conditions (60). Preincubation of hypoxic insult caused a significant increase of p-Tau expression in astrocyte; however, preincubation with hypoxic insult followed by treatment with CM effectively increased p-Tau expression more than only hypoxic insult (Fig. 10A). To determine whether increased p-Tau expression with hypoxic astrocyte followed by CM is dependent on astrocytic iNOS, we used a loss-of-function strategy using iNOS small or short interfering RNA (siRNA, si_iNOS) in cultures of astrocyte. Transient knockdown of iNOS significantly decreased p-Tau and iNOS expression (Fig. 10B).
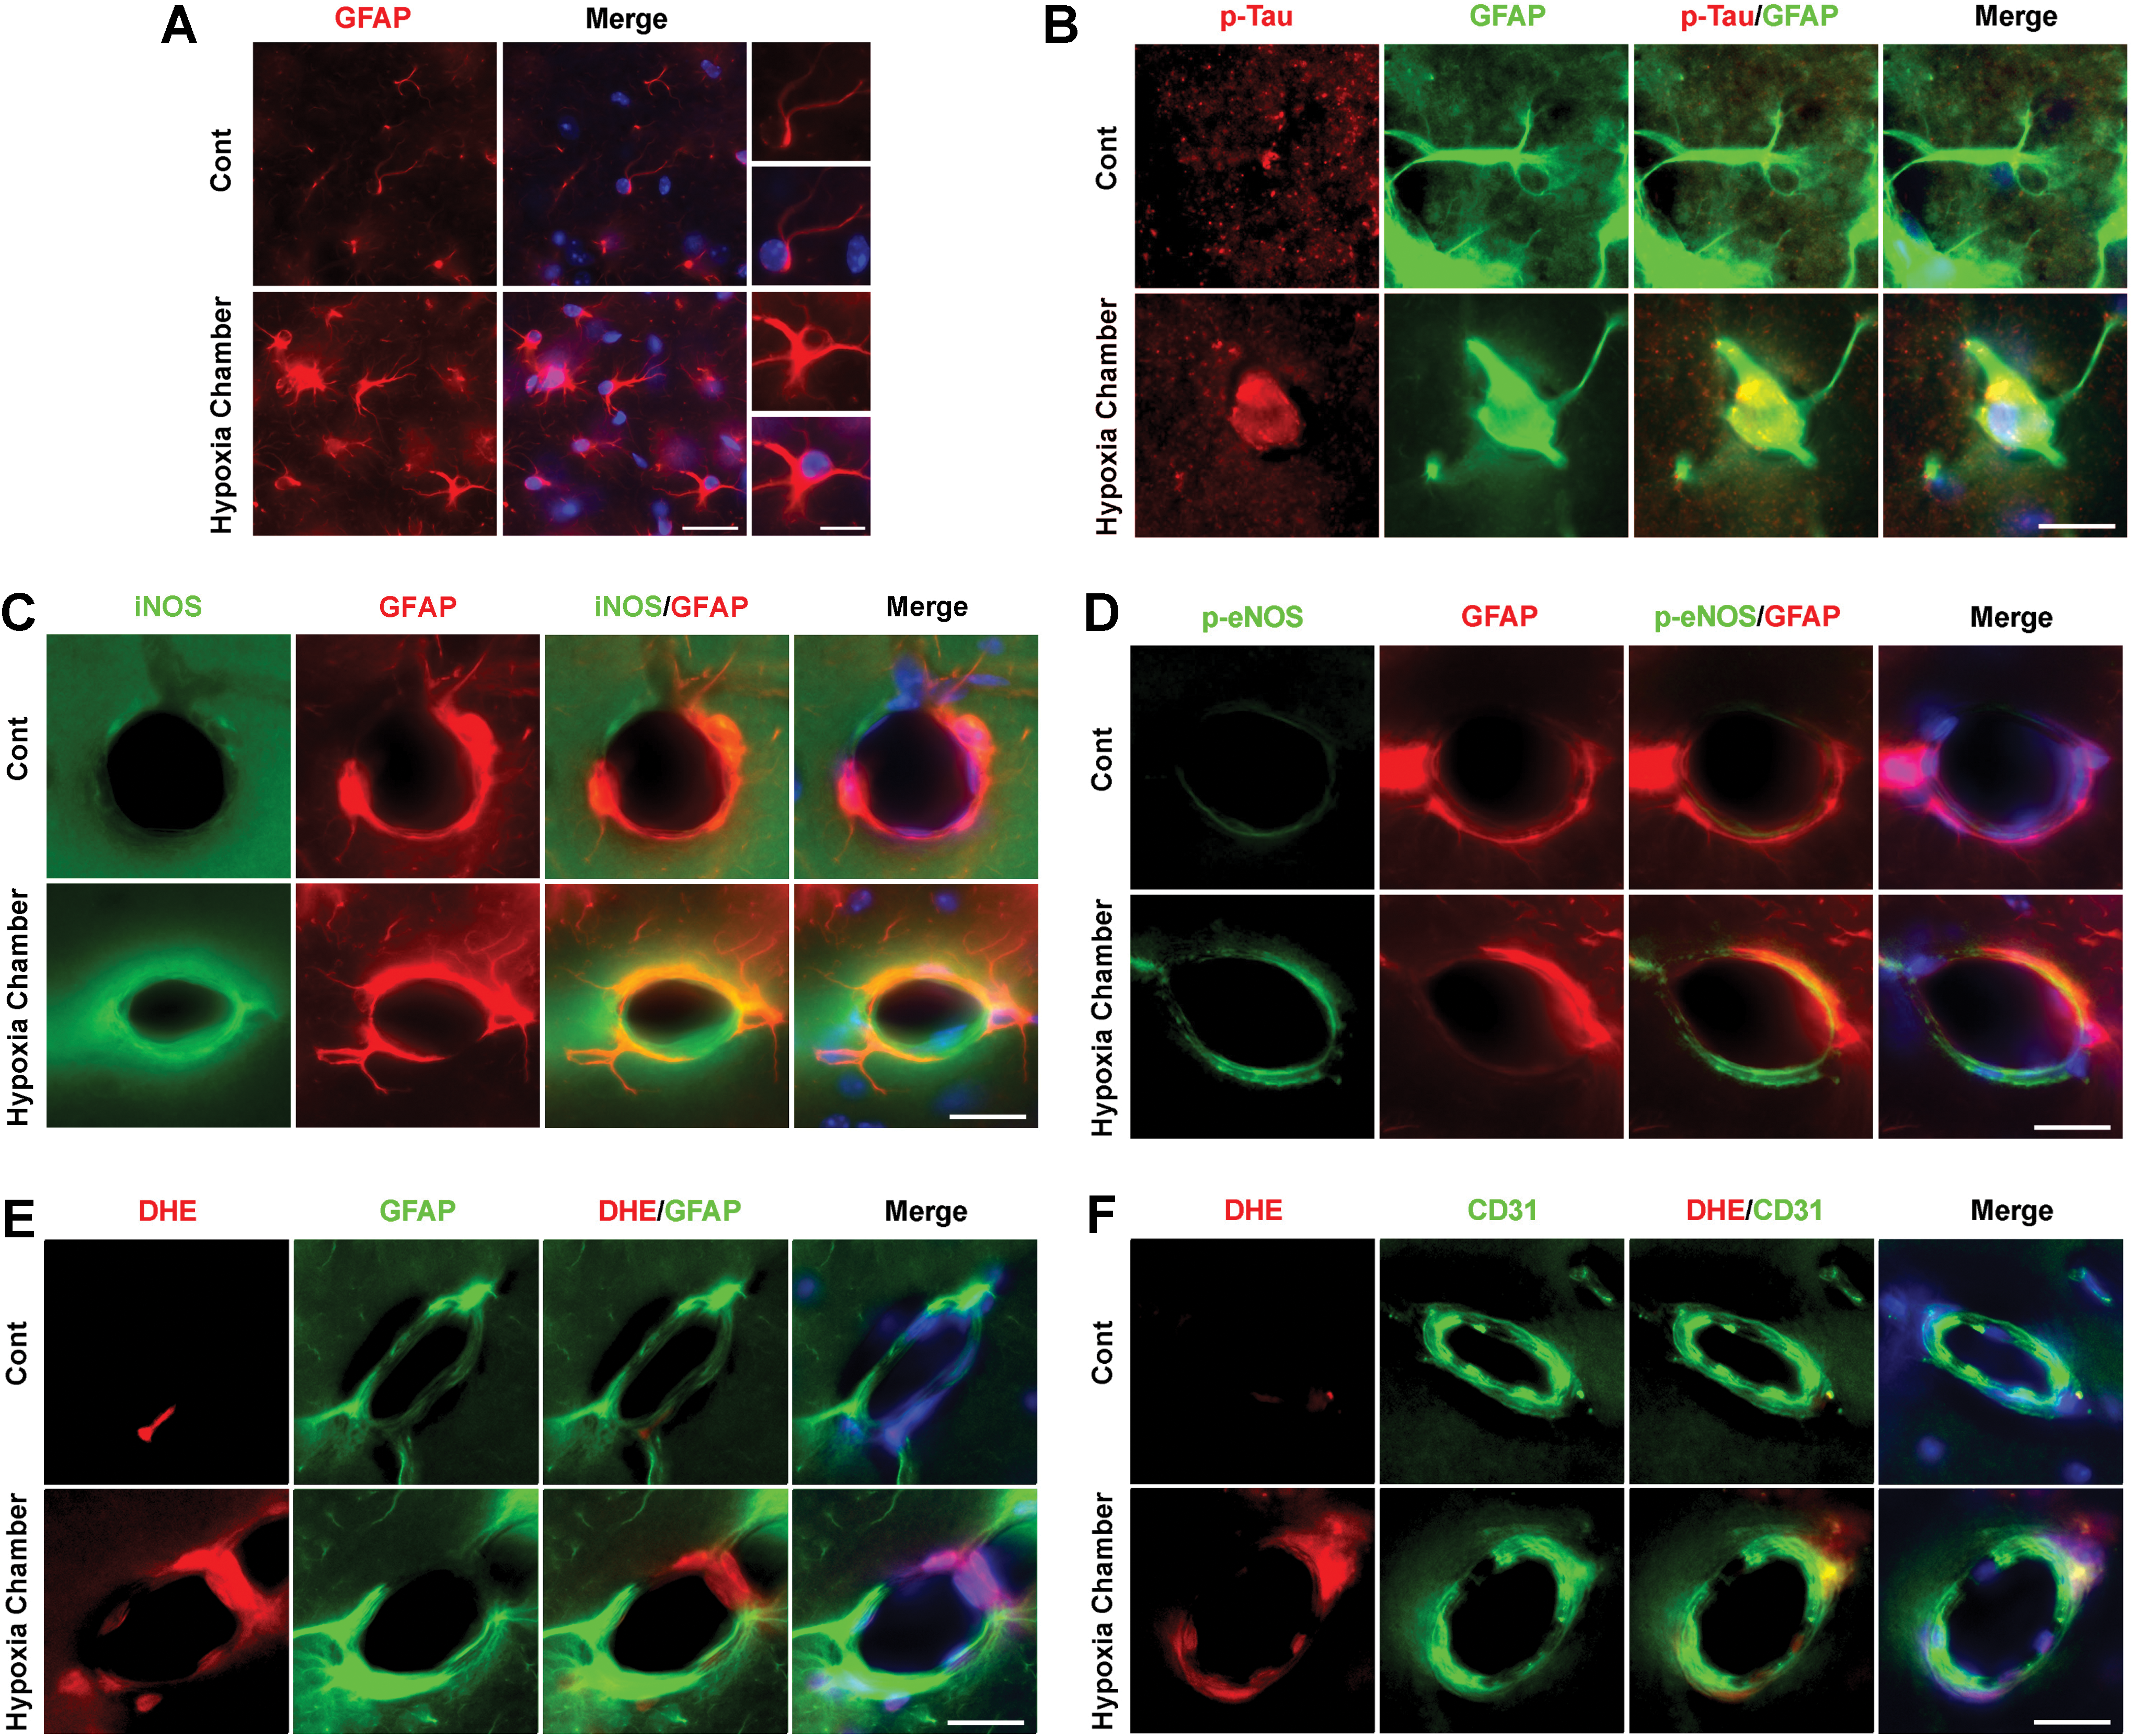
Finally, we confirmed that hypoxic conditions can evoke Tau hyperphosphorylation and eNOS uncoupling in vivo. Mice were housed in hypoxia chamber (11% O2) for 7 days (6 h, 11:00–17:00) (Supplementary Fig. S16). Astrocyte activation with GFAP IRs was found in the hippocampus of mice in hypoxia chamber (Fig. 11A). In those conditions, p-Tau and iNOS were expressed in astrocytes, however, p-eNOS was not in astrocytes (Fig. 11B–D). Furthermore, DHE signals were found in endothelial cells, not astrocytes (Fig. 11E, F). The above observations supported that hypoxia insults lead to both HIF1α and NFκB activation in astrocytes, followed by iNOS and Tau phosphorylation with eNOS uncoupling in endothelial cells. These data suggest that astrocytic iNOS and endothelial uncoupling followed by hypoxic insult synergically contribute to p-Tau expression in astrocytes.
Discussion
CTE has a distinctive neuropathological pattern and distribution of p-Tau tangles that differ from other tauopathies. In Alzheimer's disease, p-Tau originates mostly from neuronal cells and not from astrocytes, although low densities of four-repeated Tau IR “thorn-shaped astrocytes” have been found in the temporal lobe of some elderly patients (42, 45). In CTE, p-Tau-IR NFTs as well as prominent ATs are found in the frontal and temporal cortices, particularly around the small cerebral vessels and at the depths of cerebral sulci (51). Therefore, it is important to reveal the pathological mechanism of development of ATs and their localization of brain tissues, which are prominent features of CTE patients. The current concepts of mechanisms underlying primary and secondary injury mechanisms in TBI are also applicable here (68). Early on after injury, energy metabolism is disrupted through the release of glutamate and the disturbances of other ions such as Na+, Ca2+, and K+, resulting in decreased cerebral blood flow/perfusion pressure. Later, further neuroinflammatory alterations can emerge by damages of brain tissues resulting in other clinical effects such as hypoxemia, hypotension, fever, and seizures. These secondary molecular and clinical factors lead to progressive tissue damage (23). Therefore, it is conceivable that decreased blood oxygen supply and enhancement of vascular oxidative stress are the initial events, and then, hypoxia-induced astrocytes result in Tau phosphorylation.
As a confirmation that our rmTBI model properly mimics CTE pathophysiology, we observed a significantly accentuated depression and memory deficit in our mice (Fig. 1). We also found an increased function of BDNF and CREB in the hippocampus of rmTBI model (Supplementary Fig. S1). Our results are consistent with many prior studies that indicated that the dysregulation of BDNF and other neutrophins is correlated with TBI by reducing secondary injury, providing neuroprotection, and restoring neural connection (38), and we believe the increased BDNF and CREB function in the hippocampus may possibly compensate for the spatial memory deficits found in our rmTBI models.
As the activations of astrocyte are the main target of pathophysiological mechanism to progression and development of the CTE, we first observed for neuropathological changes, including the expression of p-Tau, in a CTE model following rmTBI. In general, p-Tau IR was noticeably diffuse in the cortex and hippocampus of the brains of CTE model. Increased p-Tau IR was most striking in neuronal cells in the pyramidal cell layer of the hippocampal region of CTE model (Fig. 2). Interestingly, we found enhanced p-Tau expression in reactive astrocytes in the same hippocampal region in CTE model (Fig. 3) with chronic astrogliosis and microgliosis in the hippocampus induced by rmTBI (Supplementary Figs. S3 and S4).
Previous studies documented that oxidative stress is one of most predominant features of TBI (59), which is initiated by excessive production of free radicals, such as ROS and NO. In our CTE model, the nitrite (indirect markers of NO) and MDA levels in the hippocampi were significantly increased, but not ROS. Even if the ROS play crucial roles of complete oxidation on the progression of pathophysiological condition, the reaction might have occurred too quickly (33). Whether early event of ROS production occurred in our CTE model, we examined hippocampal protein levels of nitrotyrosine by Western blot analysis. Consistent with our expectations, nitrotyrosine levels in the hippocampal protein were significantly increased, and DHE staining also reenacted it (Supplementary Figs. S6, S9, and S10). On the progression of oxidative injury, especially excessive generations of ROS, our CTE model was characterized by activation of Nox2/Nrf2 signaling pathways. In addition, even if VEGF signal was not altered, HO-1 protein levels were considerably increased in the CTE group. It is likely that it was mediated by negative feedback of severe oxidation condition, as it was previously suggested that Nrf2/HO-1 cascade inhibits oxidative stress-sensitive NFκB activation (1, 5).
By preventing oxidation, the antioxidant component is involved in maintaining homeostasis (7, 64), but we did not observe its defensive effect excluding total GSH contents in the hippocampus (Fig. 4). Along with oxidative stress, this kind of tissue damage is closely linked to the inflammatory response. Previous studies also reported that neuroinflammation contributed to the development of TBI (19). The representative proinflammatory cytokines, including TNF-α, IL-6, and IL-1β, were significantly increased in the CTE group. Interestingly, anti-inflammatory cytokine IL-10 was also upregulated in the hippocampal protein levels (Fig. 4).
In this study, we mainly targeted the hippocampus, which is a target area to oxidative injury in the brain tissue (12). Upregulation of iNOS expression in the astrocytes of the hippocampus of the CTE group was also remarkably enhanced, which correlated with the positive signals of GFAP (Fig. 5). In addition, the nitrite contents in the hippocampus also coincided well with them. Furthermore, uncoupled eNOS signals were also enhanced similarly with iNOS in the CTE group (Fig. 6). It might be that our CTE model has the ability for NO production by uncoupling eNOS from ATs and it can lead to damages of hippocampus, particularly. To confirm these pathological events, we observed that BH4-related molecules PIPS, SPR, and DHFR were considerably impaired in the hippocampus (Supplementary Fig. S11).
Repetitive TBI may trigger the focal hypoxia around small vessels and excessive productions of free radicals, such as ROS and NO. These phenomena were deeply associated with the hypoxic state that was proven by HIF1α expression in hippocampal protein levels. Herein, we hypothesized that repetitive TBI triggers focal hypoxia especially in small vessels and initiates oxidative injury by generation of ROS and NO. As expected, exposure to hypoxic conditions elicited an increase in iNOS and NFκB production, which are responsible for oxidative damage. It is reported that hypoxic brain injury is accompanied by an inflammatory response and oxidative metabolism (74). The above possible molecular events well supported our results that were performed under hypoxic conditions. Primary cell cultures of astrocytes, neurons, and microglia considerably enhanced oxidative stress signals, and related molecules such as nitrotyrosine and Nrf2 were also markedly altered in all three cell types by hypoxia (Supplementary Figs. S12–S14).
Reactive astrogliosis and glial scar formation are prominent features of central nervous system (CNS) trauma and play important roles in determining neurodegenerative disease (13, 32, 65). Activation of astrocytes often contributes to neuronal damage and inhibits axonal regeneration after CNS trauma (53, 66). Several studies suggest that all three NOS isoforms can be expressed in astrocytes (54). Transmitters that induce Ca2+ signaling in cultured murine cortical astrocytes lead to Ca2+-dependent synthesis of NO (44). NO can trigger reactive astrogliosis and glial scar formation by regulating GFAP in both normal physiology and pathophysiology of astrocytes (8). The glutamate treatment and hypoxic condition well displayed the severe disturbance of Ca2+ signaling in astrocytes. In addition, oxidative stress molecules and their defensive molecules Nox2 and Nrf2 were significantly altered in astrocytes under hypoxic condition. This pathogenesis was mainly attributed by excessive generations of ROS evidenced by remarkable enhancement of nitrotyrosine (Supplementary Figs. S12–S14). Our study revealed the upregulation of p-Tau after rmTBI, and this was particularly notable in astrocytes. In addition, we demonstrated that p-Tau, NO, and proinflammatory cytokines were increased in the hippocampus of our CTE model and the expression of p-Tau and iNOS and NFκB activity were increased in astrocytes under hypoxic conditions. To the best of our knowledge, this is the first report demonstrating an increased in vivo expression of iNOS in astrocytes.
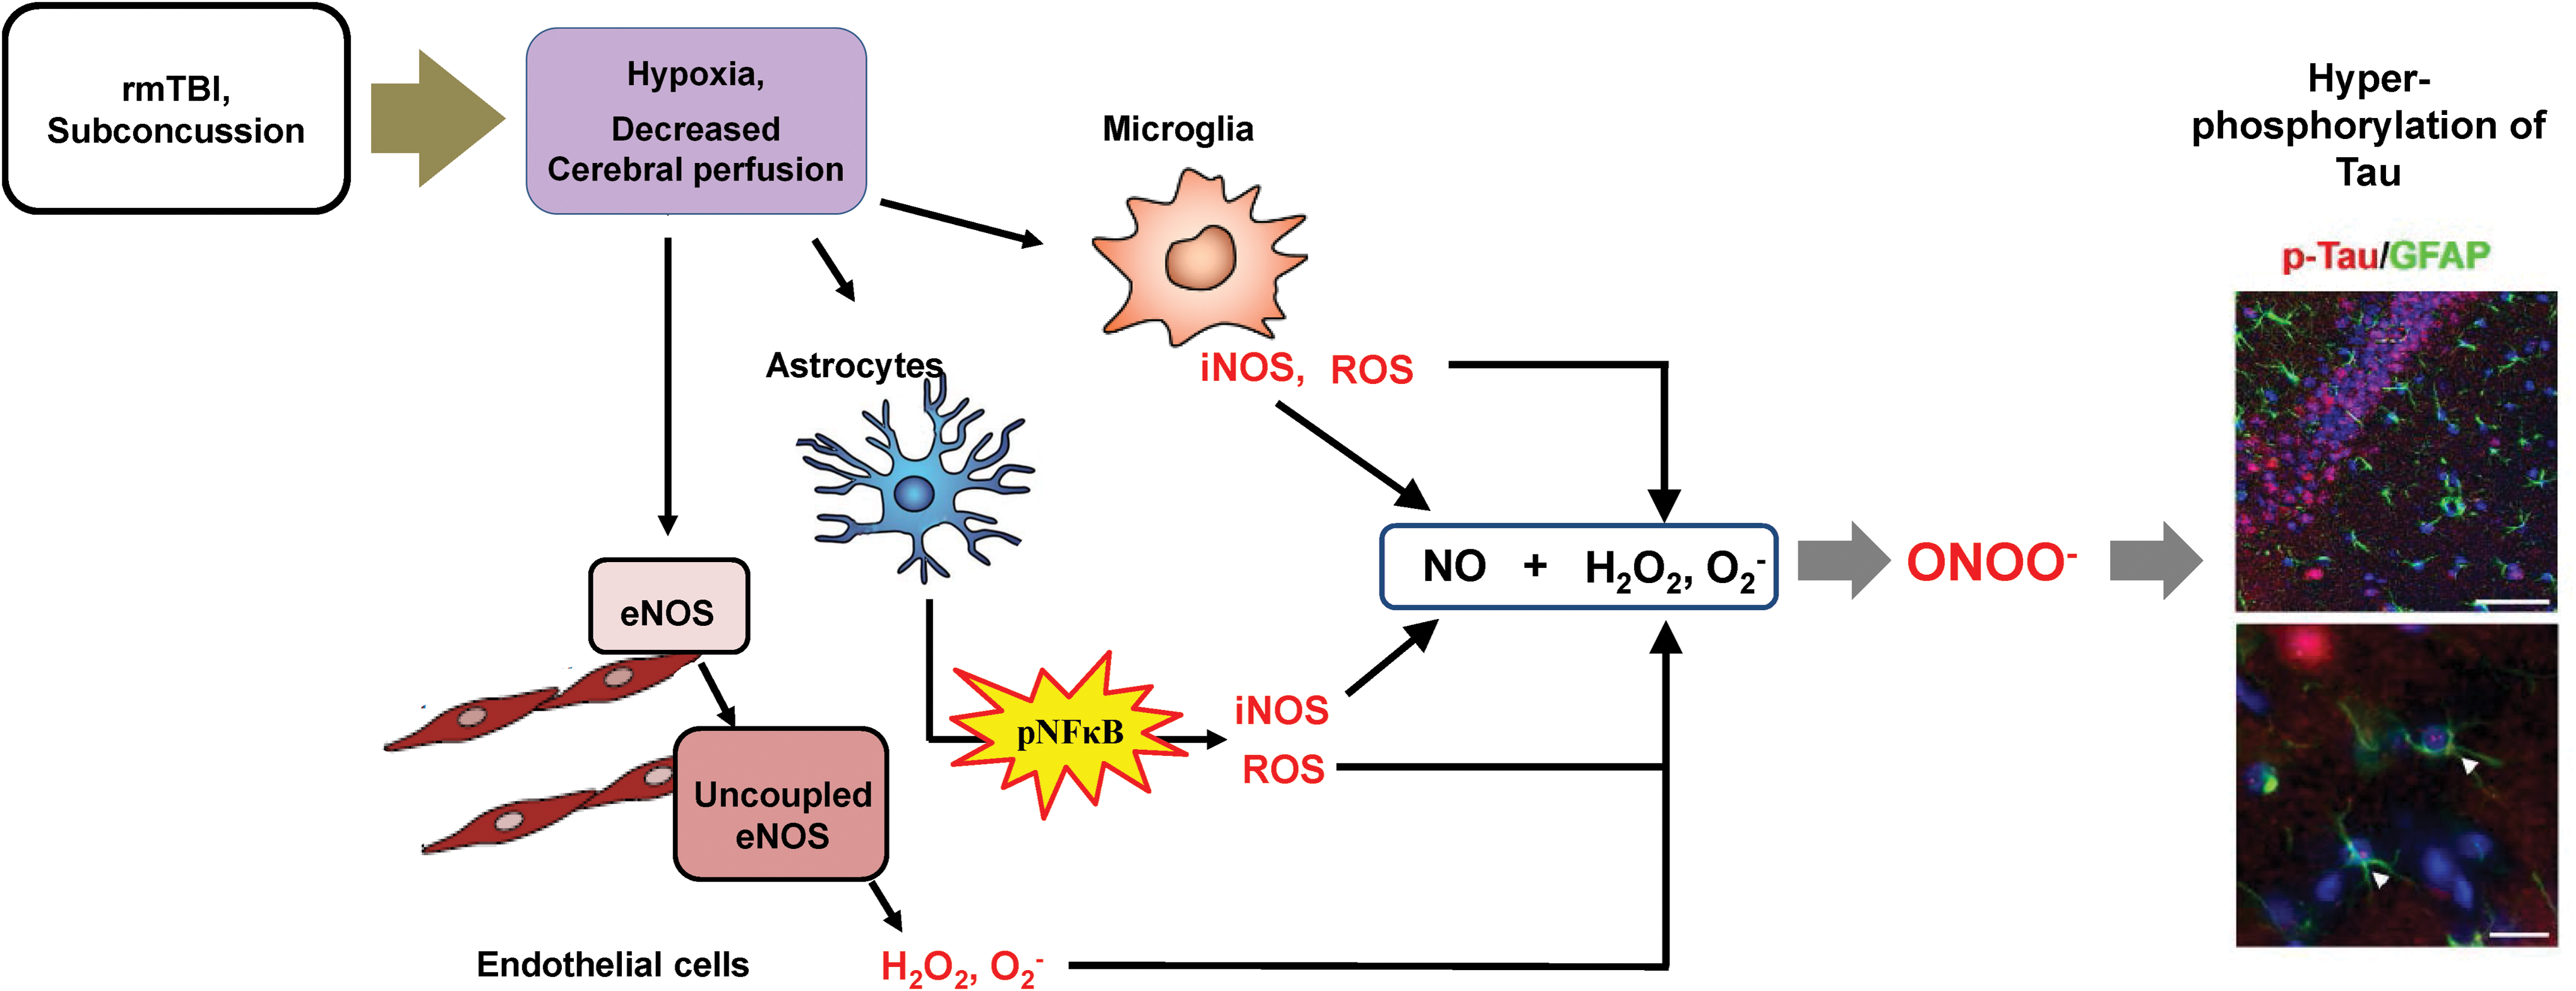
In conclusion, we found that repeated brain injury causes excessive production of superoxides by the uncoupled eNOS in the endothelial cells. These superoxides react with the NO produced by the microglia or the astrocytes to form peroxynitrite, in turn increasing p-Tau expression in the astrocytes and neurons (Fig. 12). Therefore, our results indicate that hypoxia-triggered eNOS uncoupling and glial NO production may be associated with p-Tau accumulation in astrocytes following rmTBI.
Materials and Methods
Experimental animals
All animal-related procedures were conducted in accordance with the guidelines of the Institutional Animal Care and Use Committee of Chungnam National University (CNU-00409). All mice were individually housed in cages on a standard 12-h/12-h light/dark cycle, and water and food were available ad libitum. Seven-week-old male C57BL/6j mice (Samtako, Osan, Republic of Korea) were used in this study. An rmTBI animal model was generated as previously described (37, 46). Briefly, an iron ball (54 g) was used to impact the mouse skull. The iron ball was dropped vertically through a polyvinyl chloride (PVC) guide tube (28″ length). A stage consisting of a slit piece of aluminum foil held in place by an “H”-shaped Plexiglas® frame (15 cm long × 9 cm wide × 23 cm deep) held the subjects in place. In this manner, the slit piece of foil supported the body weight of the mouse (22–25 g) with little or no resistance or restraint on impact. A sponge cushion was positioned 10 cm below the aluminum foil stage to receive the falling mouse, while the weight remained tethered above the body of the animal. Mice were lightly anesthetized with isoflurane (Hana Pharm Co.) and placed immediately under the vertical PVC tube. Mice were then suspended chest down on the aluminum foil above the sponge cushion. Each mouse was quickly positioned so that its head was directly in the path of the falling weight by first resting the weight on the scalp midline between the bregma and lambda. Incisions in the scalp or use of a protective skull helmet were not necessary. Following injury, the mouse was moved immediately to a holding cage to recover. rmTBI was applied to the mice once a day over a period of 5 consecutive days per week for 4 weeks. For vitamin E treatment, mice were fed daily semisynthetic diets containing 30 ppm (adequate) vitamin E (dl-α-tocopheryl acetate; Harlan Teklad, Madison, WI) for rmTBI experiment (6). Behavior tests were performed at 10–12 days after the final insult, and mice were sacrificed at 2 weeks after the final insult. Finally, mice were redivided into immunostaining (control = 7, CTE = 10) and biochemical assay groups (control = 20, CTE = 30).
Behavioral testing
Forced swim test
Mice were placed in a transparent cylinder (19 cm diameter × 23 cm deep) filled with water at 25°C ± 1°C for 6 min, and their behavior was recorded using an automated video camera. Immobility counting was divided into three categories of activity: (i) climbing, (ii) swimming, and (iii) immobility. Immobility was considered depressive-like behavior in this test. Behavior was manually measured for the last 5 min of the total 6-min observation period (16).
Tail suspension test
Mice were individually suspended by their tails at a height of 20 cm using a piece of adhesive tape wrapped around the tail 5 mm from the blue tip (1000 μL). It is a despair (depressive)-based test, measuring the duration of immobility of animals subjected to inexorable conditions. Behavior was videotaped for 6 min and final recording for 5 min. Mice were considered immobile only when completely motionless, and mice that climbed their tails were excluded from the data.
Y-maze test
The Y-maze is constructed of gray nonplastic and consists of three illuminated (white) arms (zone A, B, and C) each 50 cm long, 10 cm wide, and 20 cm high oriented at a 120° angle relative to each other with a central triangular area (midzone). The animals were started in arm A facing the midzone and allowed to freely explore for 8 min. Alternation measures the exploratory rotation of the animal and a correct alternation is defined as the animal visiting all arms in a sequential manner without interruption in its arm of choice, and thus, an alternation of, for example, A to B to C is correct, whereas A to B to A is incorrect and the percent correct alternations are the number of correct alternations divided by the total number of alternations.
Cerebral tissue perfusion measurement
On the day of the study, cerebral tissue perfusion was measured in anesthetized mice. After exposing skull, hole was made using high-speed microdrill. The flow probe wire was connected to transonic probe (0.5 PSB 303, Transonic System; Emka Technologies, Paris, France) to record the TPUs (mL/min/100 g) of the superficial prefrontal cortex in rmTBI mice (dimensions: −3 mm, lateral; −2 mm posterior from bregma). Only the mice without cerebral hemorrhage were selected.
Immunostaining
Mice were anesthetized with intraperitoneal sodium pentobarbital (50 mg/kg) and transcardially perfused with heparinized phosphate-buffered saline (PBS, pH 7.4), followed by perfusion with 4% paraformaldehyde in PBS. The brains were removed, immersed in the same fixative overnight, and cryoprotected in a 10%, 20%, and 30% sucrose solution. The brains were embedded in tissue freezing medium and frozen rapidly in 2-methyl butane precooled to its freezing point with liquid nitrogen. Immunohistochemical staining of the tissue sections was performed using the avidin–biotin peroxidase complex (ABC) method as previously described (4, 73). The primary antibodies used were Thr205 p-Tau (1:400, SC-101817; Santa Cruz Biotechnology), and astrocyte-labeling GFAP (1:400, No. MAN360; EMD Millipore), iba-1 (1:400, No. 019-19741; Wako), iNOS (1:500, No. n32030; Transduction Laboratories), p-eNOS (pS1177, No. 612393; BD Biosciences), and Nrf2 (1:400, SC-13032; Santa Cruz Biotechnology). For double staining, free-floating sections were incubated with a Cy3-conjugated secondary antibody following incubation with the anti-p-Tau, iNOS, p-eNOS antibodies, or with a Cy2-conjugated secondary antibody following incubation with the anti-GFAP antibody. Nuclear staining was performed with Hoechst 33342 (H3570; Invitrogen), DHE (D1168; Invitrogen) FluoForte® Calcium Assay kit (ENZ-51017; Enzo Life Sciences, Inc.) and CellROX Green Reagent (C10444; Thermo Fisher Scientific). All immunoreactions were observed under Axiophot microscope (Carl Zeiss) and confocal laser scanning microscope.
Determination of total ROS levels
Total ROS levels in the dissected cerebral cortex, hippocampus, and cerebellum were determined using H2O2 to generate a standard calibration curve as previously described, with minor modification (28). First, N,N-diethyl-para-phenylenediamine (DEPPD) and ferrous sulfate standard stock solutions were prepared. Then, 3 μL of the homogenized standard or sample solution in RIPA buffer was transferred to a 96-well microplate and 183 μL of reagent mixture (3 μL of 6 mg/mL DEPPD and 180 μL of 4.37 μM ferrous sulfate in 0.1 M sodium acetate buffer, pH 4.8) was added. Finally, the absorbance was measured at 505 nm using a microplate reader (Molecular Devices) at 37°C.
Determination of total NO levels
The levels of NO in the cerebral cortex, hippocampus, and serum were determined using the Griess method (26). Briefly, 10% (w/v) of each part was homogenized in RIPA buffer. Then, 40 μL of tissue homogenate was transferred to a 96-well plate, and 160 μL of Griess reagent [1% sulfanilamide, 0.1% N-(1-naphthyl) ethylenediamine hydrochloride, 2.5% H3PO4] was added. After allowing the solution to react at room temperature (23°C ± 2°C) for 20 min, the purple azo dye product was detected at 540 nm using a spectrophotometer (Molecular Devices).
Determination of lipid peroxidation
Lipid peroxidation levels in the cerebral cortex, hippocampus, and serum were measured by determining MDA levels, according to the previously described thiobarbituric acid (TBA) reactive substance method (52). Briefly, brain tissues were homogenized using RIPA buffer, and 130 μL of the homogenate was mixed with 80 μL of 1% phosphoric acid and 260 μL of 0.67% TBA. This mixture was incubated at 100°C for 45 min, followed by the addition of 1.03 mL of n-butanol. The solution was then vortexed and centrifuged at 3000 g for 15 min at 4°C. Absorbance was measured in the dual mode at 535 and 520 nm using a ultraviolet (UV) spectrophotometer. The concentration of TBA reactive substances was calculated using a 1,1,3,3-tetraethoxy-propane standard curve and was expressed as μM/mg protein.
Determination of total GSH content and total antioxidant capacity
Total GSH content was determined by the previous method of Ellman with slight modifications (18). Briefly, 50 μL of brain tissue homogenate diluted in 10 mM PBS (pH 7.2) or GSH standard was mixed with 80 mL of DTNB/NADPH mixture (10 mL 4 m MDTNB and 70 mL 0.3 mM NADPH) into a 96-well microplate. Furthermore, 20 μL (0.06 U) of GSH-Rd solution was added to each well and the absorbance was determined using a spectrophotometer (Molecular Devices) at 405 nm.
Total antioxidant capacity (TAC) in the brain tissue was assessed using myoglobin solution with 2,2′-azino-bis (3-ethylbenzothiazoline-6-sulfonic acid) diammonium salt (ABTS) (35). After reacted with myoglobin/ABTS solution and samples, 2.5 mM H2O2 was added. TAC was measured absorbance at 600 nm using a spectrophotometer after 5 min of adding H2O2. TAC was expressed as gallic acid equivalent antioxidant capacity.
Determination of SOD and catalase activity
SOD activity was analyzed using an SOD assay kit (Dojindo Laboratories, Kumamoto, Japan), according to the manufacturer's protocol. Briefly, 20 μL of homogenate was mixed with 200 μL of WST-1 working solution in a 96-well plate. Then, 20 μL of working enzyme solution was added, and the plate was incubated for 20 min at 37°C. Absorbance was measured at 450 nm using a UV spectrophotometer (Molecular Devices). A serial dilution of bovine erythrocyte SOD (Sigma) ranging from 0.01 to 50 U/mL was used as the standard.
Catalase activity in the cerebral cortex, hippocampus, and serum was assayed as previously described (70). Briefly, 150 μL of phosphatase buffer (250 mM, pH 7.2), 150 μL of 12 mM methanol, and 30 μL of 44 mM H2O2 were mixed with 300 μL of each homogenate sample or standard solution in a 13 × 100 mm test tube. The reactions were allowed to proceed for 10–20 min and were stopped with the addition of 450 μL of Purpald® solution (22.8 mM Purpald in 2 N potassium hydroxide). The mixture was kept at 25°C for 20 min, followed by the addition of 150 μL of potassium periodate (65.2 mM potassium periodate in 0.5 N potassium hydrate). The absorbance of the purple formaldehyde adduct that formed was measured at 550 nm using a spectrophotometer (Molecular Devices).
Determination of cytokine levels
Protein levels of TNF-α, IL-6, IL-1β, and IL-10 in brain tissue were measured using commercial enzyme-linked immunosorbent assay kits (BioSource, San Jose, CA; R&D Systems), following the manufacturer's protocols.
BH4 and dihydrobiopterin measurement by HPLC
According to Fukushima and Nixon (22), the oxidation of iodine allows measurement of both the total amount of biopterin and BH4. In acid conditions, BH4 and dihydrobiopterin (BH2) are oxidized to biopterin, meanwhile in basic conditions, only BH2 is oxidized to biopterin, and BH4 is subject to excision of the side chain to produce pterin. The difference in content of biopterin between both oxidations represents the real BH4 levels (20). This was measured by the HPLC at the Korea Basic Science Institute (Seoul, South Korea).
(Biopterin in acid pH oxidation) − (Biopterin in basic pH oxidation) = BH levels
Cell culture
For primary astrocytes or microglia, 1 day postnatal SD rat pup (Samtako) was used according to standard procedures (72, 73). Vigorous agitation was applied to remove microglia and oligodendrocytes. Under these conditions, the purity of the astrocyte population was 95% as determined by immunofluorescence analysis using anti-GFAP or anti-iba-1 to detect astrocytes or microglial cells, anti-2′, 3′-cyclic nucleotide 3′-phosphodiesterase (CNPase) to detect oligodendrocyte contamination, and GFAP or Iba-1 to identify astrocytes and microglia. Primary cortical neurons were prepared from E14.5–15.5 rat embryos as previously described (3). Cortices were removed from the brains of 14.5–15.5-day embryos of rats and placed in ice-cold Hanks' balanced salt solution (HBSS) with 28 mM glucose and 20 mM sucrose. The tissues were then incubated with 0.125% trypsin in HBSS for 15 min at 37°C and disassociated by repeated passage through a 10 mL disposable pipette. The cells were pelleted at 500 g for 5 min and resuspended in Neurobasal medium supplemented with B-27, 2 mM
siRNA transfection
iNOS knockdown was accomplished by transcriptional transfection of siRNA. The iNOS siRNA sequence was designed and synthesized by Thermo Fisher Scientific (AM16704). The day before transfection, primary astrocyte cells were seeded at a density of 5 × 10⁵ cells per well in six-well plates and cultured without FBS overnight. OPTI-MEM serum-free medium (Gibco) and Lipofectamine™ 2000 (Invitrogen) were used for transient transfection experiments. The siRNAs with a final concentration of 75 pM and 4 μL Lipofectamine 2000 were added to each well. After 12 h, the culture medium was changed and cultivation was carried out. The transfection efficiency was verified by immunoblotting.
Hypoxia chamber
Mice were housed in (40 cm length × 40 cm width × 30 cm height) transparent acrylic boxes. This hypoxia chamber (IEC266-Life, version 1.3) was manufactured in VisionScience. The total gas flow through the chamber was measured using a portable LCD touch controller with an O2 sensor adjusted to O2 concentrations 11% (programming setting 11% ± 1). Temperature was maintained at 23–26°C, and humidity was maintained at 30–70%. Mice were housed in cages in hypoxia chamber with standard bedding and given unlimited access to food and water.
Western blots
For Western blot analysis, the cells were incubated for 72 h, before 1 h under hypoxic conditions (1% O2), and collected at the indicated times. Cultured astrocytes were collected by scraping, and the pellet was solubilized in lysis buffer (1 × RIPA buffer, No. 9806; Cell Signaling). After centrifugation, protein concentrations were determined in supernatants using MicroBCA protein assay kits. Aliquots containing 30 μg protein were resolved by 10% sodium dodecyl sulfate/polyacrylamide gel electrophoresis. The blot was incubated with the primary antibodies: anti-p-Tau (1:1000, SC-101817; Santa Cruz Biotechnology), anti-P-p65 (1:1000, No. 3033S; Cell Signaling), anti-IκB-α (1:1000, No. MA5-15132; Thermo Fisher Scientific), anti-Cox2 (1:1000, SC-166475; Santa Cruz Biotechnology), anti-iNOS (1:1000, N32030-050; BD Biosciences), anti-GFAP (1:1000, No. MAB360; EMD Millipore), anti-GCH-1 (1:1000, SC-376483; Santa Cruz Biotechnology), anti-PTPS (1:1000, PA5-22121; Thermo Fisher Scientific), anti-SPR (1:1000, SC-398126; Santa Cruz Biotechnology), anti-DHFR (SC-377091; Santa Cruz Biotechnology), anti-nitrotyrosine (1:1000, ab7048; Abcam), anti-Nrf2 (SC-13032; Santa Cruz Biotechnology), anti-Nox2 (PA5-19010; Thermo Fisher Scientific), anti-Nox4 (1:500, SC-30141; Santa Cruz Biotechnology), anti-VEGF (1:1000, SC-152; Santa Cruz Biotechnology), anti-HO-1 (1:1000, SC-10789; Santa Cruz Biotechnology), anti-BDNF (1:1000, SC-546; Santa Cruz Biotechnology), and anti-p-CREB (1:1000, 9198L; Cell Signaling). To analyze the uncoupled eNOS protein level in the hippocampus of CTE model, p-eNOS (612393; BD Biosciences) and eNOS (NOS3, SC-654; Santa Cruz Biotechnology) were used. Membranes were washed and incubated for 2 h with a peroxidase-labeled secondary antibody. After three more washes, immunolabeled proteins were detected by chemiluminescence using a SuperSignal™ enhanced chemiluminescence (ECL) kit (Pierce Chemical) and Biomax Light-1 film (Kodak).
Statistical analyses
Quantitative analysis of immunostaining was performed using ImageJ software (National Institutes of Health, Bethesda, MD). The statistical significance differences between the groups were evaluated by one-way analysis of variance (ANOVA) followed by post hoc multiple comparisons with Fisher's LSD t-test using the statistical software, Prism® 6 (GraphPad, San Diego, CA). All data were analyzed using Student's t-tests or a one-way ANOVA and presented as mean ± standard error of the mean. Results were considered significant at *p < 0.05, **p < 0.01, and ***p < 0.001.
Footnotes
Acknowledgments
This research was supported by the Brain Research Program through the National Research Foundation of Korea (NRF) funded by the Ministry of Science, ICT and Future Planning (NRF-2016M3C7A1905074, 2014R1A6A1029617, 2017R1A1A1A05001310), by the Korea government (MSIP) (2016R1A2B4009409), and by Business for Academic–Industrial Cooperation establishments funded Korea Small and Medium Business Administration in 2016 (Grant No. C0395291). U.L.T. was supported by the U.S. National Science Foundation (Grant No. 1614360).
Author Disclosure Statement
No competing financial interests exist.
Abbreviations Used
References
Supplementary Material
Please find the following supplemental material available below.
For Open Access articles published under a Creative Commons License, all supplemental material carries the same license as the article it is associated with.
For non-Open Access articles published, all supplemental material carries a non-exclusive license, and permission requests for re-use of supplemental material or any part of supplemental material shall be sent directly to the copyright owner as specified in the copyright notice associated with the article.
