
Abstract
Aims:
The risk factors promoting acute kidney injury (AKI) to chronic kidney disease (CKD) progression remain largely unknown. The aim of the present study was to investigate whether hyperhomocysteinemia (Hhcy) accelerates the development of renal fibrosis after AKI.
Results:
Hhcy aggravated ischemia-reperfusion-induced AKI and the subsequent development of renal fibrotic lesions characterized by excessive extracellular matrix deposition. Mechanistically, the RNA binding protein human antigen R (HuR) bound to the 3′-untranslated region (3′-UTR) of heme oxygenase-1 (HO-1) messenger RNA (mRNA). Homocysteine (Hcy) downregulated HuR expression, reduced the binding of HuR to the 3′-UTR of HO-1, and thereafter decreased HO-1 expression. Administration of the HO-1 inducer cobalt protoporphyrin-IX significantly hindered Hhcy-augmented reactive oxygen species production and renal fibrotic lesions.
Innovation and Conclusion:
These data indicate that Hhcy might be a novel risk factor that promotes AKI to CKD progression. Lowering Hcy level or HO-1 induction might be a potential therapeutic strategy to improve the outcome of AKI.
Introduction
Acute kidney injury (AKI) is a devastating clinical condition that is associated with high rates of morbidity and mortality. Even if the patients survive, the post-AKI prognosis is dismal, with 30–70% developing progressive chronic kidney disease (CKD) and end-stage renal disease (6, 25). Despite the growing incidence of AKI, there is no effective therapy for this condition, and therapeutic interventions targeting CKD progression are also limited. Therefore, novel strategies that minimize AKI and halt the progression of CKD are urgently needed.
Homocysteine (Hcy) is a sulfur-containing amino acid that is formed as the transmethylation product during the metabolic conversion of methionine to cysteine (41, 51). Normal concentrations of total Hcy (tHcy) in human plasma are 5–16 μM. Elevated plasma tHcy concentration (tHcy >15 μM) (37), a condition known as hyperhomocysteinemia (Hhcy), is developed by genetic enzymatic deficiencies and/or nutritional defects that interfere with the proper metabolism of methionine. There are three ranges of Hhcy: mild (16–30 μM), moderate (31–100 μM), and severe (>100 μM) (3). Mild and moderate Hhcy is prevalent in the general population and CKD patients (12, 27). A lower glomerular filtration rate is closely associated with a higher plasma Hcy concentration (33, 42).
Our recent study demonstrated that compared with enalapril, the enalapril–folic acid therapy significantly delays the progression of CKD among hypertensive patients with mild-to-moderate Hhcy (48), indicating a causal role of Hhcy in the progression of CKD. We recently reported that Hhcy increases the sensitivity of mice to both ischemia-reperfusion (IR) and cisplatin-induced AKI (28). In addition, Sun et al. analyzed the metabolic profiles of serum samples from 17 hospitalized patients with newly diagnosed AKI. Statistically significant increases in Hcy were detected in the serum from patients with AKI compared with age-matched subjects with normal kidney function (39).
Therapeutic interventions targeting chronic kidney disease (CKD) progression after acute kidney injury (AKI) are limited. Despite that hyperhomocysteinemia (Hhcy) is a risk factor of CKD, its role in AKI to CKD progression remains unknown. In the present study, we demonstrated that Hhcy exacerbates AKI-induced fibrotic lesions by downregulating heme oxygenase-1 (HO-1) expression. Our findings suggest that Hhcy might be a novel risk factor that promotes AKI-CKD progression. Further human studies are required to confirm this finding.
Moreover, a significant association of elevated Hcy levels with the risk of contrast-induced nephropathy was observed in patients undergoing coronary angiography or percutaneous coronary intervention (5). Baseline levels of S-adenosylhomocysteine, which is hydrolyzed by S-adenosylhomocysteine hydrolase to form Hcy, predicted AKI (17). These studies suggest that elevated Hcy might predict the risk of AKI in humans. However, whether Hhcy promotes AKI to CKD progression remains unknown.
Heme oxygenase (HO), the primary rate-limiting enzyme in heme catabolism, cleaves heme to yield biliverdin, carbon monoxide, and iron (36, 54). Three isoforms of HO, HO-1, HO-2, and HO-3, have been described. HO-1, the inducible isoform, exerts broad cytoprotective properties, including antioxidation (44), anti-inflammation (32), and anti-apoptosis in injured tissue. With regard to renal injury, the protective property of HO-1 has been demonstrated in AKI induced by cisplatin (7), IR (26), lipopolysaccharide (LPS) (16), urinary tract obstruction (35), and following renal transplantation (21). In addition, it has been shown that sustained HO-1 expression hinders the development of CKD following AKI (26).
The transcription of HO-1 is mainly regulated by nuclear factor erythroid 2-related factor 2 (Nrf2), a basic leucine zipper transcription factor. In the presence of oxidative stimuli, Nrf2 binds to the antioxidant response element (ARE) sequence in the promoter region of HO-1 gene and thus promotes its transcription (2). Noteworthy, besides increased transcription, elevated level of messenger RNA (mRNA) could also result from decreased degradation. The stability of mRNA is usually modulated by RNA-binding protein, such as human antigen R (HuR), which interacts with RNA turnover elements residing in the 3′-untranslated regions (3′-UTRs) to influence the mRNA half-life (20). However, the regulation of HO-1 mRNA stability remains largely unknown.
In the present study, we investigated the role of Hhcy in the development of CKD after AKI and the underlying mechanism. We demonstrated that Hhcy promotes AKI-CKD progression by inhibiting HO-1 expression. The administration of the HO-1 inducer cobalt protoporphyrin-IX (CoPP) significantly attenuated the fibrotic lesions after AKI in mice with Hhcy. Moreover, we showed that in renal tubular cells, HuR modulates the stability of HO-1 mRNA. Hcy inhibits HO-1 expression at post-transcription level by inhibiting HuR expression.
Results
Hhcy inhibits HO-1 expression in vitro and in vivo
Our previous study demonstrated that Hhcy aggregates AKI (28), but the underlying mechanism remains unclear. Given the broad cytoprotective role of HO-1 in AKI, we investigated whether Hcy regulates HO-1 expression. First of all, we stimulated normal rat kidney epithelial cells (NRK52E) with 100 μM of Hcy for indicated time period, and then, whole cell lysates were harvested. Western blotting and real-time polymerase chain reaction (PCR) demonstrated that Hcy downregulated both the protein and mRNA levels of HO-1 in a time-dependent manner (Fig. 1A, B and Supplementary Figs. S1A and Fig. 1A, B and S10A). Since a significant downregulation of HO-1 was detected at 48 h after Hcy treatment, we further stimulated NRK52E with indicated concentration of Hcy for 48 h. Western blotting and real-time PCR demonstrated that Hcy downregulated both the protein and mRNA levels of HO-1 in a dose-dependent manner. A significant downregulation of HO-1 was detected by 50 μM of Hcy treatment (Fig. 1C, D and Supplementary Figs. S1B and Fig. 1A, B and S10B). To prove that Hcy specifically downregulated HO-1 expression, we stimulated cells with cysteine or glysine. Cysteine is a sulfur-containing amino acid with similar structure to Hcy. Neither cysteine nor glysine affected the HO-1 expression (Supplementary Figs. S2 and Fig. 1A, B and S12). Moreover, we incubated cells with medium containing 100 μM of Hcy for 48 h and then replaced with Hcy-free culture medium for another 48 h. Western blot and real-time PCR showed that Hcy significantly downregulated HO-1 expression, and this downregulation was rescued by Hcy-free culture medium (Fig. 1E, F and Supplementary Fig. S10C). Collectively, these data suggest that Hcy specifically downregulated HO-1 expression in NRK52E.
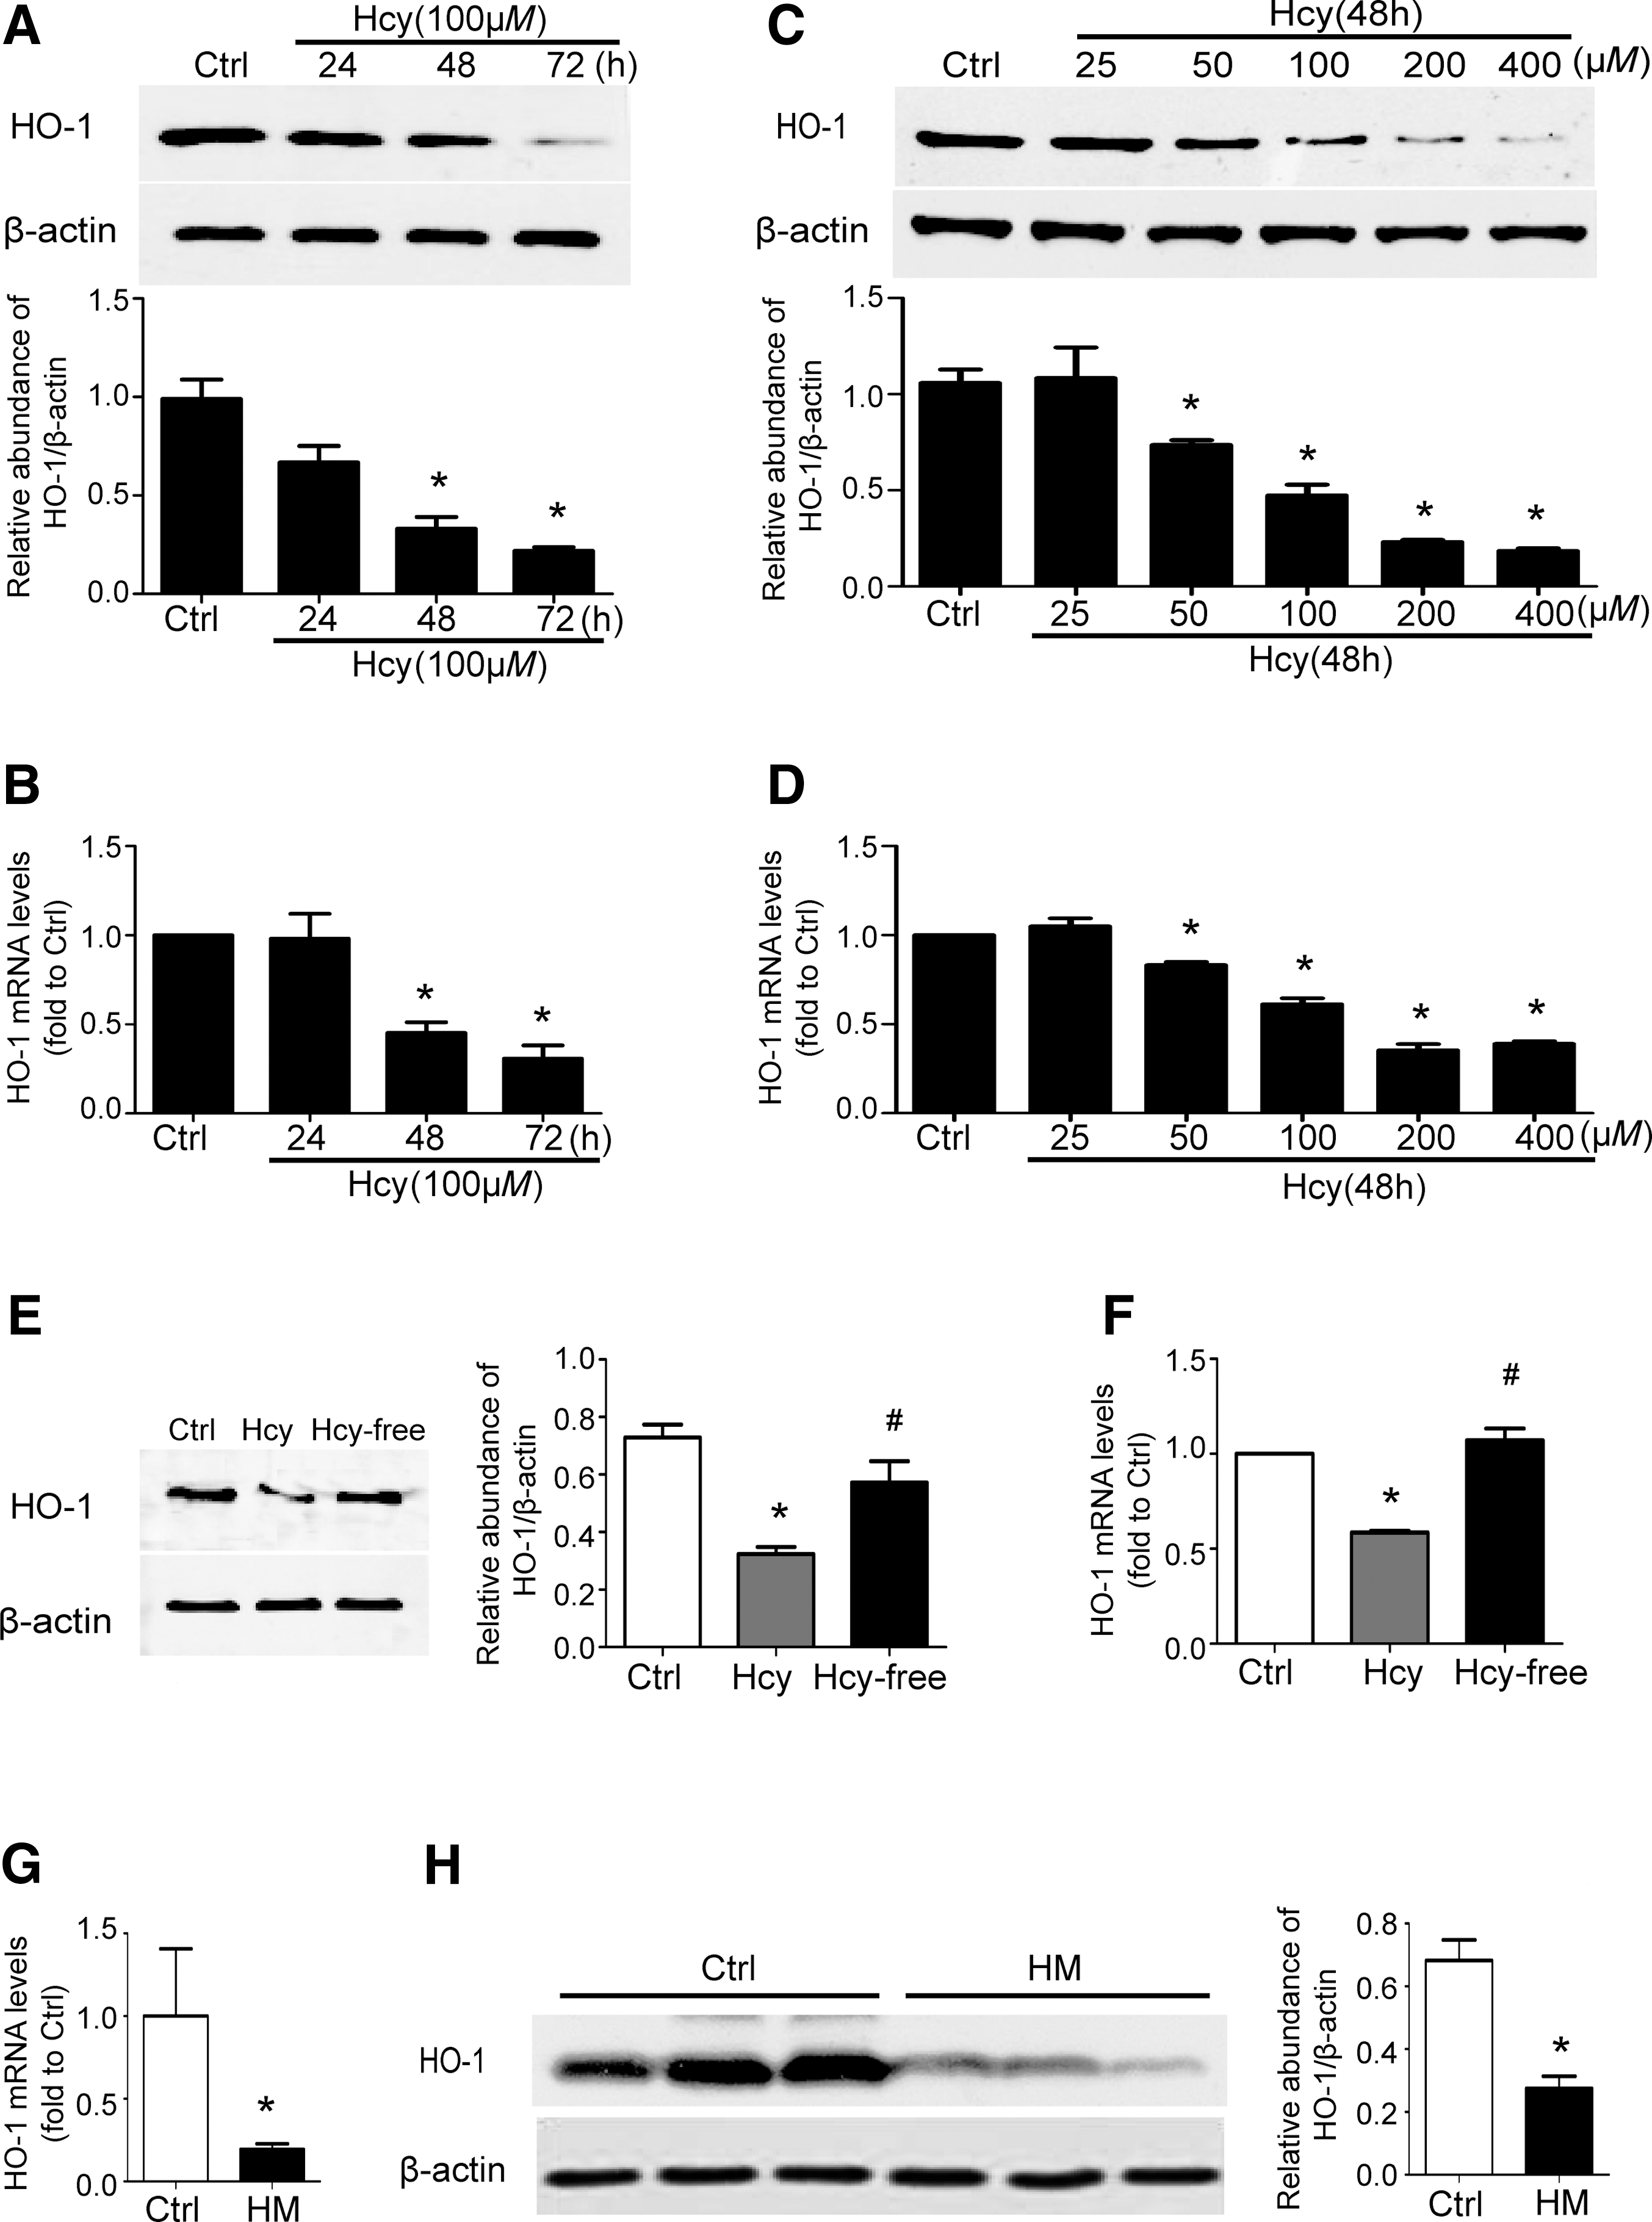
To demonstrate the effect of Hcy on HO-1 expression in vivo, we generated Hhcy mice by feeding C57BL/6J mice with a high-methionine diet containing 19.56 g/kg methionine for 3 weeks. Compared with control mice fed standard chow (5.90μM mean ± 1.16 μM), the mean plasma level of tHcy was 62.38 μM mean ± 11.02 μM for mice with Hhcy (Supplementary Fig. S3). Real-time PCR and Western blotting demonstrated that the expression of HO-1 in kidney was significantly decreased in mice with Hhcy (Fig. 1G, H). Collectively, these data indicated that Hhcy dowregulates HO-1 expression both in vitro and in vivo.
Hhcy modulates HO-1 mRNA stability by HuR in renal tubular cells
We next explored the mechanism by which Hcy modulates the HO-1 expression. Nrf2 has been identified as the primary transcription factor responsible for the induction of HO-1 gene (30). However, Western blotting and real-time PCR showed that in NRK52E, neither the expression nor the translocation of Nrf2 to the nuclei was altered by Hcy (Supplementary Figs. S4A–C, Fig. 1A, B and S12E, G, and Fig. 1A, B and S13A). In line with in vitro data, the mRNA and protein levels of Nrf2 in kidneys of mice with Hhcy were comparable to that in control mice (Supplementary Figs. S4D, E, and Fig. 1A, B and S13B). Accordingly, the expression of NAD(P)H:quinone oxidoreductase (NQO-1) and γ-glutamyl-cysteine ligase (GCL), which are target genes of Nrf2 (53), did not altered by Hcy (Supplementary Fig. S5). Collectively, these data suggest that in renal tubular cells, Hcy modulates the HO-1 expression independent of Nrf2.
Bioinformatics analysis revealed an ARE with canonical AUUUA sequences in the 3′-UTR of HO-1 (Fig. 2A). ARE is a conserved binding site of the RNA-binding protein HuR, which modulates mRNA stability (8). Thus, we explored whether HuR modulates the HO-1 expression via directly binding to HO-1 transcript by RNA electrophoretic mobility shift assay (RNA EMSA). A biotinylated oligonucleotide containing the ARE element in the 3′-UTR of HO-1, named HO-1-ARE, was synthesized. After incubating biotinylated HO-1-ARE with cell lysates extracted from NRK52E, a prominent band was detected (Fig. 2B, lane 2 and Supplementary Fig. S10E, lane 2), and this band disappeared when unlabeled HO-1-ARE oligonucleotides were added (Fig. 2B, lane 3 and Supplementary Fig. S10E, lane 3), suggesting that the complex specifically binds to HO-1-ARE. To explore whether HuR binds to HO-1-ARE, anti-HuR antibody or IgG was added into the NRK52E lysates before incubating with biotinylated HO-1-ARE. As shown in Figure 2C and Supplementary Figure S10F, incubating with anti-HuR antibody, but not IgG, resulted in a supershifted band (lane 2 and lane 3), indicating that HuR binds to the 3′-UTR of HO-1.
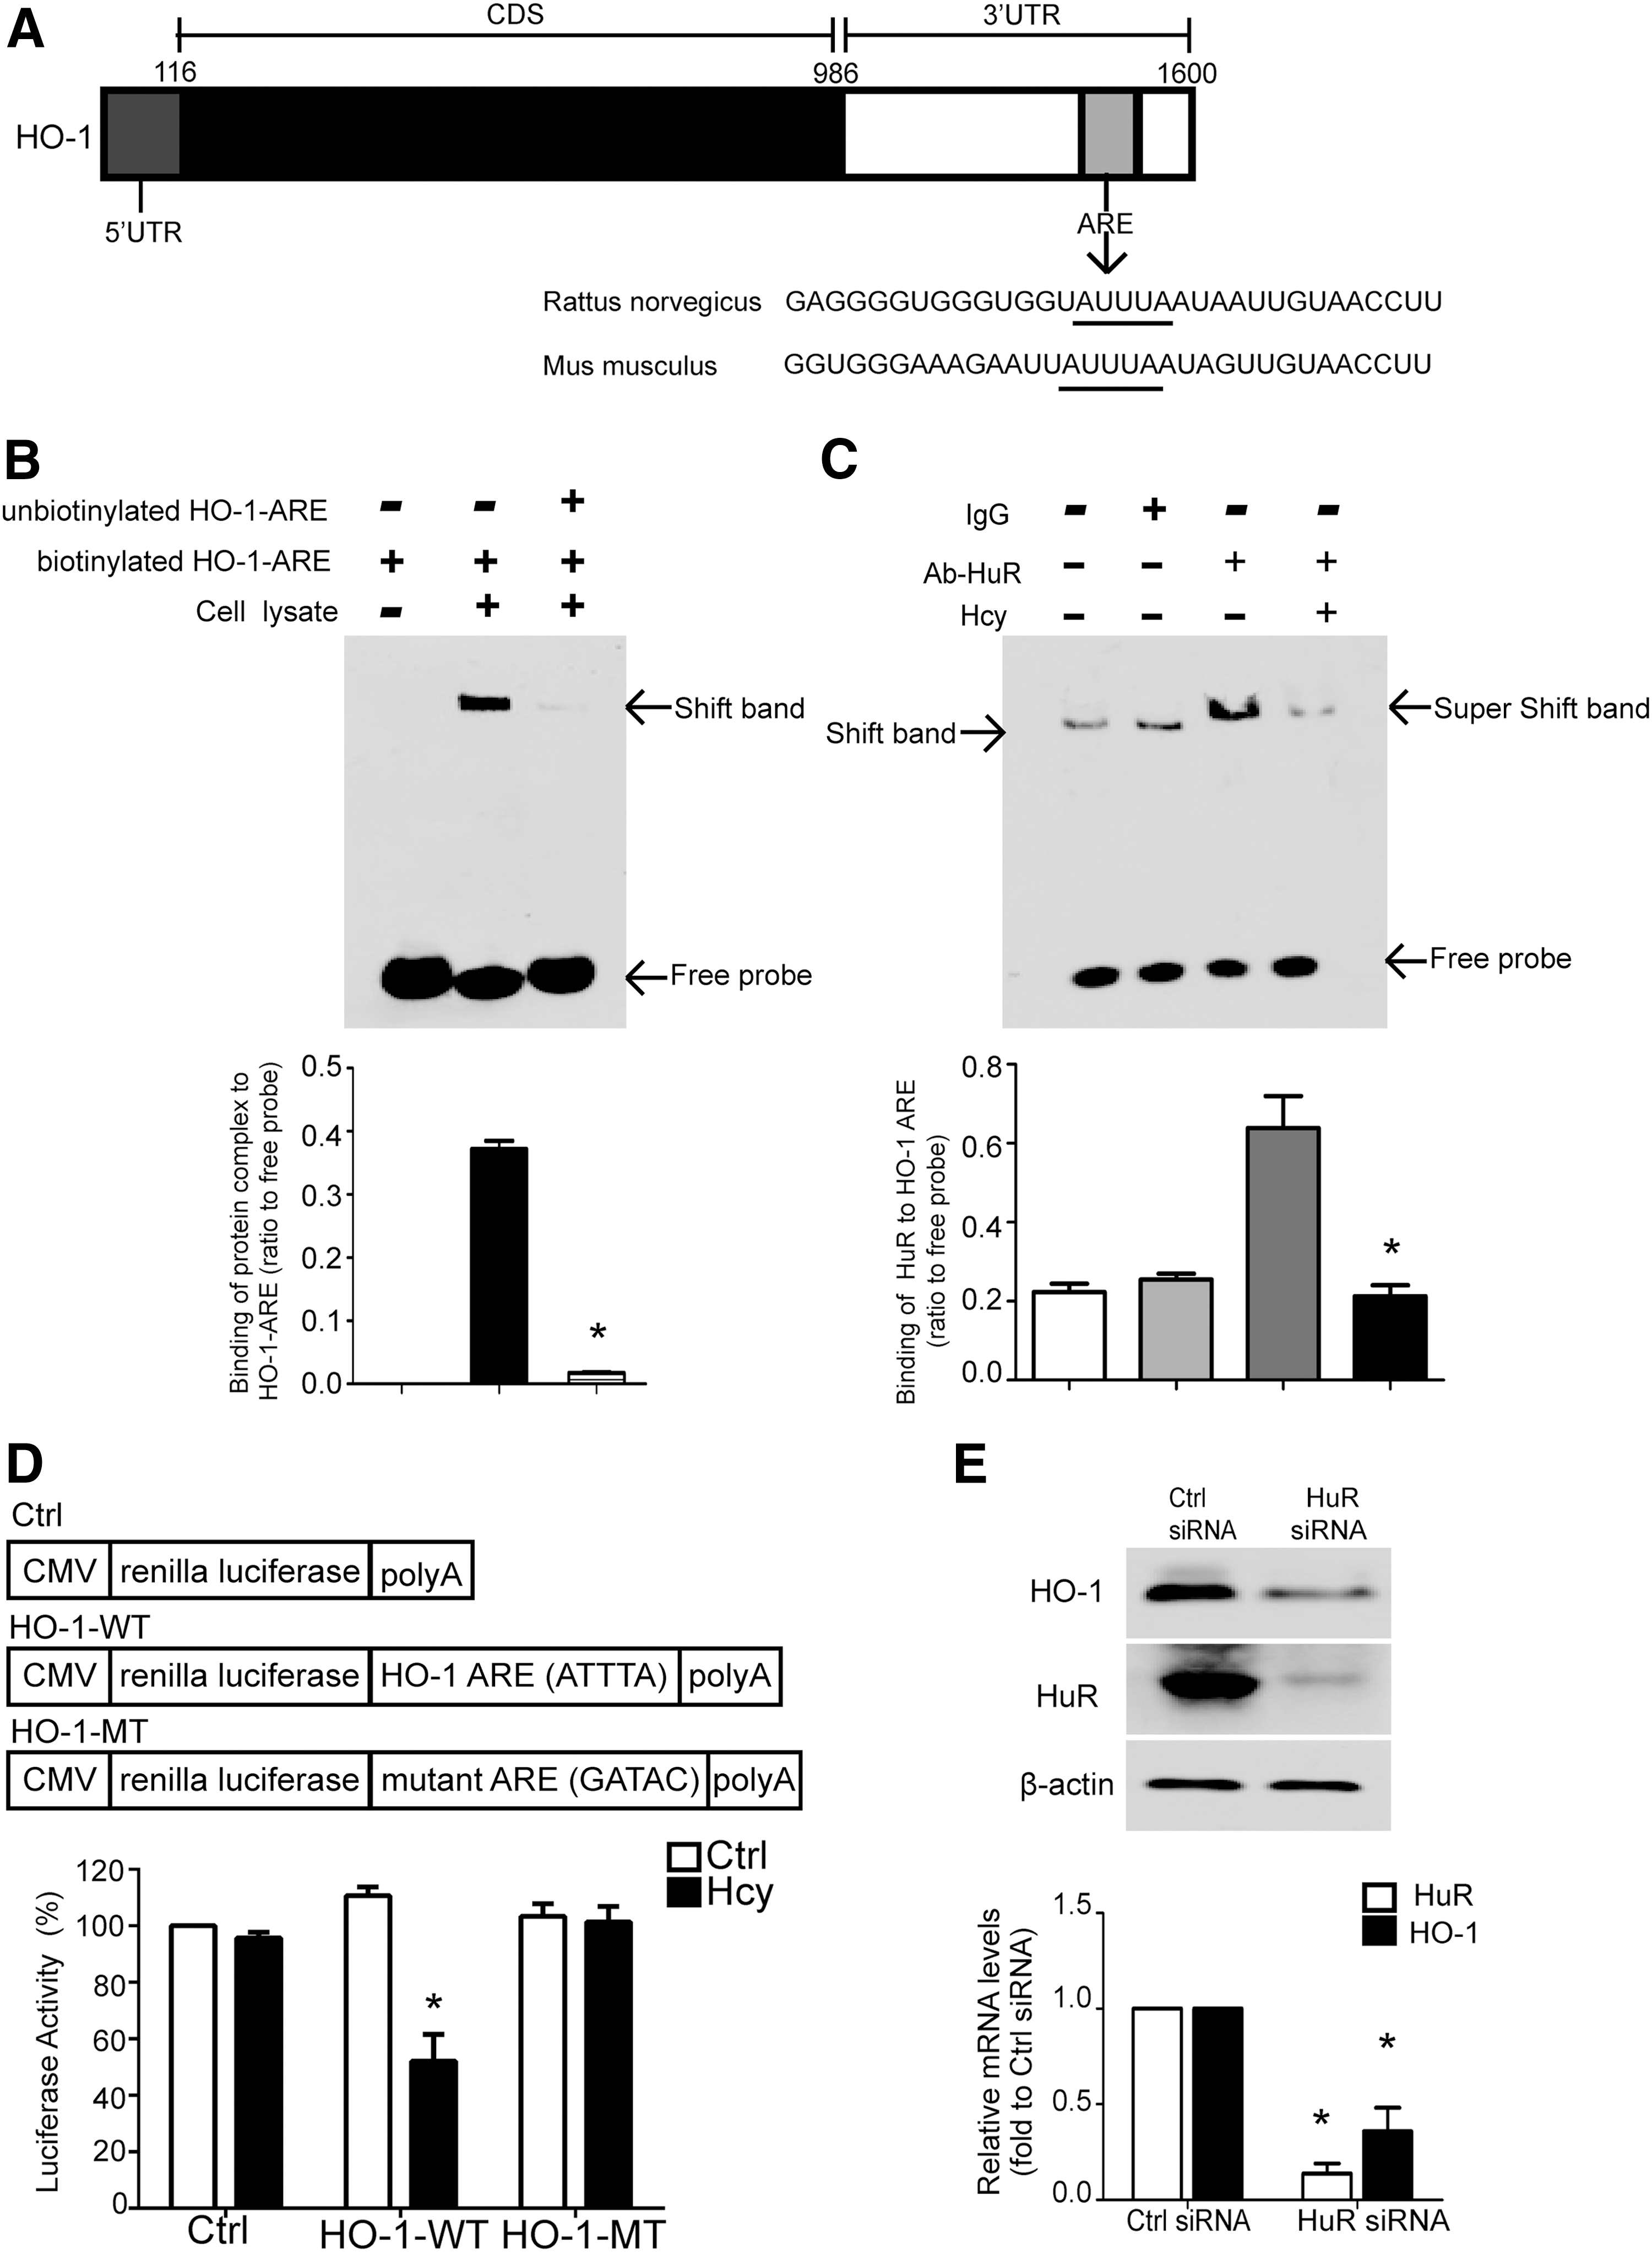
To further confirm that the binding of HuR to the 3′-UTR contributes to Hhcy-attenuated HO-1 expression, we generated various luciferase reporter constructs containing the wild-type 3′-UTR of HO-1 (luciferase-HO-1-WT) or a mutant with a mutation at ARE (luciferase-HO-1-MT) (Fig. 2D, upper panel). After transfection, NRK52E were treated with 100 μM of Hcy for 24 h. The luciferase activity of luciferase-HO-1-WT, but not of luciferase-HO-1-MT, was significantly inhibited by Hcy treatment (Fig. 3D, lower panel). These data suggest that Hcy-modulated HO-1 expression is at least partially mediated by the binding of HuR to the 3′-UTR of HO-1 mRNA.

To confirm that HuR modulates the HO-1 expression, NRK52E were transfected with HuR small interfering RNA (siRNA), which led to >80% reduction in HuR protein at 48 h post-transfection (Fig. 2E and Supplementary Fig. S10G). Compared with scramble siRNA-transfected cells, HO-1 protein level was significantly decreased in HuR siRNA-transfected cells (Fig. 2E and Supplementary Fig. S10G).
We next examined whether Hcy modulates the HuR expression. As shown in Figure 3A–D, Fig. 1A, B and Supplementary Fig. S11A–B and Supplementary Figure S6, Hcy downregulated the HuR expression in a time- and dose-dependent manner in NRK52E at both mRNA and protein levels. In contrast, neither cysteine nor glysine inhibited the HuR expression (Supplementary Fig. S7 and Fig. 1A, B and Fig. S13C). Moreover, we incubated cells with medium containing 100 μM of Hcy for 48 h and then replaced with Hcy-free culture medium for another 48 h. Western blot and real-time PCR showed that Hcy significantly downregulated the HuR expression, and this downregulation was rescued by Hcy-free culture medium (Fig. 3E–F and Supplementary Fig. S11C). In addition, the amount of HuR protein in the cytoplasm as well as in the nucleus was significantly decreased (Fig. 3G–H and Fig. 1A, B and Supplementary Fig. S11D–E). The amount of HuR was also reduced in the kidney of mice with Hhcy (Fig. 3I–J and Supplementary Fig. S11F). RNA EMSA demonstrated that HuR-HO-1 interaction was significantly attenuated when biotinylated HO-1-ARE oligonucleotides were incubated with lysates extracted from Hcy-treated cells compared with that from untreated cells (Fig. 2C, compare lane 3 with lane 4). Collectively, these data indicated that Hcy downregulates the HO-1 expression at post-transcription level by downregulating the HuR expression.
CoPP attenuates Hhcy-aggregated AKI
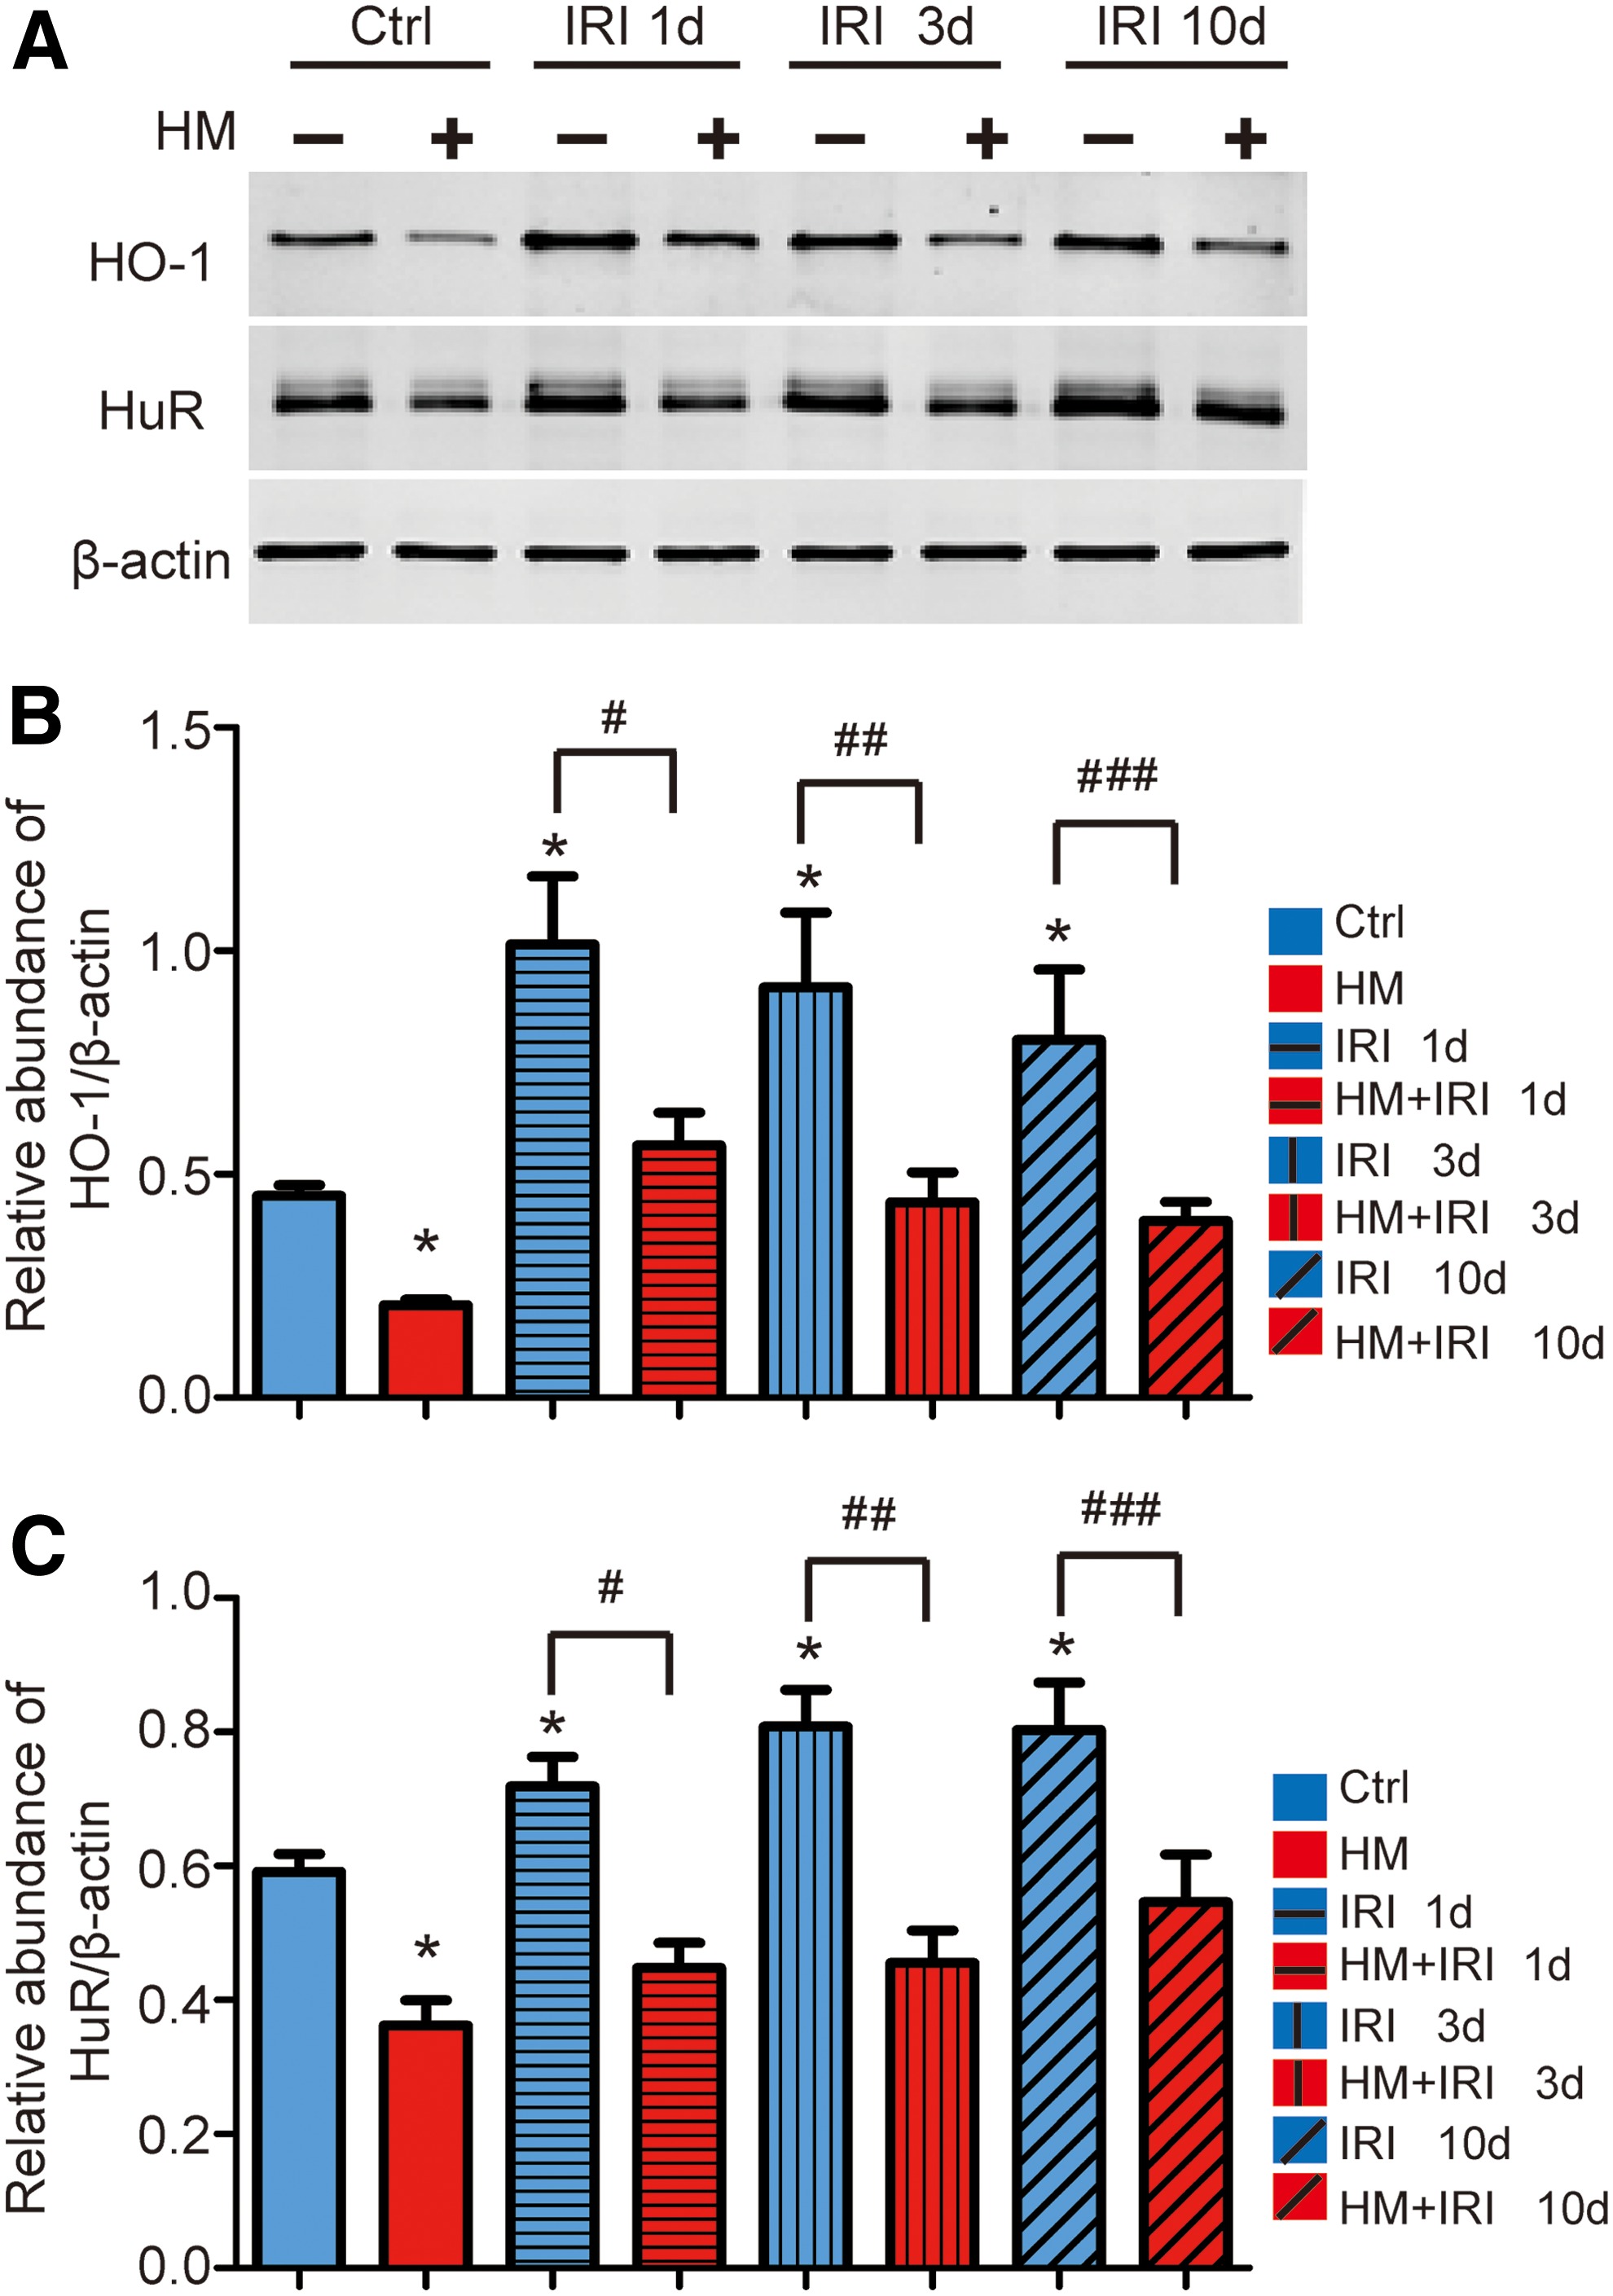
We previously reported that Hhcy accelerates AKI induced by IR (28). Since Hcy downregulates the HO-1 expression, we further tracked the expression of HO-1 in the injured kidney after unilateral ischemia-reperfusion injury (UIRI). The injured kidneys were collected at days 1, 3, and 10 after reperfusion, respectively. Western blot analysis revealed that the induction of HO-1 expression was peaked at day 1 after IR and maintained elevated till day 10 after IR in control mice, which is consistent with previous reports (19, 50). However, during the observation period, renal HO-1 protein level in mice with Hhcy was significantly lower than that in control mice (Fig. 4A, B and Supplementary Fig. S11G ). Accordingly, the renal protein level of HuR in mice with Hhcy was also significantly lower than that in control mice (Fig. 4A, C and Supplementary Fig. S11G).
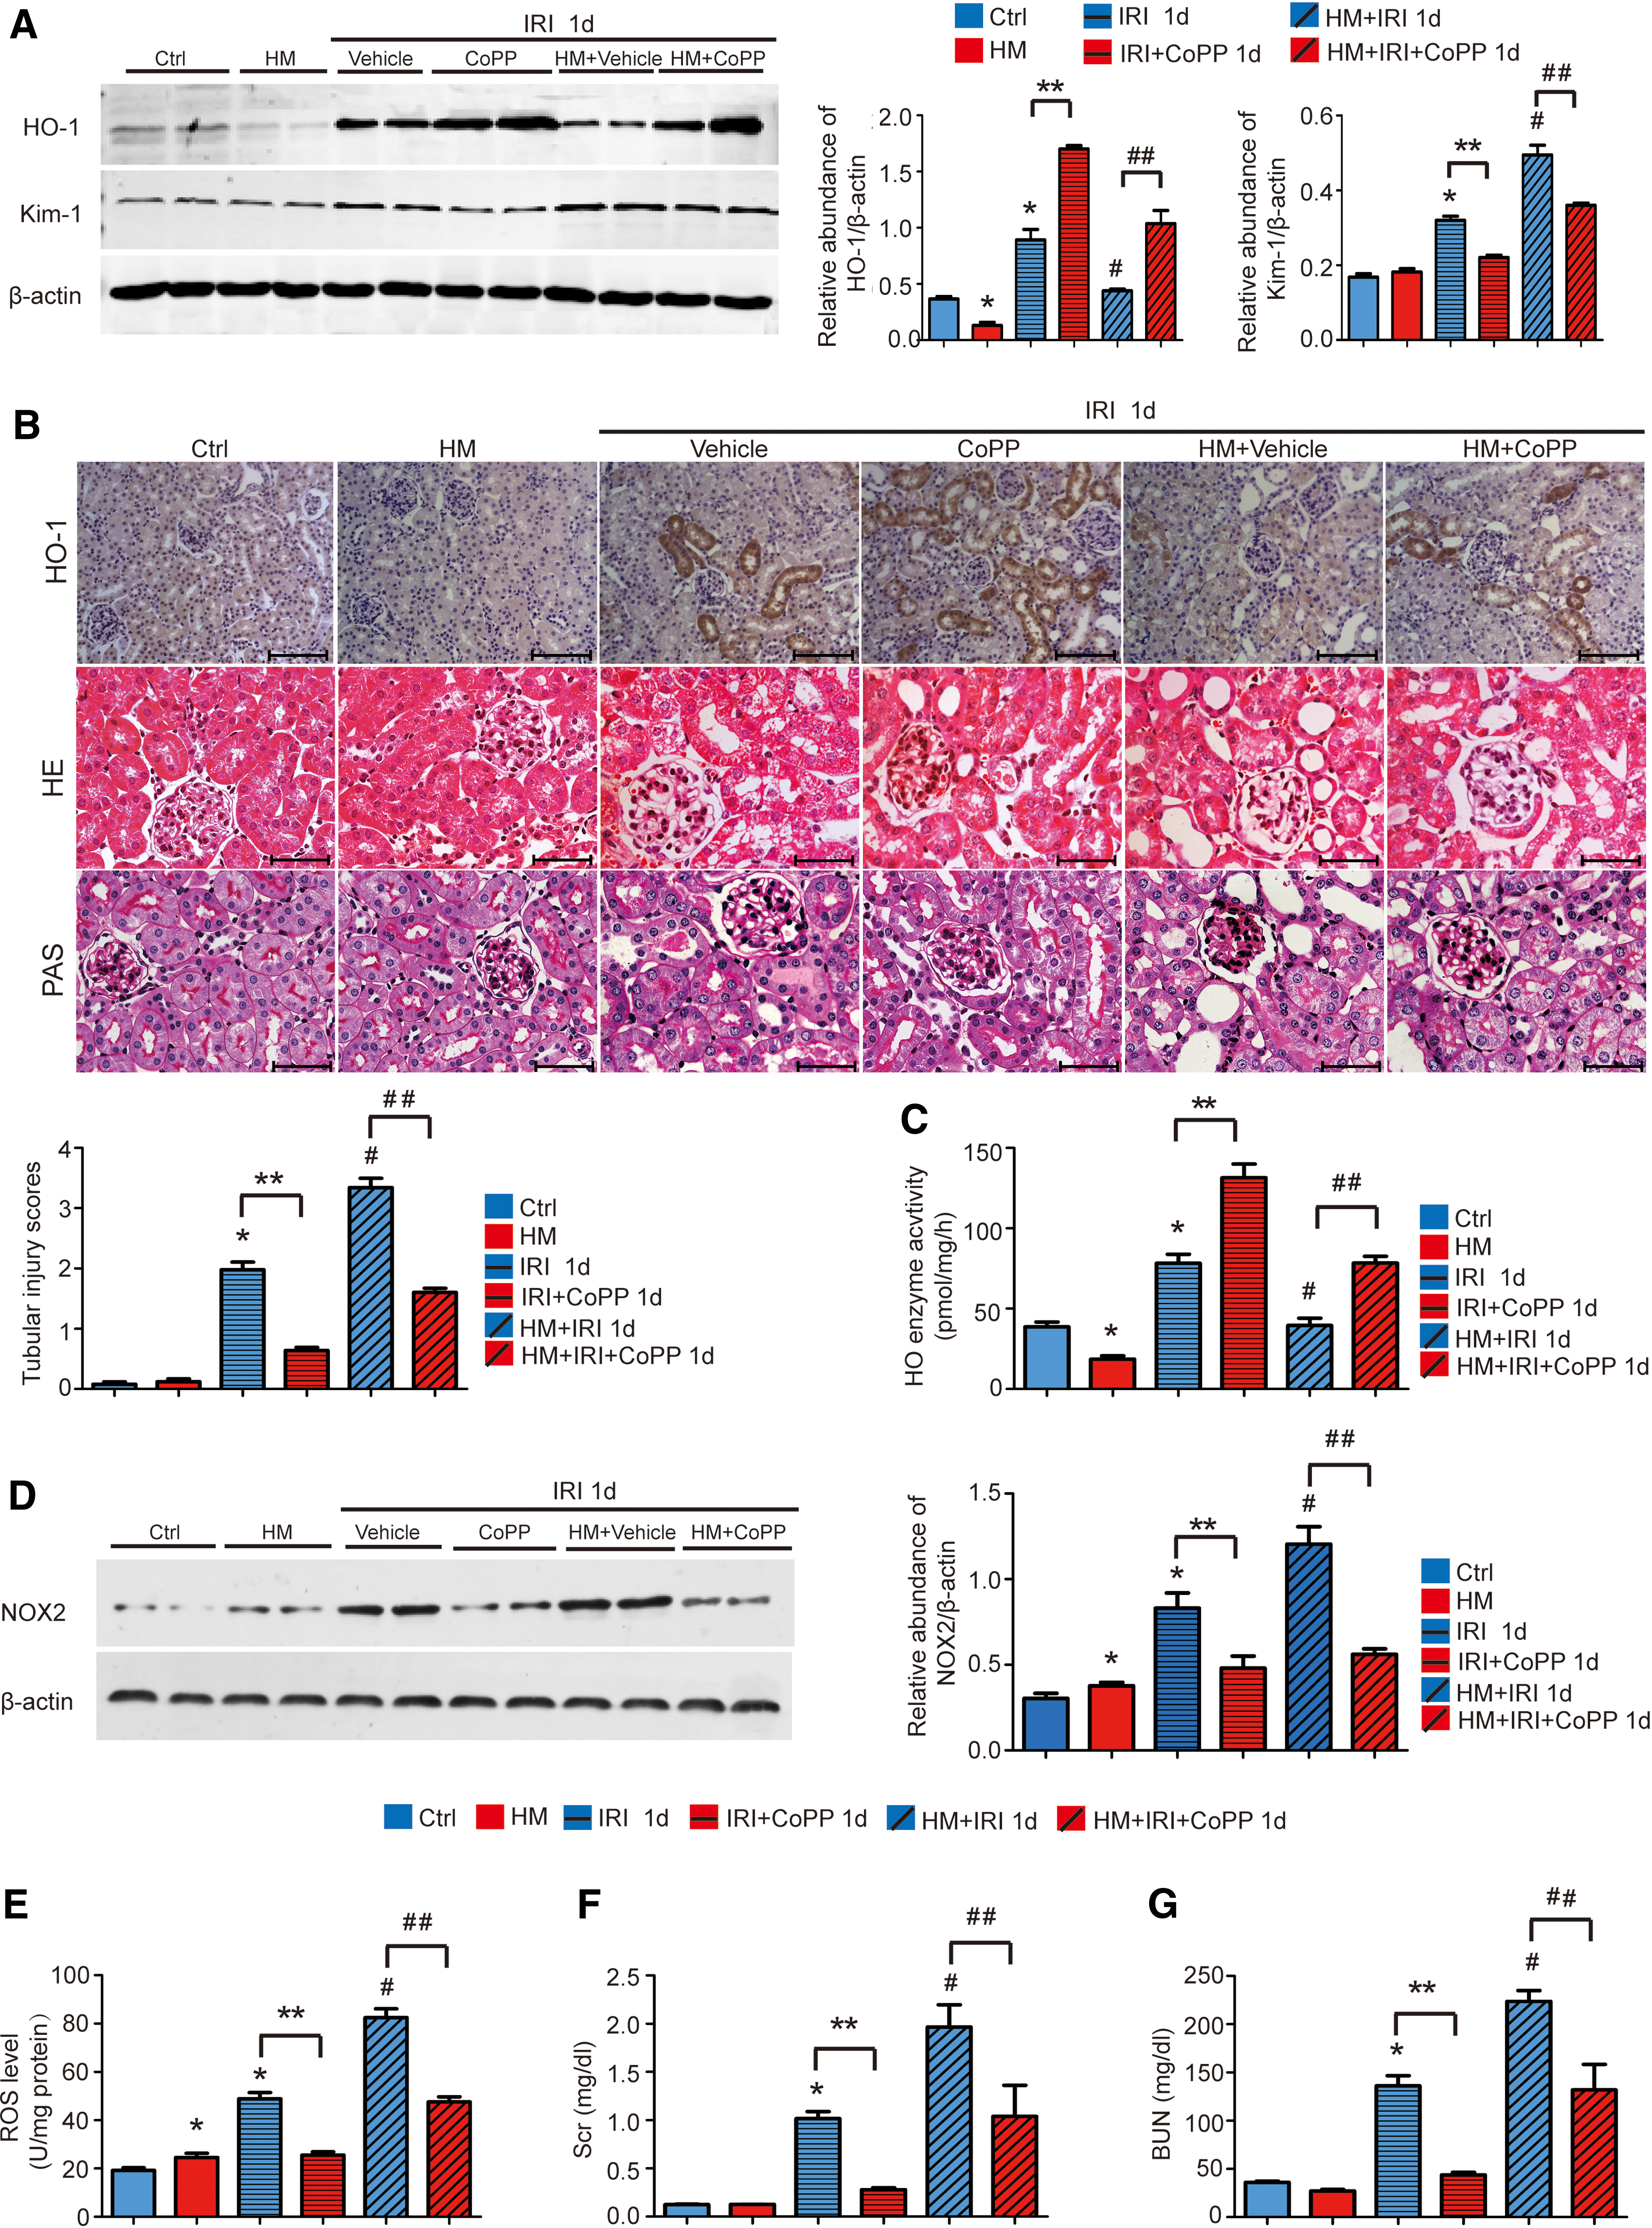
To evaluate the protective effect of HO-1 on AKI, CoPP, a potent inducer of HO-1 (4), was given by intraperitoneally injection once a week at 5 mg/kg body weight for 3 weeks before bilateral IR. Western blotting and immunohistochemistry staining revealed that IR-induced HO-1 expression was significantly attenuated in mice with Hhcy 24 h after IR, and administration of CoPP rescued the downregulation of HO-1 (Fig. 5A, B and Supplementary Fig. S11H). Moreover, CoPP significantly increased the HO-1 activity (Fig. 5C) and reduced reactive oxygen species (ROS) production (Fig. 5E) in mice with Hhcy after IR. The level of ROS in renal tissues of mice treated with CoPP was comparable to that in mice treated with Tiron (200 mg/kg), a ROS scavenger (Supplementary Fig. S9A). In addition, the reduced ROS production was further confirmed by the decreased protein level of NADPH oxidase 2 (NOX2) in renal tissues (Fig. 5D and Supplementary Fig. S12A). Consistent with our previous report, a significant increase of serum creatinine (Scr) and blood urea nitrogen (BUN) was observed in mice with Hhcy compared with that in control mice after IR, whereas CoPP markedly preserved kidney function shown as lower level of Scr and BUN (Fig. 5F, G). Corroborating with the functional analysis, hematoxylin and eosin (H&E) and periodic acid–Schiff (PAS) staining revealed that kidneys from mice with Hhcy showed more severe renal tubular damage, including loss of brush border, tubular dilation, cast formation, and tubular cell necrosis loss. CoPP treatment significantly preserved the kidney architecture with fewer casts and necrotic tubules (Fig. 5B). Consistently, CoPP significantly decreased Kim-1 protein level in mice with Hhcy after IR (Fig. 5A).
We further evaluated tubular cell apoptosis in the renal cortex by TdT-mediated dUTP nick-end labeling (TUNEL) assay. As shown in Figure 6A and B, 24 h after IR, the number of TUNEL-positive tubular cells was significantly higher in mice with Hhcy than in control mice, whereas CoPP significantly reduced the number of TUNEL-positive tubular cells in both control mice and mice with Hhcy. Determination of cleaved caspase-3 and p53 by Western blotting further confirmed the reduction of apoptosis in CoPP-treated mice (Fig. 6C and Supplementary Fig. S12B).

We further evaluated the protective role of CoPP in cisplatin-induced AKI. CoPP was given to mice by intraperitoneally injection once a week at 5 mg/kg for 3 weeks before cisplatin was given by a single intraperitoneal injection at a concentration of 24 mg/kg. Western blotting and immunohistochemistry staining revealed that CoPP significantly elevated the protein level of HO-1, decreased the protein level of NOX2 in injured kidney (Supplementary Figs. S8A, B, D, and Fig. 1A, B and S13D, E), increased the HO-1 activity (Supplementary Fig. S8C), reduced ROS production (Supplementary Fig. S8E), protected renal function decline (Supplementary Fig. S8F, G), and morphological injury (Supplementary Fig. S8B) induced by cisplatin. Collectively, these data suggest that CoPP attenuates both IR and cisplatin-induced AKI of mice with Hhcy.
CoPP hinders Hhcy-accelerated AKI to CKD progression
The severity of the injury is a key determinant dictating the divergent outcomes of AKI. Since Hhcy exacerbates both cisplatin and IR-induced AKI (28), we hypothesized that Hhcy might accelerate the progression of CKD after AKI. To address this issue, mice were subjected to UIRI. Ten days after unilateral IR, the intact contralateral kidney was removed, and the mice were euthanized at day 11 after unilateral IR. As shown in Figure 7A and B, the Scr and BUN levels of mice with Hhcy were significantly higher than those of control mice. Consistent with the functional data, renal morphological lesions were more severe in mice with Hhcy shown by H&E and PAS staining (Fig. 7C). Masson and Sirius red staining manifested more abundant collagen deposition within interstitium in mice with Hhcy (Fig. 7C). Western blotting and real-time PCR showed higher protein level of collagen I, fibronectin, and alpha-smooth muscle actin (α-SMA) in kidneys of mice with Hhcy (Fig. 7E). These results suggest that Hhcy promotes kidney function decline and fibrotic lesions after AKI.

To evaluate the protective role of HO-1 in Hhcy-exacerbated AKI-CKD progression, CoPP was administrated to mice with Hhcy by intraperitoneally injection once a week at 5 mg/kg for 3 weeks before UIRI and was given once at day 3 after UIRI. CoPP significantly elevated the protein level of HO-1, decreased the protein level of NOX2 (Fig. 7E, G and Supplementary Fig. S12F), increased the HO-1 activity (Fig. 7F), attenuated ROS production (Fig. 7H and Supplementary Fig. S9B), and protected renal function decline (Fig. 7A, B) in mice with Hhcy. H&E, PAS, Masson, and Sirius red staining showed attenuated morphological injury and less collagen deposition in mice treated with CoPP. Accordingly, Western blot analyses of whole-kidney lysates revealed decreased level of collagen I, fibronectin, and α-SMA (Fig. 7E). These data indicate that CoPP halts Hhcy-exacerbated AKI-CKD progression.
Discussion
The increased risk of CKD is one of the most dreaded consequences of AKI in the long term (25). This association is also observed for mild forms of AKI. However, currently, no drug is able to halt the AKI to CKD transition in humans. In the present study, we demonstrated that moderate Hhcy promotes the development of CKD after AKI as evidence by more severe renal function decline and renal fibrotic lesions, suggesting that lowering Hcy level might be a therapeutic approach to halt the progression of CKD for AKI patients.
To explore the mechanism by which Hhcy-exacerbated AKI and AKI-CKD progression, we focused on HO-1 due to its broad cytoprotective properties (1, 31, 40). We demonstrated that Hcy decreases the HO-1 expression both in vitro and in vivo. The administration of CoPP significantly attenuated AKI as well as AKI-CKD progression in mice with Hhcy. These data, for the first time, provide a novel mechanism responsible for Hhcy-exacerbated renal injury.
The primary mechanism for the upregulation of the HO-1 gene is by increasing the binding of Nrf2 to ARE sequence on the promoter of HO-1 (18). However, in the current study, we found that in renal tubular cells, Hcy does not modulate Nrf2 expression or its nuclear localization. Instead, we demonstrated that Hcy decreased the expression of HuR, which subsequently affects the mRNA stability of HO-1. Luo et al. showed that Hcy stimulates the expression and the nuclear localization of Bach1, a transcriptional repressor of HO-1, but not Nrf2 expression and nuclear translocation in hepatocytes (29). These findings indicate that Hcy might modulate genes expression in multiple levels, including transcription and post-transcription levels.
Previous study showed that the HO-1 expression is gradually decreased during the progress from AKI to CKD, suggesting that decreased HO-1 expression might contribute to the AKI-CKD progression (26). In addition, Chen et al. reported that the short allele of the guanosine thymidine dinucleotide repeats in the HO-1 gene promoter, which is associated with higher induction of HO-1, is associated with a decreased risk of CKD progression in patients with coronary artery disease (10). In the current study, we found that the induction of HO-1 at day 1 after cisplatin exposure or ischemia-reperfusion injury (IRI) was markedly attenuated by Hhcy. Moreover, compared with normal mice, renal level of HO-1 in mice with Hhcy was significantly decreased throughout the 10-day post-ischemic period. This finding provides further support that HO-1 induction is a potential therapeutic strategy to improve the outcome of AKI.
The kidney is one of the prominent sites for intense oxidative processes in the body and is therefore extremely vulnerable to free radical-mediated injury (14). Hcy contains a reactive sulfhydryl group and, like most thiol-containing amino acids, can undergo rapid auto-oxidation in the presence of oxygen and metal ions to generate potent ROS, superoxide, and hydrogen peroxide (24, 34). In addition, several studies have shown that increased expression and activity of NADPH oxidase by Hhcy is a critical biochemical mechanism in the pathogenesis of vascular diseases (47). Since HO-1 is a key antioxidant detoxification enzyme in maintaining cellular redox homeostasis, our finding indicate that Hcy accumulation enhancing oxidative stress in renal injury might be partially contributed by the decreased level of HO-1. This hypothesis is supported by our finding that the administration of CoPP significantly reduced renal ROS production in mice with Hhcy.
Another novel finding of the present study is that Hcy downregulates the HuR expression. HuR is one of the best characterized RNA-binding proteins that modulate mRNA stability. In the current study, we provided evidence that HO-1 is a target of HuR and Hcy modulates the HO-1 expression in renal tubular cells via inhibiting HuR expression, providing a novel mechanism by which Hhcy exacerbated IR and cisplatin-induced renal tubular injury. Noteworthy, HuR also stabilizes antiapoptotic genes including Bcl-2 (15), prothymosin-α (43), and X-linked inhibitor of apoptosis (52), suggesting that the downregulation of HuR might also contribute to Hhcy-exacerbated tubular cells apoptosis in AKI by downregulating antiapoptotic genes expression.
In summary, we have shown that HO-1 is a target of HuR. Hcy modulates the HO-1 expression by downregulating HuR. Hhcy accelerates the development of CKD after AKI at least partially by inhibiting the HO-1 expression, suggesting that lowering Hcy level or HO-1 induction might be a potential therapeutic strategy to improve the outcome of AKI.
Materials and Methods
Animal models
Male C57BL/6 mice, obtained from and housed in the Southern Medical University animal facility, at the age of 6–8 weeks, were fed with either standard rodent chow or high-methionine diet containing 19.56 g/kg (2%) methionine for 3 weeks. All animal experiments were conducted under a protocol approved by the Ethics Committee for Animal Experiments of the Southern Medical University.
Bilateral IRI was induced as described previously (9, 49). Briefly, mice were kept on a homeothermic station to maintain body temperature at 37°C. Kidneys were exposed by bilateral flank incisions, and the renal pedicles were clamped for 30 min to induce ischemia, and then, the clamps were released to allow reperfusion to the kidney. One milliliter of warm saline (37°C) was injected intraperitoneally after surgery for volume supplement. Sham operation was undergoing the identical procedure except that clamping of the renal pedicles was omitted. Mice were killed 24 h after reperfusion. Blood and renal tissue samples were collected for further analysis.
UIRI was induced as described previously (38). Briefly, the left renal pedicle was clipped using microaneurysm clamps for 30 min. After removal of the clamps, reperfusion of the kidneys was visually confirmed and the incision was then closed. To examine the expression of HO-1 and HuR during the progression of AKI to CKD, mice were killed at days 1, 3, and 10 after reperfusion, respectively. The injured kidneys were harvested for further analysis. To evaluate renal function, mice were subjected to unilateral nephrectomy to remove the intact contralateral kidney at day 10 after UIRI. Mice were euthanized at day 11 after UIRI. Blood and kidney samples were collected for further analysis.
Cisplatin (P4393; Sigma, St. Louis, MO) (24 mg/kg body weight) was given by a single intraperitoneal injection, and kidneys were removed 24 h after injection for further analysis.
To evaluate the protective role of HO-1 in kidney injury, CoPP (C1900; Sigma) was injected intraperitoneally once a week at 5 mg/kg body weight for 3 weeks before either bilateral IRI or cisplatin administration (13). For UIRI, CoPP was injected intraperitoneally once a week at 5 mg/kg body weight for 3 weeks before UIRI and given once at day 3 after UIRI.
Mice with Hhcy were given Tiron by gavage at a concentration of 200 mg/kg/day for 3 weeks before IRI or cisplatin. For UIRI, Tiron was given by gavage at a concentration of 200 mg/kg/day for 3 weeks before UIRI till day 3 after UIRI.
Cell culture and treatment
NRK52E (Rattus norvegicus, cell strain) were cultured in F12 medium supplemented with 10% fetal bovine serum (Gibco/Life Technologies) at 37°C in a 5% CO2 incubator. When reached ∼60% confluence, cells were treated with
Serum Hcy measurement
Serum Hcy was measured using a Homocysteine Assay Kit (Ausa, Shenzhen, China) and an automatic clinical analyzer (Beckman Coulter) according to the manufacturer's instructions. The Hcy measurement was standardized by the National Institute of Standards and Technology Standard Reference Material (SRM) 1955.
Renal function and histology
Renal function was assessed by measuring Scr (Bioassay Systems) and BUN (Bioassay Systems) using an automatic biochemical analyzer (Beckman Coulter).
Paraffin-embedded kidney sections (2 μm) were subjected to H&E staining or PAS staining according to the manufacturer's protocol. Tubular injury was evaluated on sections stained with H&E by scoring from 0 to 4 according to the percentage of tubules with necrosis, dilatation, or cell swelling: 0, <5%; 1, 5–25%; 2, 25–50%; 3, 50–75%; and 4, >75%. At least 10 randomly chosen fields in the cortex under the microscope ( × 400) were evaluated for each mouse in a blinded manner, and an average score was calculated.
Selected paraffin-embedded kidney sections (2 μm) were stained with the Masson Trichrome Stain Kit (Richard-Allan Scientific, Kalamazoo, MI) and Sirius Red Staining Kit (Leagene Biotechnology, Beijing, China) according to the manufacturer's protocols. For the analysis of the interstitial fibrosis in mice, ten 400 × visual fields were randomly selected for each Masson trichrome- and Sirius red-stained kidney section and interstitial fibrosis was manually evaluated by a background subtraction method using Image-Pro Plus 6.0 (Media Cybernetics, Silver Spring, MD). Briefly, 10 non-overlapping bright-field images of renal cortex were captured, and the integrated optical density (OD) of the positive staining was determined. Quantification is presented as the percentage of the ratio of OD of positive staining to the entire spectrum of a given image.
Immunohistochemistry
Immunohistochemical staining was performed on 4 μm kidney sections as previously described (45). Briefly, sections were deparaffinized and rehydrated in ethanol. After antigen repairing, sections were incubated with the primary antibody against HO-1 (ab13243; Abcam) for 14 h at 4°C followed by incubating with secondary antibodies (Dako, Carpinteria, CA) for 30 min. Images were taken by an Olympus BX51 microscope (Olympus, Tokyo, Japan).
TUNEL assay
Renal apoptosis was detected by the TUNEL assay using the in situ cell death detection kit POD (Roche) according to the manufacturer's protocol. Briefly, paraffin-embedded renal tissue sections were exposed to the TUNEL reaction mixture and then counterstained with 4′,6-diamidino-2-phenylindole (DAPI) to visualize the nuclei. TUNEL-positive nuclei were identified by fluorescence microscopy. The number of TUNEL-positive cells was counted in 10 fields per section and 10 sections per kidney.
RNA interference
Oligonucleotide siRNA duplex was synthesized by Shanghai GenePharma (Shanghai, China). RNA interference (RNAi) oligonucleotides were transfected into cells using the Lipofectamine 2000 (Invitrogen, Carlsbad, CA) according to the manufacturer's instructions. The sequences of RNAi oligonucleotides were as follows: scramble siRNA: UUCUCCGAACGUGUCACGUTT; HuR siRNA: GCUCAGAGGUUAUCAAAGATT.
RNA electrophoretic mobility shift assay
EMSA and supershift assay was performed as described previously (22). Briefly, biotin-labeled HO-1-ARE oligonucleotides were incubated with cell lysates extracted from NRK52E in binding buffer for 30 min at 37°C. Complexes were resolved by native 5% TBE-polyacrylamide gel electrophoresis for 2 h and then blotted onto a nylon membrane. Detection of biotin-labeled complex was performed according to the manufacturer's instructions. For competition assay, unlabeled HO-1-ARE oligonucleotides were added in the reaction mixture. For supershift assay, monoclonal HuR-antibody was incubated with cell lysate extracted from NRK52E either treated or untreated with
Western blotting
Kidney tissues or cells were lysed in PLC lysis buffer containing cocktail inhibitor (Merck Millipore) on ice. Lysates were subjected to Western blot analysis as described previously (11).
Cells were fractionated into cytosolic and nuclear fractions using a Nuclear Protein and Cytoplasmic Protein Extraction Kit (P0028; Biyuntian, Shanghai, China) according to the manufacturer's instructions. Briefly, cells were centrifuged for 5 min at 1200 rpm and the pellet was dissolved with cytoplasmic protein extraction agent. After vortexing, samples were centrifuged at 14,000 × g and the supernatant, consisting of the cytosolic fraction, was stored at −80°C for further analysis. The pellet was then resuspended in nuclear protein extraction agent. After vortexing and centrifuging at 14,000 × g, the supernatant containing the nuclear extracts was collected and stored at −80°C for further analysis.
The following primary antibodies were used: anti-HO-1 (ab13243; Abcam), anti-Nrf2 (ab31163; Abcam), anti-HuR (ab200342; Abcam), anti-Lamin A/C (BA1227; Boster), anti-p53 (sc-126; Santa Cruz Biotechnology), anti-cleaved caspase-3 (9664s; Cell Signaling Technology), anti-α-SMA (A5228; Cell Signaling Technology), anti-fibronectin (F3648; Sigma), anti-collagen I (234167; Calbiochem, EMD Biosciences, Darmstadt, Germany), anti-Kim-1 (ab47635; Abcam), anti-β-actin (Huatesheng Biotechnology, Fushun, China), and anti-Nox2 (ab80508; Abcam).
Real-time PCR
Total RNA was isolated from NRK52E or kidney tissues using TRIzol reagent according to the manufacturer's instructions (Invitrogen). Real-time PCR was performed on an ABI PRISM 7500 Fast sequence detection system (Applied Biosystems, Foster City, CA). After the PCRs were completed, the CT values were determined by setting a fixed threshold. The relative amount of mRNA was normalized to β-actin. The amount of mRNA relative to the internal control β-actin was calculated with the equation 2−▵▵CT. Primers used in this study are listed in Supplementary Table S1.
HO enzyme activity measurement
HO activity was measured as described previously (23). Briefly, cell lysates or kidney tissues were homogenized on ice in a Tris-HCl lysis buffer (pH 7.4) containing 0.5% Triton X-100 and protease inhibitors. Homogenates were mixed with 0.8 mM NADPH, 0.8 mM glucose-6-phosphate-1-dehydrogenase, 1 mM MgCI2, and rat liver cytosol as a source of biliverdin reductase at 4°C. The reaction was initiated by the addition of hemin and incubated at 37°C in the dark for 1 h and terminated by the addition of chloroform. The production of bilirubin was determined as the difference in absorption between 460 and 530 nm using a quartz cuvette. Controls include naive samples in the absence of the NADPH generating system and all the ingredients of the reaction mixture in the absence of homogenates. To obtain the absolute concentration of bilirubin in the sample, the standard curve of bilirubin concentration was drawn by measuring the OD value of bilirubin with different concentrations according to the light absorption law of Lambert–Beer. The absolute concentration of bilirubin in the sample was then obtained from the standard curve according to the OD value of the sample. The HO activity was expressed as picomoles of bilirubin formed per milligram of protein per hour.
Measurement of ROS content
The ROS contents in renal tissues were measured as described previously (46). The kidney tissues were homogenized with 20-fold volume of ice-cold 1 × phosphate-buffered saline and then centrifuged at 12,000 × g for 10 min at 4°C. The protein concentrations in the supernatants were determined using bicinchoninic acid (BCA) kits (Beyotime Biotechnology, Jiangsu, China). The ROS in the supernatant were determined with enzyme-linked immunosorbent assay kits for mouse ROS (Jianglai, Shanghai, China) according to the manufacturer's protocol. Briefly, 50 μL of sample was added to the appropriate wells, and then, 100 μL of enzyme conjugate was added to sample wells and incubated for 60 min at 37°C. After washing four times, the substrate solution was added and incubated for 15 min at 37°C followed by adding Stop Solution. The Stop Solution changes the color from blue to yellow, and the intensity of the color is measured at 450 nm using a spectrophotometer. To measure the concentration of ROS in the samples, a set of calibration standards is included. The calibration standards are assayed at the same time as the samples and allow the operator to produce a standard curve of OD versus ROS concentration. The concentration of ROS in the samples is then determined by comparing the OD of the samples with the standard curve.
Luciferase reporter assay
The luciferase reporter construct containing the WT 3′-UTR of HO-1 or a mutation at ARE was generated by GenePharma. The luciferase activity was measured by using luciferase reporter assay system (Promega, Madison, WI) according to the manufacturer's instruction.
Statistical analyses
Data are expressed as the mean ± standard deviation, and differences between the groups were analyzed using t-test, one-way analysis of variance, and correlation analysis (SPSS software, version 20.0; SPSS, Inc.). p-Value <0.05 was considered significantly different.
Footnotes
Acknowledgments
This work was supported by grants from the Nature and Science Foundation of China (81288001, 81521003, 81730019), the National Key Research and Development Program of the China Specialized for “Precision Medicine Research” during the 13th Five-Year Plan Period (2016YFC0903100), the Natural Science Foundation of Guangdong province (S2013020012748), and the Science and Information Technology of Guangzhou Key Project (201508020260) to J.N.
Author Disclosure Statement
The authors declare that no competing interest exists.
Abbreviations Used
References
Supplementary Material
Please find the following supplemental material available below.
For Open Access articles published under a Creative Commons License, all supplemental material carries the same license as the article it is associated with.
For non-Open Access articles published, all supplemental material carries a non-exclusive license, and permission requests for re-use of supplemental material or any part of supplemental material shall be sent directly to the copyright owner as specified in the copyright notice associated with the article.