
Abstract
Haptoglobin's (Hp) main role is to bind free hemoglobin (Hb), reducing its oxidative potential. The Hp–Hb complex formed is cleared from the circulation by macrophage receptor CD163. In diabetes, impaired Hp 2-2–Hb CD163 clearance and abnormal glomerular permeability allow the large Hp 2-2–Hb complex to cross the barrier, where its redox active iron leads to cellular toxicity. Although Hp 2-2 predicts renal function decline, whether renal iron deposition differs by Hp is unknown. We used renal quantitative T2* magnetic resonance imaging to estimate iron level in the cortex and medullar of type 1 diabetes (T1D) adults [15 Hp 1-1 and 15 Hp 2-2 carriers of similar age (53 years), duration (45 years), and gender]. Total kidney iron level was estimated as the sum of the cortex and medullar iron. Albuminuria was defined as urinary albumin to creatinine ratio >30 mg/g in two of three samples. Total kidney iron did not differ by gender or Hp but was higher in those with albuminuria (p = 0.05), an association confined to Hp 2-2 carriers (p = 0.04 vs. p = 0.51 in Hp 1-1). These data lead to the hypothesis that kidney iron deposition is increased among Hp 2-2 carriers with albuminuria in T1D. Antioxid. Redox Signal. 29, 735–741.
Introduction
D
The haptoglobin (Hp) 2 allele predicts end-stage renal disease in type 1 diabetes (T1D), an association hypothesized to relate to kidney iron deposition. This is the first study to provide data on kidney iron deposition by Hp genotype in humans. Our findings do not support differences in kidney iron by Hp overall in T1D. However, these data suggest the presence of significantly greater kidney iron deposition among those with albuminuria than among normoalbuminuric individuals only among Hp 2-2 carriers with T1D. Since Hp is a functional polymorphism, furthering our understanding of its role in kidney disease may one day offer opportunities for targeted therapy.
Hp is an acute phase protein whose major function is to bind free hemoglobin (Hb) (6). The formed Hp–Hb complex is cleared from the circulation by the CD163 monocyte/macrophage receptor; a secondary pathway for excretion is through the kidneys (6). Hp's Hb binding property is important because it reduces free Hb's oxidative potential, by inhibiting the release of heme-iron, and kidney damage, potentially resulting from increased iron deposition in renal proximal tubule cells subsequent to the glomerular clearance of Hb and iron after erythrocyte destruction (6).
Structural and functional differences between the two classes of Hp alleles, with Hp 1 being a more efficient antioxidant/anti-inflammatory factor than Hp 2 (6), are thought to explain findings of an increased risk of declining kidney function and end-stage renal disease (ESRD) associated with Hp 2 in T1D (2, 9). However, whether these kidney function defects with Hp 2 relate to iron deposition is unknown. We thus undertook this study to assess whether kidney iron deposition is greater in Hp 2-2 than in Hp 1-1 carriers in T1D.
Results and Discussion
Participant characteristics by Hp genotype and albuminuria status
Participant characteristics, including serum iron markers, did not differ by Hp genotype (Table 1). Of the 30 participants who underwent a kidney multiecho T2* magnetic resonance imaging (MRI), data from one individual were excluded from analyses due to severe motion artifacts. In the remaining 29 participants, kidney iron deposition was similar between Hp 1-1 and Hp 2-2 genotype carriers.
To convert mg/dL to mmol/l, divide by 0.02586 for HDL cholesterol and by 0.01129 for triglycerides; to convert hemoglobin from g/dL to g/L, multiply by 10; to convert serum iron or total iron binding capacity from μg/dL to μmol/L, divide by 0.179; the conversion factor for ferritin from ng/mL to μg/L is 1.
Fisher's exact test p.
ACR, urinary albumin to creatinine ratio; BMI, body mass index; eGFR, estimated glomerular filtration rate; HDL, high-density lipoprotein.
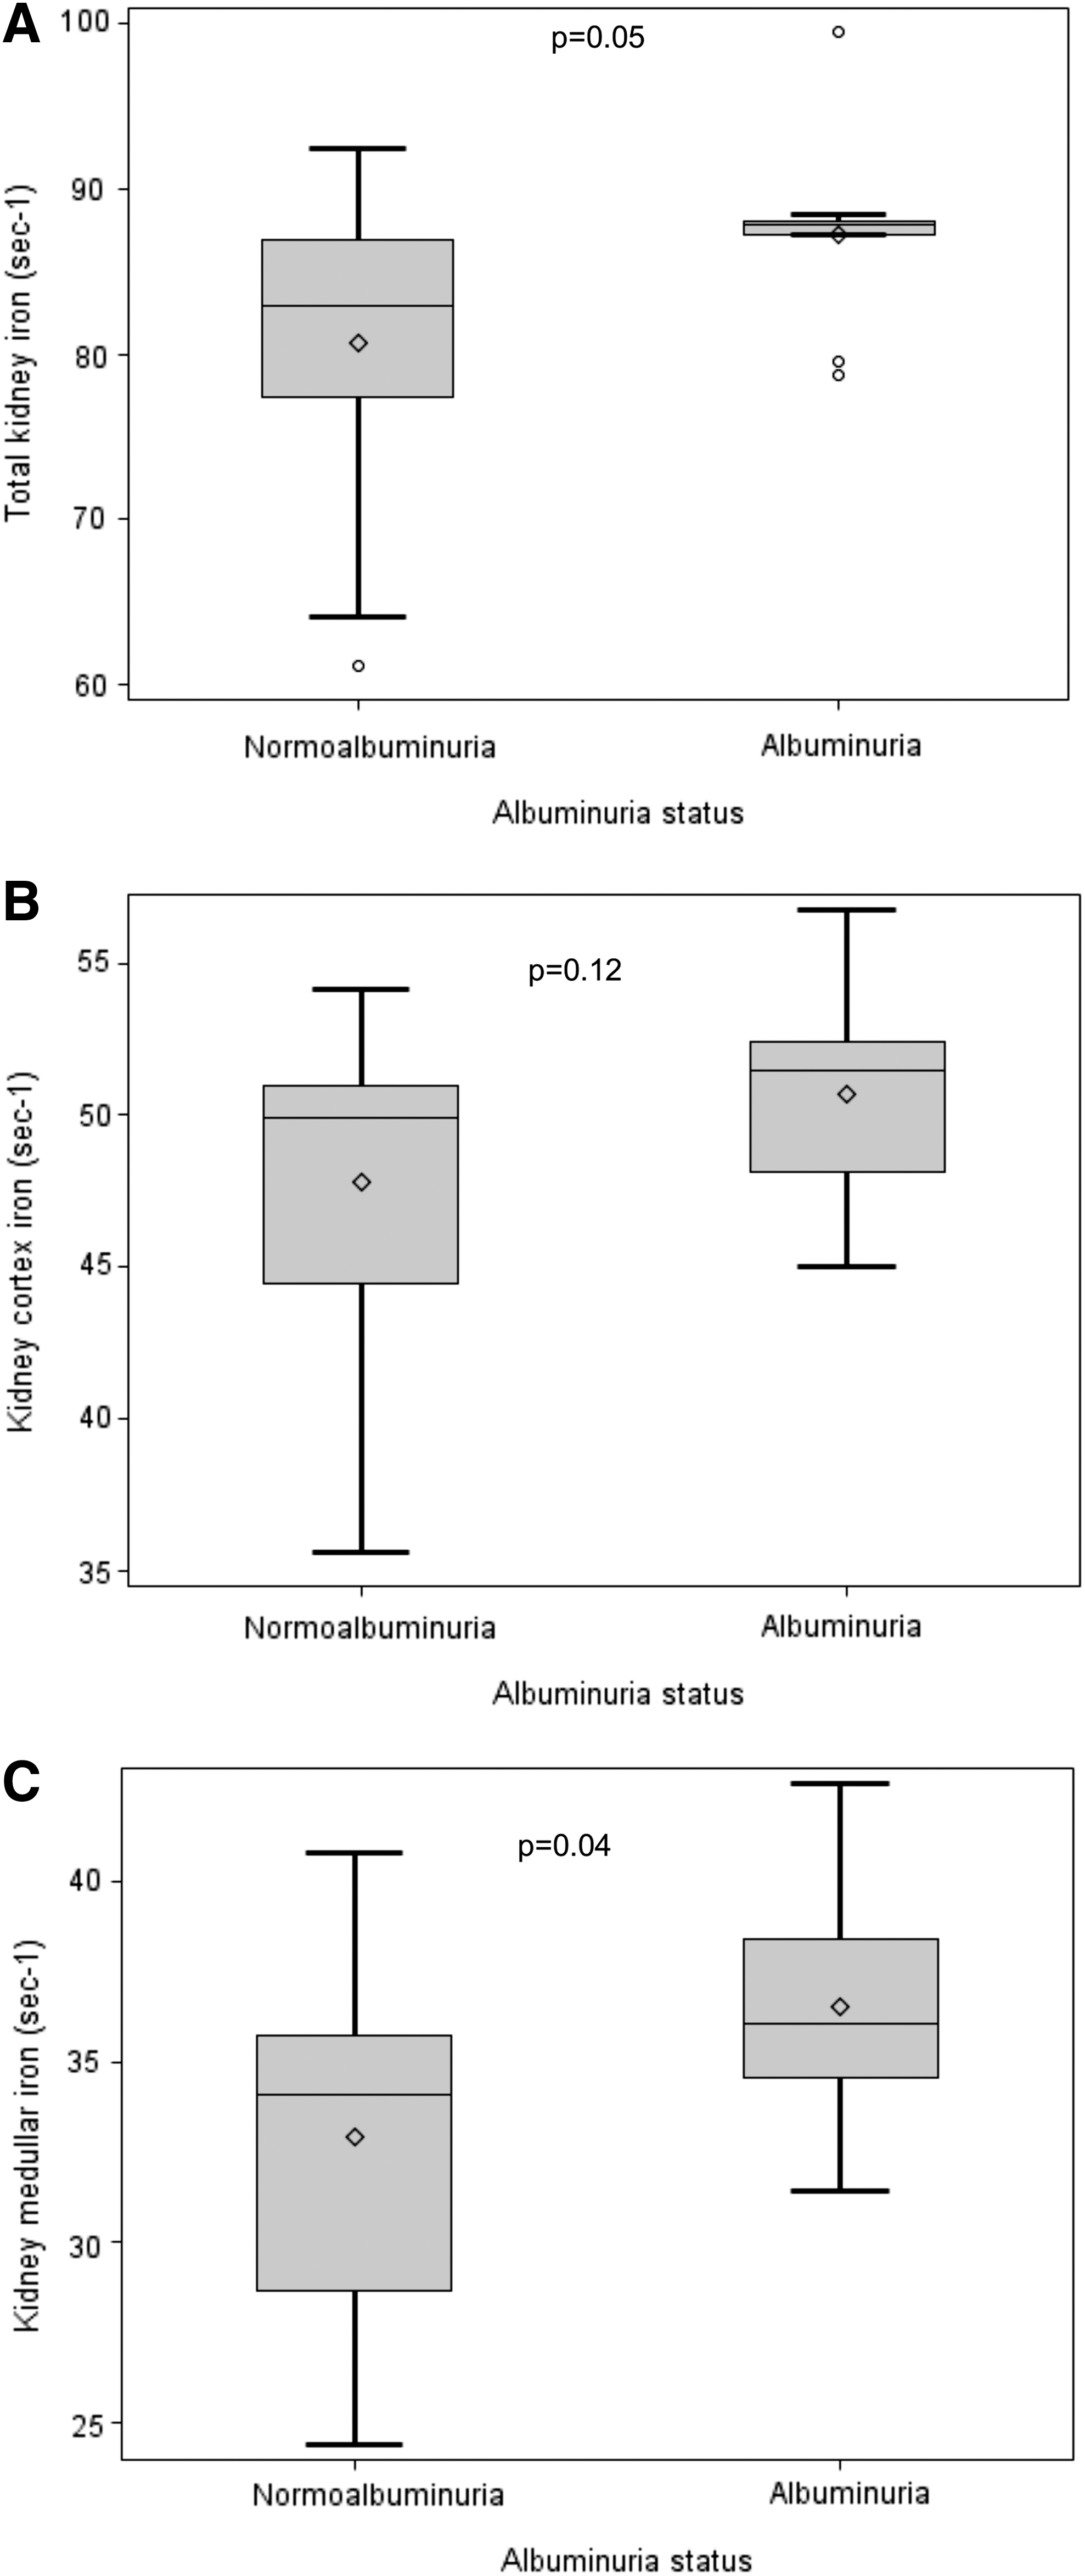
Nine (31.0%) of those with MRI data available were classified as having albuminuria. Men were more likely to have albuminuria than women (46.7% vs. 14.3%, respectively, p = 0.11), whereas no differences were observed by Hp (Hp 1-1: 35.7%; Hp 2-2: 26.7%, p = 0.70). Although serum iron markers did not differ by albuminuria status (all p > 0.30), kidney iron deposition was greater with albuminuria (87.2 ± 6.0 vs. 80.7 ± 8.6, p = 0.05 for total kidney iron deposition); this was similar for iron deposition in the cortex (50.7 ± 3.6 vs. 47.8 ± 4.9, p = 0.12) and the medulla (36.5 ± 3.4 vs. 32.9 ± 4.6, p = 0.04) (Fig. 1).
Kidney iron deposition by Hp and albuminuria status
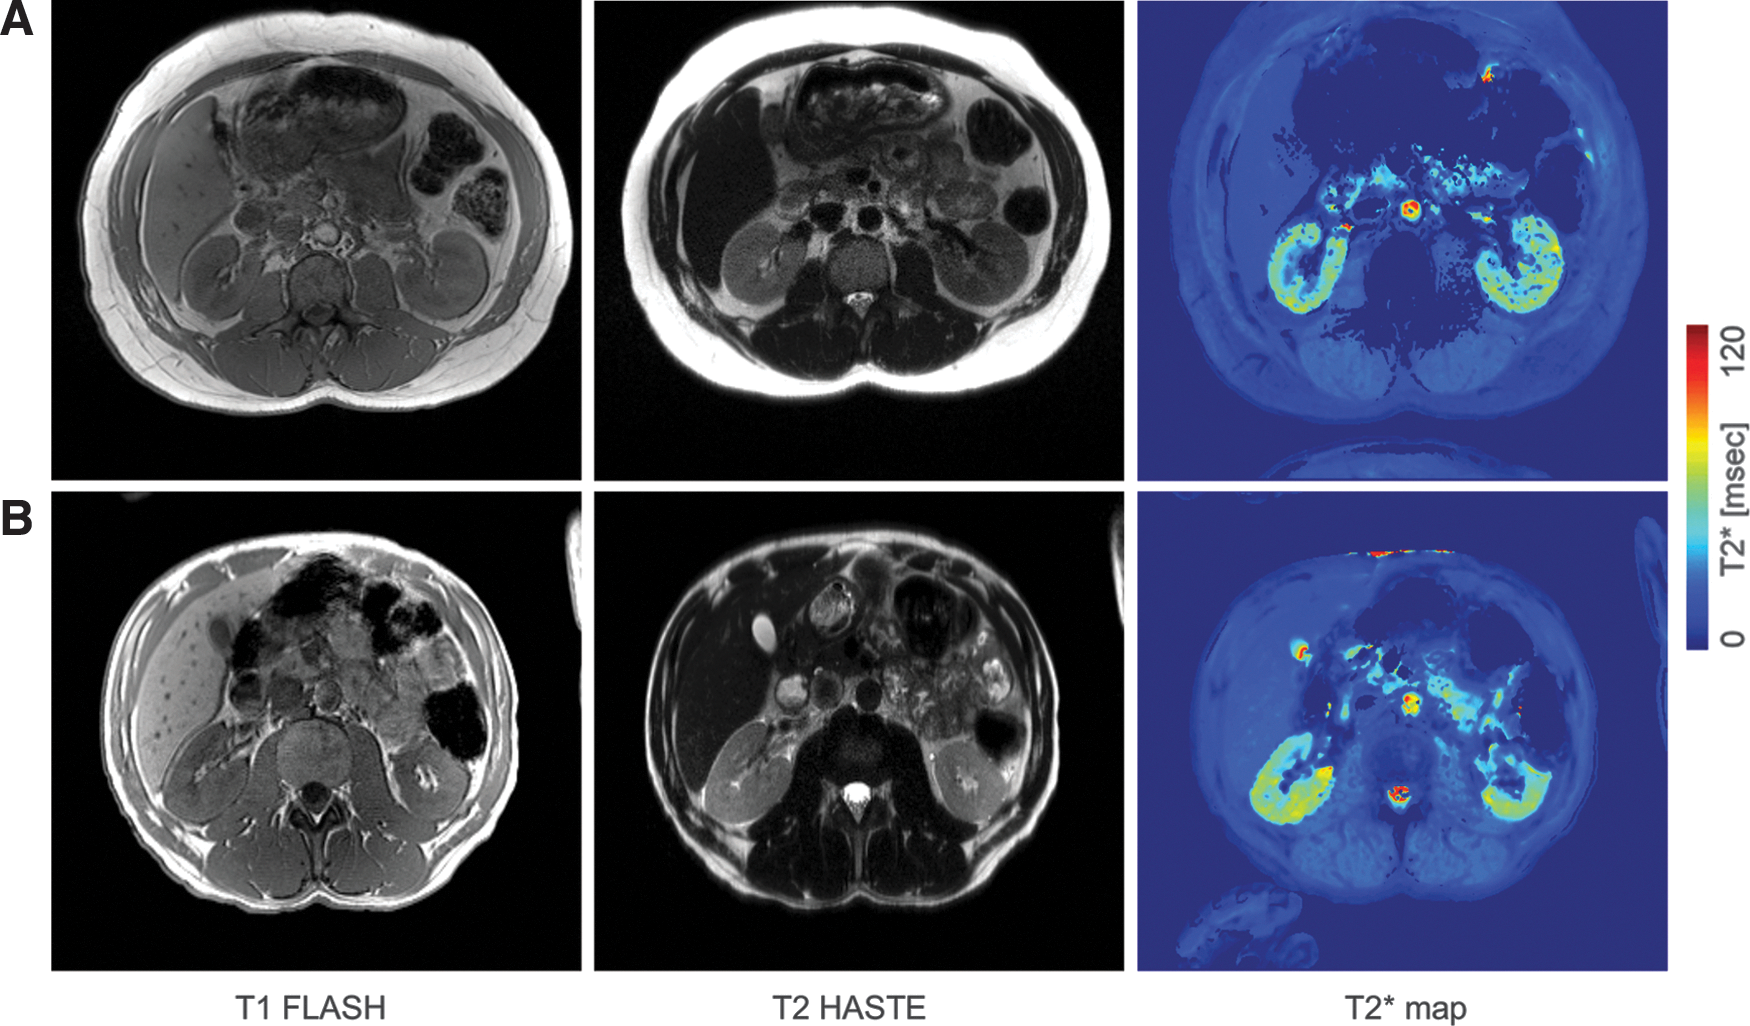
In the presence of albuminuria, kidney iron deposition was greater only among Hp 2-2 carriers (Table 2). Figure 2 shows the distribution of kidney iron by Hp and albuminuria status. Although differences by Hp were not statistically significant given the small sample size, greater kidney iron deposition was apparent among Hp 2-2 than among Hp 1-1 carriers with albuminuria, whereas kidney iron deposition was similar in normoalbuminuria by Hp. In particular, total kidney iron deposition was similar across Hp 1-1 carriers (regardless of albuminuria) and Hp 2-2 carriers with normoalbuminuria and significantly lower from that observed in Hp 2-2 carriers with albuminuria (81.5 ± 8.1 vs. 90.6 ± 5.9 s−1, p = 0.04, Fig. 2A). Similarly, higher iron deposits were observed in the cortex (52.6 ± 3.1 vs. 48.1 ± 4.6 s−1, p = 0.07, Fig. 2B) and medulla (38.0 ± 3.5 vs. 33.4 ± 4.4, p = 0.06, Fig. 2C) of Hp 2-2 carriers with albuminuria than in those of all other groups. The MRI scan results of an Hp 1-1 and an Hp 2-2 carrier of similar age and diabetes duration with albuminuria are shown in Figure 3.

These findings suggest that only in the presence of glomerular dysfunction (i.e., increased albuminuria), Hp 2-2 can exert damaging effects on the kidney. Previous in vitro and animal studies provide support for these observations. Thus, although in general only Hp 1-1 is filtered by the kidney and Hp 2-2, a large polymer, is not, it has been suggested that abnormal glomerular permeability in diabetes may allow larger complexes, such as the Hp 2-2–Hb complex, to cross the barrier (7). Megalin and cubulin, endocytic receptors that mediate Hb uptake in renal proximal tubules (5), likely also mediate the uptake of the Hp–Hb complex and direct it to the lysosomes for degradation (1).
This renal mode for removal of the Hp–Hb complex is thought to be utilized more by Hp 2-2, since it is less efficient in promoting uptake of the complex by the CD163 scavenger receptor (6). However, it has also been proposed that the glomerular filtration of the Hp 2-2–Hb complex leads to a generally increased iron accumulation in renal proximal tubules, oxidative stress, and hypertrophy (6). Indeed, significantly increased glomerular and proximal tubular hypertrophy and greater deposition of renal iron were also previously shown in Hp 2-2 diabetic mice (8).
Kidney iron deposition by Hp and estimated glomerular filtration rate <60 mL/min per 1.73 m2
Although an estimated glomerular filtration rate (eGFR) <60 mL/min per 1.73 m2 at the most recent assessment of an individual within the Epidemiology of Diabetes Complications (EDC) or Haptoglobin Phenotype, Vitamin E, and High-density Lipoprotein Function in Type 1 Diabetes (HAPE) studies was an exclusion criterion, five participants (three Hp 2-2 and two Hp 1-1 carriers) developed kidney dysfunction by entry into this study. Kidney iron deposition appeared higher in Hp 2-2 (79.9 s−1) than in Hp 1-1 (74.7 s−1) carriers among those with loss of kidney function, although formal statistical analyses were not conducted.
Kidney iron deposition by gender and albuminuria status
Given known gender differences in serum iron markers, we further assessed kidney iron deposition by albuminuria status stratifying by gender (Table 3). Findings were similar in men and women, showing greater kidney iron deposition in the presence of albuminuria in both genders.
Satterthwaite p-value for unequal variances between groups.
Limitations and conclusion
Our study was originally powered to detect an overall 2.3-unit difference in kidney iron by Hp. Thus, although a much greater difference of 6.1 units (90.6 s−1 in Hp 2-2 vs. 84.5 s−1 in Hp 1-1) was observed by Hp among those with albuminuria, the sample size (n = 9) achieved only 30% power to detect a statistically significant difference. Similarly, this study was not powered to detect significant modification of the effect of albuminuria on kidney iron deposition by Hp genotype. Indeed, the p-value for a Hp × albuminuria interaction term was 0.27 for total kidney iron deposition.
In addition to the small sample size, another important limitation of our study is the inability to generalize our findings to nonwhite populations, as we based our recruitment on participants of the EDC and HAPE cohorts, both of which are largely Caucasian. Undoubtedly, our results require replication in larger and diverse cohorts. However, this study has provided evidence to suggest that the reason Hp 2-2 predicts the development of ESRD in diabetes may indeed relate to increased iron accumulation in the renal proximal tubules subsequent to the glomerular filtration of the Hp 2-2–Hb complex in the presence of abnormal glomerular permeability. These findings may prove essential for furthering our understanding of the pathophysiology of renal failure in the T1D population carrying the Hp 2 allele.
Notes
Power calculations
Preliminary data on a convenience sample of one Hp 1-1 and one Hp 2-2 carrier suggested a four-unit difference in kidney iron by Hp. The target sample size was thus set to 30 (15 Hp 1-1, 15 Hp 2-2), providing 84% power to detect a significant 2.3-unit difference between group means (lower than suggested by preliminary data), given standard deviation = 2.0, α = 0.05, and allowing for a 7% dropout rate within each Hp group.
Recruitment
Middle-aged T1D adults with known Hp genotype were recruited from the EDC prospective study of childhood-onset T1D (4) or the HAPE cross-over pilot study of the effects of vitamin E on high-density lipoprotein function by Hp genotype study (3). A letter explaining the study aims was mailed to Hp 1-1 and Hp 2-2 carriers of similar age, diabetes duration, and gender (n = 76), followed by a phone call to assess their willingness/eligibility to participate. Exclusion criteria comprised ESRD, anemia (Hb <130 g/L for men; <120 g/L for women), blood transfusion/donation within 3 months of study entry, iron supplementation, and alcohol intake >20 g/day. An eGFR <60 mL/min per 1.73 m2 at the most recent EDC/HAPE assessment was also an exclusion criterion to reduce the likelihood of progression to ESRD by entry into this study. Of these 76, contact could not be established for 18; 11 declined participation; 8 were ineligible (reasons comprised iron supplementation/treatment, anemia, >2 alcoholic drinks daily, claustrophobia, and MRI scan ineligibility due to metallic implants); and 38 were initially deemed eligible. However, an appointment could not be scheduled within the study timeframe for 4, 2 were deemed ineligible upon further assessment (claustrophobia, shoulders too wide to fit in the MRI scanner), 2 cancelled (health reasons, jury duty), and 30 (15 Hp 1-1, 15 Hp 2-2) completed the study.
Study procedures
Participants were mailed containers for the collection of a 24-h and overnight urine sample, which they kept refrigerated/frozen until their visit. On arrival at the clinic in the fasted state, participants provided informed consent, eligibility for an MRI scan was reconfirmed, and a brief examination (including anthropometrics, blood pressure, and blood sample collection) was conducted. Participants were then taken to the MR Research Center where the 1-h, noncontrast, kidney MRI scan was performed. All procedures were in accordance with the principles of the Declaration of Helsinki.
Renal quantitative T2* MRI was applied to estimate iron level in the renal cortex and medulla; total kidney iron was calculated as the sum of the two. MR images were acquired using a 3T Siemens Prisma scanner (Siemens, Germany) with 600-mm bore size in supine position. A spine matrix receiver coil was placed below the participant's back and a body matrix receiver coil was wrapped around the torso to increase signal sensitivity. Respiration was monitored during the scan and used in guiding participants to perform a series of breath holds (20–30 s at end expiration). The position of the kidneys was ascertained using a localizer sequence and the volume of magnetic field shimming included the abdominal region for both kidneys. To provide an anatomical reference, structural MR images were acquired using T1- and T2-weighted sequences with imaging parameters: T1-weighted 2D fast low angle shot (Fig. 4A)—repletion time (TR)/echo time (TE) 146/2.46 ms, resolution 1.1 × 1.1 × 3.0 mm3, slices 40, acceleration factor 2, and total acquisition time 52 s; T2 half Fourier acquired single-shot turbo spin echo (Fig. 4B)—TR/TE 1600/101 ms, resolution 1.1 × 1.1 × 3.0 mm3, slices 40, acceleration factor 2, and total acquisition time 1 min 22 s. For T2* measures, a multi-slice multi-echo gradient echo (GRE) sequence was applied (Fig. 4C, D); TR/TE 90/(2.93, 5.45, 7.97, 10.49, 13.01, 15.53, 18.05, 20.57, 23.09, 25.61) ms, resolution 0.7 × 0.7 × 5.0 mm3, slices 12, repetition 2–3, acceleration factor 2, and total acquisition time 2 min 27 s per measurement.
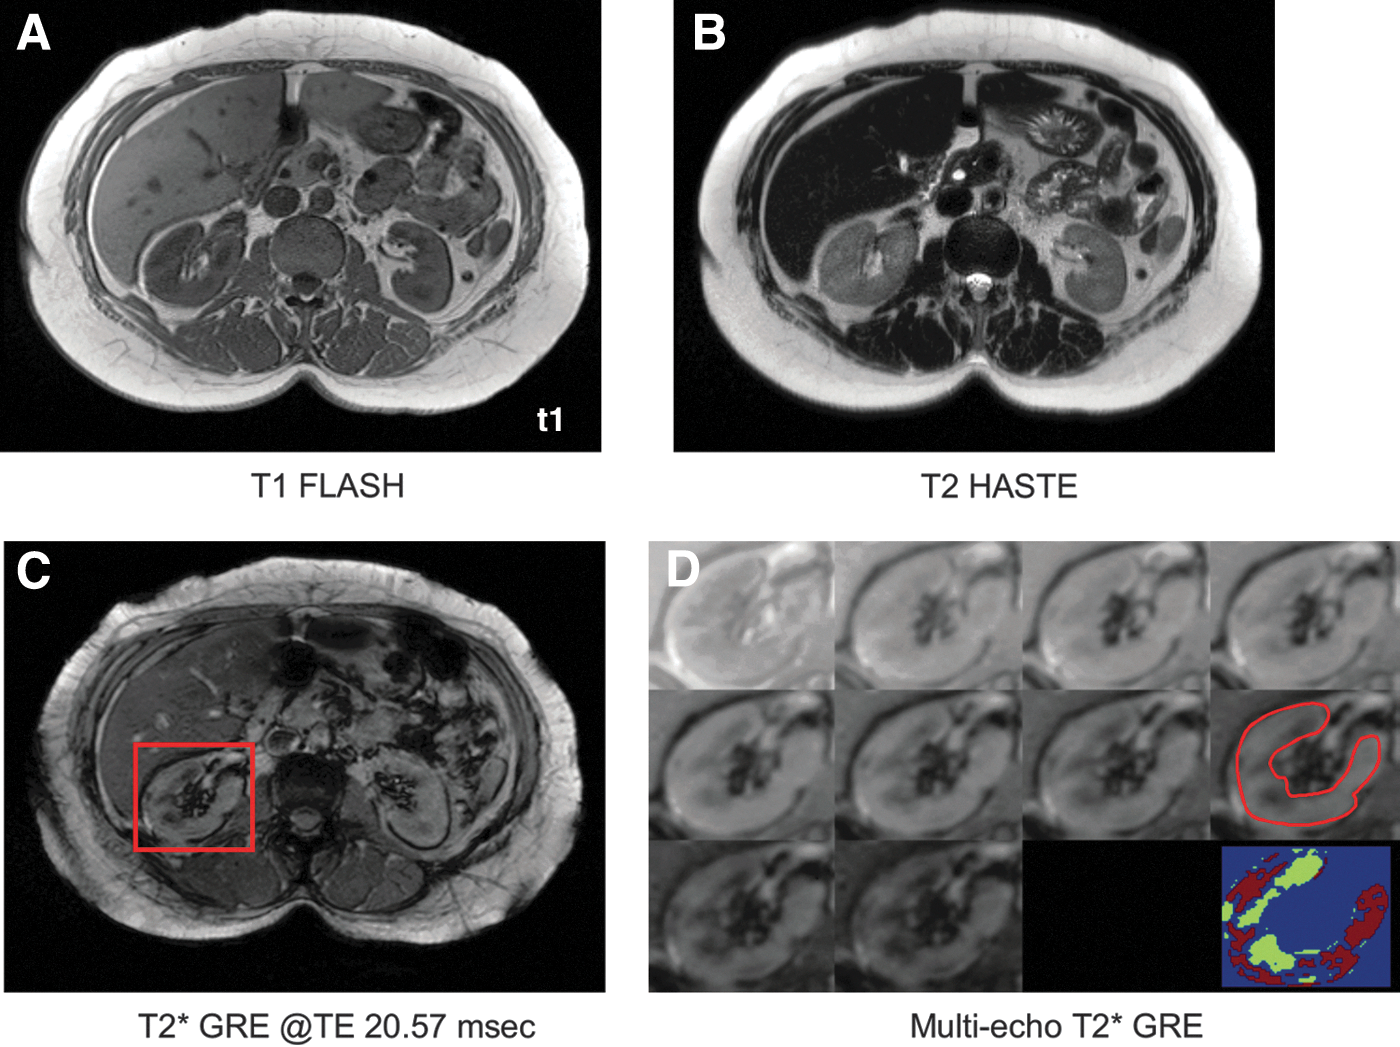
The MR images were archived in digital imaging and communications in medicine format and converted to the ANALYZE (Mayo Clinic, MN) format for analysis. Image data processing was conducted using in-house MATLAB code (The MathWorks, Inc.). Change in the multiecho GRE signal with TE was modeled as a monotonically decaying exponential function, S0*exp(-TE/T2*) + Soffset, with S0 as the protodensity, TE and T2* relaxation times in ms, and Soffset as the signal offset. The data curve with TE per pixel was fitted to estimate T2* by minimization of the least-squares error. The region of interest (ROI) of the kidneys was manually drawn and included only the cortex and medullar regions based on GRE images at TE 20.57 ms (showing high contrast between the kidney cortex and medulla, Fig. 4C) and with MR images providing the anatomical reference (Fig 4A, B). Large vessels and boundary regions around the kidney surface were excluded to remove flow and partial volume artifacts (Fig. 4D, red contour). The mean ROI T2* value was converted to R2* (R2* = 1/T2* in s−1) to directly estimate total kidney iron. Higher R2* values are indicative of greater iron deposits. The image analyst conducting the MR scans and the assessment of kidney iron was blinded to the participants' Hp genotype.
HbA1c was assessed by a DCA® 2000 analyzer; total cholesterol, high-density lipoprotein cholesterol, and triglycerides by a Cholestech LDX Analyzer (Alere, UK); and urinary albumin and creatinine by a DCA Vantage Analyzer (Siemens, USA). Albuminuria was defined as urinary albumin/creatinine ratio >30 mg/g in two of three timed urine samples. Serum albumin, creatinine, iron, total iron binding capacity, amount of saturated transferrin, serum ferritin, and white blood cell count were assessed at Quest Diagnostics (Pittsburgh, PA).
Statistical analyses
Descriptive statistics were utilized to determine differences in participant characteristics by Hp or albuminuria status. The distribution of kidney iron by Hp or albuminuria status was illustrated with simple plots. Modification of the effect of albuminuria on kidney iron by Hp was evaluated in general linear regression models with kidney iron as a continuous outcome variable and Hp, albuminuria, and their interaction as the independent variables. Analyses were conducted using SAS version 9.4 (SAS Institute).
Footnotes
Acknowledgments
We are indebted to all study participants for their invaluable contributions to this research study, as well as, the study staff. Financial support for this work was provided by the NIDDK Diabetic Complications Consortium (DiaComp,
Author Disclosure Statement
The authors declare no financial conflicts of interest.