
Abstract
Significance:
Optical imaging using the endogenous fluorescence of metabolic cofactors has enabled nondestructive examination of dynamic changes in cell and tissue function both in vitro and in vivo. Quantifying NAD(P)H and FAD fluorescence through an optical redox ratio and fluorescence lifetime imaging (FLIM) provides sensitivity to the relative balance between oxidative phosphorylation and glucose catabolism. Since its introduction decades ago, the use of NAD(P)H imaging has expanded to include applications involving almost every major tissue type and a variety of pathologies.
Recent Advances:
This review focuses on the use of two-photon excited fluorescence and NAD(P)H fluorescence lifetime techniques in cancer, neuroscience, tissue engineering, and other biomedical applications over the last 5 years. In a variety of cancer models, NAD(P)H fluorescence intensity and lifetime measurements demonstrate a sensitivity to the Warburg effect, suggesting potential for early detection or high-throughput drug screening. The sensitivity to the biosynthetic demands of stem cell differentiation and tissue repair processes indicates the range of applications for this imaging technology may be broad.
Critical Issues:
As the number of applications for these fluorescence imaging techniques expand, identifying and characterizing additional intrinsic fluorophores and chromophores present in vivo will be vital to accurately measure and interpret metabolic outcomes. Understanding the full capabilities and limitations of FLIM will also be key to future advances.
Future Directions:
Future work is needed to evaluate whether a combination of different biochemical and structural outcomes using these imaging techniques can provide complementary information regarding the utilization of specific metabolic pathways.
Introduction
Optical imaging has emerged as a valuable tool in biomedical research due to its flexibility in revealing morphological and biochemical details of cells and tissues through light–matter interactions that can include absorption, scattering, and fluorescence (39). This optical interrogation of cells and tissues is typically nondestructive, which can enable longitudinal evaluations of dynamic biological processes. One of the primary advantages of optical imaging is the ability to resolve subcellular detail with high-resolution microscopy techniques. Spectroscopic imaging techniques that measure optical signals at specific wavelengths, combined with the use of immunofluorescence labeling, have provided unparalleled specificity in exploring complex cellular processes. In addition to the use of standard exogenous dyes or stains, cells express a number of intrinsic fluorophores that play key roles in cellular metabolism and can be valuable in monitoring cellular and tissue metabolism (65).
In the 1950s, Britton Chance first began characterizing the intrinsic fluorescence of metabolic cofactors and subsequently defined the relationship between the redox state of respiratory enzymes and mitochondrial metabolism in vitro (13, 15). Cellular redox networks responsible for metabolic control are able to adapt to changing environments and maintain key single-cell and multicellular processes responsible for growth and homeostasis (42). Among various cellular cofactors, pyridine nucleotides and flavoproteins have been identified as reliable indicators of cell metabolism (15, 16). Nicotinamide adenine dinucleotide, a pyridine nucleotide serving as a major metabolic electron carrier, exists in a reduced (NADH), oxidized (NAD+), and phosphorylated (NADPH or NADP+) form throughout the cell. Similarly, the flavoprotein prosthetic group flavin adenine dinucleotide also is a metabolic electron carrier with a reduced (FADH2) and oxidized (FAD) form. Out of these redox cofactors, only NADH, NADPH, and FAD are autofluorescent, with NADH exhibiting the highest fluorescence intensity within cells (16). Quantifying the fluorescence signal of these cofactors can provide an estimate of metabolic activity, because metabolic potential coincides with the ratio of reduced and oxidized metabolic substrates (12, 16). High-resolution microscopy techniques enable a further understanding of the heterogeneity of dynamic changes in redox states within cells or tissues and may provide diagnostic insight previously unachieved through other methods.
This review highlights the advantages and disadvantages of the most widely used optical imaging modalities for NADH, NADPH, and FAD imaging, as well as their recent applications. Emphasis will be placed on recent work involving two-photon excited fluorescence (TPEF) and fluorescence lifetime imaging (FLIM). Recent research in the areas of cancer, neuroscience, tissue engineering, and other biomedical applications will be examined to highlight the wide applicability of using these endogenous labels to characterize disease states and tissue development.
Sources of Optical Contrast
NADH, NADPH, and FAD fluorescence can be isolated to provide optical contrast through the selection or filtering of specific excitation and emission bands (Table 1). Peak single-photon NADH and NADPH fluorescence emission can be observed between 440 and 470 nm using 330–360 nm excitation; the nearly identical emission spectra of NADH and NADPH can be attributed to their nicotinamide moieties and nearly identical structure (65). Because of their similar fluorescence characteristics, NADH and NADPH are often collectively referred to as NAD(P)H (28, 68). NAD(P)H transfers electrons through binding to various dehydrogenases, and whether the molecule is free or protein bound will affect its fluorescence quantum yield (i.e., the number of photons emitted relative to the number of photons absorbed). Typically, bound NAD(P)H has a higher quantum yield than free NAD(P)H, and emits at a higher intensity (14, 41). Measurements of the ratio of free to protein-bound NAD(P)H can be made through FLIM. The lifetime of a fluorophore is the average time spent in an excited state before emission, which is affected by the same radiative and nonradiative processes that also define quantum yield. The time constants reported from multiexponential fits of NAD(P)H fluorescence decay over several nanoseconds can be used to determine the relative proportions of bound and free NAD(P)H. When free, identical lifetimes for both NADH and NADPH have been reported to average around 0.4 ns. However, in the bound state, NADH(P)H mean lifetimes within cells are greater and typically range between 1.9 and 5.7 ns (7, 9, 11, 88). Such great variations in the lifetime of the bound state of NAD(P)H have been attributed to differences in NAD(P)H conformation in response to enzyme binding (9, 11, 93). Distinct NADH lifetimes have been shown following the binding of specific enzymes in solution, including lactate dehydrogenase (LDH), malate dehydrogenase, citrate synthase, and Complex I of the electron transport chain (ETC) (11, 25, 26, 49, 100). Since NADH and NADPH exhibit identical excitation and emission spectra, efforts to separate the two have been made utilizing FLIM, and it has been suggested NADPH has a distinct long fluorescence lifetime component that significantly contributes to average NAD(P)H fluorescence lifetime measurements (10).
FAD fluorescence is emitted at a peak of 520–530 nm when excited between 365 and 465 nm. Because photon absorption by NAD(P)H substantially decreases as excitation wavelengths are increased from 360 to 390 nm, FAD fluorescence can be isolated from NADH through the selection of a longer excitation wavelength. While protein binding to NAD(P)H causes an increase in fluorescence lifetime and quantum yield, protein binding of FAD to many protein complexes will typically cause significant quenching and a decrease in lifetime from 2.3 to 2.9 ns for its free state to <0.1 ns in its bound state (7, 37). This quenching effect has been attributed to the presence of tyrosine and tryptophan residues and affects most, but not all, flavoproteins (102). As a result of this quenching, the majority of flavoprotein fluorescence originates from lipoamide dehydrogenase (LipDH) and electron transfer flavoprotein (ETF), which, respectively, contribute 50% and 25% of observed FAD fluorescence (45 –47, 65). Other flavoproteins involved in metabolism, such as succinate dehydrogenase (Complex II of the ETC), are considered negligible due to their extremely small contributions, and a final 25% of flavoprotein fluorescence is not connected to metabolism (47).
Intensity-Based Measurements and the Optical Redox Ratio
Early work by Britton Chance using a fluorimeter demonstrated an increase in NADH fluorescence intensity that corresponded to an increase in glycolysis (17). This seminal research has led to a variety of discoveries on mitochondrial function that rely on measurements of the fluorescence intensity of NAD(P)H and FAD. Chance went on to develop spectroscopic techniques applicable to intact tissues, pioneering in vivo redox state monitoring in the rat liver, kidney, and brain (15, 82). In the 1970s, he developed the Chance redox scanner, which can achieve automated three-dimensional (3D) metabolic scanning through point excitation of a frozen sample whose surface is revealed by progressive mechanical sectioning (76, 122). Nondestructive optical sectioning to permit 3D visualization has also been obtained through confocal microscopy. Confocal depth-resolved images of NADH fluorescence have been previously obtained from rabbit cornea (56, 69). Composite 3D images of NADH fluorescence have also been obtained from the brain as well as tumors; however, they still required mechanical sectioning of frozen samples (87, 129).
While the Chance redox scanner, epifluorescence microscopes, and laser scanning confocal microscopes can be used to detect NAD(P)H and FAD intensity, instrumentation has advanced significantly over the last 25 years, enabling deeper noninvasive 3D visualization of cell and tissue redox states. Specifically, the arrival of TPEF microscopy has been particularly advantageous for NAD(P)H and FAD imaging. In TPEF, molecules are brought to an excited state through the simultaneous absorption of two photons of half the energy and twice the wavelength (40). Therefore, near-infrared light can be used to excite NAD(P)H and FAD, rather than high-energy ultraviolet (UV) and near-UV light. Near-infrared light can penetrate farther through tissue, allowing TPEF imaging up to 0.3–1 mm below the surface depending on the tissue type, exceeding the capabilities of confocal microscopy (40). Furthermore, the probability of the near simultaneous absorption of two photons is, for all practical purposes, limited to the focal plane. This provides an intrinsic depth sectioning ability without the need for a confocal pinhole, allowing for closer detector placement within the microscope and more efficient light collection from highly scattering tissues (40). This intrinsic depth sectioning with TPEF imaging also eliminates the risk of out-of-plane photodamage. Due to these advantages, TPEF imaging is ideally suited for longitudinal in vitro and in vivo imaging of NAD(P)H and FAD without a significant risk of modifying their biochemical and physiological state.
For quantitative measures of fluorescence intensity, researchers have typically normalized their measurements using rhodamine or fluorescein standards (5, 33). This normalization of TPEF signals allows for comparisons between different laser power and detector gain settings. However, for deep 3D tissue imaging, this normalization does not account for signal loss due to the scattering properties of the tissue imaged. Implementation of an optical redox ratio of FAD/[NAD(P)H+FAD], originally proposed by Britton Chance, provides a convenient descriptor of metabolic state that is largely independent of scattering effects (16, 57). The optical redox ratio of FAD/[NAD(P)H+FAD] has been shown to be strongly correlated with the concentration ratio of NAD+/[NADH+NAD+] in multiple cell types (75, 105). A number of other groups have reported ratios of NADH/FAD or FAD/NADH, but the ratios of two variables following normal distributions will produce right-skewed data that deviate from a normal distribution and violate the assumptions of commonly used parametric statistical tests (e.g., analyses of variance) (62, 66). A ratio of FAD/[NAD(P)H+FAD] fluorescence, as originally proposed by Chance, is preferred because it will typically maintain a normal distribution and produces values bound between 0 and 1. To avoid confusion, all redox ratios referenced in this review are described in terms of a ratio of FAD/[NAD(P)H+FAD], regardless of their original published form.
One of the primary challenges with intensity-based measurements of NAD(P)H and FAD is that these intrinsic fluorophores have a quantum yield (Table 1) that is an order of magnitude lower than commonly used fluorophores such as rhodamine B (0.31–0.65) and fluorescein (∼0.9) (24, 27). Measuring the relatively weak fluorescence of NAD(P)H and FAD can be challenging in tissues where collagen or lipofuscin autofluorescence may be colocalized. Furthermore, in highly perfused tissues, such as the brain, hemodynamic changes can affect intensity-based measurements, such as an optical redox ratio, due to hemoglobin absorption. While imaging depth limitations of up to 1 mm have been achieved via TPEF approaches, in practice, imaging depths involving NAD(P)H rarely extend beyond 0.3 mm due to the highly scattering nature of most biological tissues. Furthermore, imaging depths can be even more limited for highly absorbing tissues, such as muscle.
Fluorescence Lifetime-Based Measurements
FLIM microscopy can overcome some of the challenges of intensity-based measurements because it can extract metabolic information using a single excitation wavelength, is independent of intensity, and sensitive to a variety of changes in the molecular microenvironment, such as pH, temperature, and viscosity (19). With NAD(P)H imaging, FLIM is typically used to determine the binding fraction of fluorophores based on their unique lifetimes in protein-bound and unbound states (32, 49) (Table 1). FAD fluorescence lifetimes are also sensitive to protein binding and NAD+ presence, however, the biological interpretation of these measurements is not well understood (21). NAD(P)H FLIM measurements can be an attractive alternative to the optical redox ratio for applications in which the hemodynamics of well-perfused organs can influence FAD measurements.
Spatially and temporally resolved measures of NAD(P)H and FAD can be performed in the frequency domain fluorescence lifetime imaging (FD-FLIM) or using an ultrafast laser and time-correlated single-photon counting (TCSPC) method (9, 128). FD-FLIM is based on measuring phase shifts and changes in modulation at various frequencies using intensity-modulated excitation and analyzing these shifts using a nonlinear least squares method (31, 34). However, with NAD(P)H and FAD autofluorescence, TCSPC is more frequently used. This technique creates a histogram of lifetimes by measuring the time between a laser pulse and the detection of an individual emitted photon (6). The arrival time of thousands of photons at each pixel is needed to obtain an accurate lifetime decay measurement, requiring integration times that often exceed 2 min (109). As a result, FLIM approaches are generally not suitable for applications that require the observation of rapid metabolic changes.
To analyze NAD(P)H FLIM data, biexponential models are commonly fit to the histogram at each pixel to obtain the decay curve,
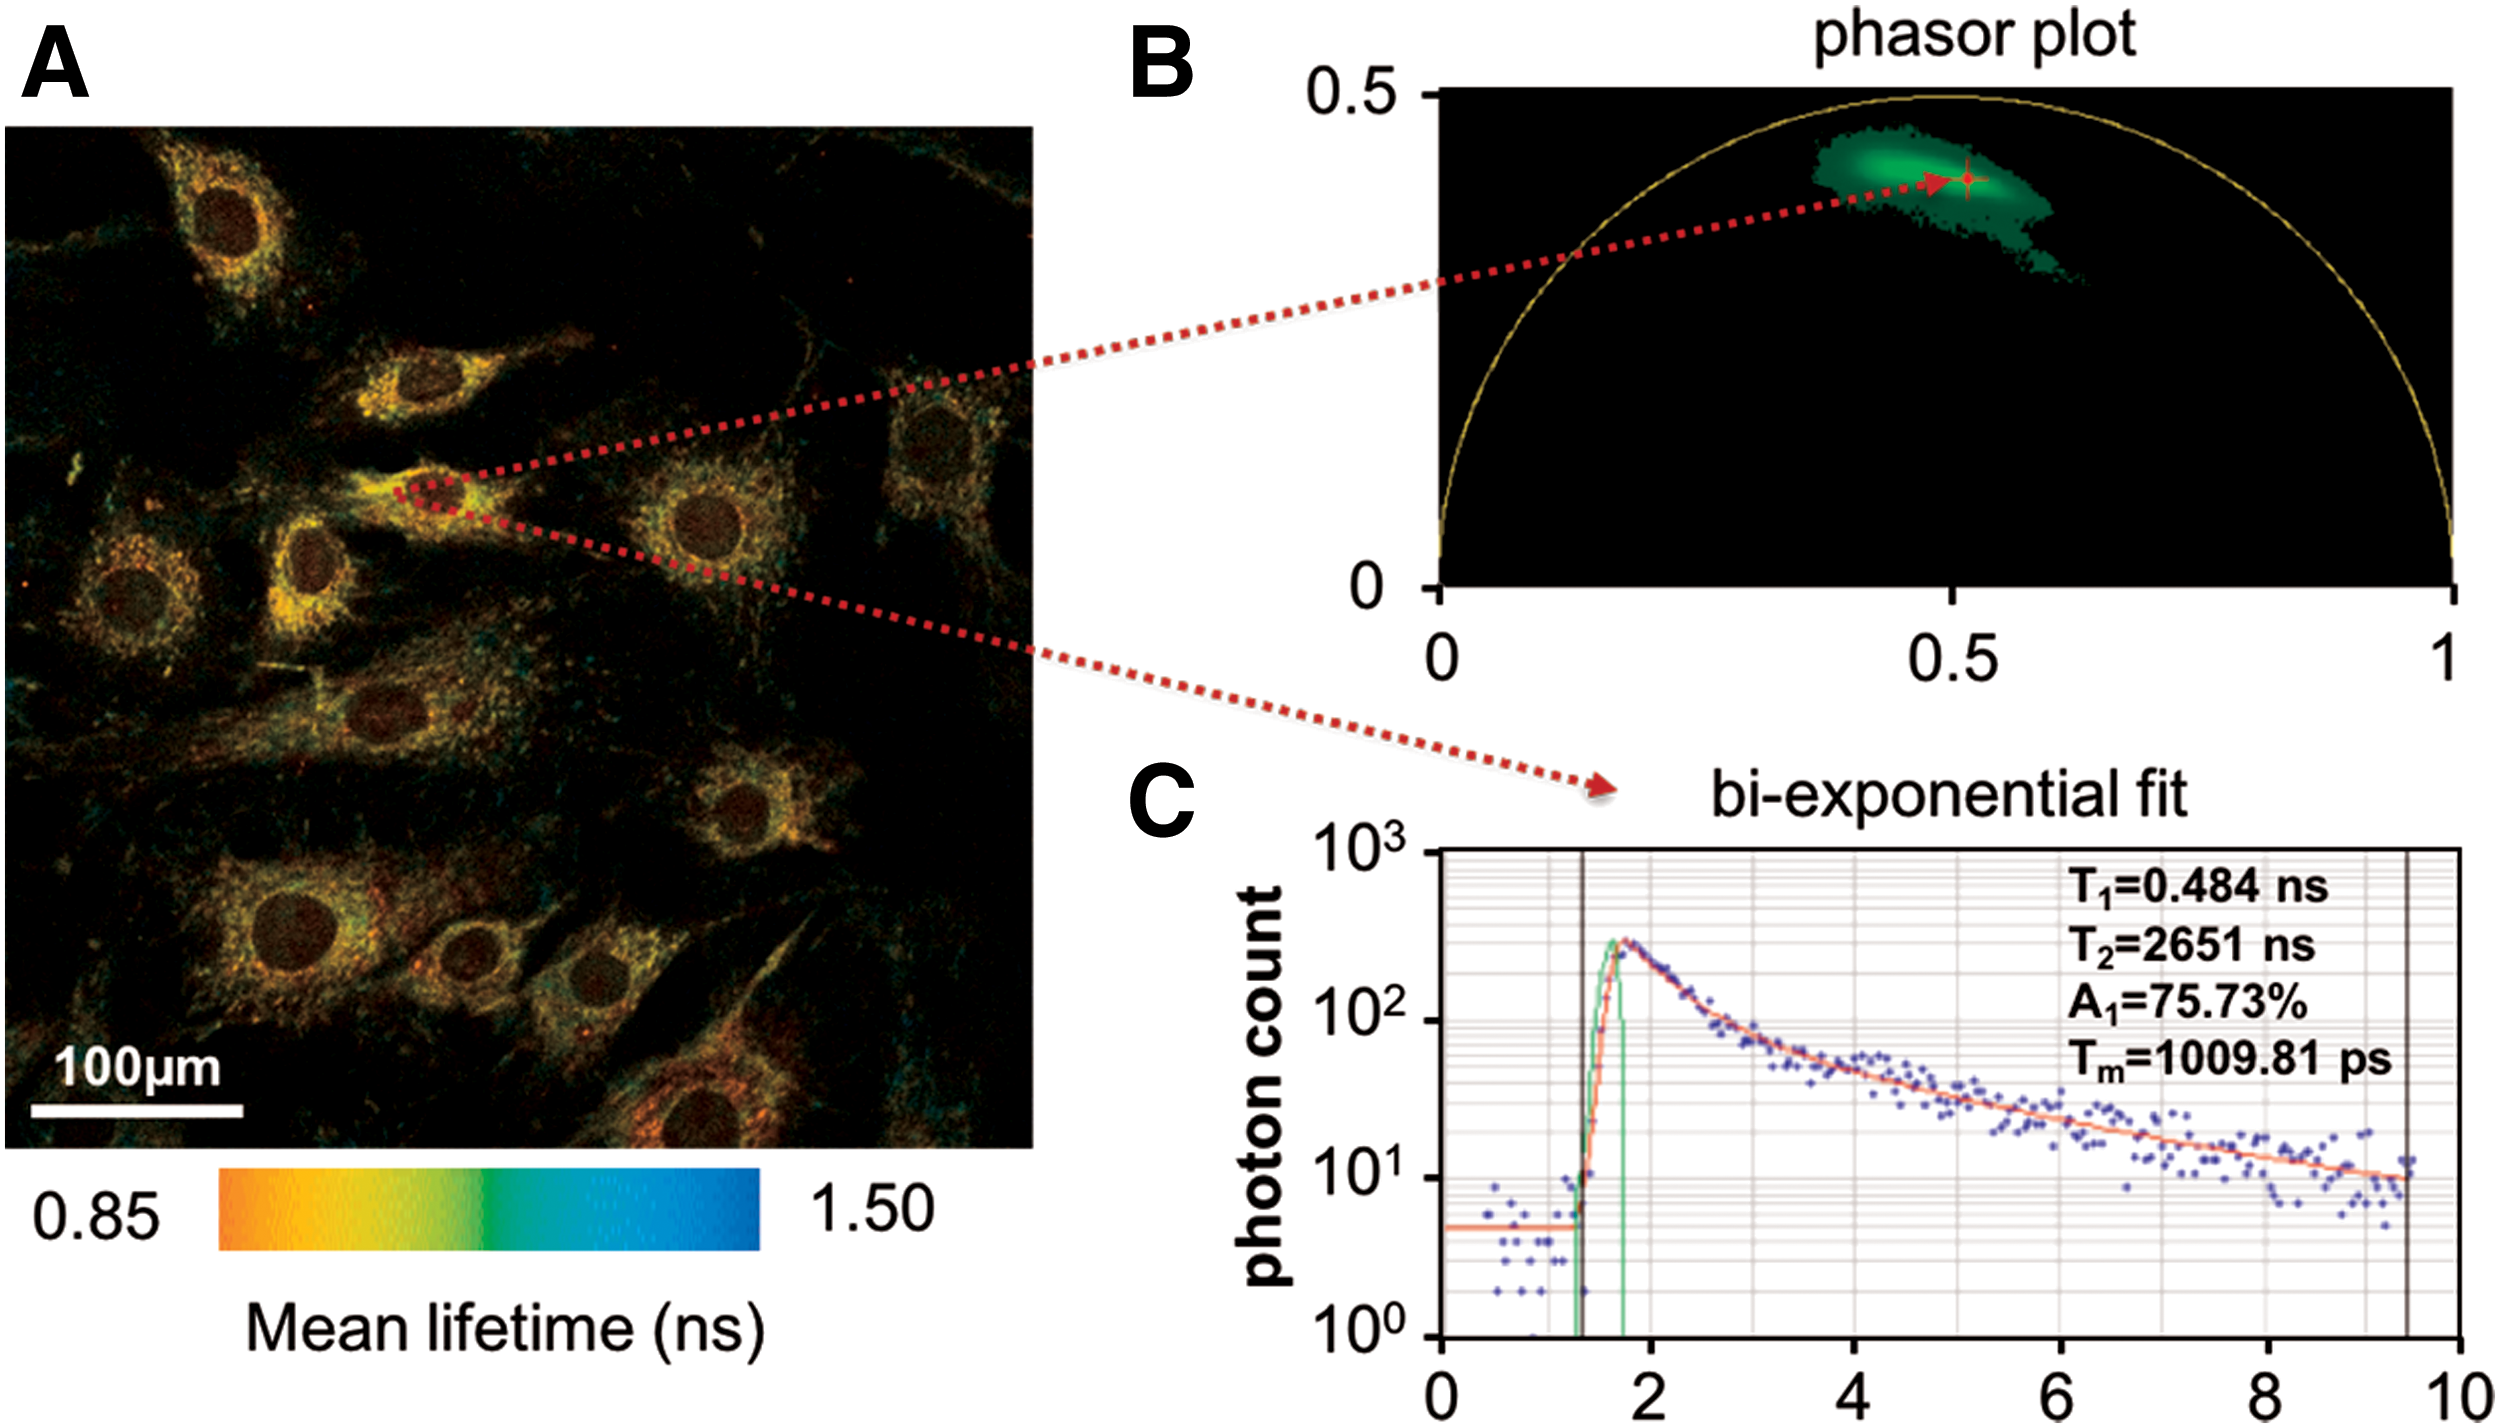
Multiexponential fitting is prone to inaccurate measurements in image regions with low photon counts. To improve accuracy and/or reduce integration time, spatial or temporal binning may be performed (109). Multiexponential fits using more than two lifetime components are rarely used in NAD(P)H imaging due to concerns about the accuracy of the derived model parameters. Biexponential fitting distinguishes solely between free and bound forms of the cofactors, which is sufficient for many investigations into the metabolic state of cells (64). However, this biexponential model does not take into account variations in protein binding, such as differences in NADH interactions with different binding sites on various enzymes. As many groups have shown, the lifetime of bound NADH can vary greatly depending on the particular enzyme it is bound to, so the long lifetime time constant, τ2, is sometimes interpreted as an aggregate measure of all bound NADH lifetimes (10, 88, 98). Multiexponential fitting is often performed using Becker & Hickl's SPCImage software, however, other powerful software packages have emerged, including SLIM Curve (University of Oxford and University of Wisconsin-Madison), FAST (Edinburgh Photonics), and packages available through MATLAB and PicoQuant.
Given the variety of NAD(P)H lifetimes possible through different conformations and protein binding sites, interpretations in the literature of biexponential fits can often stretch beyond the assumption of two components (10, 22, 125, 126). In many applications involving multiple lifetime species, an attractive alternative to the biexponential fitting of NAD(P)H fluorescence lifetimes is phasor analysis, which avoids fitting data to any particular model. In phasor analysis, the lifetime decay data at each pixel are transformed to cosine (G) and sine (S) coordinates represented in a phasor plot (55, 93) (Fig. 1B). Typically, the phasor plot is displayed as a two-dimensional (2D) histogram with counts typically falling within a “universal circle” designated by
Mitochondrial Organization Measurements
In addition to measuring the relative amounts of metabolic cofactors through an optical redox ratio and fluorescence lifetime, mitochondrial organization can be assessed from autofluorescence images. Mitochondria undergo fusion and fission in response to metabolic stress, and mitochondrial morphology is very dynamic depending on the metabolic demands of the cell (79, 116, 127). Because NADH and FAD concentrations are highest in the mitochondria, image analysis techniques can be used to evaluate the extent of mitochondrial clustering using these endogenous signals (16, 17, 51, 71, 75, 123). Mitochondrial clustering can be assessed through a 2D fast Fourier transform of the image. The 2D power spectral density (PSD) of the image is determined from the squared magnitude of the signal and can be reduced to one dimension by radial sampling. The average PSD as a function of spatial frequency can then be evaluated to assess the distribution of different feature sizes within the image.
In a variety of studies, the PSD-frequency curve obtained from NAD(P)H images has been fit to an inverse power law model (51, 71, 75, 123, 124). A power law fit across multiple orders of magnitude would correspond to the statistical properties of a self-similar fractal. However, frequently, fitting occurs over a shorter, predetermined frequency range corresponding to the length scales of mitochondria (71, 123, 124). The power law exponent from the fit can be used as a measure of clustering. Changes in this power law exponent have been detected following precancerous transformations and tissue ischemia (51, 71, 124). An alternative fitting approach identifying the range over which the PSD decays according to an inverse power law has also been used to identify changes in mitochondrial utilization during stem cell differentiation (75). These Fourier-based measurements are prone to errors associated with image features that do not follow a power law, such as nuclei and cell borders; however, preprocessing algorithms have been developed to minimize these effects (123). In addition, mitochondrial clustering within single segmented cells can be computed through more time-consuming autocorrelation calculations (54).
Roles of NAD(P)H and FAD in Cellular Metabolism
Interpretation of NAD(P)H and FAD fluorescence intensities, lifetimes, and organizational outcomes has been variable over the years, in part, due to the many different cell processes that can affect oxidation and reduction during cell metabolism. In general, catabolism brings electron carriers to their reduced form, while oxidative phosphorylation brings them to their oxidized state (104). Glycolysis produces a net two ATP, two pyruvate molecules, and reduces two molecules of NAD+ to NADH (Fig. 2). Pyruvate can then be shuttled into the mitochondria, where it is further broken down by pyruvate dehydrogenase complex (PDHC), producing acetyl CoA. During this process, electrons are transferred first to the autofluorescent FAD molecule bound to LipDH within the PDHC, producing FADH2 (47) (Fig. 2). LipDH serves as an intermediate electron carrier and hands off the electrons to available NAD+, producing NADH within the mitochondria. The acetyl CoA molecules can then enter the tricarboxylic acid (TCA) cycle, which will break down carbon-based molecules to CO2, while producing three NADH for every acetyl CoA (23). During this process, dehydrogenase complexes containing autofluorescent LipDH are also used as electron carriers. Complex I (NADH dehydrogenase) within the ETC oxidizes the NADH produced during catabolism (26) (Fig. 2). Through oxidative phosphorylation, electrons are handed off in a controlled manner to different enzyme complexes that use the energy to pump protons into the intermembrane space of the mitochondria. This process ends with oxygen as the final acceptor of electrons. The proton gradient that is produced between the inner mitochondrial membrane powers ATP production through ATP synthase. This process, involving NADH and FAD electron transfer, provides the most efficient conversion of energy from carbohydrate catabolism to ATP.

In terminally differentiated cells, such as neurons or myocytes, efficient ATP production is valuable, and accordingly, these cells primarily rely on oxidative phosphorylation, producing a high baseline optical redox ratio of FAD/[NAD(P)H+FAD] (93, 96). Events that cause cell hypoxia will drive the redox ratio down as oxidative phosphorylation decreases and glycolysis increases in an effort to produce sufficient ATP. Under anaerobic glycolysis, NADH and pyruvate are converted to NAD+ and lactate through LDH to continue to break down more glucose and produce ATP (Fig. 2). The increase in free cytosolic NADH that occurs with anaerobic glycolysis not only decreases the optical redox ratio but also produces a decrease in the mean NAD(P)H lifetime (88).
Although hypoxia is a potent modulator of the optical properties of metabolic cofactors, glucose catabolism will also increase relative to oxidative phosphorylation during periods of biosynthesis with significant carbon demands. This increase in glycolysis despite the presence of oxygen was first noted by Otto Warburg nearly a century ago in cancer cells (103, 113, 114). Like the effects of hypoxia, the Warburg effect is associated with decreases in both the optical redox ratio and mean NAD(P)H lifetime of cells that have undergone substantial cancerous transformations (8, 66, 67, 83, 88). These optical changes are also observed in any noncancerous cells undergoing an increase in the rate of proliferation in response to disease or injury (50, 74, 104). The process of cellular differentiation also causes significant biosynthetic demands, and de novo fatty acid synthesis in particular will drive the optical redox ratio down (75). NADPH is also involved in biosynthesis and is the limiting factor in proliferation and lipid synthesis (70). Consequently, intracellular NADH concentrations are significantly greater than NADPH in cells undergoing biosynthesis (75). NADPH is also utilized in the maintenance of pools of glutathione, thioredoxin, and peroxiredoxins, which help to create a reductive environment after oxidative damage produced by processes such as inflammation or ischemia (70). Although our understanding of the relative contributions of NADPH, NADH, and FAD to metabolism is still emerging for many cell processes, the optical redox ratio and NAD(P)H fluorescence lifetime generally seem to correspond to changes in the rate of oxidative phosphorylation relative to glucose catabolism.
Applications
NAD(P)H and FAD autofluorescence imaging has been implemented in the study of disease states and tissue development over a wide range of applications since its initial optical characterization in the 1950s. Metabolic monitoring of cells and tissues in cancer, neuroscience, and tissue engineering has provided valuable information on the role metabolism plays in disease progression and tissue homeostasis. Findings in these areas have encouraged further fundamental inquiry of cellular processes and extended investigation into other physiological dysfunctions. Here, the current contribution of optical metabolic imaging (OMI) in each of these areas is presented by focusing on studies completed in the past 5 years.
Cancer
Metabolic monitoring of cancer cells through NAD(P)H and FAD imaging has helped to confirm the tendency of tumor cells to favor glycolytic activity even in the presence of sufficient oxygen, as originally reported by Warburg (114). Since its development in the 1970s, the Chance redox scanner continues to be used and was recently applied in distinguishing normal and non-normal breast tissue biopsies from cancer patients (120). Specifically, an increase in FAD fluorescence was observed in cancerous biopsies, with a 27% higher redox ratio than that of normal breast tissue (120, 121). However, more recent work has shown that breast cancer cell lines expressing (ER+) or lacking (ER−) estrogen receptors exhibit lower optical redox ratios in comparison to normal breast epithelial cells, with ER+ cells having a significantly lower redox ratio than ER− cells based on the redox ratio of FAD/(FAD+NADH) (66). While proliferative tumor cells exhibited a lower redox ratio compared with normal cells in those studies, triple negative breast cancer and melanoma cell lines with increasing metastatic potential will exhibit a higher FAD/(FAD+NADH) redox ratio than other cancer cell lines (2, 52, 97). One study also found a greater ability to shift between oxidative phosphorylation and glycolysis in metastatic cell lines in response to acute hypoxia, as measured through an optical redox ratio (2).
Early fluorescence lifetime studies of normal breast epithelial cells using TPEF imaging by Bird et al. correlated a decrease in the fluorescence lifetime of NADH with a decrease in the optical redox ratio and a decrease in oxygen consumption (8). This in vitro study was followed by further studies of carcinogenesis in vivo describing the decrease in bound NADH lifetime as a potential diagnostic marker of cancer (59, 77, 88). In rat fibrosarcoma W31 cells, lifetime distinctions between normal and cancerous cells were confirmed to be attributed to the changes in the bound state of NADH and FAD, not to changes in pH or refractive index (3). More recently, a clinical study found shorter mean NADH (1.22 ± 0.09 ns) and FAD lifetimes (2.61 ± 0.12 ns) in patient lung cancer samples compared to normal tissue (NADH 1.48 ± 0.06 ns, FAD 2.82 ± 0.11 ns) (112). Based on these findings, the authors proposed a mean lifetime criterion of 1.92 ns using the combined FLIM from NADH and FAD for safe resection assessment by surgeons (112).
The identification of different cell types within tumors is also possible based on metabolic signatures. Macrophages in breast tumors have been linked with cells exhibiting higher FAD fluorescence intensity in comparison with cancerous cells in whole tumors in vivo (98). These tumor-associated macrophages with a high FAD intensity also exhibited a shorter NADH mean lifetime, which is consistent with a glycolytic phenotype (98). Furthermore, fluorescence lifetime has also been used to confirm signaling influencing the Warburg effect (67). Pyruvate dehydrogenase kinase-1 (PDK1) is known to be a direct target of Wnt/β-catenin signaling that inhibits the flux of pyruvate to mitochondrial respiration. Phasor analysis of lifetime indicated a shift from bound to free NADH with PDK1 overexpression when Wnt signaling was impaired (67). A separate study demonstrated the dependence of the redox state of colon cancer tumors on p53 (118). HCT117 p53−/− colon cancer tumors were more oxidized in comparison with tumors with wild-type p53 present. p53-negative tumors also became increasingly oxidized as tumor size increased (118). In addition, the absence of PTEN has been linked to increased oxidative activity and metabolic heterogeneity in pancreatic premalignant lesions (119). The pancreas of PTEN-null mice (pdx1-Cre; PTENlox/lox) exhibited a higher redox ratio in comparison to controls (PTENlox/lox) when tissue depth-dependent changes in redox were taken into account (119).
TPEF-based NAD(P)H imaging has been used to study a number of different 3D in vitro models of cancer, which demonstrate a Warburg-like glycolytic phenotype. The rate of glycolysis in 3D engineered precancerous epithelial tissue equivalents composed of human foreskin keratinocytes (HFKs) was directly linked with their optical redox ratio and the relative concentrations of NADH, NAD+, and FAD (105). Human papillomavirus (HPV) 16-immortalized cells produced a lower optical redox ratio (0.45–0.5) compared to control tissue (0.55–0.6), while interestingly, the overexpression of the E7 oncoprotein in HFKs produced a higher optical redox ratio than normal HFKs. Low-oxygen conditions also lowered the redox ratio in those studies (105).
In evaluating treatment efficacy, organoids may be cultured and used as surrogates for in vivo head, neck, pancreatic ductal adenocarcinomas, as well as various breast cancer subtypes. A decrease in NAD(P)H fluorescence lifetime in these organoid models is consistent with in vivo responses to treatment with anticancer drugs cetuximab, cisplatin, and combination treatments for head and neck cancers, as well as combination treatments of trastuzumab and cisplatin for ER−breast cancer (86). An OMI index has been proposed as a sensitive metric to therapy responses and can be obtained by linearly combining the average redox ratio and NAD(P)H and FAD lifetimes (86, 106 –108, 110). The OMI is correlated with cell proliferation and death after anticancer drug treatment (106, 108), can distinguish between breast cancer subtypes (107, 110), and is able to evaluate therapy responses after only 1 day (86, 106).
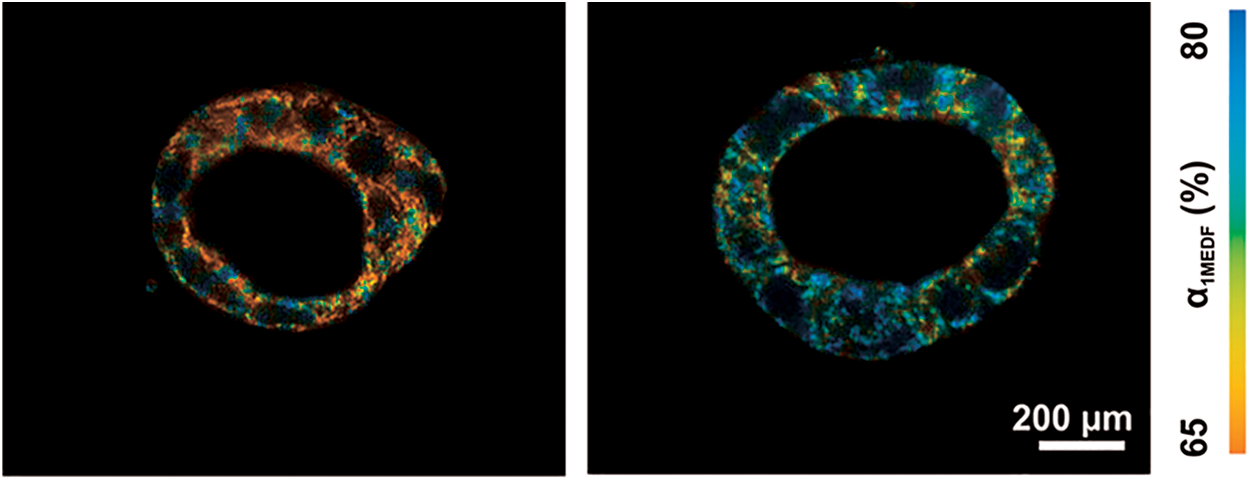
Both multiexponential fitting and phasor analysis have been used to evaluate NADH lifetimes in a recent study using 3D in vitro models of colorectal cancer (48). The sensitivity of their lifetime system was validated through potassium cyanide and hydrogen peroxide manipulations of oxidative phosphorylation, and found that NADH lifetime was also sensitive to increases in epidermal growth factor, which is known to induce cell proliferation and large cyst formation (48) (Fig. 3). Due to the general consistency in demonstrating the Warburg effect with lower redox ratios and shorter NAD(P)H fluorescence lifetimes representative of increased glucose catabolism across cancer types and models (Table 2), autofluorescence imaging offers promise as a high-throughput preclinical research tool.
Summary of Optical Changes Reported Across Applications
Neuroscience
While cell metabolism does not substantially differ in brain cells as in other cell types in the body, metabolism is specially regulated by glial cells, and metabolites play a double role as both signaling molecules and fuel (4, 81). The subcellular mechanisms involved in metabolic regulation are not fully understood, but noninvasive monitoring of metabolism has helped to elucidate previously unknown interactions through colocalization studies and the identification of unique NAD(P)H lifetime components.
NAD(P)H levels in the endoplasmic reticulum (ER) have been shown to be coupled to mitochondrial changes in substantia nigra dopaminergic neurons in rats (101). An increase in NAD(P)H fluorescence was observed in both mitochondria and the ER on mitochondrial uncoupling and disruption of the ETC. Mitochondria may communicate with the ER via a “pyridine nucleotide redox wire,” which can then influence the ER's redox state as a method of dealing with redox stress. This may allow mitochondria to influence cellular cholesterol synthesis as well as the unfolded protein response, which can trigger apoptotic pathways via regulation of Ca2+ (101). Cultured neurons and astrocytes were shown to be affected differently by manganese treatment, which can simulate conditions associated with Parkinson's disease (96). In that study, low redox ratios were associated with healthy glycolytic astrocytes, and high redox ratios were associated with healthy neurons that rely primarily on oxidative phosphorylation. Manganese-treated neurons displayed an increase in both the redox ratio and bound NADH lifetime components, as well as an increase in caspase-3, indicative of increased apoptosis. On the contrary, treated astrocytes displayed an increase in the redox ratio and a decrease in the bound NADH lifetime (96). These findings are consistent with the glycolytic phenotype of glial cells and the reliance of neurons on oxidative phosphorylation.
Brain tissue oxygenation is extremely important in metabolic regulation, and astrocytes will change their mode of metabolism in response to oxygen levels, among other stimuli (30, 91). Use of an optical redox ratio in these in vivo studies has been very challenging due to the putative influence of hemoglobin absorption. Pericytes are crucial to the maintaining of oxygen levels that are sufficient for neuronal functional activity, with dysfunction contributing to reduced cerebral blood flow (44). In mice expressing loss-of-function, pericyte-deficient, platelet-derived growth factor receptor-β (Pdgfrb+/−), an increase in NADH fluorescence coincided with 28% lower lactate levels in comparison to healthy mice on hind limb stimulation. This could be explained by an increase in the use of astrocyte-produced lactate by neurons under low oxygenation (44). In addition, regional oxygenation of neural networks in the brain has been revealed to be dependent on aquaporin-4 (AQP4), which is the primary water channel located at the boundaries of the brain–blood and brain–cerebral spinal fluid barriers (99). Severe metabolic stress, such as induction of cortical spreading depression (CSD), can cause a loss of AQP4 function. CSD-affected areas had increases in NADH fluorescence only in hypoxic regions away from vasculature. This change in NADH fluorescence was greatest at the induction of CSD and but lasted longer in AQP4-deficient mice post-CSD (99).
Determining the binding state of NAD(P)H through fluorescence lifetime measurements is of particular interest in neuroscience, because it can provide metabolic information without potential hemodynamic artifacts. Four lifetime components were identified during the first TPEF-based NADH lifetime measurements of the rat cortex in vivo (125). These components could indicate specific oxidative phosphorylation pathways and were shown to differ between astrocytes, blood vessels, and synaptically dense regions. The four components were identified using a multiexponential fit, with two lifetimes constrained to a reference NADH solution (0.395 and 1 ns) and two obtained experimentally in vivo (1.7, 3.2 ns). Each of the components saw an increase in lifetime after a period of anoxia, with the shortest component showing the most dramatic increase. The third and fourth components are thought to be bound to mitochondrial enzymes, however, these two components are strongly detected in blood vessels (125). Further classification of these components in vivo indicated the possibility of identifying interactions among impaired metabolic processes (126).
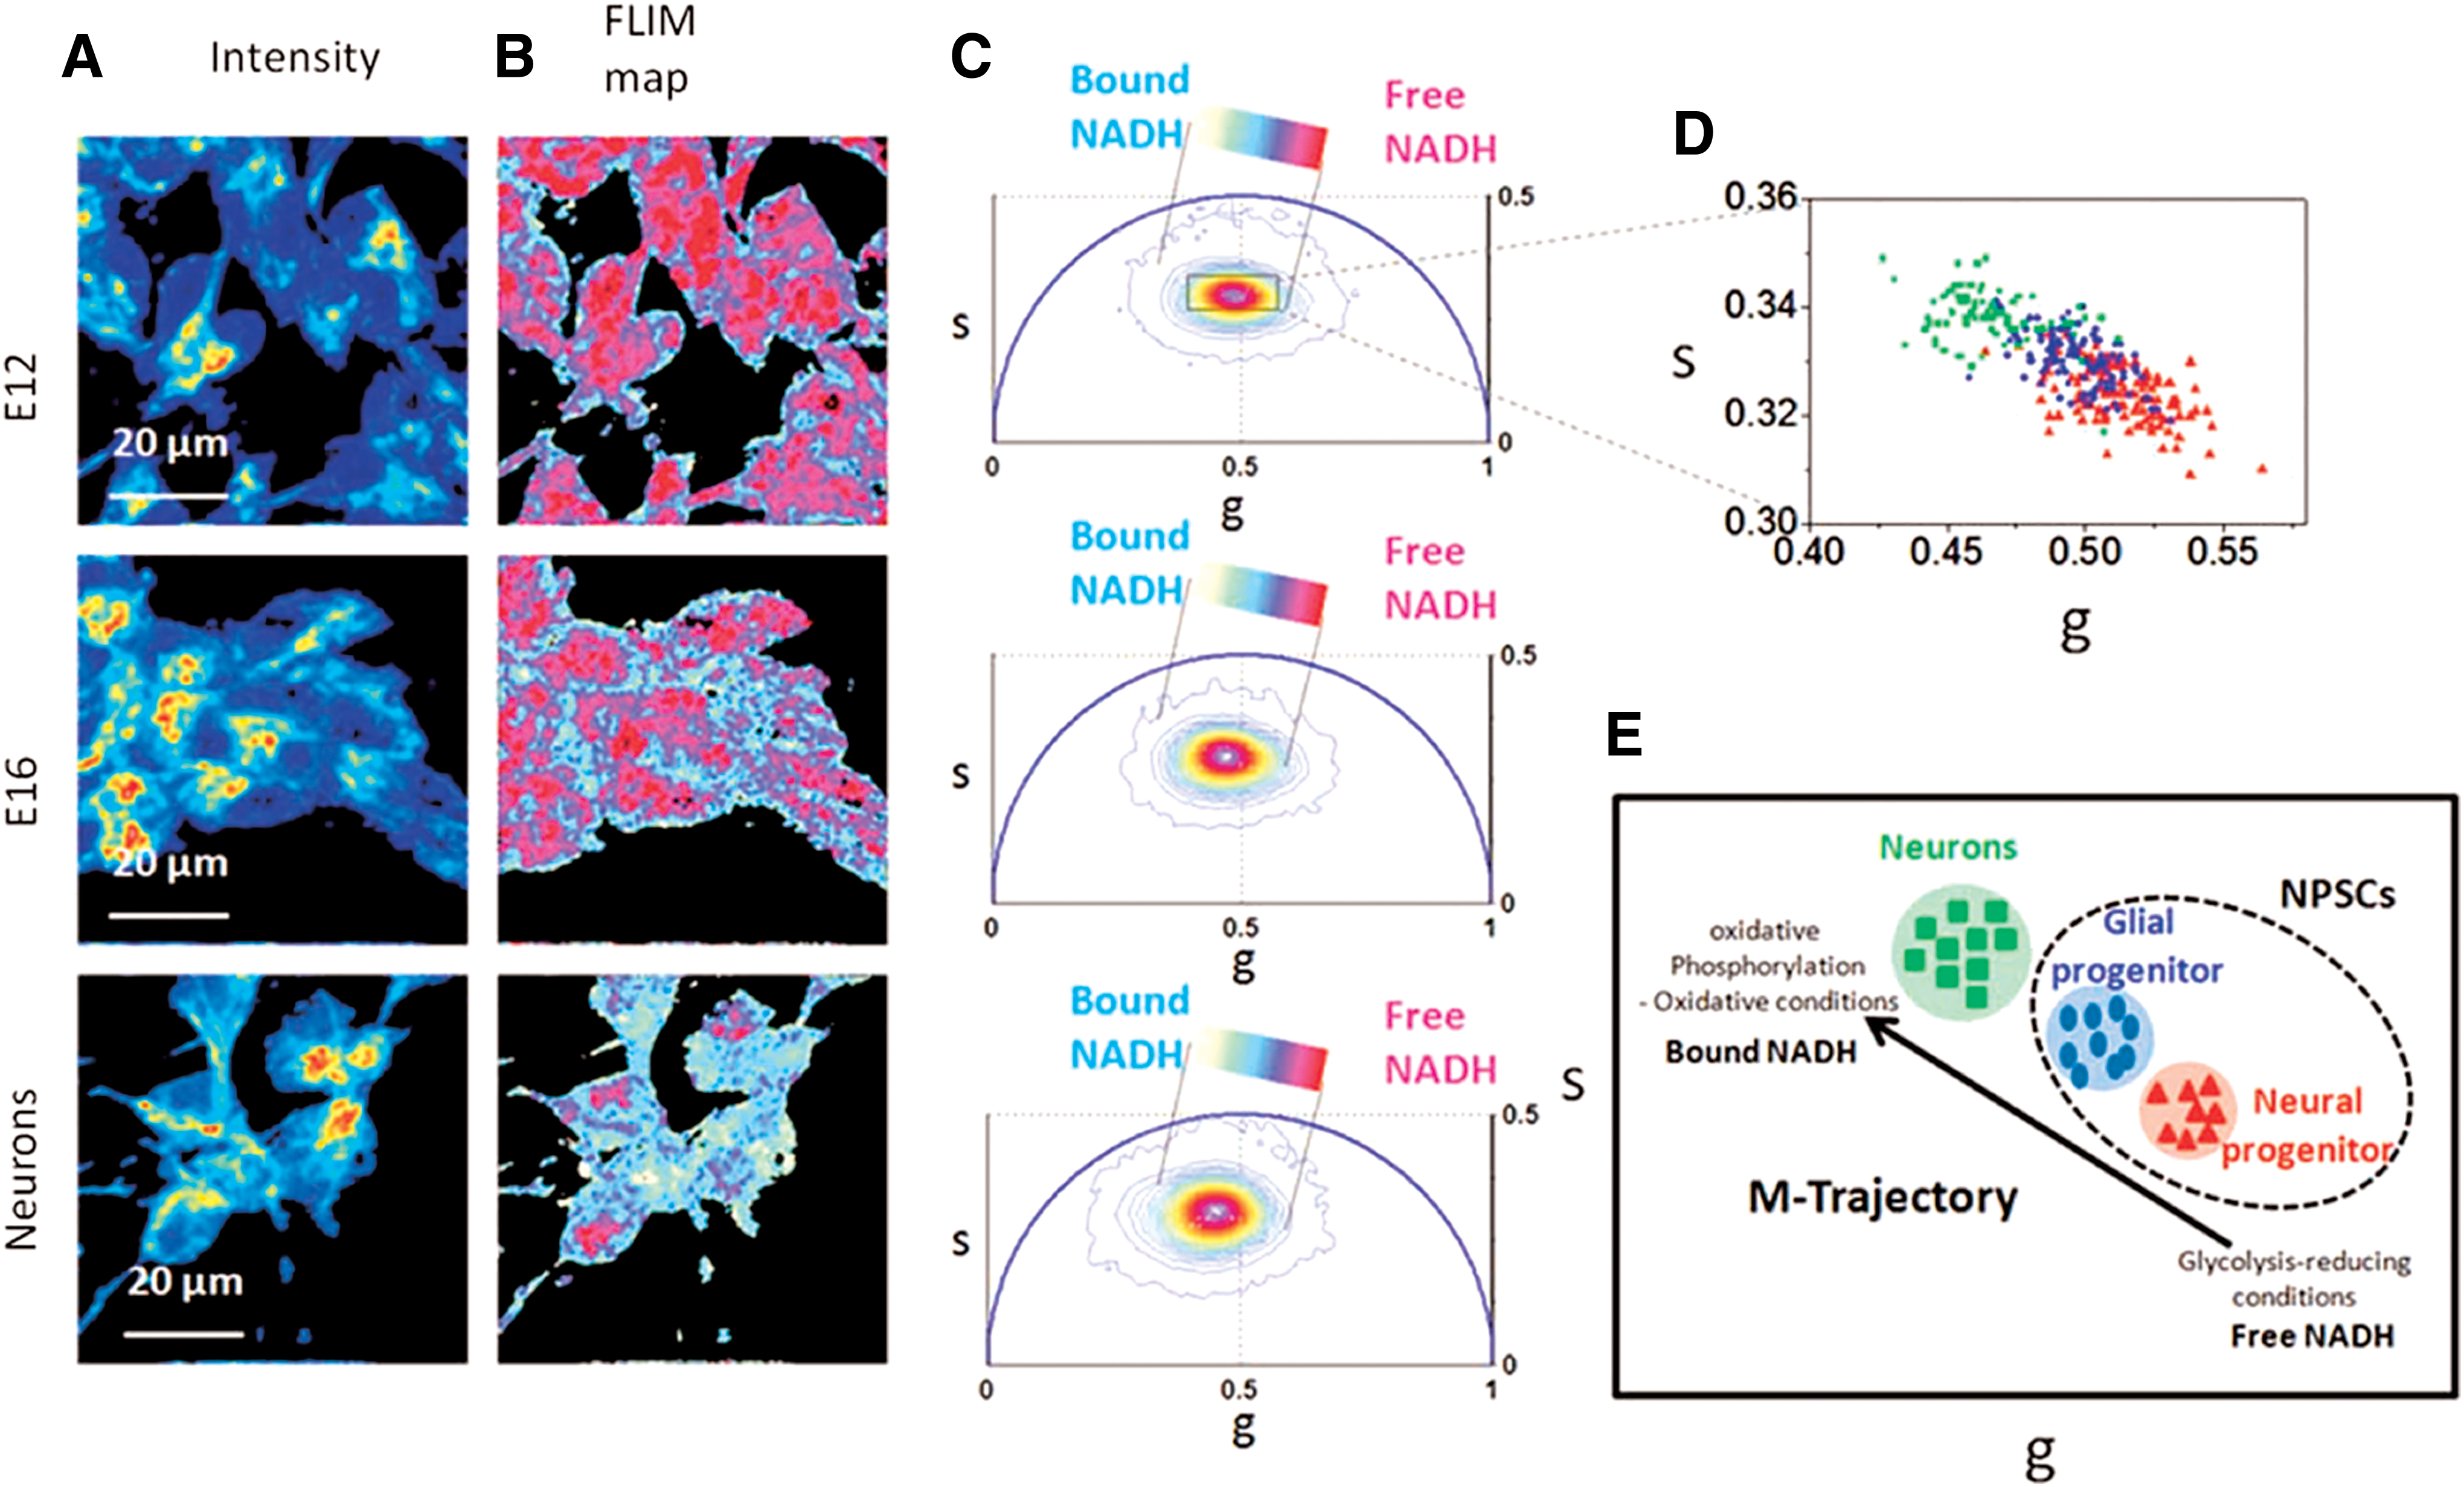
NAD(P)H FLIM methods have also been used in monitoring the differentiation of progenitor cells toward neurons (Fig. 4). The ratio of free to bound NADH can distinguish cell fate decided in the E12 and E16 developmental stages in neural cells, which is not possible based solely on cell morphology or marker expression (94). During the E12 phase, neural progenitors have a higher free to bound NADH ratio and a shift toward glycolytic activity. In comparison, E16 has a lower free to bound NADH ratio, indicating a shift toward oxidative phosphorylation, and is descriptive of glial progenitors. In addition, differentiated neurons also can be distinguished from neural progenitor stem cells based on their reliance on oxidative phosphorylation (94). For both developmental and functional studies in neuroscience, NAD(P)H FLIM continues to emerge as a promising tool to understand metabolism.
Tissue engineering and stem cell differentiation
The analysis of tissue-engineered constructs during development and before implantation is important in optimizing culture protocols and determining their viability for eventual use in humans. Traditional methods of determining viability, such as biochemical assays or histology, either lack any spatial resolution or are inherently destructive. Optical characterization of metabolic state within these constructs is an attractive method analysis due to nondestructive nature (19, 72).
The viability of an ex vivo produced oral mucosa equivalent (EVPOME) that is used in intraoral grafting was assessed using an optical redox ratio and FLIM (19, 20). Thermal or metabolic stress was induced in EVPOMEs to characterize the ability of NAD(P)H and FAD fluorescence imaging to detect nonviable samples. Both stressed constructs exhibited higher redox ratios compared to controls, with thermally stressed constructs having a greater bound NAD(P)H lifetime component (19). The authors suggested a redox ratio of 0.23 and a short lifetime component contribution (parameter A1) of 0.28 may be potential thresholds for discriminating thermally stressed constructs from controls.
Other studies have evaluated the differentiation status of cells within 3D adipose tissue constructs (18, 72, 115). Human adipose-derived stem cells seeded within a silk scaffold were continuously monitored over 6 months, exhibiting a decrease of ∼0.1 in the optical redox ratio over the first 2 months of culture, then returning to baseline redox ratio values over the final 4 months (72). In that study, a link between lipogenesis and the decrease in optical redox ratio was proposed, and follow-up work by the same authors later confirmed that the decrease in optical redox ratio during adipogenic differentiation is sensitive to the increased biosynthetic demands of de novo fatty acid synthesis (75) (Fig. 5). Additional follow-up studies demonstrated an ability to use an optical redox ratio to monitor 3D adipogenic culture status in a perfusion bioreactor (115), as well as monitor lipid droplet formation using a combination of TPEF and third-harmonic generation imaging (18). In addition to adipogenic differentiation, studies have reported decreases of varying magnitude in the optical redox ratio during osteogenic and chondrogenic differentiation (29, 60, 61, 75, 78). Interestingly, an elevated contribution of bound NADH was also reported in osteogenic cultures relative to undifferentiated stem cells and chondrogenic cultures (60).

Stem cell differentiation has also been monitored in vivo using NAD(P)H lifetime imaging (34, 92, 93). A decrease of free to bound NADH ratio was observed in the small intestine of mice, extending as a gradient from the base of the crypt to the top of villi (93). This decrease in free NADH is associated with a decrease in glycolytic metabolism of epithelial stem cells undergoing differentiation, following the same path from crypt to villi. In vivo monitoring of mouse and rat kidneys revealed that S1 and S2 tubules have distinct metabolic FLIM phasor signatures, with S1 tubules leaning toward free NADH and S2 toward bound NADH (34). In addition, phasor analysis revealed a shift toward bound NADH in the urinary lumen, more free NADH in the interstitium, and a glomerulus signature that was similar to tubules (34). The effect of the circadian clock on mouse epidermal basal layer stem cells was also studied in vivo (95). An increase in the free to bound NADH ratio at night indicated a shift to glycolytic activity. This coincided with an increase in the number of stem cells in S phase and is thought to be a mechanism for avoidance of DNA damage during the most vulnerable point in the cell cycle (95).
Collectively, these in vivo and in vitro studies in a variety of cell types demonstrate transient changes in the redox ratio and lifetime outcomes occurring during stem cell differentiation (Table 2). The observed changes during the process of differentiation generally indicate a sensitivity to increased glucose catabolism to satisfy the carbon requirements of macromolecule biosynthesis.
Other biomedical applications
While the majority of NAD(P)H imaging has focused on cancer, neuroscience, and tissue engineering research, the metabolic effects of other diseases and repair processes have been studied through these imaging techniques (Table 2).
FLIM showed, for the first time, the metabolic changes induced by the hepatitis C virus (HCV) in human hepatoma cells (Huh 7) (58). Cells were transfected with the core D2 protein from HCV, which upregulates lipid biosynthesis and the production of lipid droplets necessary for pathogenesis. D2-expressing cells had a lower average NAD(P)H lifetime, a decrease in free and bound NAD(P)H lifetimes, and a threefold increase in the ratio of free to bound NAD(P)H in comparison to nonexpressing cells (58).
FLIM also was utilized to characterize Huntington disease, a neurodegenerative disorder that is marked by expansion of glutamine repeats in exon 1 of the Huntingtin (HTT) protein and results in metabolic impairment (80). While conflicting reports exist regarding the metabolic changes associated with Huntington disease, researchers demonstrated a shift toward free NADH accompanied by a higher free to bound ratio of NADH in the nucleus of HEK293 cells and transgenic Drosophila, expressing expanded HTT exon1. This suggests a possible relationship between metabolic dysfunction and transcriptional regulation in Huntington disease (80).
Metabolic imaging has shown promise in understanding and detecting cardiovascular disease. Calorie restriction has been studied in relation to aging and has a protective effect against myocardial ischemia (111). The Chance redox scanner was utilized to obtain a 3D metabolic map of rat hearts to determine the effect of normal feeding or fasting conditions on bioenergetics (122). Fasting produced a homogeneous decrease in NADH by 28.6% with an increase in the optical redox ratio (∼0.474) in comparison to normal feeding (∼0.44) (122), consistent with a reduction in glucose catabolism relative to oxidative phosphorylation. Recently, valvular interstitial cell imaging revealed that a lower redox ratio is correlated with increased contractility and proliferation, which may provide an early marker of valve disease progression (50). A higher optical redox ratio in infarcted regions of the heart has also been reported with differences in infarct metabolism between fetal and preadolescent sheep (89). Insights into proregenerative metabolic phenotypes after myocardial infarction through TPEF, particularly in combination with second-harmonic generation (SHG) imaging of collagen, could contribute to the evaluation of treatments restoring function to damaged heart regions.
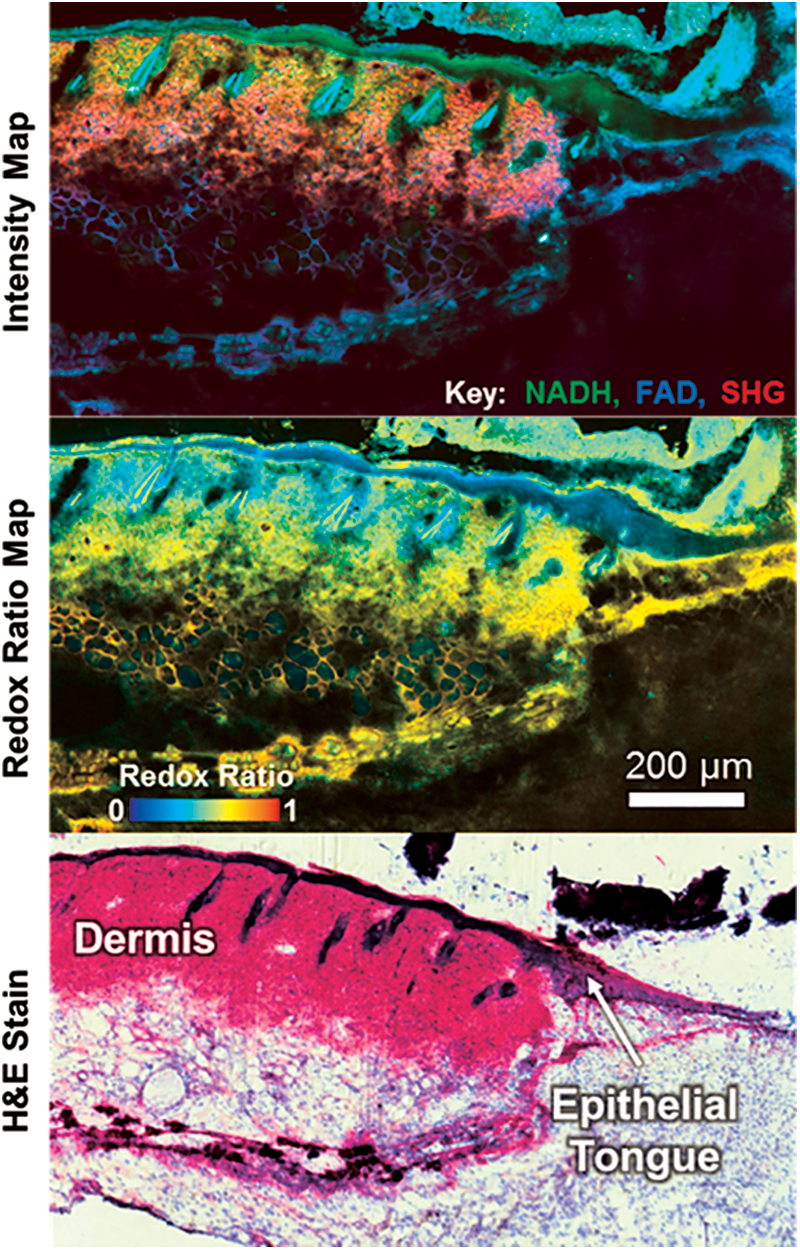
Monitoring tissue repair and regeneration through NAD(P)H imaging is not just limited to cardiac applications. Recent work has also demonstrated distinct temporal and spatial patterns of skin wound healing through TPEF and SHG imaging (Fig. 6) (43, 73). An overall lower redox ratio was found in the proliferative epidermis at the wound edge (0.559 ± 0.058) compared to noninjured regions (0.678 ± 0.024), and delayed healing in diabetic wounds was evident by a significantly lower redox ratio in the epidermis at later postwound time points (74). Furthermore, an overall lower redox ratio was observed in diabetic mice relative to controls, and these findings suggest the potential for optical biomarkers of impaired healing in diabetic wounds.
An optical redox ratio may also have broader applications in evaluating treatments for diabetes. In the liver, a decrease in the optical redox ratio was observed in diabetic rats relative to normal controls, and this lower redox ratio was correlated with increased levels of glutathione, which is indicative of increased oxidative stress (1). Mulberry-mediated gold nanoparticles (MAuNPs) were administered to diabetic rats, and this treatment resulted in an increase in the redox ratio and restoration of glutathione levels, suggesting MAuNPs are effective in reversing diabetes progression as an antioxidant (1). A novel “oxidative stress axis” has also been proposed based on FLIM phasor analysis of oxidative stress that identified a unique long lifetime component thought to be a product of lipid oxidation (22). Collectively, this range of applications spanning different disease states or tissue repair processes highlights the broad sensitivity of the optical redox ratio and NAD(P)H imaging to changes in cellular function.
Conclusions and Future Outlook
This review demonstrates that an optical redox ratio of FAD/[NAD(P)H+FAD] autofluorescence intensity can be a useful metric to noninvasively assess metabolic and functional cellular changes across a broad spectrum of biomedical applications. NAD(P)H fluorescence imaging techniques were initially used to monitor hypoxia and cancer development, and since then, new research avenues utilizing these methods in tissue engineering and regenerative medicine have shown great promise.
In the applications surveyed, a great variety of lenses, filter sets, laser power and wavelengths, normalization techniques, experimental conditions, and summary statistics were used in reporting NAD(P)H fluorescence measurements. This lack of standardization within the field currently makes direct comparisons among studies and cell/tissue types challenging. However, the redox ratio has generally demonstrated a sensitivity to the relative balance between oxidative phosphorylation and glucose catabolism (Fig. 2). Specifically, decreases in the redox ratio have been reported for cells undergoing significant biosynthetic demands that require increased glucose catabolism, or conditions such as hypoxia in which oxidative phosphorylation is inhibited. The increased use of NAD(P)H fluorescence lifetime measurements over the last 5–10 years has revealed a similar sensitivity, with a decrease in mean lifetime corresponding to a number of conditions involving an increase in glycolysis or decrease in oxygen tension.
As research involving NAD(P)H imaging increases and expands to new in vivo applications, accounting for additional intrinsic chromophores will be a critical challenge. Depth-resolved imaging techniques, such as TPEF, can be used to image epithelia in vivo with minimal concerns for artifacts produced by the underlying blood flow or stromal matrix autofluorescence. However, for imaging of well-perfused tissues, such as the brain, FLIM may be the only suitable NAD(P)H imaging approach. The potential wealth of information available through these time-resolved fluorescence measurements, including the ability to discriminate NAD(P)H protein binding changes within cells, could be very powerful. However, a better understanding of the limitations and potential of current FLIM analysis approaches is needed. Furthermore, a systematic evaluation of how different experimental conditions can affect these readouts is necessary. Future work is also needed to robustly evaluate whether the optical redox ratio, fluorescence lifetime, and mitochondrial organization measurements offer truly complementary information or can generally serve as alternative metrics of the same metabolic phenomena. In summary, it is expected that continued improvements to the instrumentation and analysis involved in NAD(P)H and FAD autofluorescence imaging will allow for impactful advances in basic science, preclinical research, and the clinical management of disease.