
Abstract
Since mitochondrial dysfunction is associated with NOD-like receptor family protein 3 (NLRP3) activation in type 2 diabetes (T2D), which can eventually lead to an impaired immune response, we set out to determine if glycemic control modulates the effects of T2D on the NLRP3 inflammasome. We have studied leukocytes from 61 diabetic patients [25 with glycated hemoglobin (HbA1c) ≤7% and 36 with HbA1c ≥8%] and 40 healthy controls. Total and mitochondrial reactive oxygen species (ROS) production was enhanced in T2D patients, and mitochondrial ROS was more pronounced in those with poor glycemic control. Levels of gene and protein expression of NLRP3 were decreased in both diabetic groups and more so in those with HbA1c ≥8%. In addition, there was a decrease in gene expression and serum concentrations of interleukin (IL)-1β, IL-12, and caspase-1 in line with inhibition of the NLRP3 inflammasome. Our data also suggest negative correlations between HbA1c levels and NLRP3 protein expression, serum levels of IL-12 and IL-1β, and caspase-1 messenger RNA expression. Our findings lead us to raise the hypothesis of an association between poor glycemic control in T2D and an impairment of the NLRP3 inflammasome, suggesting that glycemic control plays an important role in the immune response of diabetic subjects.
Introduction
T
There is clear evidence that the immune system plays a key role in the pathogenesis of T2D. T2D involves key mechanisms such as oxidative stress, proinflammatory cytokine release, Toll-like receptor expression, and alterations of the inflammasome. Inflammatory mediators such as interleukin (IL)-1β and IL-18 promote initiation and progression of metabolic diseases by activating the NOD-like receptor family protein 3 (NLRP3) inflammasome, which is involved in a large number of metabolic diseases (1).
NLRP3 is a multiprotein complex comprising the NLR scaffold protein, caspase recruitment domain (CARD), speck-like protein containing CARD, and procaspase-1. This complex, which is normally inactive, can be activated by nuclear factor-kappa B or by pathogen- and damage-associated molecular patterns. When activated, NLRP3 promotes caspase-1 activation by autocatalytic cleavage of procaspase-1, which leads to IL-1β maturation and secretion.
A review of the bibliography reveals discrepancies when looking at possible associations between the NLRP3 inflammasome response and T2D or hyperglycemia conditions. On the one hand, IL-1β production by macrophages and pancreatic islets is increased by high-glucose concentrations in vivo (4). On the other hand, Kousathana et al. (3) demonstrated a decrease of IL-1β levels in T2D patients. Either way, the mechanism by which IL-1β acts in T2D is yet to be determined.
Type 2 diabetes (T2D) is related to mitochondrial dysfunction and modification of the redox state, which leads to impairment of the immune response. The role played by glycemic control has not yet been fully understood. The present study not only confirms that the glycemic state can modulate mitochondrial reactive oxygen species (ROS) production but also suggests that it has a key role in NOD-like receptor family protein 3 (NLRP3) inflammasome activation in leukocytes of T2D patients (poorly controlled patients show enhanced levels of mitochondrial ROS and decreased expression levels of NLRP3, interleukin (IL)-1β, IL-12, IL-18, and caspase-1). Therefore, ensuring glycemic control in T2D patients could improve the mitochondrial function and NLRP3 inflammasome response of their leukocytes and therefore maintain an adequate immune response.
Mitochondrial impairment and enhanced levels of reactive oxygen species (ROS) have been widely related to T2D (2), especially when T2D patients present poor glycemic control (6). ROS production is essential for inflammasome activation and therefore for the inflammatory response. Furthermore, an adequate control of glycemia is key to preventing complications associated with T2D. In this sense, we have demonstrated that poor glycemic control is associated with development of endoplasmic reticulum stress and leukocyte–endothelium interactions (2, 6). However, knowledge about the possible influence of glycemic control on activation of NLRP3 inflammasome is scarce.
To shed light on a potential involvement of glycemic control in oxidative stress and NLRP3 inflammasome activation, we have evaluated total and mitochondrial ROS production as well as expression levels of the principal NLRP3 markers in nonstimulated leukocytes from control subjects and T2D patients.
Results
Anthropometric and biochemical parameters
Our cohort of patients comprised 61 type 2 diabetic patients [25 with glycated hemoglobin (HbA1c) levels ≤7% and 36 with HbA1c ≥8%] and 40 healthy subjects. Anthropometric and metabolic characteristics of the study population are shown in Table 1. We observed significant differences in weight, body–mass index (BMI), and waist circumference, all of which were higher in diabetic patients than in control subjects (p < 0.001). T2D patients (both groups) also showed differences in glucose metabolism—augmented levels of fasting glucose, insulin, homeostasis model assessment of insulin resistance (HOMA-IR) index, and HbA1c (p < 0.001) with respect to the control group.
Anthropometric and Metabolic Parameters and Pharmacological Treatment of the Study Population
Values are expressed as mean ± standard deviation for parametric data and as median (25th and 75th percentiles) for nonparametric data. The three groups were compared with one-way analysis of variance (and Student–Newman–Keuls post hoc test) or Kruskal–Wallis test (and Dunn's multiple comparison post hoc test) for parametric and nonparametric data, respectively. Analysis of covariance was performed with a univariate general linear model using BMI as a covariate. * p < 0.05; ** p < 0.01; and *** p < 0.001 with respect to control, # p < 0.05 and ### p < 0.01 with respect to T2D with HbA1c ≤7%.
BMI, body–mass index; DPP-4, dipeptidyl peptidase 4; GLP-1, glucagon-like peptide; HbA1c, glycated hemoglobin; HDL-c, high-density lipoprotein cholesterol; HOMA-IR, homeostasis model assessment of insulin resistance; hs-CRP, high-sensitivity C-reactive protein; LDL-c, low-density lipoprotein cholesterol; ns, non-significant; T2D, type 2 diabetes; TC, total cholesterol; TGs, triglycerides.
When we analyzed the lipid profile, we found lower levels of total cholesterol (TC) (p < 0.05 only for the HbA1c ≤7 group), high-density lipoprotein cholesterol (HDL-c) (p < 0.001), and low-density lipoprotein cholesterol (LDL-c) (p < 0.05) and higher levels of triglycerides (TGs) (p < 0.001) in both T2D groups, while high-sensitivity C-reactive protein (hs-CRP) was enhanced in those with poor glycemic control (p < 0.01) compared to controls.
Since diabetic patients showed higher BMI than controls, the data were adjusted for BMI, but statistical differences remained. When we explored differences between T2D patients due to glycemic control, we obtained statistical differences in glucose metabolism, but not in the lipid profile, with augmented levels of fasting glucose (p < 0.001), insulin (p < 0.05), HOMA-IR index (p < 0.001), and HbA1c (p < 0.001) in the group with poor glycemic control with respect to well-controlled diabetic patients. Statistical differences remained when the analysis was adjusted for BMI.
To study the impact of pharmacological treatment on the results, we compared proportions of patients treated with different drugs. No statistical differences were found between diabetic groups.
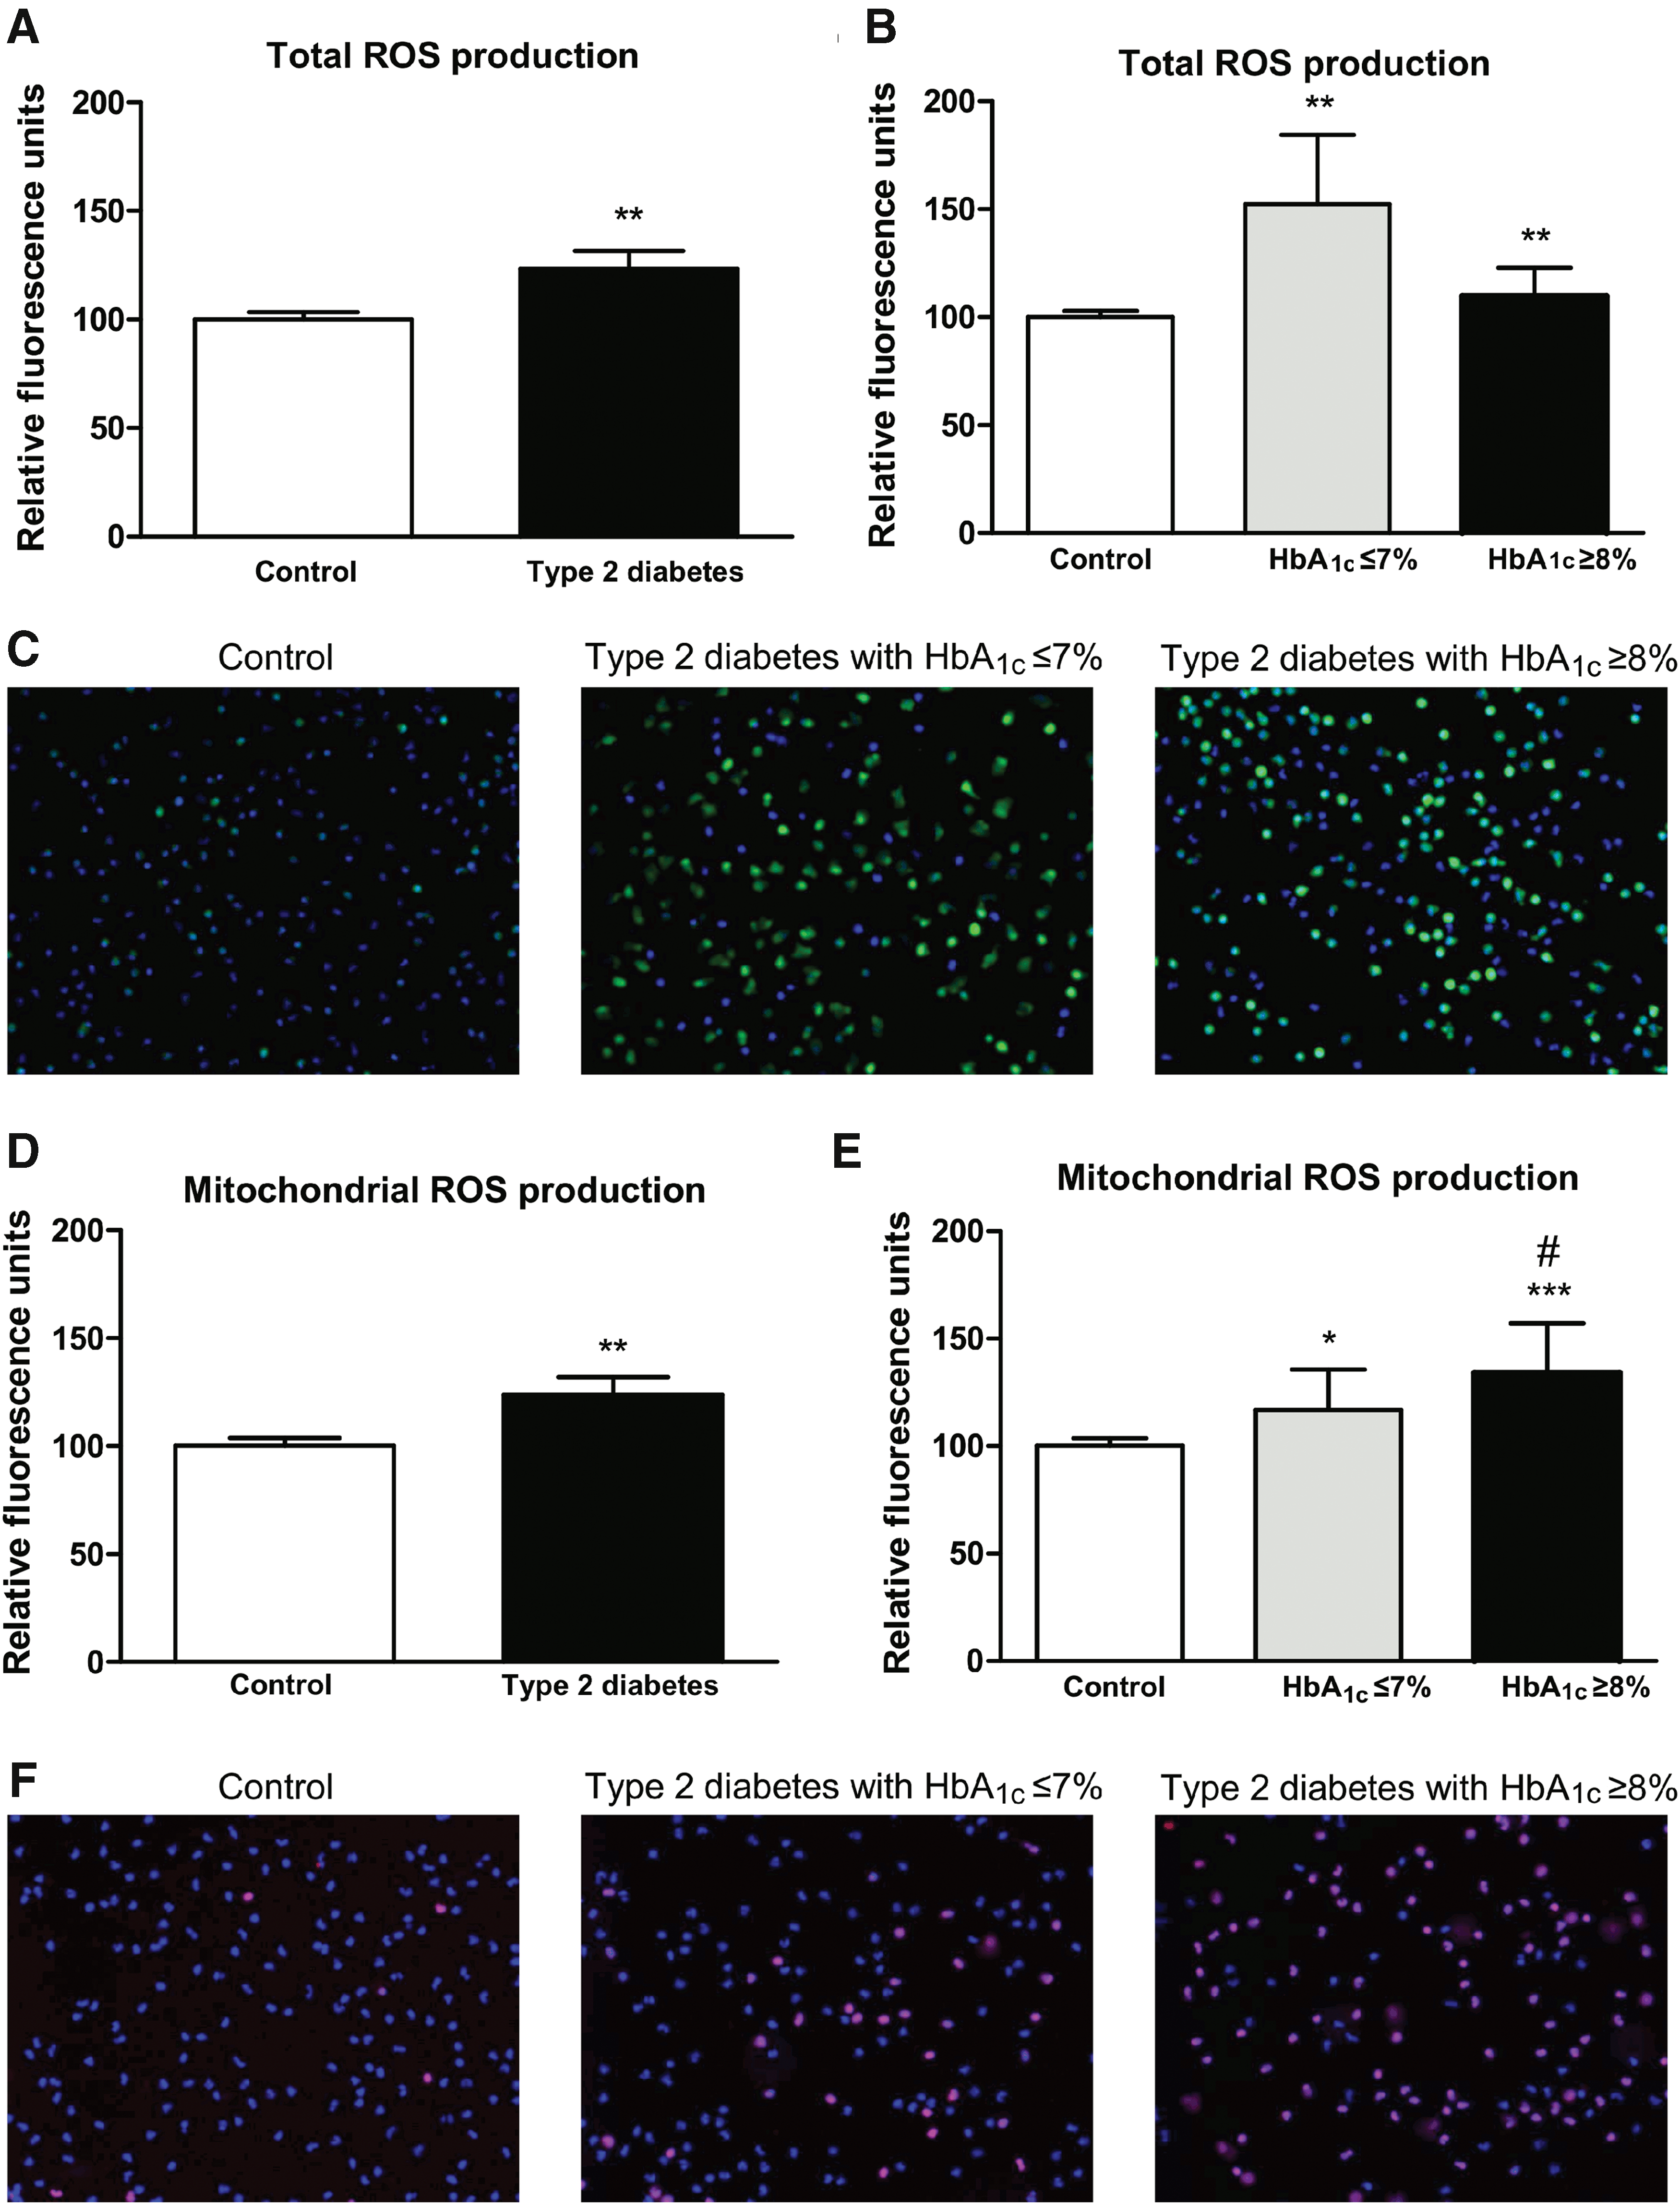
Total and mitochondrial ROS production
Total and mitochondrial ROS production was assessed in leukocytes from T2D and control subjects (Fig. 1). Leukocytes from diabetic patients showed enhanced levels of total ROS production with respect to those from controls (p < 0.01; Fig. 1A). When diabetic patients were divided according to HbA1c levels ≤7% and ≥8%, we observed increased total ROS production in both groups of diabetic patients (p < 0.01; Fig. 1B, C). With regard to mitochondrial ROS production, an increase in T2D patients was observed (p < 0.01; Fig. 1D) with respect to controls. Furthermore, whereas T2D patients with HbA1c ≤7% showed a slight increase in mitochondrial ROS production (p < 0.05 vs. controls), T2D patients with poor glycemic control (HbA1c ≥8%) displayed a more pronounced increase in mitochondrial ROS production (p < 0.001 vs. controls and p < 0.05 vs. HbA1c ≤7% group; Fig. 1E, F).
Inflammasome NLRP3 measurements
We assessed leukocyte messenger RNA (mRNA) and protein expression levels of NLRP3 and observed a decrease in both mRNA (p < 0.05; Fig. 2A) and protein (p < 0.001; Fig. 2C) expression levels in T2D patients with respect to controls. The decreases in NLRP3 mRNA and protein expression levels were particularly pronounced among T2D patients with poor glycemic control (HbA1c ≥8; Fig. 2B, D). Representative unedited blots showing protein expression of NLRP3 and actin are shown in Supplementary Figures S1 and S2 (Supplementary Data are available online at
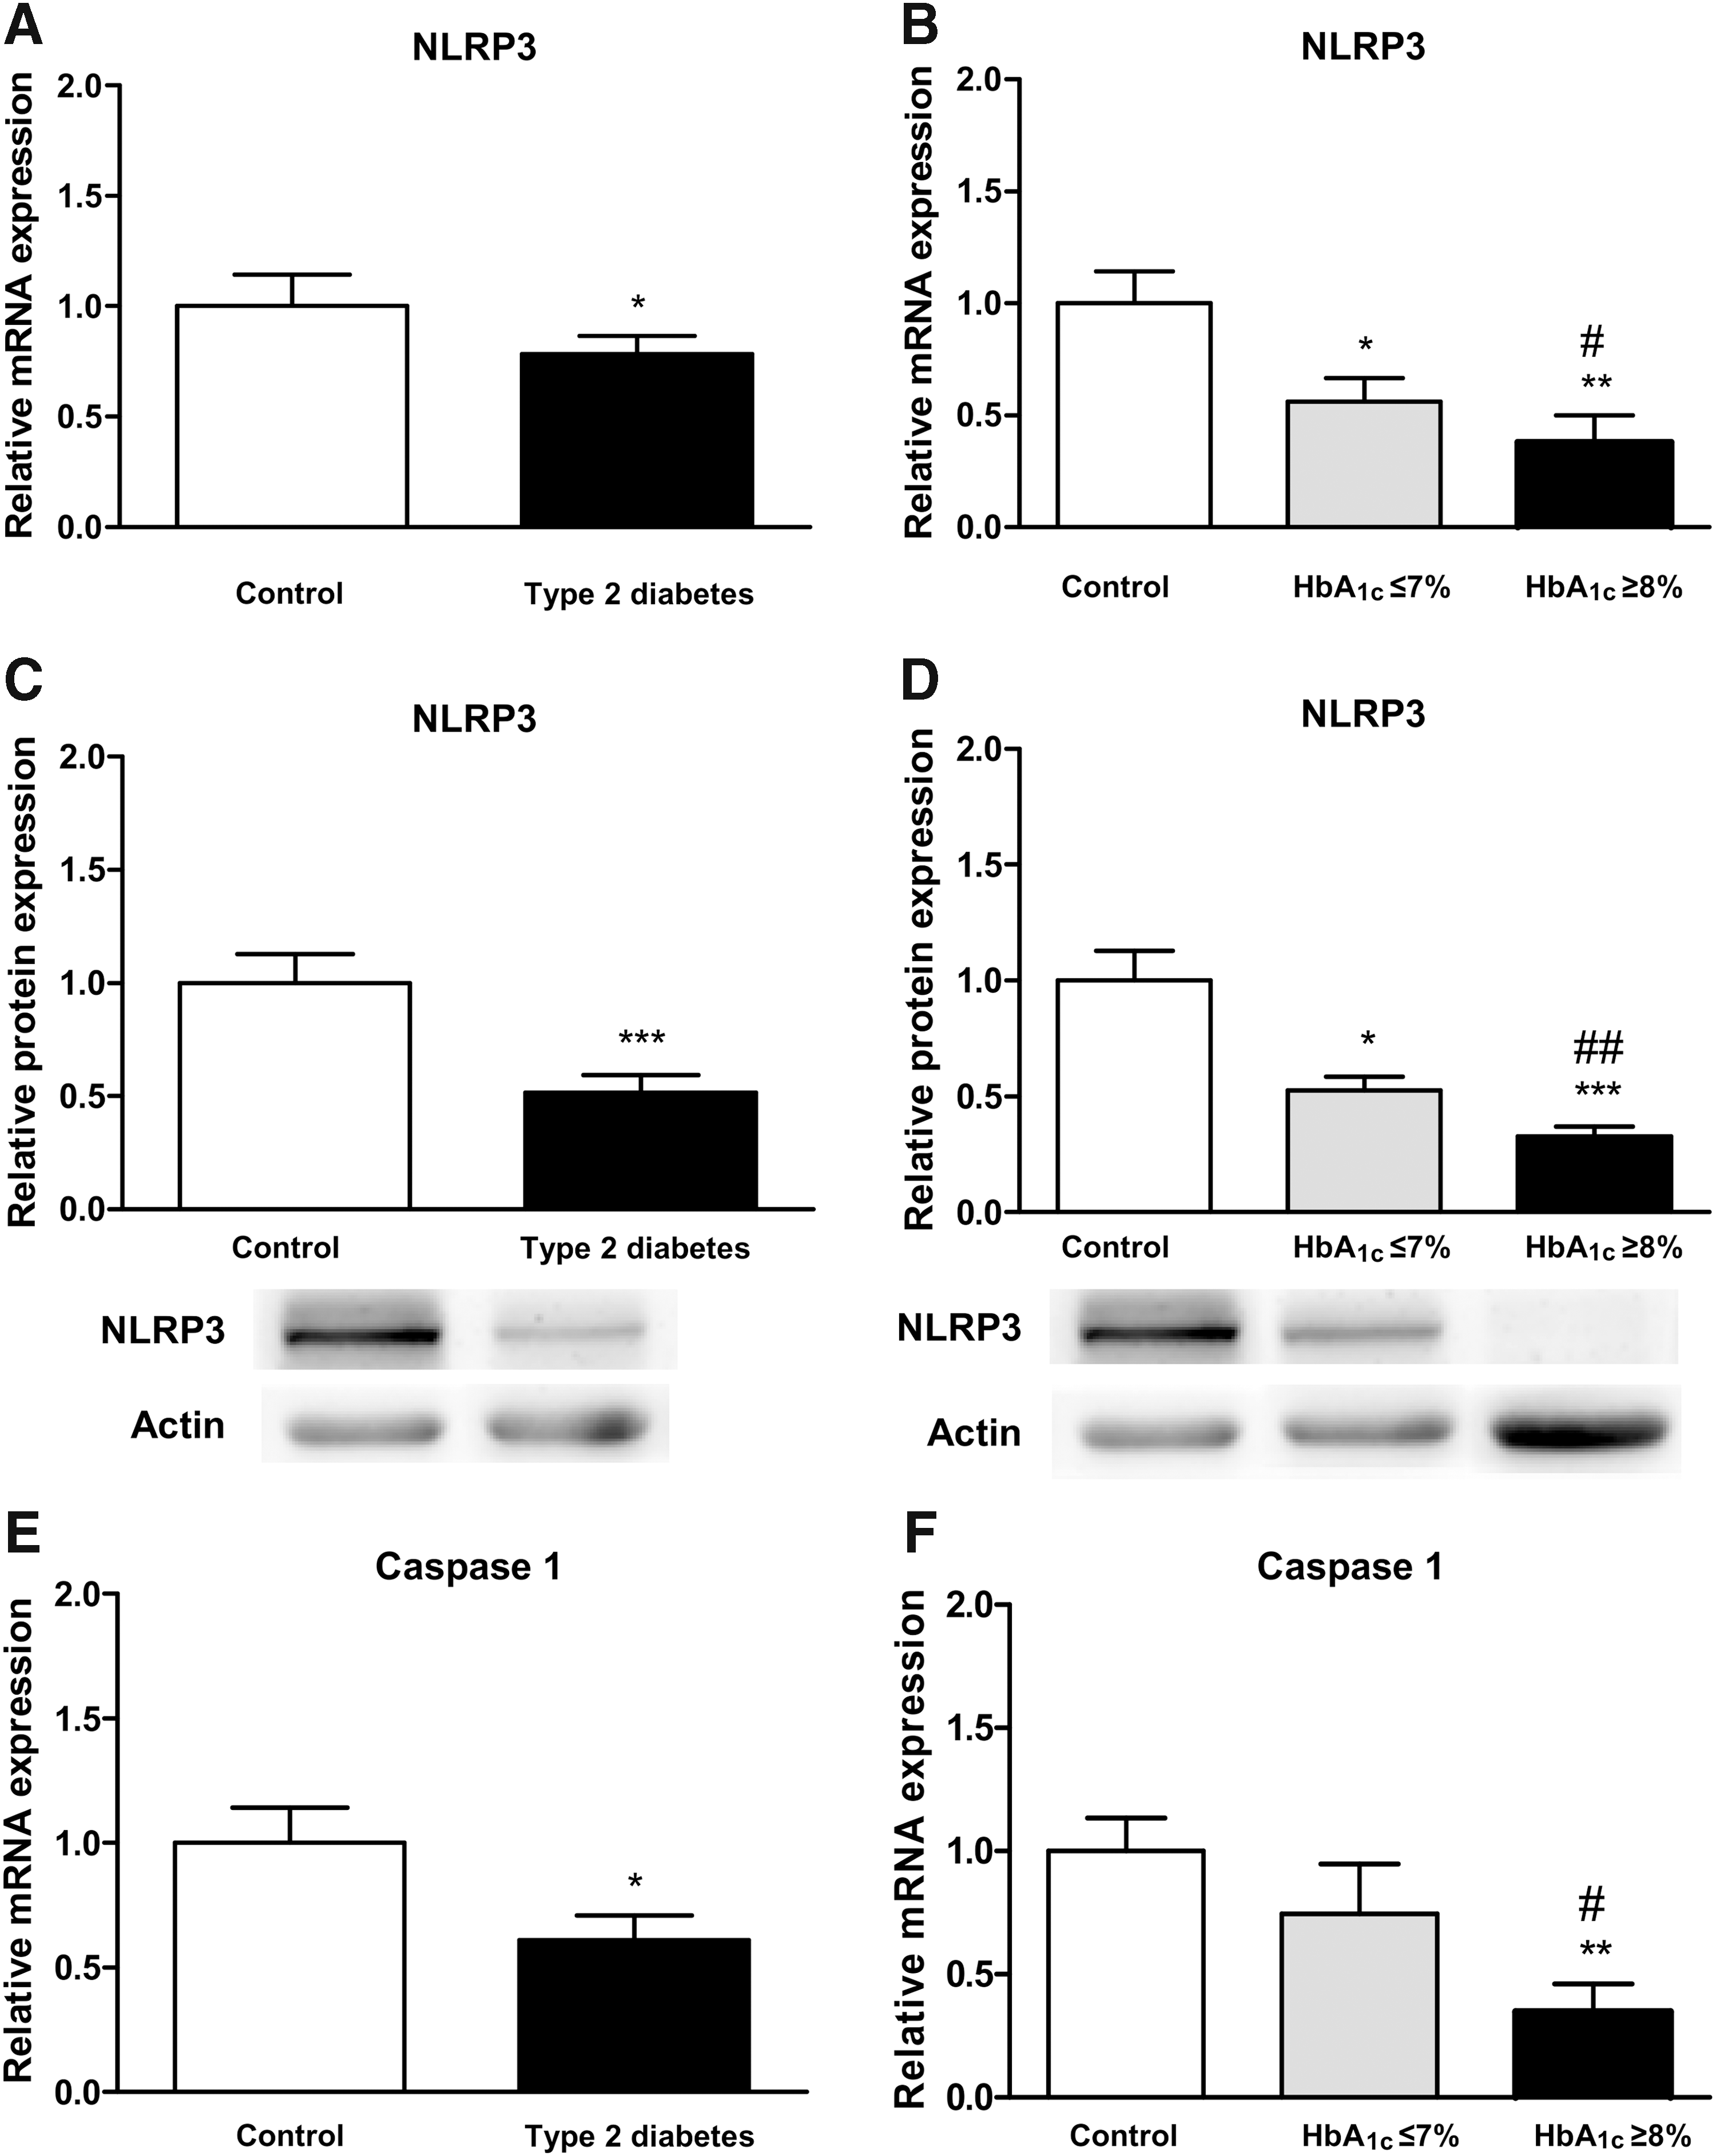
When mRNA expression levels of caspase-1 were analyzed in leukocytes, we observed a decrease in T2D with respect to controls (p < 0.05; Fig. 2E). Although patients with HbA1c levels ≤7% showed a slight decrease in mRNA levels of caspase-1, it did not reach statistical significance. However, the reduction in caspase-1 mRNA levels was more pronounced in patients with HbA1c ≥8% and was significant when compared with control subjects (p < 0.01) and well-controlled patients (p < 0.05; Fig. 2F).
Proinflammatory cytokine measurement
When we evaluated cytokine levels, we observed a decrease of IL-18 mRNA expression level, but did not observe significant differences between diabetic individuals and controls (Fig. 3A, B). Interestingly, a drop in IL-1β was observed in T2D patients not only in leukocyte mRNA expression levels (p < 0.05; Fig. 3C) but also in serum IL-1β concentration (p < 0.01; Fig. 3E). When T2D patients were split according to glycemic control, we witnessed that mRNA expression levels were specifically reduced in HbA1c ≥8% diabetic patients (p < 0.05; Fig. 3D), while serum IL-1β levels decreased significantly in both T2D groups (p < 0.05 in HbA1c ≤7% and p < 0.01 in HbA1c ≥8%) with respect to controls, showing a more pronounced drop in patients with poor glycemic control (p < 0.05 with respect to the HbA1c ≤7% group; Fig. 3F).

IL-12 serum levels were decreased in T2D patients (p < 0.001; Fig. 3G). In addition, the decline in serum IL-12 concentration was more marked in poorly controlled patients (p < 0.01 with respect to controls and p < 0.05 compared with well-controlled patients; Fig. 3H).
Correlation studies
We further evaluated the role of glycemic control during T2D on inflammasome activation by exploring possible correlations between HbA1c and NLRP3 inflammasome activation-related factors. Interestingly, we found negative correlations between HbA1c levels and NLRP3 protein expression (p < 0.05, r = −0.438), production of IL-12 and IL-1β (p < 0.05, r = −0.476, and p < 0.01, r = −0.555, respectively), and caspase-1 mRNA expression levels (p < 0.05, r = −0.408).
Discussion
We have studied the involvement of glycemic control in oxidative stress and NLRP3 inflammasome activation by evaluating total and mitochondrial ROS production and expression levels of the principal NLRP3 markers in nonstimulated leukocytes from control subjects and T2D patients. In this context, it is relevant that T2D and hyperglycemia can cause disturbances in the redox state, thereby contributing to development of vascular complications. Furthermore, we have demonstrated in previous studies that mitochondrial dysfunction and ROS production are present in leukocytes of T2D patients and are related to macro- and microvascular complications (2).
In this study, we have observed an increase in total and mitochondrial ROS production in leukocytes from T2D patients, which was more pronounced in subjects with poor glycemic control (HbA1c ≥8%), suggesting that leukocyte mitochondrial function is altered during chronic hyperglycemia.
Oxidative stress, redox imbalance, and mitochondrial function are linked to activation of the NLRP3 inflammasome, which is in turn linked to chronic inflammation in insulin resistance-associated diseases (5). In fact, activation of the NLRP3 inflammasome induces production of IL-1β in T2D patients and in animal models of obesity (1, 5). Saturated fatty acids, such as palmitate, can also induce NLRP3 inflammasome activation in hematopoietic cells, thus contributing to insulin resistance and glucose intolerance (8). Notwithstanding, the bibliography contains controversial evidence, perhaps as a consequence of the use of different types of cells, drug treatments, or the fact that cells have been usually activated in vitro by substances that can promote inflammasome activation, thus leading to generation of contradictory data.
In our study, we have evaluated leukocytes from T2D patients and their respective controls without in vitro stimuli to observe a naïve inflammatory response. We have seen a decrease in NLRP3 mRNA expression and protein levels suggestive of considerable impairment of the inflammatory response in leukocytes from this cohort of diabetic patients. In fact, the decrease in NLRP3 expression was more evident in T2D with poor metabolic control.
Our results are in line with those obtained by Kousathana et al. (3) who reported a defective production of proinflammatory cytokines and NLRP3 activation in leukocytes from diabetic patients. Furthermore, it is known that regulation of the activation of NLRP3 varies depending on nutrient levels (7). Traba et al. (7) also demonstrated in peripheral blood mononuclear cells induced with lipopolysaccharide and adenosine triphosphate that redox stress during fasted state can activate sirtuin 3, which in turn is able to modulate mitochondrial ROS production through inhibition of NLRP3 inflammasome and repressing the cleavage of caspase-1 (7).
Therefore, alterations in mitochondrial function by other pathways might induce innate immunological activations, clearly pointing to interaction between the innate immune system and mitochondrial function. NLRP3 inflammasome can also be inhibited by β-hydroxybutyrate or a ketogenic diet, which also inhibits caspase-1 activation and IL-1β secretion in animal models of inflammation (9). Another mediator that inhibits the NLRP3 inflammasome is IL-10. In fact, IL-10 has demonstrated an anti-inflammatory effect by metabolic reprogramming of macrophages and can inhibit glycolytic flux, prevent accumulation of dysfunctional mitochondria via induction of mitophagy, promote induction of autophagy, and maintain mitochondrial function and integrity via inhibition of mammalian target of rapamycin.
In accordance with NLRP3 inflammasome inhibition in leukocytes from diabetic patients, we have observed a decrease in IL-1β gene expression in these cells and IL-1β serum levels, an effect that was more pronounced in subjects with poor metabolic control. In addition, levels of IL-12 and caspase-1 decreased to a greater extent in diabetic patients with poor glycemic control, suggesting severe dysregulation of the immune response. Reduction in these levels of proinflammatory cytokines and caspase-1 suggests a downregulation of the NLRP3 inflammasome, which is in line with the known susceptibility of diabetic patients to infections. Furthermore, impairment of the release of proinflammatory cytokines has been described in animal models of diabetes with concomitant infections.
Overall, our findings suggest an increase in total and mitochondrial ROS production, impairment in NLRP3 inflammasome activation, and decrease in IL-1β, IL-12, and caspase-1 in T2D patients. These trends are more pronounced in subjects with poor glycemic control, suggesting that glycemic control is essential for the adequate immune response of leukocytes in T2D. Although new mechanistic pathways need to be explored, we propose the possibility that poor glycemic control impairs the NLRP3 inflammasome response in T2D.
Notes
Subjects of the study and sample collection
One hundred one subjects were enrolled in the study and subdivided into two groups: 61 T2D patients (25 with HbA1c levels ≤7% and 36 with HbA1c ≥8%) and 40 healthy controls adjusted for age. We have chosen to compare patients with good glycemic control, that is, with HbA1c ≤7% since it is the cutoff point for good metabolic control in our hospital's Endocrinology and Nutrition Department based on the distribution of HbA1c levels in its patients and, moreover, this is a cutoff point for avoiding thromboembolism in patients. On the other hand, a poor glycemic control cutoff of HbA1c ≥8% has been chosen based on the increase in risk of cardiac failure in our hospital's Endocrinology and Nutrition Department.
The study was conducted in the Endocrinology and Nutrition Service of University Hospital Doctor Peset, Valencia, Spain. T2D diagnosis was confirmed according to the American Diabetes Association's criteria: levels of fasting serum glucose ≥126 mg/dL; HbA1c ≥6.5%; random serum glucose ≥200 mg/dL on at least two occasions; and/or antidiabetic medication. Subjects with chronic, malignant, hematological, autoimmune, infectious, and inflammatory diseases or with a documented history of CVD (stroke, ischemic heart disease, and peripheral vascular disease, etc.) were excluded.
The present study was conducted according to ethical guidelines laid down in the Helsinki Declaration and with the approval of our hospital's Ethics Committee. All participants were informed about the procedure, risks, and benefits of the study before they signed an informed consent form.
Clinical and biochemical determinations
Patients underwent a physical examination to obtain anthropometrical measures such as height (m), weight (kg), waist circumference (cm), BMI (kg/m2), and systolic and diastolic blood pressure (mmHg). Blood samples were collected from the antecubital vein in fasting conditions between 8:00 a.m. and 9:30 a.m. for biochemical and molecular determinations.
To obtain serum, centrifugation was performed at 1500g for 10 min at 4°C. TC, TG, and glucose levels were determined in the serum by means of enzymatic assay (Beckman Corp., Brea, CA). The percentage of HbA1c was obtained with an automatic glycohemoglobin analyzer (Arkray Inc., Kyoto, Japan). HDL-c concentration was quantified with a Beckman LX20 analyzer (Beckman Corp.) and LDL-c concentration was calculated with Friedewald's formula. Fasting insulin levels were measured by immunochemiluminescence (Abbott, Abbott Park, IL) and HOMA-IR index was calculated as [fasting insulin (μU/mL) × fasting glucose (mg/dL)]/405. hs-CRP was measured by a latex-enhanced immunonephelometric assay (Behring Nephelometer II; Dade Behring, Inc., Newark, DE).
Cell isolation
Leukocytes were isolated from heparinized blood samples by incubating whole blood samples with half a volume of dextran (3% w/v in saline solution, 45 min; Sigma-Aldrich, St. Louis, MO). Supernatants were collected, placed over Ficoll-Hypaque (GE Healthcare, Uppsala, Sweden), and centrifuged at room temperature at 650g for 25 min. Leukocytes were collected from the bottom phase and centrifuged at room temperature at 650g for 10 min. The collected pellets were washed with phosphate-buffered saline (Sigma-Aldrich) and resuspended in Hank's balanced salt solution (Sigma-Aldrich), at which point cells were counted. Pellets for Western blot and quantitative real-time polymerase chain reaction (RT-qPCR) were stored at −80°C until utilization.
Static cytometry assay
Total and mitochondrial ROS production in leukocytes was assessed with a fluorescence microscope (IX81; Olympus, Hamburg, Germany) coupled with the static cytometry software, ScanR (Olympus). Total ROS was determined by seeding leukocytes in a 48-well plate and incubating it with the fluorescent probe 2’,7’-dichlorodihydrofluorescein diacetate (5 × 10⁻⁶ mol/L, 30 min) (Thermo Fisher Scientific, Waltham, MA) or, for mitochondrial ROS production, using the fluorescent probe MitoSOX Red mitochondrial superoxide indicator (MitoSOX) (5 × 10⁻⁶ mol/L, 30 min) (Thermo Fisher Scientific), and Hoechst 33342 (Sigma-Aldrich) was used to visualize nuclei. Fluorescence was standardized and referred to as % of control.
Real-time PCR
RT-qPCR was performed to measure relative gene expression of NLRP3, IL-1β, caspase-1, and IL-18 in leukocytes. To obtain total RNA, a GeneAll Ribospin™ Total RNA extraction kit (GeneAll Biotechnology, Hilden, Germany) was employed following the manufacturer's instructions. RNA amount and purity were determined by a NanoDrop 200c spectrophotometer (Thermo Fisher Scientific). For complementary DNA (cDNA) obtention, 1 μg of RNA was reverse-transcribed by using a RevertAid first-strand cDNA synthesis kit (Thermo Fisher Scientific). RT-qPCR reactions were performed using a 7500 Fast RT-PCR system (Thermo Fisher Scientific) with FastStart Universal SYBR Green Master (Sigma-Aldrich).
The protocol used to perform the experiments was 10 min at 95°C, followed by 40 cycles of 10 s at 95°C and 60°C for 30 s, and melting curve. Analyzed genes were NLRP3 (forward: CTTCTCTGATGAGGCCCAAG; reverse: GCACGAAACTGGAAAGGAAG), IL-1β (forward: AAAAGCTTGGTGATGTCT; reverse: TTTCAACACGCAGGACAGG), caspase-1 (forward: TTTCAACACGCAGGACAGG; reverse: AGAAAGCCCACATAGAGAAGG), and IL-18 (forward: GACCAAGGAAATCGGCCTCT; reverse: AATATGGTCCGGGGTGCATT). Relative quantification was conducted according to the comparative 2−ΔΔCt method, and glyceraldehyde 3-phosphate dehydrogenase (GAPDH) (forward: CGCATCTTCTTTTGCGTCG; reverse: TTGAGGTCAATGAAGGGGTCA) was used as a housekeeping gene in the analysis performed with ExpressionSuite software (Thermo Fisher Scientific).
Western blot
Total protein extracts from leukocytes were obtained after lysis with an extraction buffer (20% glycerol, 20 mM HEPES pH 7.5, 0.1 mM EDTA, 10 μM Na2-MoO4, 400 mM NaCl, and 0.5% NP-40) containing protease inhibitors (1 mM NaVO3, 10 mM NaF, 10 mM PNP, and 10 mM β-glycerol phosphate) and dithiothreitol 1 mM, after incubation for 15 min on ice and centrifugation at 4°C for 15 min. The isolated supernatant containing the protein extract was quantified by a BCA protein assay (Thermo Fisher Scientific) and stored at −80°C until use.
To assay protein expression levels, protein samples (25 μg) were resolved on 10% polyacrylamide gels and transferred onto nitrocellulose membranes. After blocking, membranes were incubated overnight at 4°C with the following primary antibodies: anti-NLRP3 (Cell Signaling Technology, Danvers, MA) and anti-Actin (Sigma-Aldrich). As a secondary antibody, we used horseradish peroxidase goat anti-rabbit (Millipore Iberica, Madrid, Spain). Membranes were developed with ECL Plus reagent (GE Healthcare, Little Chalfont, UK) or SuperSignal West Femto (Thermo Fisher Scientific). The Fusion FX5 acquisition system (Vilbert Lourmat, Marne La Vallée, France) was used for band visualization. Signals were analyzed, quantified by densitometry using Bio1D software (Vilbert Lourmat), and normalized for actin.
Assessment of cytokines
MILLIPLEX® human high-sensitivity T cell magnetic bead panel 96-well plate assay (EMD Millipore Corporation, Billerica, MA) coupled with multianalyte profiling (xMAP) technology was used to determine serum levels of the proinflammatory cytokines, IL-1β and IL-12 (p70), in a Luminex 200™ system (Luminex Corp., Austin, TX). Assay was performed following technical guidelines provided in the kit. All analytes were measured simultaneously in the same serum sample and assayed in duplicate, with intra-assay % coefficient of variation <5% and interassay % coefficient of variation <15% for each analyte.
Data analysis
Statistical analysis was performed with SPSS 17.0 software (SPSS Statistics, Inc., Chicago, IL). Values are expressed as mean ± standard deviation for parametric data and as median (25th and 75th percentiles) for nonparametric data. Bar graphs show mean + standard error. Comparisons between groups were performed by Student's t-test for normally distributed samples and Mann–Whitney U-test for non-normally distributed samples. Chi-square test was employed to compare proportions. The three groups were compared with one-way analysis of variance (and Student–Newman–Keuls post hoc test) or Kruskal–Wallis test (and Dunn's multiple comparison post hoc test) for parametric and nonparametric data, respectively. Correlations were calculated using Spearman's correlation coefficient. Significant differences were considered when p < 0.05.
Footnotes
Acknowledgments
The authors thank Brian Normanly (University of Valencia/CIBERehd) for his editorial assistance and Rosa Falcón and Carmen Ramirez (FISABIO) for their technical assistance. This study was financed by grants PI16/1083, PI16/0301, and CIBERehd CB06/04/0071 from the Carlos III Health Institute and the European Regional Development Fund (ERDF “A way to build Europe”), UGP-15-220 from FISABIO, and unrestricted grant from Menarini S.A. F.I is a recipient of a contract from the Ministry of Education of the Valencian Regional Government (GRISOLIAP/2016/015). N.D.-M. is a recipient of PFIS contracts from the Carlos III Health Institute (FI14/00125). I.E.-L. is a recipient of a predoctoral contract from FISABIO (UGP-15-144). S.R-L. is a recipient of a Juan de la Cierva-Formación contract from the Spanish Ministry of Economy and Competitiveness (FJCI-2015-25040). V.M.V. and M.R. are recipients of contracts from the Ministry of Health of the Valencian Regional Government and Carlos III Health Institute (CES10/030 and CPII16/00037, respectively).
Author Disclosure Statement
No competing financial interests relevant to this article exist. The authors have nothing to disclose.
Abbreviations Used
References
Supplementary Material
Please find the following supplemental material available below.
For Open Access articles published under a Creative Commons License, all supplemental material carries the same license as the article it is associated with.
For non-Open Access articles published, all supplemental material carries a non-exclusive license, and permission requests for re-use of supplemental material or any part of supplemental material shall be sent directly to the copyright owner as specified in the copyright notice associated with the article.