
Abstract
Significance:
Plant stress involves redox signaling linked to reactive oxygen species such as hydrogen peroxide (H2O2), which can be generated at high rates in photosynthetic cells. The systems that process H2O2 include catalase (CAT) and the ascorbate–glutathione pathway, but interactions between them remain unclear. Modeling can aid interpretation and pinpoint areas for investigation.
Recent Advances:
Based on emerging data and concepts, we introduce a new experimentally constrained kinetic model to analyze interactions between H2O2, CAT, ascorbate, glutathione, and NADPH. The sensitivity points required for accurate simulation of experimental observations are analyzed, and the implications for H2O2-linked redox signaling are discussed.
Critical Issues:
We discuss several implications of the modeled results, in particular the following. (i) CAT and ascorbate peroxidase can share the load in H2O2 processing even in optimal conditions. (ii) Intracellular H2O2 concentrations more than the low μM range may rarely occur. (iii) Ascorbate redox turnover is largely independent of glutathione until ascorbate peroxidation exceeds a certain value. (iv) NADPH availability may determine glutathione redox status through its influence on monodehydroascorbate reduction. (v) The sensitivity of glutathione status to oxidative stress emphasizes its potential suitability as a sensor of increased H2O2.
Future Directions:
Important future questions include the roles of other antioxidative systems in interacting with CAT and the ascorbate–glutathione pathway as well as the nature and significance of processes that achieve redox exchange between different subcellular compartments. Progress in these areas is likely to be favored by integrating kinetic modeling analyses into experimentally based programs, allowing each approach to inform the other.
Introduction
Hydrogen peroxide (H2O2)
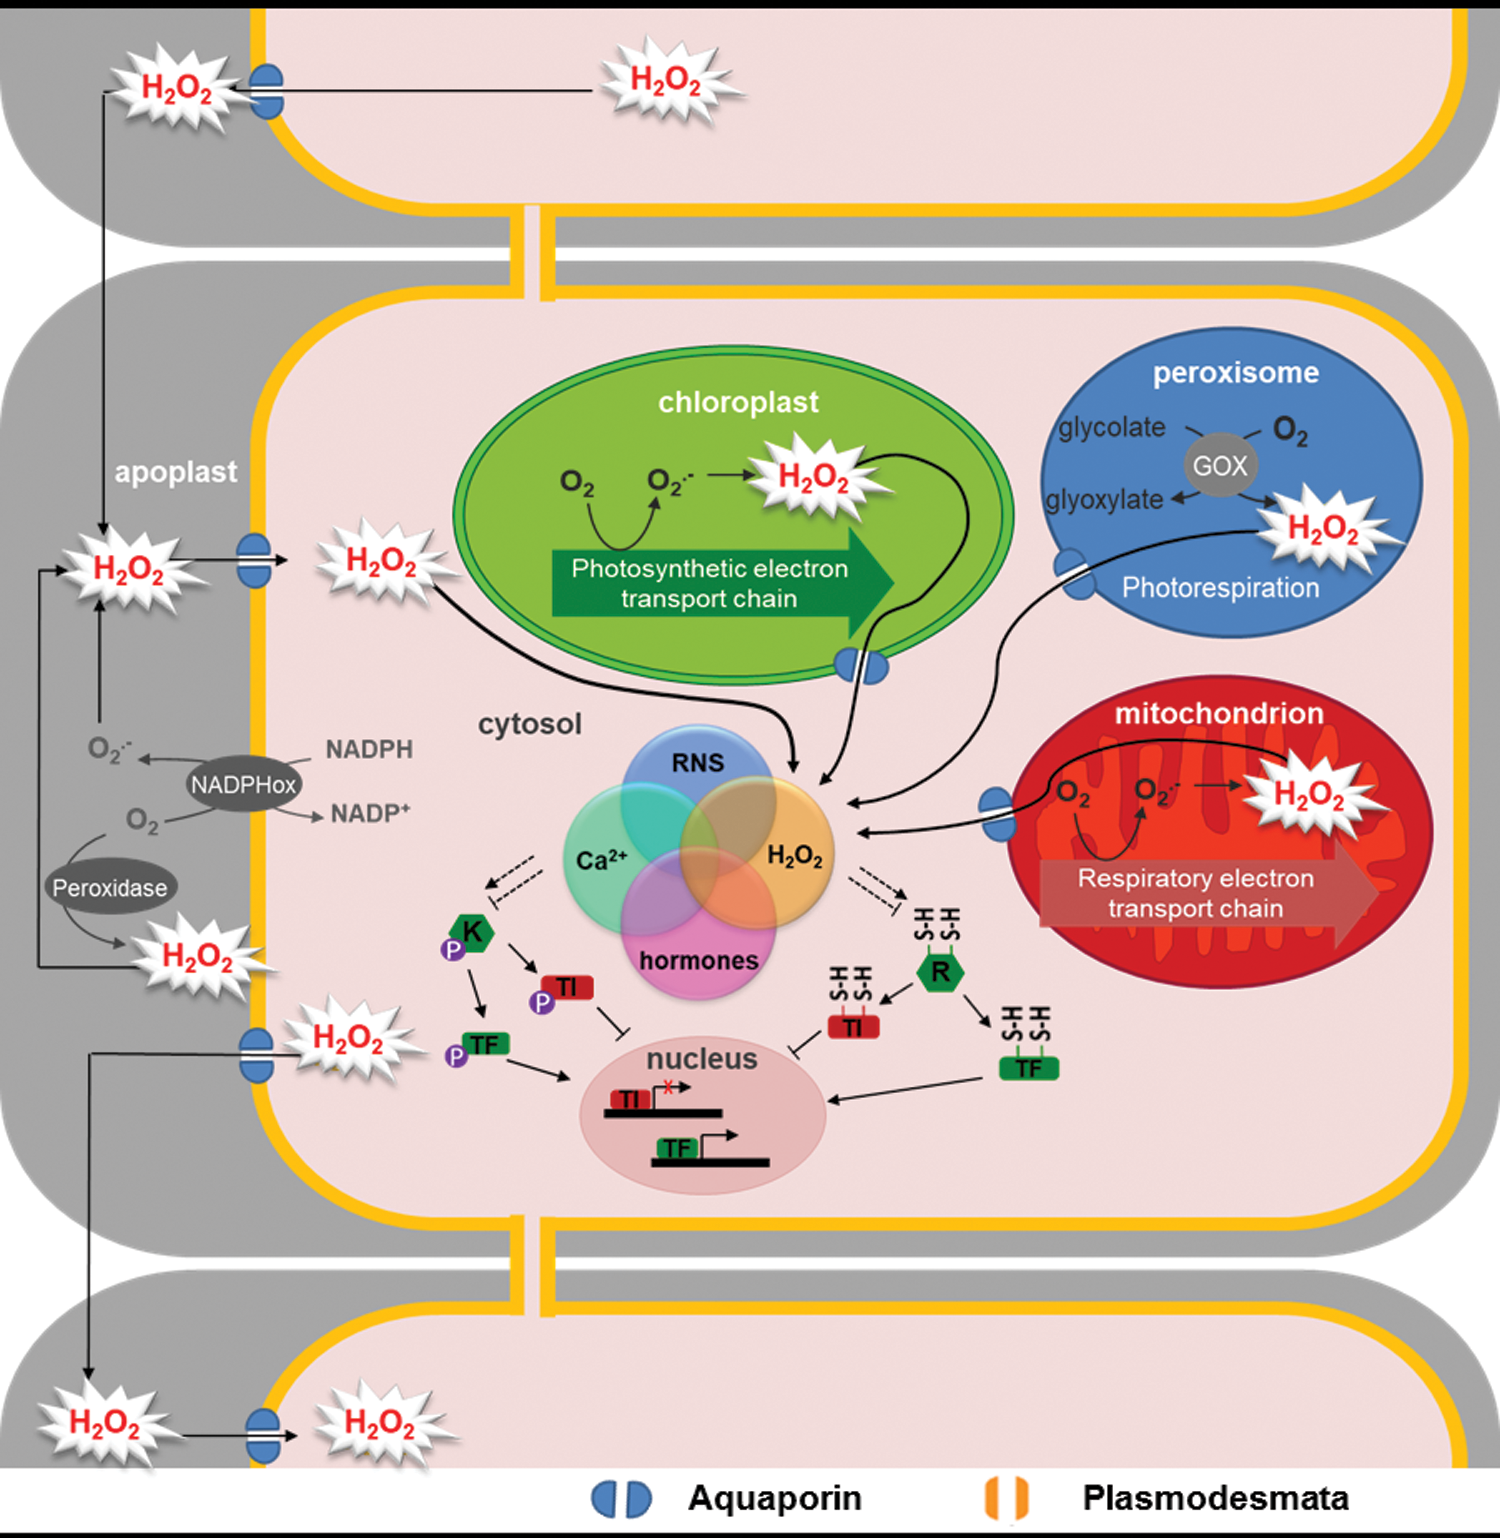
Although H2O2 is produced by plant cells at quite high rates in optimal environmental conditions, it is generated even faster under stress conditions such as air pollution, intense light, drought, or pathogen attack. Although this can lead to a condition known as oxidative stress, it can also be perceived as a signal that allows the plant to acclimate to the new external conditions, through interactions with components such as phytohormones, ion signaling, and transcription factors and coactivators that are redox sensitive (3, 122, 186) (Fig. 1).
To avoid oxidative stress and to achieve appropriate ROS signaling responses, the plant cell contains elaborate antioxidative systems, many of which function to limit the accumulation of H2O2. The literature documents many biochemical and genetic studies of these systems, and there has been increased awareness of their complexity since the advent of the genomics era. Despite this, it is not clear how the different antioxidative systems interact in the control of H2O2 and how this depends on, and impacts on, key cell redox regulators pools such as H2O2, ascorbate, glutathione, and NADPH.
Integrative modeling can be a useful aid to understanding such questions as it can identify the results of interactions that are difficult for humans to predict. To date, only a limited number of studies have used a model to describe plant ROS metabolism, and these studies are all focused on chloroplastic processes (143, 188, 189). Our aim here is to provide an overview of some key outstanding questions in this area with the aid of a new integrated model of H2O2 production and processing by both catalase (CAT) and the ascorbate–glutathione pathway.
Our modeling approach is somewhat different to the previous studies. We start with observed data on biochemical indicators of redox state in wild-type and mutant plants grown under defined physiological conditions, and seek to build a model able to simulate them and, thereby, identify the most influential features required in the parametrization. Hence, a novel aspect of our model is that it is constrained by its ability to reproduce values for ascorbate and glutathione status that correspond to measured data. Introducing such constraints introduces at least a partial experimental validation of the model in that it identifies configurations able to achieve the target output. By discounting the more unrealistic configurations (based on available knowledge), the model can act as an aid to data interpretation and help to pinpoint questions worthy of further investigation.
In developing this model, our specific objectives included (i) to explore the processing of H2O2 produced through major photosynthetic routes in C3 plants (the electron transport chain and photorespiration) and its potential impact on cell H2O2 concentrations, (ii) to investigate interactions between the ascorbate–glutathione cycle and CAT function, and (iii) to identify the key factors necessary to allow accurate simulation of observed real-world responses in both optimal and stress conditions. To achieve this simulation, we used (where possible) available data for enzyme capacities and affinities. We explore hereunder some of the key sensitive points that determine whether a single model configuration is able to reproduce the status of ascorbate and glutathione in optimal and oxidative stress conditions.
Production and Removal of H2O2 in Plant Cells
Multiple sources of H2O2 exist in different plant cell compartments (129). These notably include electron leakage to O2 from the electron transport chains in chloroplasts and mitochondria, in which H2O2 is formed secondarily from superoxide (Fig. 1). Other routes of H2O2 production via superoxide include respiratory burst oxidase homologue-type enzymes that are important players in developmental and stress responses (43, 51, 180, 182). Among oxidases that directly produce H2O2 from O2, the peroxisomal glycolate oxidase (GOX) reaction can be particularly rapid in plants, because it is driven by high rates of glycolate produced in photorespiration (134). Other sources include amine oxidase, fatty acid oxidases, sulfite oxidases, and class III heme-dependent peroxidases (2, 65, 117, 137, 138). H2O2 can traverse cellular membranes and migrate to different compartments through aquaporins that facilitate its signaling functions (12, 73) (Fig. 1).
The role of H2O2 in signaling in plants is dependent on the balance between its production and removal (Fig. 2), with several types of antioxidative enzymes acting on H2O2 to keep concentrations low enough to be compatible with continued cell function (47, 122). Among H2O2-scavenging enzymes, CATs have the highest capacity and are some of the most rapid enzymes known. They do not require cellular reductants as they primarily catalyze a dismutase reaction and, in most organisms, are located mainly in the peroxisomes (118, 202, 208).
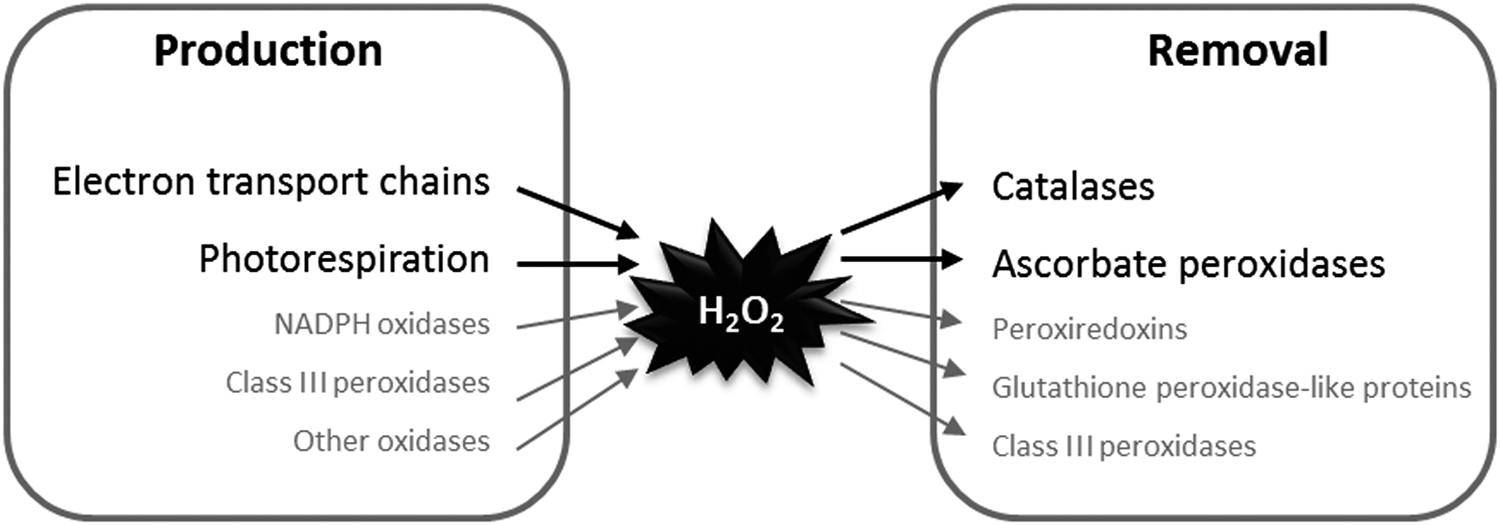
As well as CATs, the best described route for H2O2 metabolism is the ascorbate–glutathione pathway, which is considered to consist of a network of reactions involving several enzymes. This pathway is engaged when H2O2 is reduced to water by ascorbate peroxidases (APXs), producing monodehydroascorbate (MDHA) radicals. MDHA can be reduced back to ascorbate by ferredoxin (124) or by NAD(P)H in a reaction catalyzed by MDHA reductase (MDHAR) (76). MDHA that escapes these reactions can spontaneously disproportionate to ascorbate and dehydroascorbate (DHA). Because DHA is probably the main route for ascorbate degradation, it must be recycled to avoid depletion of ascorbate pools (140, 141, 171). Although several cellular factors can reduce DHA, GSH* is considered to be a major player, acting either nonenzymatically or via an enzymatic reaction catalyzed by DHA reductase (DHAR) (44, 45). Consumption of GSH to regenerate ascorbate involves production of glutathione disulfide (GSSG), the major oxidized form of glutathione. Recycling of GSH from GSSG is achieved by glutathione reductase (GR) with consumption of NADPH. Therefore, unlike CATs, the ascorbate–glutathione pathway consumes cellular reductants such as NAD(P)H in two reactions (MDHAR and GR). The pathway is found in several subcellular compartments, including chloroplasts, mitochondria, and peroxisomes, and the cytosol (26, 83).
In addition to these two relatively well-characterized routes, other possibilities exist for removal of H2O2 in plants. Perhaps the most important additional players are peroxiredoxins (PRXs), which are composed of several types that use reductants such as thioredoxins (TRXs), glutathione-linked glutaredoxins (GRXs), and ascorbate (34, 181). Like the ascorbate–glutathione pathway, these enzymes ultimately depend on reductant in the form of reduced ferredoxin or NAD(P)H.
In animals, glutathione peroxidases play roles in H2O2 metabolism. Although glutathione peroxidase-like proteins (GPXL) exist in plants, they are likely to function similarly to some PRXs in using TRXs, rather than GSH (78, 128). Both PRX and GPXL are located in several cellular compartments (6, 181). In addition to APX, PRX, and GPXL, another contribution to H2O2 removal could come from heme-based class III peroxidases, which are encoded by a large number of genes in plants but whose precise contribution to H2O2 processing is not entirely clear (137). At least under some conditions, these peroxidases may contribute to H2O2 production rather than removal (138).
Although modeling the full complexity of plant antioxidative systems may ultimately require inclusion of enzymes such as PRXs, we have chosen, as a starting point, to focus on CAT and the ascorbate–glutathione pathway in H2O2 processing. As discussed in the following sections, genetic, biochemical, and transcriptomics data point to a particularly important role for these systems, and several studies have revealed close functional interactions between them. Less is currently known about the capacities and kinetic properties of other antioxidative systems, making their parametrization in the model much more difficult.
Insight from Studies of Mutants
The aforementioned discussion highlights the complexity of H2O2-metabolizing systems in plants, especially when one considers the accessory enzymes that are involved in generating reductants such as NADPH to support these systems. The lack of phenotype observed in specific loss-of-function mutants for some of these enzymes points to redundancy due to functional overlap (113, 150, 151). However, certain enzymes involved in peroxide metabolism have been shown to be important to support plant growth in either optimal or stress conditions. It is outside the scope of the present text to provide an exhaustive list of these studies, but important roles identified in studies in Arabidopsis include those of the major cytosolic APX (APX1) in high light acclimation (28), the overlapping functions of chloroplast APX and 2-cys-PRX in processing H2O2 in this organelle (7), and the importance of a specific isoform of catalase (CAT2) to remove H2O2 produced in the peroxisomes during photorespiration (147).
Among these loss-of-function Arabidopsis lines with compromised capacity for removing H2O2, CAT-deficient mutants are the best characterized. Their decreased capacity to remove H2O2 leads to a conditional phenotype that can be controlled by varying the external CO2 concentration (147). In high CO2, where photorespiration is largely suppressed, such CAT-deficient mutants show wild-type characteristics, in terms of phenotype and tissue redox state (i.e., no oxidative stress). In addition to its role in photorespiration, CAT2 has been implicated in the modulation of leaf senescence and regulation of signaling through phytohormones (23, 50, 173, 177). Many of the phenotypic alterations and changes in gene expression observed in cat2 are related to alterations in signaling through phytohormones such as auxin, salicylic acid, and jasmonic acid (23, 50, 63, 64, 115, 130). Because stress intensity can be controlled in CAT-deficient plants by the manipulation of external conditions that affect H2O2 production through a physiologically relevant pathway (photorespiration), these lines offer interesting study systems for analyzing the function and outcome of oxidative stress, including the potential impact on cellular signaling pathways.
Response of Glutathione to Increases in Intracellular H2O2
The clearest biochemical redox change observed in the leaves of CAT-deficient plants is an accumulation of total glutathione, mainly in the form of GSSG (118). Both the phenotypes and the phytohormone signaling pathways triggered by the loss of CAT2 function in Arabidopsis seem to be dependent on this adjustment in glutathione status (63, 64, 115). Modifications of glutathione status are a conserved response to loss of the major leaf CAT, as they have also been reported in a CAT-deficient line of a barley mutant, isolated via a photorespiratory screen (172), and in tobacco transformants, in which leaf CAT expression was markedly decreased by antisense technology (202). Treating Arabidopsis cells and plants with the CAT inhibitor, 3-aminotriazole, also causes accumulation of glutathione as GSSG (107, 151). Accumulation of oxidized glutathione is also a well-documented response in plants undergoing stress such as ozone, cold, pathogens, or salicylic acid treatment (10, 36, 54, 93, 108, 164, 190).
Accumulation of GSSG in cat2 clearly points to compensatory adjustments in redox state as one of the players in H2O2 metabolism is removed. However, the pathways by which GSSG accumulates remain unclear, due to the complexity discussed in the previous section and the various possible routes through which glutathione oxidation might occur (152). In contrast to the GSSG accumulation observed in cat2 under moderate stress, ascorbate remains highly reduced, even if the total pool can be somewhat decreased (147). At first sight, this might suggest that glutathione oxidation triggered by increased availability of H2O2 is independent of ascorbate and occurs more directly through other GSH-oxidizing enzymes such as GPXL. However, as discussed in the preceding section, these enzymes are misleadingly named, as GSH is unlikely to be their physiological substrate. Although other enzymes could link H2O2 removal to GSH oxidation, several studies conducted on lines carrying mutations for both CAT2 and either APX or DHAR suggest that the ascorbate–glutathione pathway is the major route that operates to remove H2O2 when CAT is less able to do so (150, 192).
In addition to the ability of ascorbate to remain at wild-type reduction levels in cat2 (even when oxidative stress is evident from GSSG accumulation and induction of marker transcripts), H2O2 contents are also quite stable. Although one study described a twofold increase in H2O2 in cat2 (50), in our own work such reproducible increases have not been observed, with leaf H2O2 contents at most slightly or transiently increased in cat2 (130). However, there are difficulties surrounding the accuracy of H2O2 assays in plants (146) and, despite the continuing development and refinement of techniques to detect H2O2 and related molecules in planta (1, 38, 112, 161, 162), unambiguous information on H2O2 concentrations in optimal and stress conditions remains limited (48, 129). This is an important gap in our knowledge, because it restricts interpretation of the relationships between different biochemical pathways in plants, as well as the ability to predict or assess the properties of components that could be important in sensing and transmitting H2O2 signals.
A New Model of ROS Processing in Plants: Simulating Photorespiratory H2O2 Production and Metabolism
A model of the ascorbate–glutathione pathway in the chloroplast was published some years ago (143) and has since been refined (188, 189). These simulations allow calculation of the concentrations of compounds and fluxes of each step of the pathway as a function of factors such as light intensity, which accelerates production of superoxide by the photosynthetic electron transport chain. Although they have been useful in facilitating understanding of the operation of the pathway, they are confined to chloroplastic processes and do not consider the action of CAT. As already noted, the peroxisomal reactions of photorespiration can make a major contribution to metabolically produced H2O2.
The model we present here required coupling H2O2 processing to its production through the light-dependent photorespiratory pathway, which involves several subcellular compartments. In planta, with the possible exception of CAT, all the enzymes included in the model are found in more than one compartment, whereas all the metabolites [H2O2, ascorbate, glutathione, and NADP(H)] are also distributed across several locations, with their pools linked by the activities of transporters. Although some of these transporters are being identified (106, 123, 129), not enough is known about the properties of most of them to allow realistic parametrization in the model. Because of the lack of information on transport processes, we collapsed the modeled reactions of photosynthesis and photorespiration to a single compartment. This may not be too unrealistic, given that organelles such as the chloroplasts, peroxisomes, and mitochondria are often closely associated, particularly under conditions favoring metabolic pathways such as photorespiration (136). Nevertheless, we did introduce an element of subcellular compartmentation by considering the vacuole, which was conservatively estimated to represent 80% of the total cell volume. This was found to be necessary to produce accurate simulation of experimental data, as was the inclusion of the glutathione synthesis pathway, another novel aspect within the context of models of ROS metabolism.
To provide real-world constraints on the model outputs, ascorbate and glutathione were measured in samples from plants growing under our standard controlled-environment conditions, and the model was run throughout a repeated day–night cycle using these conditions in an attempt to simulate the responses of these antioxidants. The photoperiod used to obtain both the experimental and modeled data was 16 h light with 8 h darkness and, unless stated otherwise, the light intensity was 200 μmol·photons m−2·s−1, which drives photosynthesis at moderate rates. To introduce a degree of environmental realism and to facilitate smooth transitions in the model, the changes between light and dark were programmed gradually over a period of 2 h.
Although H2O2 can be produced by various reactions located at several subcellular sites, a significant source in the light is the photorespiratory GOX, a peroxisomal enzyme that oxidizes glycolate initially produced, as phosphoglycolate, by ribulose 1,5-bisphosphate (RuBP) oxygenation in the chloroplast (Fig. 3A). To allow calculation of the rate of RuBP oxygenation and photorespiratory H2O2 production, we used published models of the Calvin–Benson cycle and photosynthesis (39, 40, 183, 184) (see Appendix A1 for details). At an irradiance of 200 μmol·m−2·s−1, the calculated steady-state rates of net CO2 assimilation (A), intercellular CO2 concentration (Ci), and the ratio of carboxylation to oxygenation achieved in the middle of the photoperiod were 7 μmol.m−2·s−1, 288 μmol·mol−1, and 3.85, respectively. These realistic values produced a rate of RuBP oxygenation (photorespiration) that was about 30% of the rate of net CO2 uptake, A (Fig. 3B, top right), which is in good agreement with rates that are considered likely for plants growing in air at moderate irradiance (89). During the GOX reaction, O2 is reduced to H2O2. Assuming that all glycolate is metabolized by GOX, there should be a 1:1 relationship between glycolate production and H2O2 production.
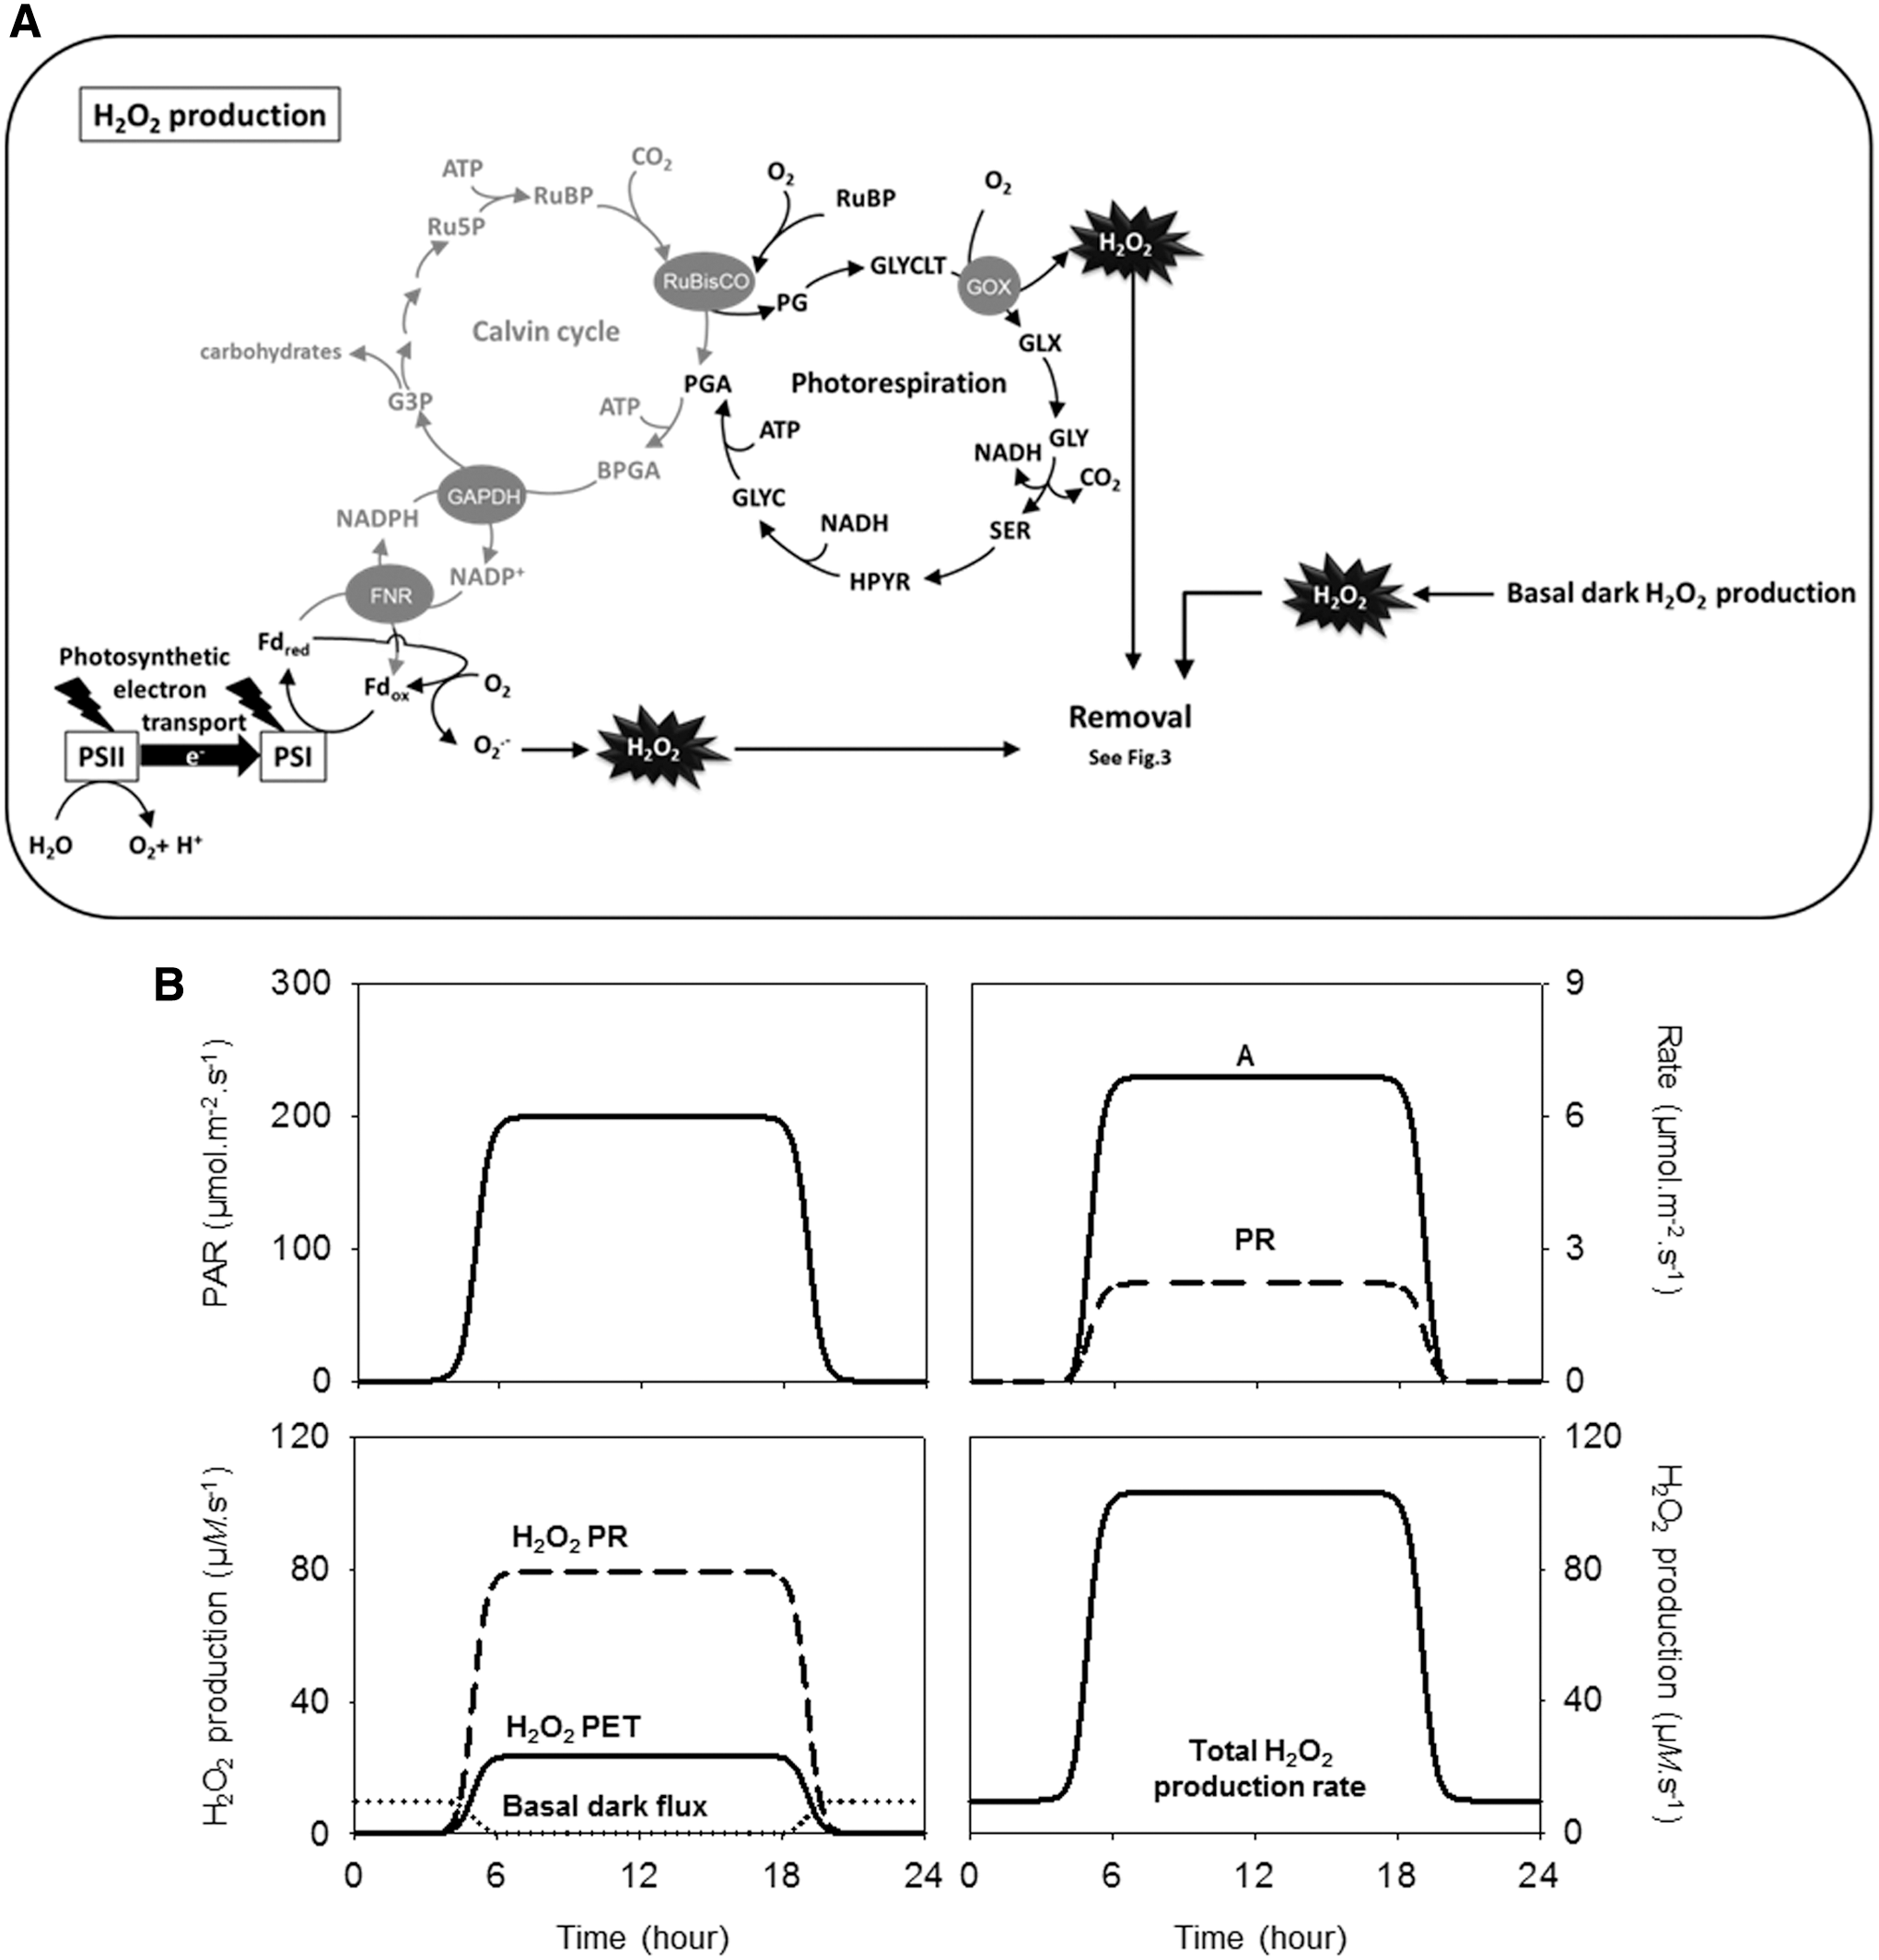
To avoid artificially considering photorespiratory H2O2 production in isolation, we introduced two other sources. First, H2O2 generation from superoxide produced by the photosynthetic electron transport chain was modeled as 1.5% of the total photosynthetic electron transport rate. This value is lower than some estimates in the literature but was chosen based on the assumption that photosynthetic control will prevent a high proportion of electrons going to O2 in the absence of a corresponding sink for protons (49). Second, a night-specific respiratory-dependent production of H2O2 was assumed (see Appendix 1 for details). The rates of H2O2 produced by the three sources are shown in Figure 3B, bottom. Photorespiration accounted for 77% of the total production in the light (Fig. 3B). This is consistent with a previous analysis that used a simpler method (134) to estimate photorespiratory rates from experimental measurements of net CO2 uptake (165). Production of H2O2 at the plasma membrane/apoplast is clearly important in developmental and stress signaling, although it is difficult to estimate ROS production by these systems in a quantitative manner that can be linked to photosynthetic activity. For this reason, they have not been included in the present model.
CAT and the Ascorbate–Glutathione System in the Control of H2O2 Accumulation
The three sources of H2O2 were considered to contribute to a single pool, to which we coupled the reactions of H2O2 removal (Appendix 1). In addition to modeling the rate of photorespiratory H2O2 production on the basis of well-established photosynthetic parameters, novel aspects were the operation of CAT and APX in parallel (unless stated otherwise), the introduction of NADPH-generating reactions through ferredoxin-NADP+ reductase (FNR) or NADP-dependent dehydrogenases, the inclusion of a redox-regulated glutathione synthesis pathway, and the introduction of compartmentation for GSSG, whose distribution between the vacuole and the rest of the cell was determined by a Class C ATP-binding cassette transporter (ABCC)-type transporter function (Fig. 4). This last factor took account of a differential intracellular distribution of the two forms of glutathione, with GSSG allowed to accumulate in both the vacuolar and extravacuolar compartments, and GSH confined to the latter.

Reactions were parametrized based on data available for extractable enzyme activities, substrate affinities (KM ), and likely concentrations for initial metabolite pool sizes (see Appendix 1 for details). Data for extractable enzyme activities were obtained by measurements on Arabidopsis or taken from literature data for this plant, and used to derive approximate Vmax values, after conversion using typical leaf protein contents and intracellular volumes. Substrate affinities (KM ) were obtained from the literature, also on Arabidopsis, if possible, assuming Michaelis–Menten kinetics. We note that this may cause data for some enzymes to be approximate, as will the assumption that the activities are not modulated by post-translational modification. Initial metabolite pool sizes were estimated based on available data as described in Appendix 1.
Although it is commonly accepted that H2O2 can be produced at high rates in plant cells, and that contents increase during stress conditions, there is considerable uncertainty about the range of concentrations found in plant cells. A survey of literature values shows considerable variability between studies, with reported tissue values for H2O2 often in the μmol·g−1 fresh weight (FW) range (146). Such values convert to global tissue concentrations in the mM range. By contrast, concentrations in animal cells are considered to be about one million times lower, in the nM range (170). The model constructed by Polle for the chloroplast ascorbate–glutathione pathway used an initial value of 0.5 μM, although H2O2 could reach very high (mM) values when antioxidant pools were depleted (143). A recent analysis that inferred H2O2 concentrations from CAT activities measured in vitro and calculated in vivo photorespiratory flux arrived at values of ∼10 μM (48).
To investigate H2O2 accumulation in our model, we coupled the reactions shown in Figures 3 and 4 and ran the model in the presence or absence of CAT activity. First, we examined H2O2 removal and accumulation as a function of light intensities between 25 and 200 μmol·m−2·s−1 (Fig. 5). When both CAT and APX were active, the percentage distribution of H2O2 removal between CAT and APX was about 60:40, increasing slightly toward CAT with light intensity as the H2O2 concentration moved somewhat closer to the K M value of APX for this substrate (Fig. 5A, left). In the absence of CAT, the ascorbate–glutathione pathway was able to deal with all the H2O2 produced, up to and including an irradiance of 200 μmol·m−2·s−1 (Fig. 5A, right).

The relationship between H2O2 concentrations and light intensity (photosynthetically active radiation) is shown in Figure 5B for these two conditions: CAT and APX working together or APX working alone. To calculate H2O2 concentrations, we considered two conditions: one in which the accumulated H2O2 is distributed evenly throughout the cell in both vacuolar and extravacuolar spaces (Fig. 5B, left) and the other in which it is confined to the outside of the vacuole (Fig. 5B, right), a space assumed to represent 20% of the total cell volume. This analysis revealed that, when both CAT and APX were operating at moderate light intensity (200 μmol·m−2·s−1), H2O2 concentrations did not exceed 1 μM (even distribution, left) or 5 μM (H2O2 confined outside the vacuole, right). Even at high light intensities that were sufficient to approach saturation of photosynthesis (800 μmol·m−2·s−1), H2O2 concentrations were about 2 μM (even distribution) or 10 μM (assuming negligible H2O2 in the vacuole; data not shown). When CAT capacity was set to 0, H2O2 concentrations were about fourfold higher (Fig. 5B). However, at an irradiance of 200 μmol·m−2·s−1, they still did not exceed 5 μM if an even distribution across the cell was considered (Fig. 5B, left).
From the mentioned model outputs, the following inferences are possible. First, even though CAT is sometimes considered in the literature to function principally at high H2O2 concentrations, this enzyme can make a substantial contribution to keeping H2O2 at low levels when production rates are high. Intracellular H2O2 concentrations are maintained at particularly low values if CAT and APX are both present: about 1 μM at moderate light and 2 μM at high light. Second, the amount of H2O2 that accumulates is extremely small compared with the rates of production and removal. The rate of total H2O2 production at 200 μmol·m−2·s−1 was about 100 μM · s−1 for a period of several hours (Fig. 3B, bottom right). Hence, the total accumulated H2O2 (Fig. 5B, left) did not exceed the amount that could be produced during 10 ms (1 μM; CAT and APX active) or 43 ms (4.3 μM; only APX active).
A third inference is that H2O2 increases when CAT is absent: in relative terms, this is quite significant (4.3-fold), but in absolute terms, H2O2 still remains in the low μM range, thanks to rapid metabolism through APX and the ascorbate–glutathione system. Indeed, the calculated concentrations would make only a minor contribution to typical H2O2 contents that are commonly reported in the literature, since global H2O2 accumulation (even distribution throughout the cell, Fig. 5B, left) would contribute ∼1 nmol·g−1 FW (active CAT) or 4.3 nmol·g−1 FW (no CAT) at a light intensity of 200 μmol·m−2·s−1. Explanations for this discrepancy could include preferential accumulation of H2O2 in the extracellular compartment, which is not considered in the model, as well as a possible overestimation of tissue contents caused by a lack of specificity in H2O2 assays (131, 146).
Although the model was able to run at light intensities up to 800 μmol·m−2·s−1 if CAT and APX were both present, the different pools (H2O2, ascorbate, glutathione, and NADPH) failed to equilibrate at irradiances much >200 μmol·m−2·s−1 when CAT was set to 0 (data not shown). With the enzyme capacities introduced for the ascorbate–glutathione system and associated reactions, the glutathione reduction state fell to 0. This is broadly consistent with data for the Arabidopsis cat2 mutant, which shows increasingly severe oxidative stress and dwarf phenotypes as growth irradiance increases (147, 191). However, the model when run without CAT may represent more extreme conditions than those occurring in planta in cat2, for several reasons. First, residual CAT activity exists in cat2 linked to CAT1 and CAT3, although it is not clear to what extent these proteins are found in photosynthetic cells (118). Second, other H2O2-metabolizing enzymes, such as PRX (7), may make a contribution, thereby conferring greater stability in planta. A third reason is that H2O2 production may be downregulated in plants in which H2O2 removal capacity is compromised (88, 159).
One other factor to take into account in comparing H2O2 concentrations predicted by the model with those that may occur in CAT-deficient plants is compensatory upregulation of antioxidative systems. This is well known to occur in response to oxidative stress, including stress caused by CAT deficiency. Indeed, transcripts for several ascorbate–glutathione pathway enzymes are upregulated when CAT is genetically or chemically decreased in plants (115, 150). Although this point was not explored in detail in this work, we did examine the effects of upregulation of APX. When the model was run with a twofold increase in APX capacity, to simulate the induction observed in oxidative stress conditions, steady-state H2O2 concentrations decreased threefold compared with the condition in which APX capacity was not changed when CAT was absent (Table 1). This underscores the potential importance of upregulation of H2O2-processing enzymes to maintain this oxidant at relatively low concentrations, confirming conclusions previously reported from models of the chloroplast ascorbate–glutathione pathway (143). When we adapted the model to include an induction of APX similar to that observed experimentally in cat2, removing CAT only produced a 1.4-fold increase in H2O2 concentrations (Table 1). Together, the analysis presented in Figure 5 and Table 1 suggests that increases in H2O2 in CAT-deficient plants are likely to be transient and/or minor (130), even if the ascorbate–glutathione pathway is the only player. Other H2O2-metabolizing systems, such as PRX, may contribute to even greater stability in intracellular H2O2 concentrations.
Calculated Effects of Increasing Ascorbate Peroxidase Capacity on Steady-State Concentration of H2O2 in the Presence and Absence of Catalase
The model was run at a PAR of 200 μmol·m−2·s−1 for 4 days with catalase (CAT) capacity set to 0 or 150 × 103 μM·s−1 (−CAT and +CAT, respectively). The two H2O2 concentrations at left and right refer to values calculated using the volume of the whole cell, including the vacuole (left), or assuming that H2O2 does not accumulate significantly in the vacuole (right). The upper two rows correspond to Figure 5B, final points on the curves (white symbols, +CAT; black symbols, −CAT). The bottom row simulates the same conditions for −CAT except that APX is assumed to be upregulated twofold in response to oxidative stress conditions such as the absence of CAT, as observed experimentally.
APX, ascorbate peroxidase; CAT, catalase; H2O2, hydrogen peroxide; PAR, photosynthetically active radiation.
In addition to effects observed in CAT-deficient plants, several studies have revealed an increased activity of APX in response to various abiotic stresses such as salinity, drought, metal toxicity, chilling, ultraviolet irradiation, or high concentrations of pesticides (16, 27, 101, 167, 168). APX is encoded by several genes in plants (nine in Arabidopsis), and studies of loss-of-function lines have shown that chloroplast and cytosolic isoforms act to counter stress in conditions such as high light, drought, heat, or treatment with ROS-generating agents such as methyl viologen (28, 94, 104, 127, 142).
Cytosolic APX activity may be particularly important in metabolizing H2O2 outside the chloroplast. Although the cytosol is not thought to be a major source of ROS, the cytosolic APX1 isoform responds strongly to different types of stress, including peroxisomal-derived oxidative stress in CAT-deficient plants (79, 115, 206). For these reasons, we parametrized the model using the properties of cytosolic APX. As the results indicate, APX shares a considerable part of the total H2O2 processing, even when CAT is active (Fig. 5A, left). It is unclear whether this is a fully accurate reflection of the in vivo situation, where CAT may be more concentrated in the peroxisomes and, perhaps, likely to process a bigger share of the H2O2 produced in this compartment. Nevertheless, when CAT is absent or low, the cytosolic ascorbate–glutathione system probably plays a key part, as indicated by several studies of plants deficient in CAT (115, 150, 151, 192). Hereunder we discuss the consequences for ascorbate and glutathione status.
Simulating Ascorbate and Glutathione Responses to H2O2
Even though ascorbate and glutathione are often considered to work together, the extent to which they are redox coupled in vivo is still not clear (46). One of our main aims in this work was to develop a model that was able to accurately reproduce the status of ascorbate and glutathione pools in optimal and oxidative stress conditions over a time course involving several light–dark cycles. With the model, we were able to calculate the cellular concentrations over time of ascorbate and glutathione, as well as their reduced and oxidized forms and, therefore, their redox states. We sought to adjust the model to a configuration that was able to reproduce the status of both ascorbate and glutathione observed in both Arabidopsis wild-type (Col-0, no oxidative stress) and the CAT-deficient oxidative stress model, cat2.
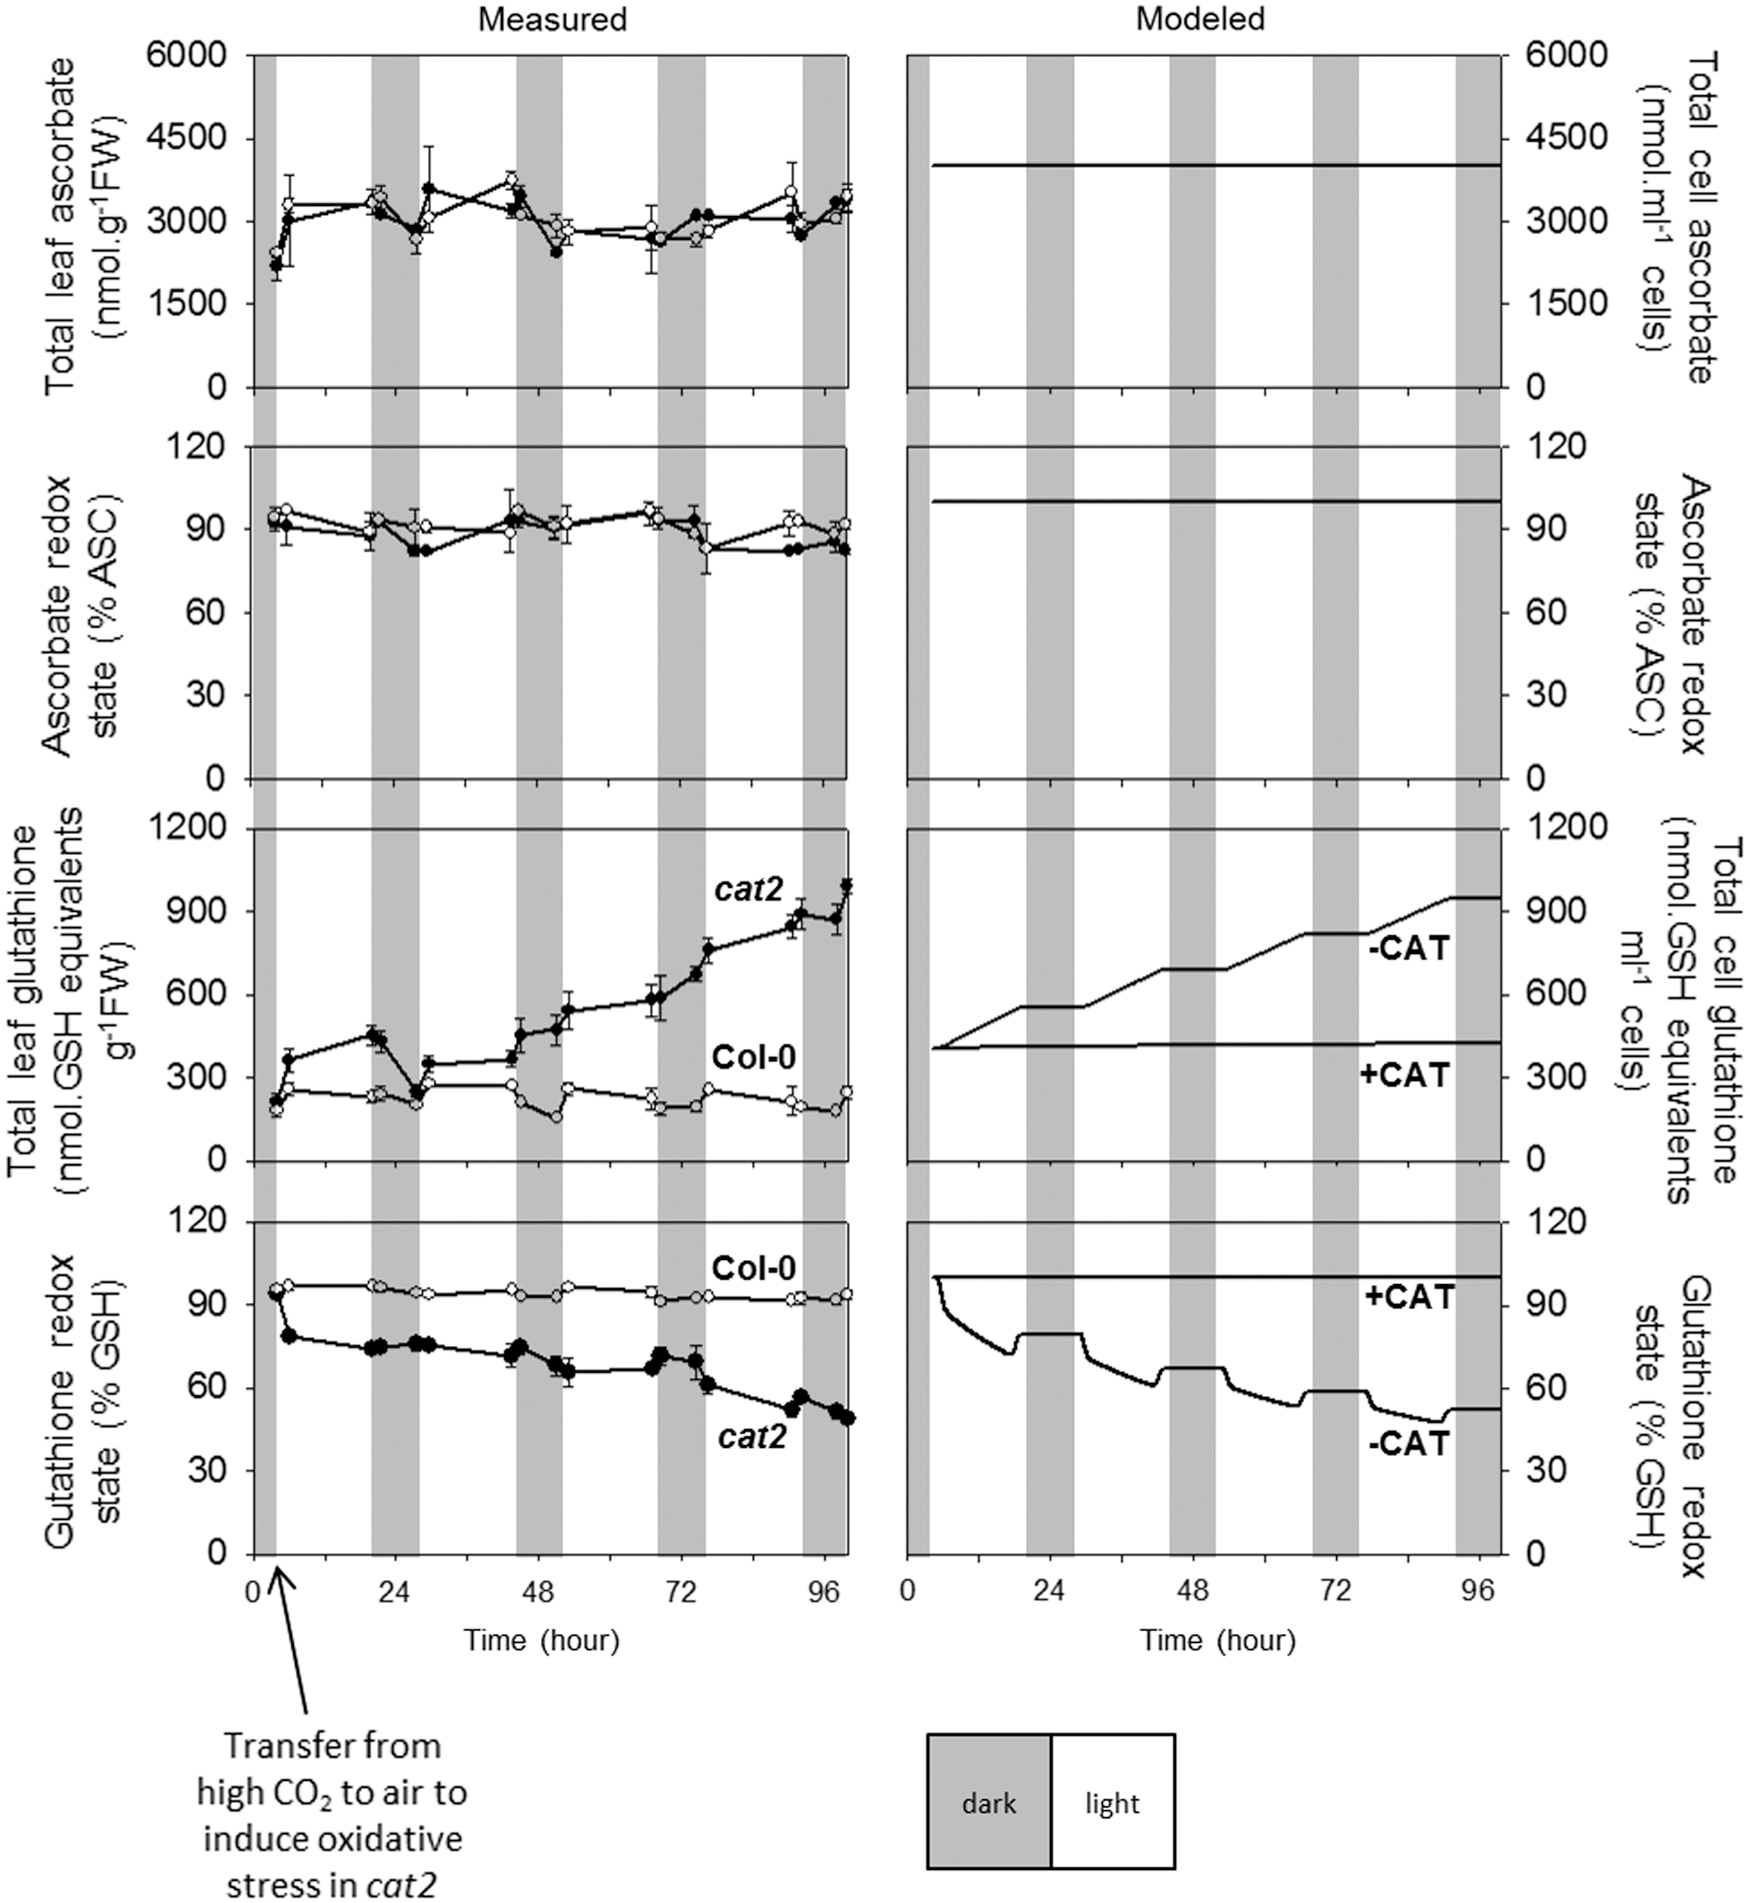
For this, a detailed experimental analysis of ascorbate and glutathione status was performed in the two lines. In brief, we grew plants at high CO2, where photorespiration is suppressed and cat2 does not suffer oxidative stress. After 3 weeks of growth, plants were transferred to air to allow production of H2O2 through the photorespiratory pathway. Samples were taken at several points throughout the day–night cycle, and ascorbate and glutathione contents and redox state were measured (see Appendix 2 for experimental details).
These analyses revealed that no significant differences were observed in total ascorbate between Col-0 and cat2 (Fig. 6, top left panel). Furthermore, in both lines, ascorbate was maintained in a highly reduced state (Fig. 6, left). In contrast to ascorbate, glutathione became progressively oxidized and accumulated in cat2 but not in Col-0 after transfer to air (Fig. 6, left panel, lower frames). These detailed results are in good agreement with previous data produced for plants growing at moderate irradiance, in that they confirm the stability of ascorbate status and the accumulation of GSSG in CAT-deficient lines when they are placed in conditions that favor photorespiration (63, 115, 172, 202).
These experimental observations on plants were used as real-world constraints on the modeled data. These constraints can be summarized as follows. First, both ascorbate and glutathione should remain highly reduced when CAT is active. Second, ascorbate should remain highly reduced even when CAT is absent. Third, glutathione should accumulate, mainly as GSSG, when CAT is absent. The values calculated for H2O2 concentrations already described for a moderate irradiance of 200 μmol·m−2·s−1 (Fig. 5) were obtained when the model was configured to meet these three constraints.
To allow the modeled concentrations for ascorbate and glutathione to be compared with the experimentally observed results (expressed in nmol·g−1 FW), we converted them to amounts in terms of nmol·mL−1 cells. The term “nmol·mL−1 cells” was preferred to μM because the model incorporates two intracellular compartments with heterogeneous volumes and GSSG concentrations. These were the vacuole, in which GSSG but not GSH can accumulate, and the extravacuolar space, in which both GSH and GSSG are found. This compartmentation was introduced based on our previous results showing that the vacuole accounts for a significant part of the accumulated GSSG in cat2 (133, 148). Hence, tonoplast transporters of the ABCC type (90, 153), which are known to be competent for import of GSSG (100, 179), were introduced into the model.
Allowing for some variation in the experimental data, the model is able to reproduce with reasonable fidelity the constancy in both the amount and redox state of ascorbate in Col-0 and cat2. Similar to the experimental observations for ascorbate (Fig. 6, upper left panels), the two modeled traces could not be distinguished (Fig. 6, upper right panels). Likewise, for glutathione, the model was able to output data simulating the plant response. In the +CAT simulation (right), corresponding to measured data in Col-0 (left), glutathione contents remained stable and the reduction state high after transfer to air (Fig. 6). In the −CAT condition (right), simulating experimental analysis of cat2 (left), glutathione progressively accumulated for the 4 days, and this was accompanied by a progressive drop in the reduction state to ∼50% (Fig. 6).
To check the model's capacity to accurately simulate photorespiration-dependent changes in glutathione in cat2, we compared its outputs in air and at the high CO2 concentrations used in our growth chambers. High CO2, which largely abolishes photorespiration, decreased H2O2 and glutathione in −CAT simulations to values close to those observed in +CAT simulations in air (Fig. 7). Assuming no compensatory induction of APX (Table 1), H2O2 in the −CAT condition is predicted to be about fourfold higher than in +CAT in air or about fivefold higher than in −CAT at high CO2 (Fig. 7). These relatively modest changes are accompanied by much more dramatic photorespiration-dependent accumulation of GSSG in −CAT. The absence of CAT increases extravacuolar GSSG concentration ∼1600-fold when the model is run in air (−CAT compared with +CAT). Differences in GSSG in −CAT in air and at high CO2 are even more marked: ∼2300-fold higher in air than at high CO2 (Fig. 7). In contrast to H2O2 and glutathione, ascorbate status is not substantially impacted by CO2 level or CAT (data not shown), in agreement with the experimental data (Fig. 6).

Pathways of Glutathione Oxidation and Light-Dependent Regulation of Ascorbate Synthesis
Configuring the model to accurately simulate the experimental data required numerous sensitivity analyses in which the effects of modifying different parameters were examined. We discuss some of the key factors in this and the following sections.
Although several classes of GSH-dependent enzymes could potentially be involved in H2O2 processing independent of the ascorbate pool (152), our data suggest that they are not necessary to reproduce experimental observations. Real-world responses of glutathione could be reproduced with a fair degree of accuracy without assuming ascorbate-independent pathways of glutathione oxidation. By contrast, modeling of redox-regulated glutathione synthesis and ABCC transporter-mediated uptake into the vacuole, where reduction of GSSG to GSH is thought to be negligible, proved to be essential to produce a good approximation of the experimental data.
Although we incorporated the pathway of glutathione synthesis, we did not introduce ascorbate biosynthesis. The fundamental reason for this was that ascorbate status is not significantly altered in either Arabidopsis wild-type or cat2 grown at constant moderate irradiance (Fig. 6). This is in line with the lack of literature evidence for a strong effect of increased H2O2 on ascorbate biosynthesis. By contrast, it is known that irradiance is an important factor determining ascorbate contents, due to light regulation of the synthetic pathway (35, 52, 55, 171). The biological importance of this response may be related to the role of ascorbate as a chemical scavenger of ROS that are produced in the chloroplast through light-dependent reactions, as a regenerator of tocopherol or as a cofactor in zeaxanthin production, reactions that are involved in the dissipation of excess excitation energy and the deactivation of singlet oxygen in the thylakoid membrane (42, 60, 126).
Because our main aim was to model the ascorbate–glutathione pathway at a single irradiance, we did not consider light regulation of ascorbate contents. Nonetheless, changes in total ascorbate contents and redox state have been reported in Arabidopsis during the day–night cycle, with ascorbate accumulating and becoming more oxidized throughout the day (35). Such changes may be dependent on the growth photoperiod and/or irradiance, because in our conditions (16 h photoperiod, 200 μmol·m−2·s−1), they are much less apparent in either the wild-type or cat2. Increases in total ascorbate contents throughout the photoperiod were at most relatively minor, and the reduction state remained at a fairly constant value of 90% in both genotypes (Fig. 6, left, upper two panels).
Impact of H2O2 Processing on the Modeled Glutathione Redox Potential
Glutathione status is considered to be a key factor in the regulation of plant cell function (95, 111, 132). Although the processes that perceive and transmit glutathione status remain to be fully elucidated, one influential factor could be the redox potential, which may be sensed by proteins such as GRX.
Most of the cellular glutathione that accumulated according to the model and most of the modeled effect on the global redox state (Fig. 6, right) were due to transport of GSSG into the vacuole. This recapitulates, at least in part, experimental observations in CAT-deficient plants (148). If this vacuolar GSSG is taken into account in calculating the glutathione redox potential (i.e., measured whole-tissue GSH and GSSG contents are considered), values for this factor can reach very positive values (133). However, one of the functions of GSSG sequestration in the vacuole may be to avoid an excessively oxidizing glutathione redox potential in other compartments (178), where it could otherwise interfere with protein folding and cell proliferation. Hence, on the assumption that the vacuolar GSSG pool is not likely to contribute to the functional impact of changes in the glutathione redox potential, we restrict our discussion hereunder to how the model computes changes in this factor in the extravacuolar compartment.
Measurements using in vivo probes (redox-sensitive GFP) suggest that the glutathione redox potential in compartments such as the chloroplast, mitochondria, peroxisomes, and cytosol is low, that is, highly reducing (of the order of −300 mV) (18, 85, 112, 161). This implies that GSSG concentrations remain several orders of magnitude lower than GSH concentrations.
When the model was run in the presence of both CAT and APX, conditions in which the ascorbate–glutathione pathway was responsible for about 40% of H2O2 processing (Fig. 5A, left), the glutathione redox potential of the extravacuolar compartment remained at values between approximately −350 mV (dark) and −300 mV (light). Interestingly, this effect points to a possible impact of light-dependent H2O2 production on the redox potential in photosynthetic cells, although the potential remained at negative values that are consistent with those reported experimentally (18, 161).
When the model was run without CAT, the higher load on the ascorbate–glutathione pathway caused the redox potential to fall to around −210 mV. This is somewhat less negative (more oxidizing) than values reported for stressed plants (85, 112), possibly reflecting the stronger glutathione oxidation linked to absence of CAT function compared with conditions such as wounding and drought. Nevertheless, despite the accumulation of GSSG in the absence of CAT function, GR activity was able to maintain GSH as the predominant form. In this condition, the extravacuolar GSSG concentration was calculated to be 117 μM, and the extravacuolar GSH:GSSG ratio ∼19.
Regulation of Glutathione Synthesis
In addition to including GSSG accumulation in the vacuole, accurate simulation of oxidative stress-induced changes in glutathione required introduction of the synthesis pathway from glutamate (Glu), Cys, and glycine (Gly) (Fig. 4). Preliminary analyses in which the model was run without equations to describe glutathione synthesis revealed, unsurprisingly, that no glutathione accumulation occurred and that GSH was quickly depleted, as it was converted, via oxidation and transport, into GSSG that was largely localized in the vacuole.
In conditions favoring oxidation, the synthesis of glutathione is regulated by several processes involving the activation of cysteine and glutathione production at transcriptional and post-translational levels (10, 74, 149). We considered three potentially important regulation points in the model: (i) the feedback inhibition of γ-glutamylcysteine synthetase (γ-ECS) by GSH, (ii) the redox-dependent activation of γ-ECS by thiol–disulfide exchange, and (iii) the availability of cysteine. For the first factor, a competitive inhibition term was incorporated into the equation describing γ-ECS activity (56, 109), based on the K i values previously reported for the tobacco and Arabidopsis enzymes (72, 80). Together with the redox-regulation term, the feedback inhibition was necessary to avoid unrealistic accumulation of GSH (reduced form) in the simulation.
To introduce redox regulation of γ-ECS, we considered studies that have revealed an activation of the enzyme by the formation of reversible disulfide bonds (72, 80). Although the mechanistic nature of the links between cell redox status and γ-ECS activation state is not fully elucidated, we assumed for the purposes of the model that the enzyme would be responsive to the glutathione redox potential. Although such a response may be less direct in vivo, a link between glutathione redox potential and activation of the synthesis pathway is consistent with experimental studies in which a conversion of GSH to GSSG is accompanied by accumulation of total glutathione (e.g., Fig. 6, left, lower panels). Hence, we introduced into the model a redox-sensitive activation factor for γ-ECS in which the enzyme becomes progressively more active as the extravacuolar glutathione redox potential becomes less negative (Appendix 1, Eq. [18]). This equation describes a sigmoidal function for the activation state of the enzyme, which increases as the glutathione redox potential becomes more positive, with a midpoint potential for 50% activation of −220 mV.
Figure 8A shows the glutathione redox potential throughout the light–dark cycles in the presence (+CAT) and absence (−CAT) of CAT. To examine the influence of redox regulation of γ-ECS on glutathione accumulation triggered by the absence of CAT, the model was first run without regulation. When γ-ECS was always inactive (activation by glutathione redox potential set to 0), no accumulation of glutathione, either as GSH or GSSG, was observed. When the enzyme was assumed to be always fully active (activation by glutathione redox potential set to 1), relatively high γ-EC concentrations were rapidly attained at the beginning of the time course, and they decreased progressively as feedback inhibition of γ-ECS became stronger (Fig. 8B). The reason for this progressive inhibition was an accumulation of GSH in the extravacuolar space to reach more than twofold the initial value (reduced form; Fig. 8B, lower right panel). We considered this effect unrealistic because it is not observed in CAT-deficient plants, in which GSSG accounts for the overwhelming part of the accumulated glutathione. Linking the activation state of the enzyme to the glutathione redox potential corrected this slow increase in GSH (Fig. 8B, lower right panel). In this condition, glutathione accumulated, largely as vacuolar GSSG, and the curves shown for total glutathione and redox state in Figure 6 were obtained (Fig. 6, lower right panels, −CAT).
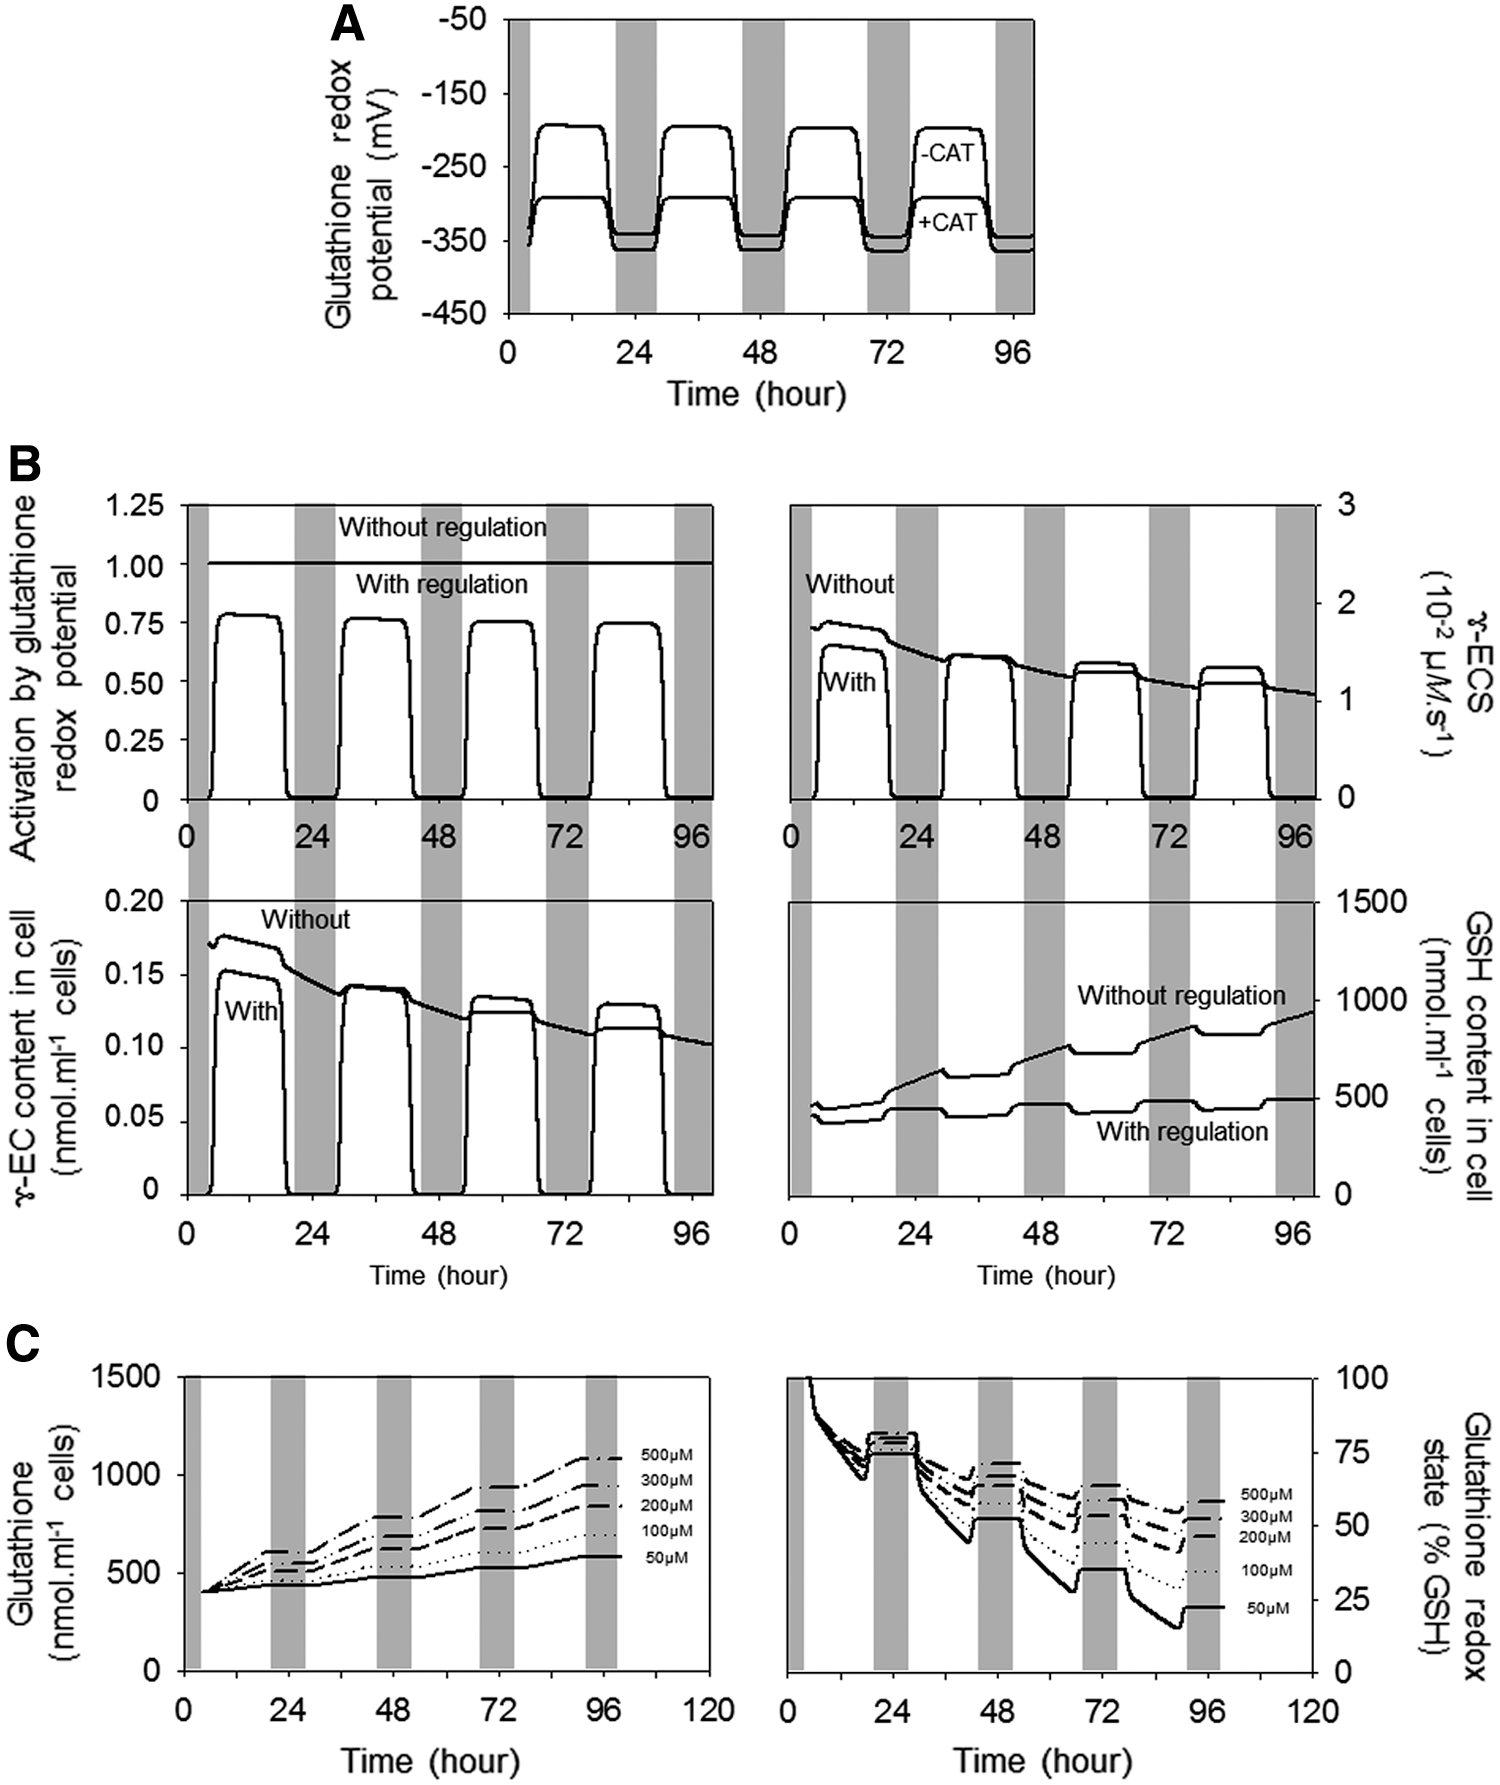
In the case where both CAT and APX were active, the modeled configuration for γ-ECS led only to a slight (5%) increase in total glutathione (Fig. 6, right). This was because, even in the presence of light-dependent H2O2 production, the glutathione redox potential remained less than −300 mV (Fig. 8A) and so γ-ECS remained largely inactive (data not shown). Hence, the model configuration was able to approximate both the substantial changes in glutathione in cat2 and the stability of glutathione in the wild-type.
Glutathione synthesis is also promoted by increases in Cys (10, 19), with several studies having shown that an increase in Cys is associated with an increase in GSH content (66, 110, 205). It is well documented that plant glutathione content is increased by artificial addition or augmentation of cysteine (14, 15, 58, 67, 209, 210) or by overexpression of genes and enzymes involved in cysteine synthesis (67, 135, 135a, 204). Furthermore, short- or long-term blockage of the first stage of glutathione synthesis leads to a cysteine accumulation of up to 300% in some cell compartments (91), indicating that significant amounts of cysteine are used for glutathione synthesis.
We examined the influence of Cys concentrations within the physiological range, assuming that the K M value of γ-ECS for this substrate is 1.6 mM, as reported for the Arabidopsis enzyme (80). The simulations revealed that Cys concentration was influential in determining both the total accumulation of glutathione (Fig. 8C, left) and the glutathione redox state (Fig. 8C, right). Relatively high concentrations were found to be necessary to reproduce the experimental data in the absence of CAT (Fig. 6). Strongly limiting Cys concentrations, such as 50 μM, prevented the accumulation of total glutathione observed in planta (Fig. 8C, left) and, interestingly, also caused the reduction state to fall to unrealistically low values (Fig. 8C, right). This underscores the importance of the activation of Cys synthesis during oxidative stress conditions, in line with reports on the cat2 mutant and on Arabidopsis exposed to higher atmospheric ozone levels (10, 149).
The Key Role of MDHAR in Determining Glutathione Oxidation
In the ascorbate–glutathione pathway, several routes can regenerate ascorbate for APX activity. In addition to those shown in Figure 4, ferredoxin may also reduce MDHA back to ascorbate in the chloroplast (124). Because our analysis was focused primarily on a process that produces H2O2 outside the chloroplast (photorespiration), we considered NADPH- and GSH-dependent processes that involve reduction of MDHA and DHA, respectively. MDHAR is an effective system for recycling ascorbate, and is often upregulated in stress conditions. For example, increases in MDHAR activity and induction of the Arabidopsis genes encoding the cytosolic isoforms (MDHAR2, MDHAR3) in the cat2 mutant are consistent with an important role for the cytosolic isoforms of MDHAR in oxidative stress responses (151). Furthermore, genetic manipulation of MDHAR expression levels can influence ascorbate status and plant stress resistance (37, 84, 174).
Despite the efficiency of MDHAR, any MDHA that escapes reduction can spontaneously dismutate to produce ascorbate and DHA, with reduction of the latter to ascorbate requiring glutathione, either chemically or to support DHAR activity. It should be noted that our model, like previous models (143), included both enzyme-dependent and enzyme-independent reactions for DHA reduction by GSH (Appendix 1). As noted in previous sections, when CAT and APX were both active, APX accounted for ∼40% of H2O2 processing (Fig. 5A), and both ascorbate and glutathione remained highly reduced (Fig. 6, right, +CAT). In this case, >99% of the ascorbate regeneration occurred through MDHA reduction. Hence, the glutathione pool played a very minor role in supporting ascorbate-dependent H2O2 processing when both CAT and APX were active. In these conditions, glutathione redox turnover was very slow.
A previous modeling study underscored the influence of MDHA reduction in determining redox coupling between ascorbate and glutathione (143). Our model agrees with this earlier analysis and suggests that MDHAR is a key fulcrum that determines the degree of glutathione oxidation linked to APX-dependent H2O2 processing, particularly in oxidative stress conditions. To test this, we examined the effect of modest changes in the capacity of MDHAR in the −CAT condition, when flux through APX is high. At MDHAR capacities approaching the APX capacity, the flux of MDHA dismutation, and thus the flux through the glutathione pool, was relatively small (Fig. 9A). When MDHAR capacity was decreased from 170 to 120 μM·s−1, enhanced MDHA dismutation produced DHA at higher rates, engaging the glutathione system (Fig. 9B). Consequently, the MDHAR capacity was a key factor determining the accumulation and redox state of glutathione (Fig. 9C).
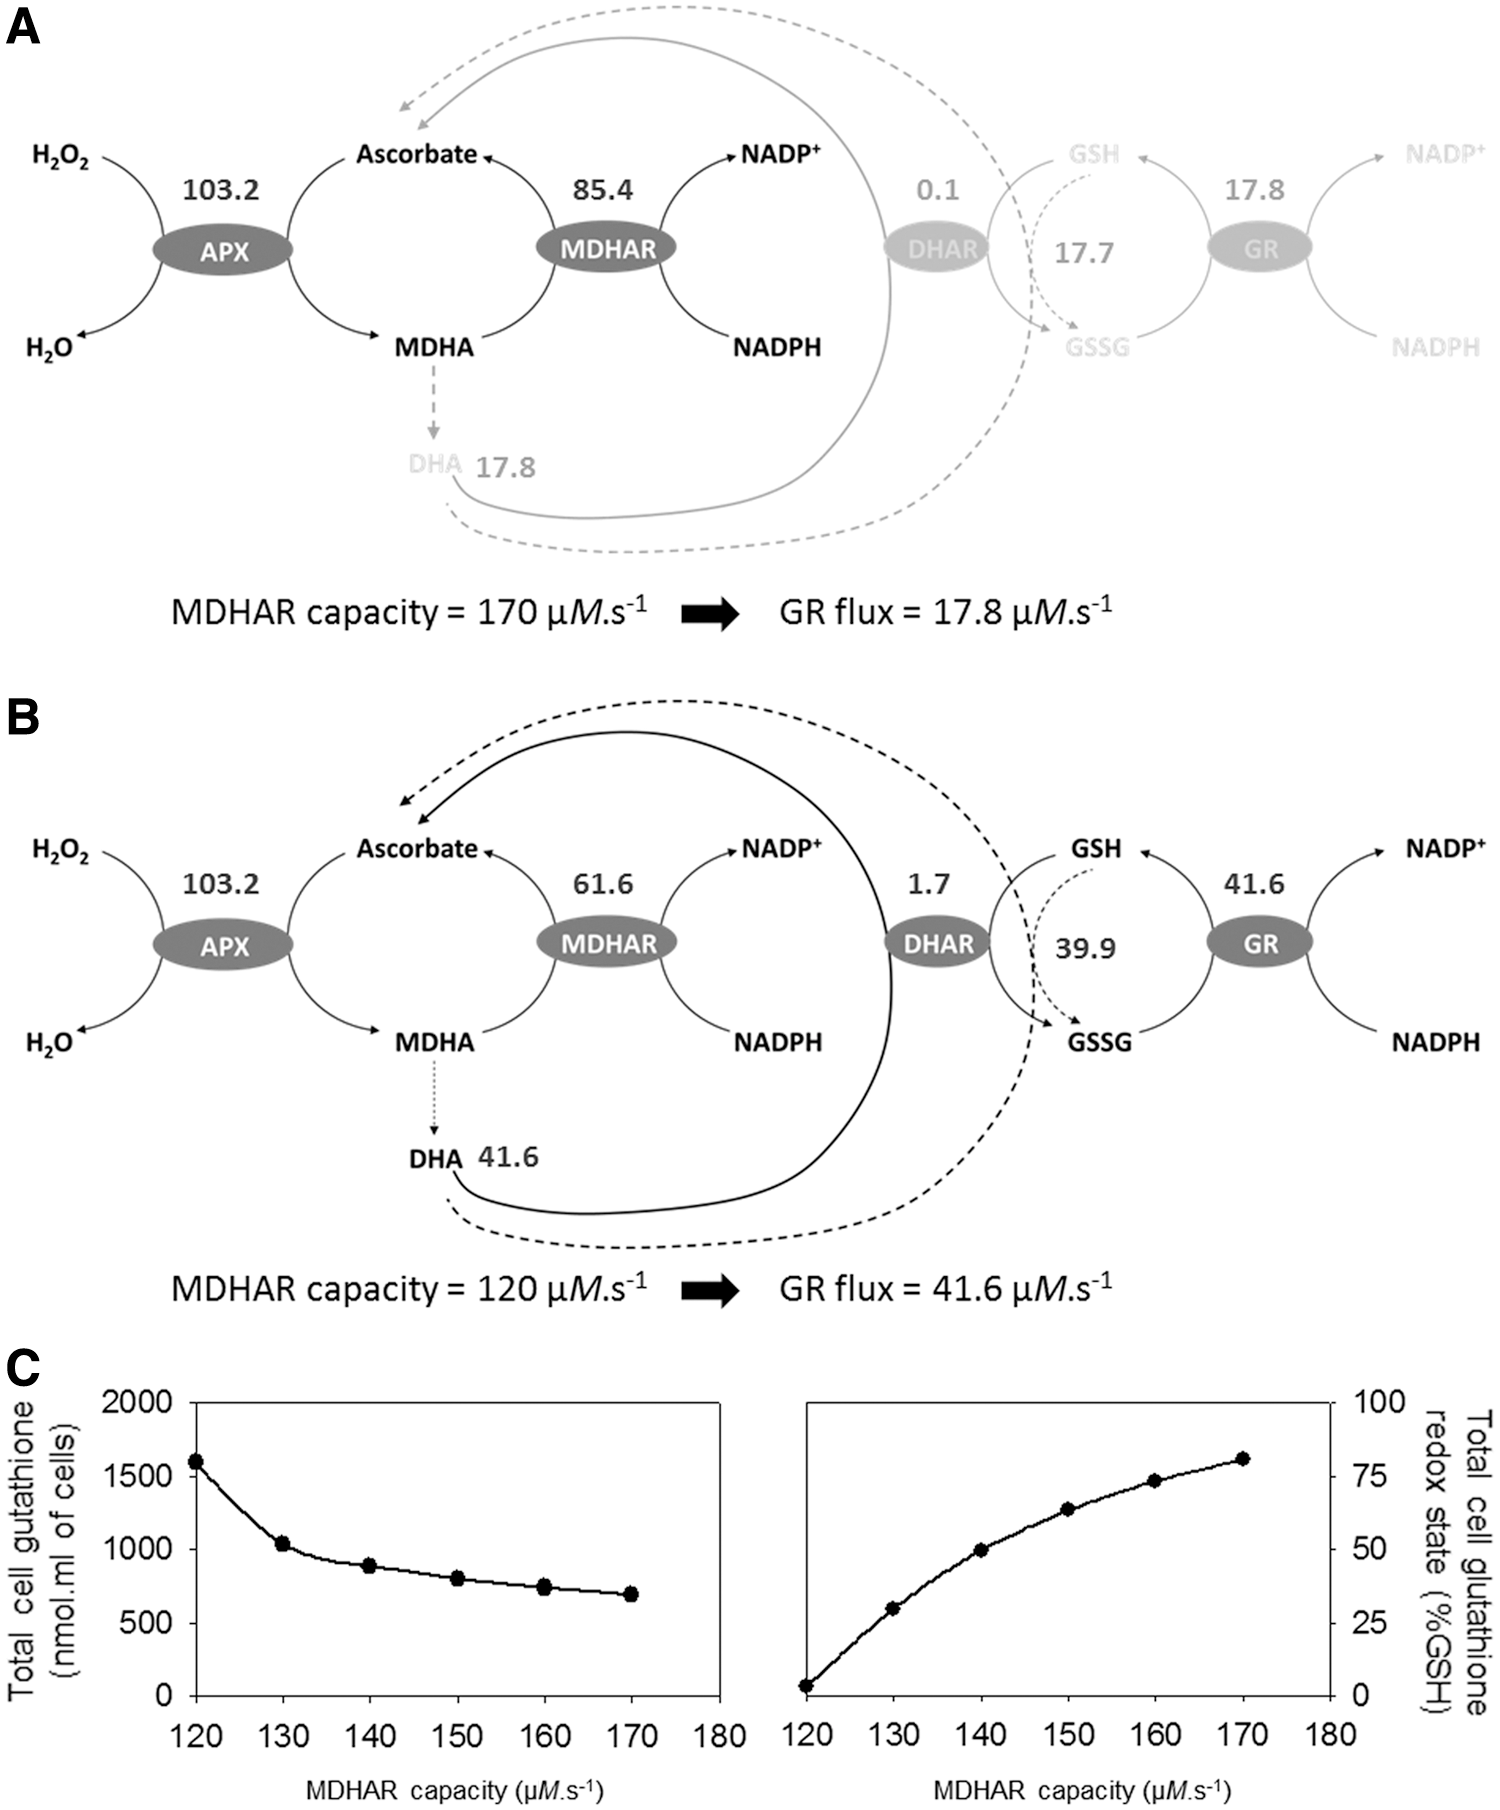
The curves shown on the right of Figure 6 were produced using an MDHAR capacity of 140 μM·s−1. At values lower than this, more glutathione accumulated (as GSSG), whereas at higher MDHAR capacities, accumulation of glutathione remained at values less than those observed experimentally. Hence, our observations agree with those of Polle (143), who suggested that the coupling between ascorbate and glutathione pools is likely to be low when MDHAR capacity is high, as this acts as a “bottleneck” that prevents DHA formation. This effect seems to be particularly important when flux is high, in oxidative stress conditions. Modifying the MDHAR capacity in the +CAT condition, where flux through ascorbate is relatively low, did not greatly affect the model outputs (data not shown).
Low NADPH Triggers Glutathione Oxidation by Limiting MDHAR But Not GR
NADPH is an essential electron donor in many enzymatic reactions, including the ascorbate–glutathione pathway. We, therefore, investigated the effect of varying NADPH concentrations on the functioning of the pathway. We focused on the condition without CAT, to drive high rates of flux through APX and to simulate an oxidative stress condition. The model was run with total NADP(H) at values between 42.5 and 100 μM, and fluxes and other factors were plotted against the steady-state concentration of the reduced form, NADPH (Fig. 10). Altering the NADP(H) concentration within this range had a negligible effect on the accumulation of H2O2 (data not shown), but it strongly impacted the content and the redox state of glutathione. When the NADPH concentration was ∼26 μM, glutathione accumulated to high levels (Fig. 10, middle left), almost all as GSSG (Fig. 10, middle right). In this condition, the total cell glutathione redox state was only 8% GSH (Fig. 10, bottom left), and the extravacuolar glutathione redox potential rose to −142 mV (Fig. 10, bottom right). These extreme responses were progressively diminished as the NADP(H) pool was increased. At an NADPH concentration of 84 μM, oxidation and accumulation of glutathione were very small (Fig. 10). The NADPH concentration required to simulate the experimentally observed effects on glutathione (Fig. 6) was intermediate between these two values (34 μM).

These observations suggest that high concentrations of NADPH can antagonize glutathione oxidation during oxidative stress. This may be considered to be unsurprising, given the role of NADPH as a source of reductant for the ascorbate–glutathione cycle. But how does it occur? In the ascorbate–glutathione pathway, two enzymes require NADPH: MDHAR and GR. We examined how the flux through these two enzymes depends on NADPH availability (Fig. 10, top panels). At high NADPH, 90% of the flux through APX was supported by MDHAR, with GR playing only a minor role (Fig. 10, top right). As NADPH decreased, MDHA dismutation increased (Fig. 10, top left) and GR became progressively engaged (Fig. 10, top right). Hence, although studies of Arabidopsis mutants show that the capacity of GR can limit GSSG reduction during oxidative stress (115), the model suggests that conditions in which GR is limited by NADPH are likely to be rare. This is not only because of the low K M of GR for NADPH (∼5 μM) but also because MDHAR has a significantly higher K M (∼30 μM). Hence, in conditions wherein NADPH becomes limiting, MDHAR should be NADPH limited before GR is affected. This favors MDHA dismutation, DHA production, and hence GSH oxidation. The net effect is increased production and increased concentrations of GSSG that, unlike NADPH, are limiting for GR activity. This explains why, as NADPH concentration decreases within the physiologically realistic range that we examined, the model predicts progressive increases in glutathione oxidation state, GSSG accumulation, and, as a result, GR activity (Fig. 10).
NADPH-Generating Dehydrogenases and the Ascorbate–Glutathione Pathway
It should be noted that the influence of NADPH on flux distribution in the pathway (Fig. 10) involved a limiting minimum value (∼26 μM) that was required for the model to equilibrate and to output realistic data when CAT function was absent. Less than this value, GSH was depleted because of excessive production of DHA from MDHA dismutation.
Given this crucial role of NADPH, we analyzed the importance of NADPH-generating enzymes. Plants contain several such enzymes but the most important in terms of capacity include the photosynthetic FNR, which is reduced by photosynthetically generated ferredoxin, and several NADP-dependent dehydrogenases that oxidize metabolic substrates. The latter include the two dehydrogenases of the oxidative pentose phosphate pathway (OPPP), isocitrate dehydrogenase (ICDH), and a cytosolic NADP-dependent glyceraldehyde 3-phosphate dehydrogenase (G3PDH). These and other NADPH-generating dehydrogenases have received some attention for their roles in the response to increased ROS availability. For example, activities of ICDH and glucose-6-phosphate dehydrogenase (G6PDH) were upregulated in olive plants in response to salt stress (187). Other data on gene expression and proteomics provided evidence that ICDH expression is influenced by stresses, including salt and cadmium (82, 97, 98, 102, 157, 187). More direct analysis using loss-of-function has thrown light on the importance of some of these enzymes in the response of plants to oxidative stress (29, 33, 99, 113, 114, 116, 155, 196). Some of these studies suggest an apparent redundancy between the different NADPH-generating enzymes, and studies on organisms such as yeast also indicate overlapping roles. A double yeast mutant for G6PDH and cytosolic ICDH showed a loss of viability due to the accumulation of intracellular oxidants that was not observed in the single mutants (119).
We used the model to explore the potential relative importance of these NADPH-producing enzymes. Although explicit compartmentation between the chloroplast and cytosol was beyond the scope of the present version of the model, we did introduce a constant basal contribution from the stromal FNR linked to the photosynthetic electron transport chain. Thus, although most of the flux through FNR was linked to NADPH production for the glyceraldehyde 3-phosphate dehydrogenase of the Calvin–Benson cycle (Fig. 3), a small part was allocated to NADPH production for H2O2 processing (Appendix 1).
In addition to FNR, we considered NADPH production by the OPPP, ICDH, and G3PDH, parametrizing these enzymes where possible using available data for the capacities and kinetic properties of the cytosolic isoforms (Appendix 1). A sensitivity study in the absence of CAT revealed an inverse correlation between the minimum concentration of total NADP(H) required for the model to equilibrate and the number of NADPH-producing dehydrogenases (Table 2). Thus, although a total NADP(H) concentration of ≥42.5 μM allowed the model to achieve stability when all enzymes were present, this value increased to 80 μM when the two dehydrogenases of the OPPP were functioning alone (Table 2). It is notable that the OPPP was required in all cases, that is, the model would not equilibrate with only ICDH, only G3PDH, or only these two enzymes together. Thus, as might be anticipated, a small pool of NADP(H) could be compensated by increasing the capacity for regeneration of NADPH from NADP+.
Minimum Values of Total NADP Pools (NADPH+NADP+) Required to Achieve Stability in the Model in the Presence of Different NADP-Regenerating Systems
The model was run at a PAR of 200 μmol·m−2·s−1 for 4 days with CAT capacity set to 0. Numbers in the table indicate, for each condition, the values below which GSH concentrations achieved negative values and metabolite pools failed to equilibrate.
G3PDH, cytosolic NADP-dependent glyceraldehyde 3-phosphate dehydrogenase; ICDH, isocitrate dehydrogenase; OPPP, oxidative pentose phosphate pathway.
We next examined the flux distribution between each NADPH-generating enzyme or pathway and the impact of removing each of them on the glutathione accumulation in oxidative stress conditions. For this, the irradiance was set at 200 μmol·m−2·s−1, and a total NADP(H) concentration of 80 μM was set as a constant, so that all the conditions listed in Table 2 could be modeled. In the steady state, fluxes of NADPH production can be directly compared with fluxes of H2O2 consumption by APX activity, since both NADPH production from NADP+ and H2O2 reduction to water involve two-electron exchanges.
In the presence of both CAT and APX, the production of NADPH to support the ascorbate–glutathione pathway (total flux of 40 μM·s−1) (Fig. 5A, left) was distributed fairly equally between FNR (16 μM·s−1), the OPPP (12 μM·s−1), and the ICDH (10 μM·s−1), with G3PDH making a smaller contribution (Fig. 11A, left). When CAT was removed, total flux through the ascorbate–glutathione pathway increased to 103 μM H2O2·s−1 (Fig. 5A, right). In this oxidative stress condition, in which FNR was held constant at 16 μM·s−1, the remaining flux of 87 μM·s−1 was shared between the three other NADPH-producing pathways (Fig. 11, top, second panel from left). As a result, all three showed a significant increase in flux compared with the +CAT condition, with the biggest relative increases observed for the OPPP (4.75-fold) and the G3PDH (fourfold). Removing ICDH, G3PDH, or both increased the flux through the OPPP until this pathway was supporting all of the flux apart from the basal contribution from FNR (Fig. 11A, extreme right).
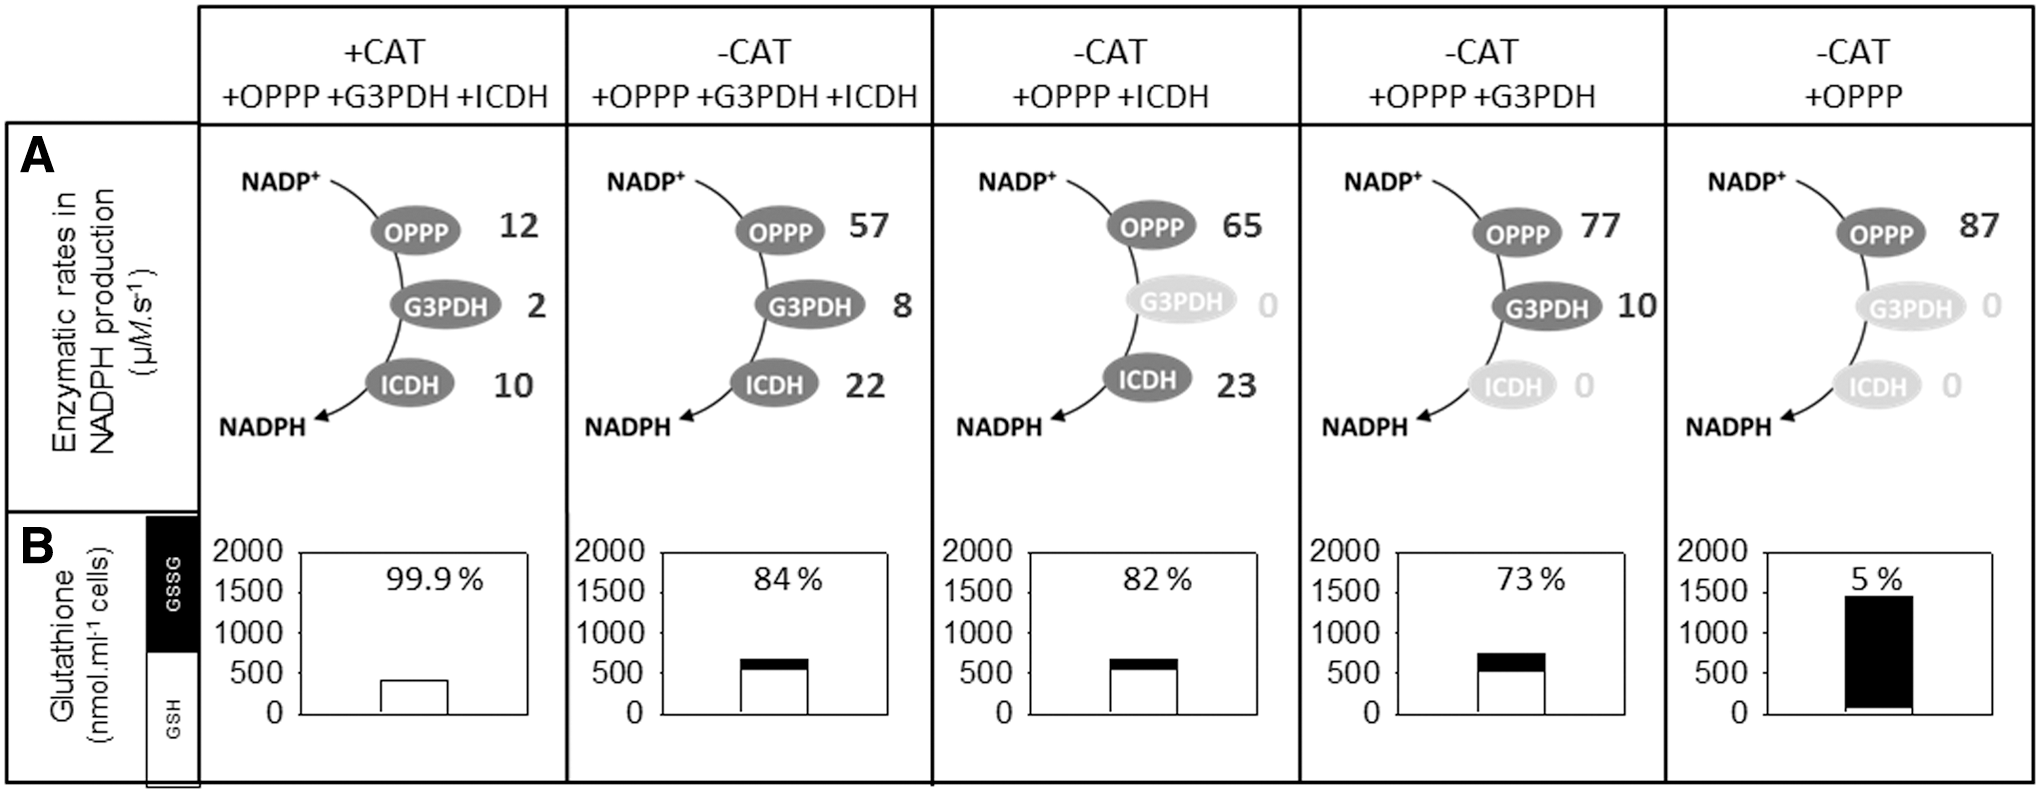
How does the total cell glutathione respond in these different conditions? In the +CAT condition, glutathione remains very highly reduced (Fig. 11B, left). Although substantially more oxidized when CAT is removed, the combined action of the NADPH-producing pathways, together with the relatively high NADP(H) concentration (compared with conditions for Fig. 6), allows glutathione to remain 84% reduced, thereby limiting the increase in total cell content. When G3PDH, ICDH, or both are removed, the reduction state falls and total cell glutathione increases (Fig. 11B, right three panels). When only the OPPP accompanies FNR in supplying reductant to support MDHAR and GR, the glutathione reduction state falls very low and GSSG reaches very high levels (Fig. 11B, extreme right).
Although this analysis is obviously not comprehensive, the results are consistent with the notions (i) that multiple pathways of NADPH generation support metabolic robustness and (ii) that removing one or more can lead to perturbations of the glutathione pool, particularly in oxidative stress conditions. More experimental analyses are required to investigate this point further, but the results recall observations on Arabidopsis icdh mutants (116). In these mutants, the glutathione status is not significantly perturbed compared with the wild-type when the plants are in optimal growth conditions. However, in double cat2 icdh mutants, the accumulation of GSSG is more substantial than in the single cat2 mutant (116), consistent with results shown in Figure 11B.
Concluding Remarks and Perspectives
Modeling is a tool to aid understanding. Ideally, it involves a quantitative examination of the multitude of reported data and interactions characteristic of biological systems, allowing for an integrated view of disperse data (70, 185). Gaps in our knowledge and in the availability of data mean that models are, necessarily, simplifications of a more complex reality, but they are useful for the analysis of relationships that are difficult for the human brain to compute. Our model couples H2O2 metabolism to its light-dependent generation by integrating several processes (photorespiration, CAT, ascorbate–glutathione redox turnover, glutathione synthesis and vacuolar sequestration, and NADPH generation). The components involved in these processes were parametrized using available literature data to meet the constraints of responses of ascorbate and glutathione status in wild-type and CAT-deficient plants.
The model is able to simulate experimental results observed in these systems for leaf ascorbate and glutathione redox status and contents. From the sensitivity analysis of configurations required to achieve an accurate simulation, the following implications can be derived. First, in unstressed conditions, CAT and the ascorbate–glutathione pathway can maintain H2O2 at low levels. Second, at moderate rates of flux through the pathway, ascorbate redox turnover can be sustained largely by a closed APX–MDHAR circuit that does not require glutathione. Third, even in the absence of CAT, the ascorbate–glutathione pathway is able to deal with relatively high rates of H2O2 production but this requires substantial redox engagement of glutathione. Fourth, redox activation of glutathione synthesis and vacuolar sequestration of GSSG are both required to reproduce real-world effects observed in the oxidative stress model Arabidopsis mutant, cat2. Fifth, MDHAR seems to play an important role in determining the degree of coupling between ascorbate and glutathione. Finally, accumulation of GSSG is inversely related to NADPH availability through an effect on MDHAR, not GR. Interestingly, if NADPH is nonlimiting for MDHAR, the influence of CAT is predicted to be minor, that is, glutathione status is similar whether CAT is active or not. Conversely, NADPH that strongly limits MDHAR aggravates oxidation of glutathione when CAT is absent.
Several important additional factors could be incorporated into future versions of the model. Perhaps the most important would be a fuller description of the complex plant antioxidative system, and an improved parametrization of subcellular compartmentation. Among the former could be incorporation of enzymes such as PRX (92), chemical oxidation of ascorbate and glutathione by ROS such as superoxide (143), the role of NADPH oxidases (180), and the inclusion of NAD redox turnover. Unfortunately, some of these processes would be either quite complex to model (NAD redox turnover) or else are not well characterized at the enzymatic level (NADPH oxidases). Nevertheless, introducing NADH turnover could be important to verify the influence of NADPH limitation of MDHAR. Some isoforms of MDHAR can also use NADH with high affinity, even if we note that NADH concentrations are considered to be very low in the cytosol (69), which was the main compartment considered here in terms of enzyme parametrization.
Regarding the key issue of compartmentation, our knowledge is currently limited by a lack of data on transporter affinities and capacities, making it difficult to model subcellular movement of the small compounds considered in our model (H2O2, ascorbate, glutathione, and NADPH). Although we did use published data on affinities for GSSG (100) to introduce transport into the vacuole, the capacity of the ABCC-type transporters had to be empirically derived because literature data that allow realistic estimations are lacking. By allowing movement between compartments such as the cytosol and the vacuole, aquaporins may be important in determining cellular H2O2 accumulation in plants. Kinetic modeling has previously been used to analyze how, by acting as an H2O2 sink, CAT may work with aquaporins to determine H2O2 compartmentation (73). It could be possible in the future to integrate relevant equations on aquaporin function into the model we have described here.
A further difficulty arises concerning the distribution of enzymes between compartments. In terms of differences in the kinetic properties of specific enzyme isoforms, it was necessary to make a strategic choice between the data available for purified enzymes. Where possible we used data available for the cytosolic isoforms since evidence suggests that this compartment is particularly important not only in metabolizing any photorespiratory H2O2 that escapes CAT (115, 150, 151, 192) but also in redox signaling linked to a diverse range of stresses including pathogenesis-related responses and high light (28, 125, 156, 175).
Despite this complexity, and the possibility of GSH oxidation by processes that we have not yet incorporated into the model, our analysis does add weight to the notion that glutathione is exquisitely situated to act as a sensor of enhanced ROS production. The glutathione redox system can influence protein function through several mechanisms (24, 41, 207), but the plant cell may be configured so that the system only becomes substantially redox engaged during oxidative stress. Our analysis suggests that when CAT and APX are both active, even quite high rates of basal H2O2 production may not engage the glutathione system to any great extent. In these conditions, the ascorbate redox system turns over with only a very minor input from glutathione. In conditions when additional H2O2 production is occurring, or CAT is downregulated—both of which can occur in response to stress (118, 180)—glutathione can become much more engaged. The low redox potential of glutathione in the absence of stress (112) adds to this sensitivity, because accumulation of GSSG to concentrations that are quite low in absolute terms can cause large changes in the redox potential. Because the GSH:GSSG ratio is so high in optimal conditions, even a moderate stress-induced decrease in GSH:GSSG ratios (with values remaining as high as 20) involves a large positive change in the redox potential.
The marked increase in extravacuolar GSSG, from 0.07 μM when CAT is functional to 116 μM in the absence of CAT, contrasts with the much more modest increase in H2O2 itself. This was calculated to be 4.3-fold if APX capacity was unchanged: if APX is induced, as observed in CAT-deficient plants (115, 150), the whole-cell H2O2 concentration would only increase from 1 to 1.4 μM (Table 1). This may explain the difficulty of measuring sustained increases in H2O2 in CAT-deficient lines, in contrast to the marked and reproducible accumulation of GSSG (22, 23, 147).
We note that direct oxidation of protein Cys residues by H2O2, including peroxidase-dependent relays, is thought to be important as an oxidative signaling mechanism, particularly in yeast and bacteria (e.g., 59). Whether such processes are also important in plants is still not entirely clear.
Even discounting the vacuolar GSSG pool, the 1600-fold increase in GSSG in the −CAT condition underscores the potential value of modified glutathione status as a signal for enhanced H2O2 availability. Indeed, our model incorporates one sensor of changes in the glutathione redox potential, since we coupled γ-ECS activation to this factor. This was done using an empirical parametrization (midpoint potential of −220 mV for 50% activation) that configured the regulation of γ-ECS so that the model was able to output realistic responses in glutathione status in both optimal and oxidative stress conditions. The existence of other similarly redox-sensitive proteins would allow the glutathione redox potential to be sensed by the cell to initiate other responses, such as transcriptional regulation. Additional signaling components that could be affected by modified glutathione status include nitric oxide, through effects on S-nitrosoglutathione availability.
The fate of the GSSG that is transported into the vacuole, presumably to offset to some extent changes in the cytosolic glutathione redox potential, is a point that could be addressed in future versions of the model through the incorporation of the transpeptidases that initiate GSSG degradation (57, 103). This recycling process could be important in supplying substrates to glutathione (re)synthesis, particularly as our model suggests that Cys availability may have an influence not only on glutathione contents but also on glutathione redox state. Moreover, our model, which is focused on single cell processes, could be integrated into higher scale models that seek to address intercellular transfer of compounds such as H2O2, ascorbate, and glutathione.
Footnotes
Acknowledgments
M.-S.R. thanks the Doctoral School ED129 “Sciences de l'Environnement d'Ile de France” for the kind award of a Bourse Ministérielle (PhD studentship). This work received financial support from the French Agence Nationale de la Recherche grants ANR08VULN012 (Vulnoz) to A.T. and G.N. and ANR12BSV60011 (Cynthiol) to G.N.
Abbreviations Used
Details of the Model
Experimental Methods
*
GSH is used here to indicate the thiol (reduced) form of glutathione while GSSG denotes the disulfide form. The term “glutathione” is used where no distinction is drawn or both forms may be concerned (e.g., glutathione redox potential).