
Abstract
Aim:
Nicotinamide adenine dinucleotide (NAD+) plays central roles in a wide array of normal and pathological conditions. Inhibition of NAD+ biosynthesis can be exploited therapeutically in cancer, including melanoma. To obtain quantitation of NAD+ levels in live cells and to address the issue of the compartmentalization of NAD+ biosynthesis, we exploited a recently described genetically encoded NAD+ biosensor (LigA-circularly permutated Venus), which was targeted to the cytosol, mitochondria, and nuclei of BRAF-V600E A375 melanoma cells, a model of metastatic melanoma (MM).
Results:
FK866, a specific inhibitor of nicotinamide phosphoribosyltransferase (NAMPT), the main NAD+-producing enzyme in MM cells, was used to monitor NAD+ depletion kinetics at the subcellular level in biosensor-transduced A375 cells. In addition, we treated FK866-blocked A375 cells with NAD+ precursors, including nicotinamide, nicotinic acid, nicotinamide riboside, and quinolinic acid, highlighting an organelle-specific capacity of each substrate to rescue from NAMPT block. Expression of NAD+ biosynthetic enzymes was then biochemically studied in isolated organelles, revealing the presence of NAMPT in all three cellular compartments, whereas nicotinate phosphoribosyltransferase was predominantly cytosolic and mitochondrial, and nicotinamide riboside kinase mitochondrial and nuclear. In keeping with biosensor data, quinolinate phosphoribosyltransferase was expressed at extremely low levels.
Innovation and Conclusions:
Throughout this work, we validated the use of genetically encoded NAD+ biosensors to characterize subcellular distribution of NAD+ production routes in MM. The chance of real-time monitoring of NAD+ fluctuations after chemical perturbations, together with a deeper comprehension of the cofactor biosynthesis compartmentalization, strengthens the foundation for a targeted strategy of NAD+ pool manipulation in cancer and metabolic diseases.
Introduction
Nicotinamide adenine dinucleotide (NAD+) is a vital, ubiquitous, and multifunctional cofactor regulating a wide range of biological processes (10, 29). NAD+ is essential as electron acceptor donor in glycolytic, tricarboxylic acid cycle (TCA), and oxidative phosphorylation redox reactions. The equilibrium existing between its oxidized (NAD+) or reduced forms (NADH) mediates cellular antioxidation mechanisms, as well as cell redox state homeostasis, energy metabolism, and mitochondrial functions (62). In addition, NAD+ is the substrate of enzymes with fundamental roles in gene expression and cell signaling, independent of its redox properties. This large family of NAD+-consuming enzymes includes adenosine diphosphate (ADP)-ribose transferases and poly (ADP-ribose) polymerases (PARPs), sirtuins (SIRTs), and cyclic ADP-ribose hydrolases (CD38/CD157) (27, 57). Through their functional activities of post-translational modifications (ADP-ribosylation and deacetylation reactions), or by calcium signaling mobilization, these enzymes regulate gene transcription, cell differentiation, cell cycle progression, DNA repair, chromatin stability, among other biological processes (12), representing connecting elements between the metabolic state of a cell and its signaling and transcriptional activities.
In this study, we used genetically encoded nicotinamide adenine dinucleotide (NAD+) biosensors to dynamically characterize subcellular NAD+ biosynthesis in intact BRAF-mutated metastatic melanoma (MM) cells. The choice of this model derives from our previous studies showing that melanoma transformation is accompanied by dysregulation of NAD+ biosynthesis, which may be therapeutically targeted. By using organelle-specific biosensors, we monitored NAD+ fluctuations in response to biosynthetic precursors or inhibitors. Together with subcellular localization data, these results offer a complete picture of NAD+ biosynthesis in MM cells and open the way to the use of biosensors to understand the NADome architecture in physiopathological conditions.
The subcellular localization of specific biosynthetic pathways remains to be fully elucidated. Several efforts have been made to elucidate where NAD+ biosynthesis occurs and whether there are exchanges between compartments (17, 18, 30, 31, 40, 46). The maintenance of cellular NAD+ pool is achieved through the reoxidation from NADH or through the active synthesis of the pyridine nucleotide.
Briefly, NAD+ is synthesized through one de novo biosynthetic pathway, starting from tryptophan/quinolinic acid (QA) and controlled by the enzyme quinolinate phosphoribosyltransferase (QPRT) (6, 29) and three salvage pathways involving nicotinamide (NAM), nicotinic acid (NA), and nicotinamide riboside (NR) (12, 34). Each pathway is controlled by a rate-limiting enzyme, specifically nicotinamide phosphoribosyltransferase (NAMPT), nicotinate phosphoribosyltransferase (NAPRT), and nicotinamide riboside kinase (NRK). Among these pathways, the reaction controlled by NAMPT is the most relevant in mammalian cells (48), as the NAMPT substrate, NAM, is released by the main NAD+-consuming enzymes, such as SIRTs and PARPs, connecting NAD+ synthesis and degradation in a functional loop.
NAMPT is frequently overexpressed in hematological and solid tumors (22, 35, 52). Our recent data showed that transformation of melanocytes to metastatic melanoma (MM) is accompanied by a net increase in global NAD+ levels, particularly in the BRAF-mutated subset (2). Further elevation of NAD+ levels occurs in cells that acquire resistance to BRAF inhibitors, an event accompanied by metabolic reprogramming and NAMPT overexpression (2, 3). An increase in NAD+ may be needed to sustain cell proliferation and growth of MM cells, and it may directly affect NAD+ consumption pathways in an organelle-specific manner.
Following this hypothesis, we studied NAD+ bioavailability by dissecting the subcellular location of its biosynthesis. To the aim, we exploited a genetically encoded fluorescent biosensor (9, 15, 19) to directly monitor free NAD+ concentrations in subcellular compartments of MM cells and we connected this information to the biochemical evaluation of subcellular distribution of NAD+ biosynthetic enzymes (NBEs).
Results
Generation of A375 cells stably expressing organelle-specific NAD+ biosensor
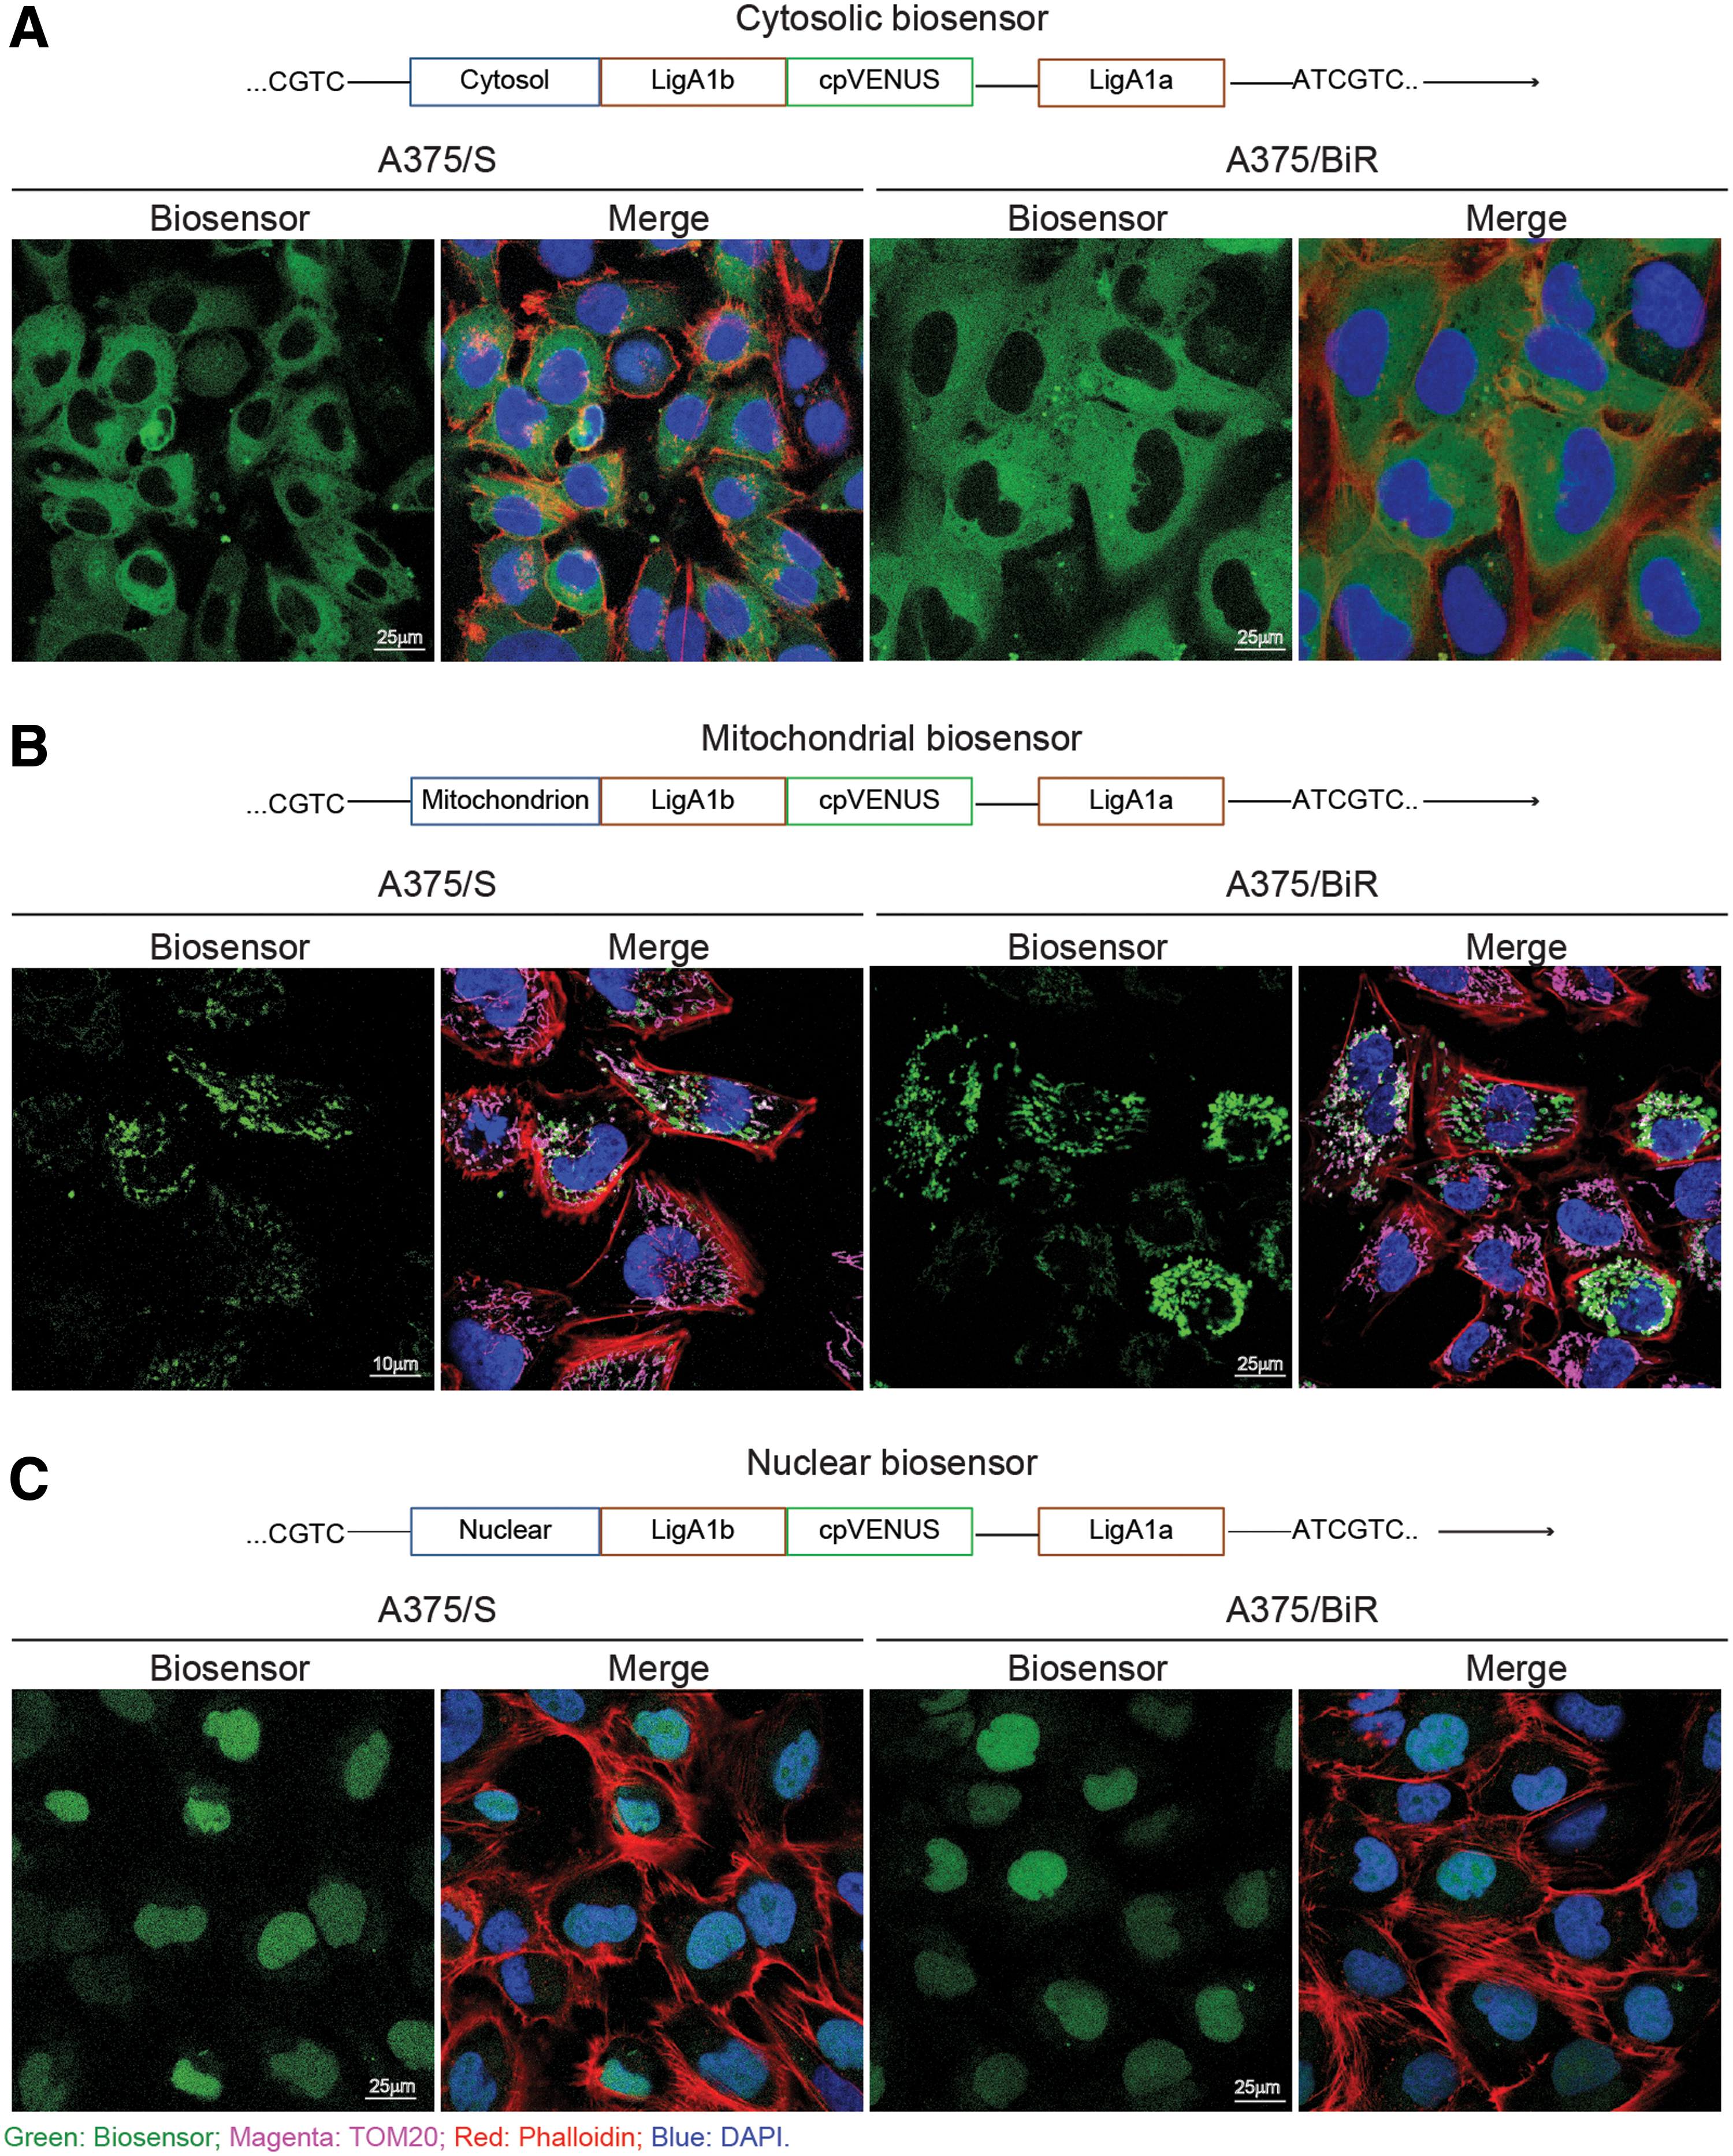
To study the compartmentalization of NAD+ biosynthesis, we used the BRAF-V600E-mutated A375 cell line as a melanoma model. Both BRAF inhibitor sensitive (S) and resistant (BiR) A375 were transduced with lentiviruses carrying the DNA coding for organelle-specific biosensor proteins (9). The biosensor contains an organelle-specific sequence (as detailed in the Materials and Methods section) and the NAD+-binding site of a bacterial DNA ligase (LigA1b-LigA1a). A circularly permutated Venus (cpVENUS) fluorescent protein is connected to the bipartite NAD+ binding domain of the enzyme. The structure allows biosensor fluorescence to be turned off when NAD+ is bound. Based on their cpVENUS-fluorescence, transduced cells were flow-sorted to obtain stably expressing cells. Confocal microscopy shows the specificity of the biosensor in reaching the target compartment (Fig. 1A–C), as determined by colocalization of the biosensor signal (green) with the actin cytoskeleton (red), TOM20 (magenta), or DAPI (blue).
Organelle-specific effects of NAMPT inhibition
To study NAD+-depletion kinetics induced by inhibiting the major mammalian NAD+ biosynthetic pathway, we treated biosensor-encoding A375 cells with the well-known nicotinamide phosphoribosyltransferase inhibitor (NAMPTi) FK866 (2, 38). The biosensor works by decreasing its fluorescence at 488 nm in the presence of increased levels of NAD+, whereas its 405 nm fluorescence is unaffected by substrate variations and can be used to normalize the biosensor expression levels. Therefore, a decrease in NAD+ levels leads to an increase of the 488 nm/405 nm fluorescence ratio (9, 15, 19). From previous works, it is known that FK866 treatment leads to a significant drop of total intracellular NAD+ levels beginning few hours after treatment (26). Consistently, a time-lapse confocal microscopy analysis of A375 cells treated with FK866 (25 nM) confirmed a net drop in the cytosolic, mitochondrial, and nuclear NAD+ levels steadily increasing over the 4 h observation time (Fig. 2A and Supplementary Movies S1, S2, S3).
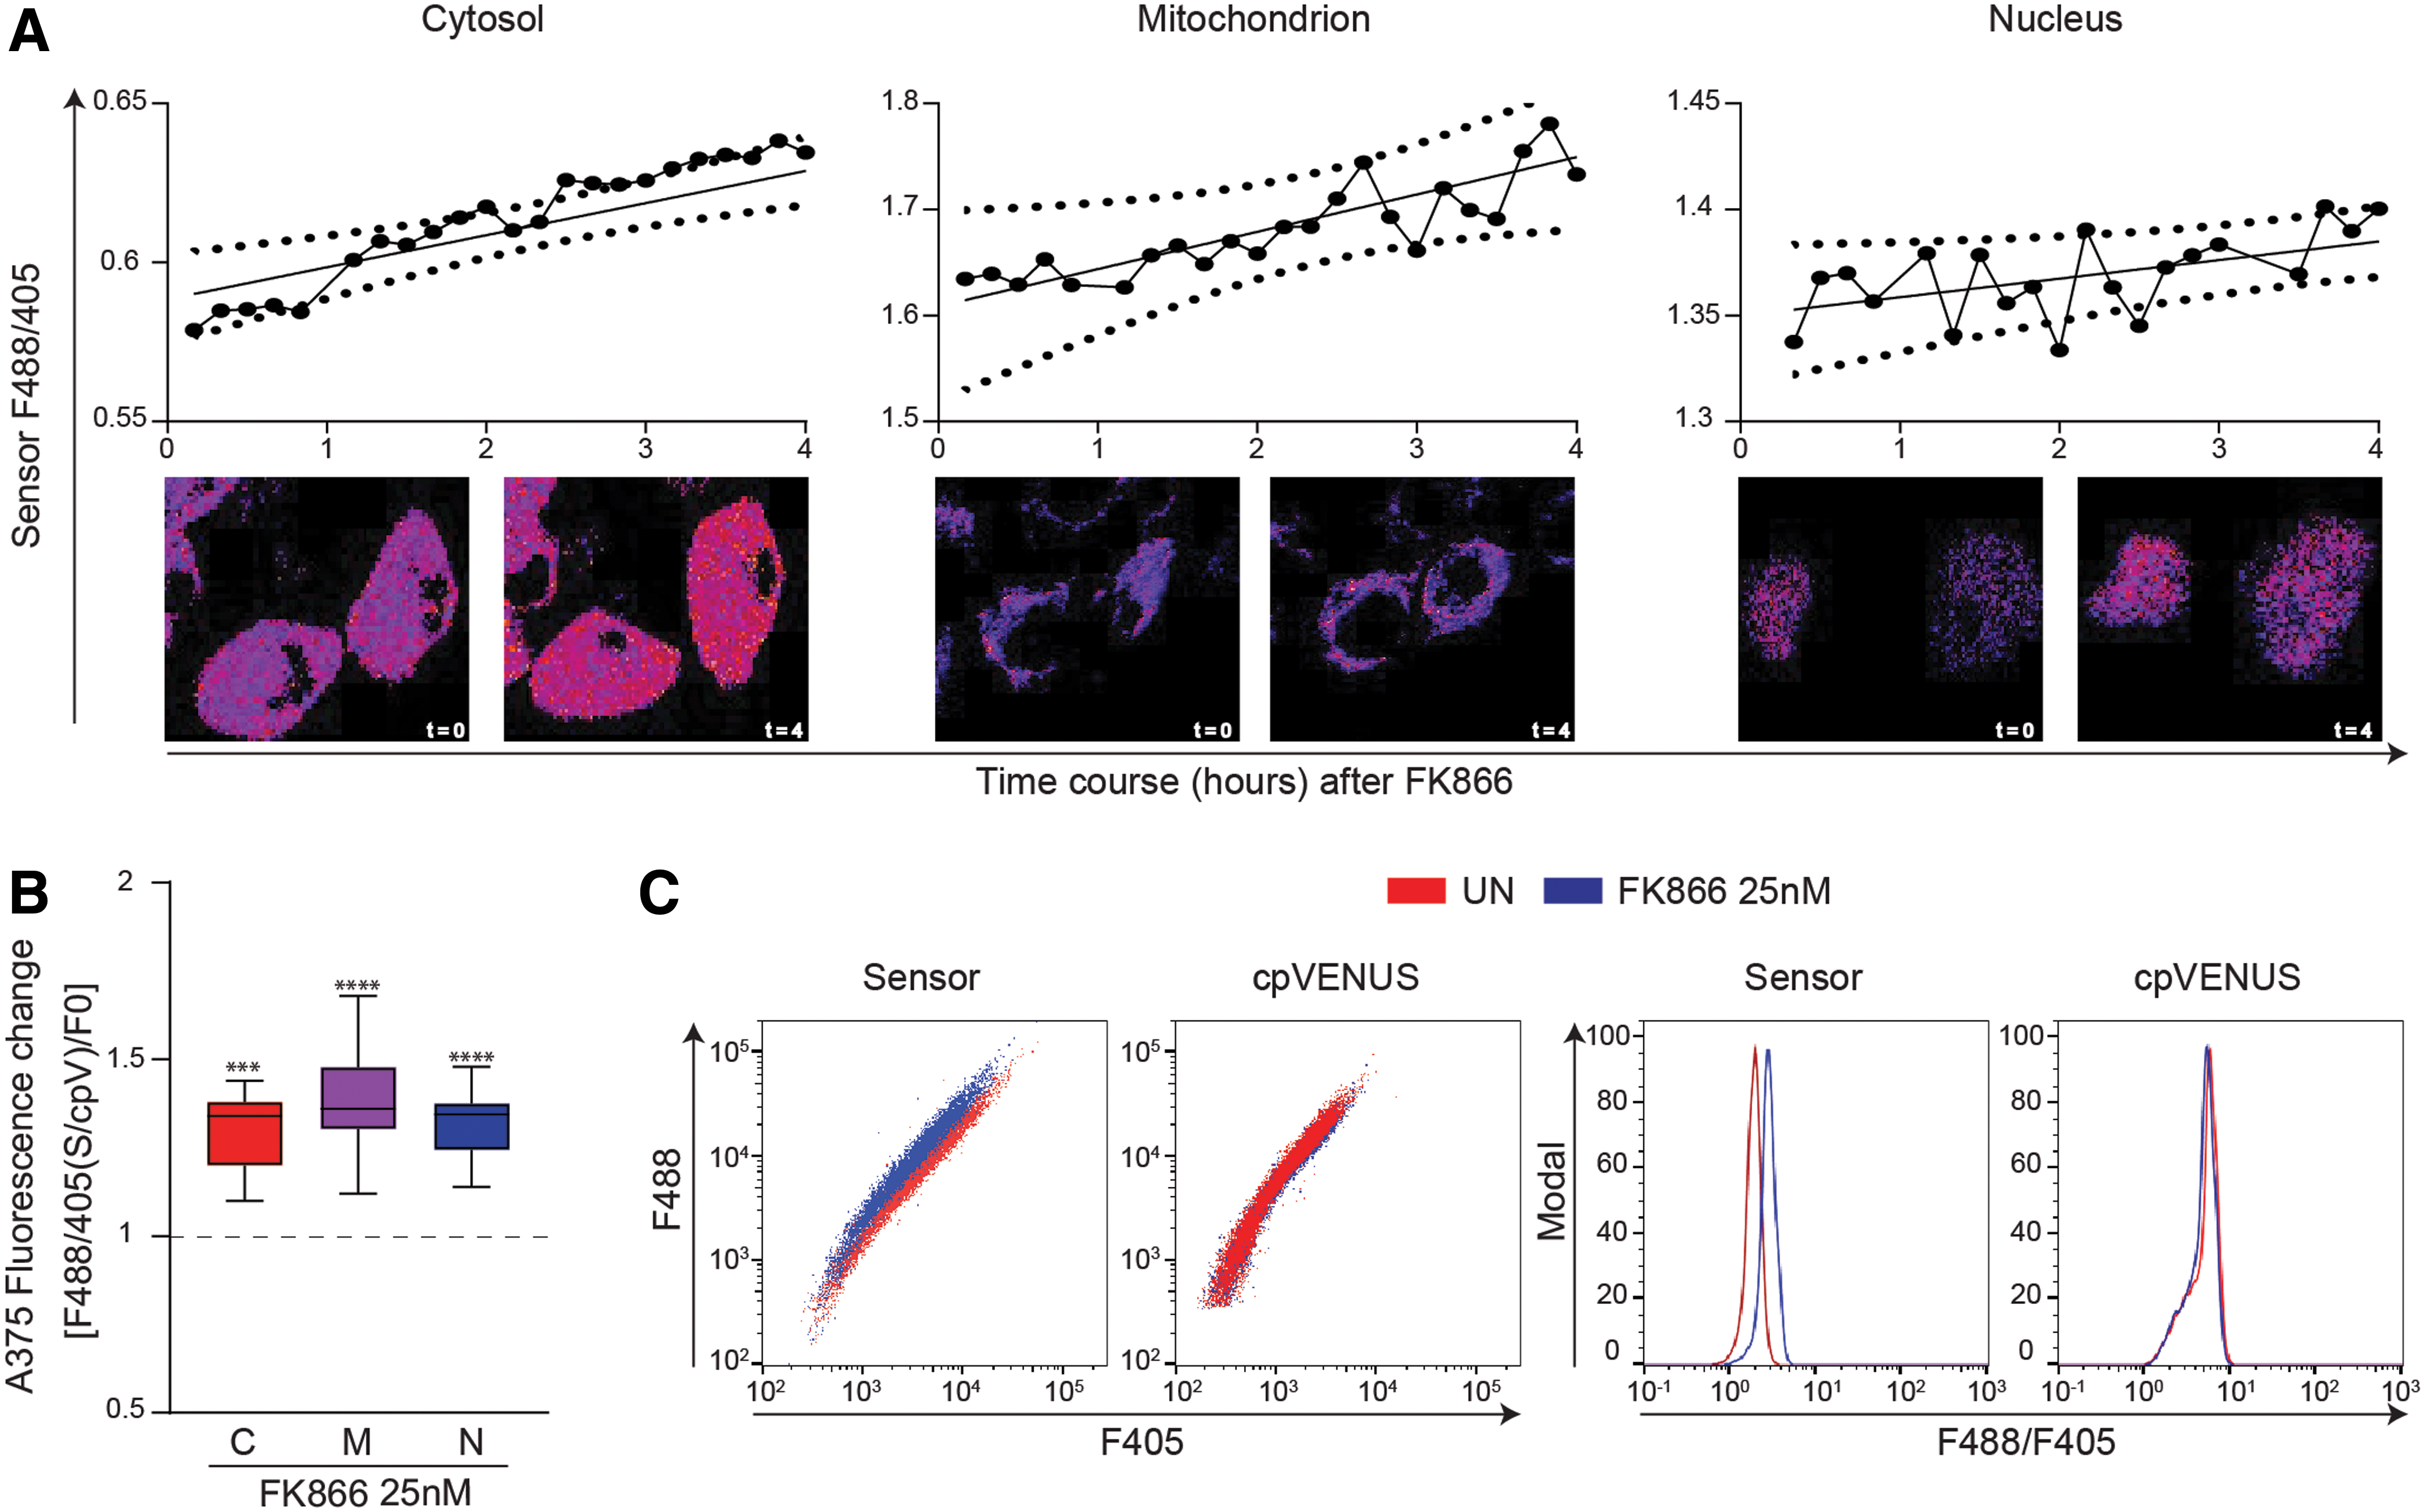
To obtain quantitative measurements, we then measured NAD+ concentrations by cytofluorimetric analysis, at the fixed time point of 16 h after FK866 treatment, when >90% of intracellular NAD+ is depleted, according to previous data (9). In these conditions, we observed a sharp increase in the 488 nm/405 nm fluorescence ratio in FK886-treated cells in all the subcellular compartments (Fig. 2B). The mean fluorescence ratio was augmented by 30% ± 10% (p = 0.0002), 38% ± 14% (p < 0.0001), and 32% ± 9% (p < 0.0001) in the cytosol, mitochondria, and nuclei, respectively. Figure 2C is a representative example of the biosensor behavior under FK866 treatment. The dot plot on the left depicts changes in fluorescence at 488 nm in relation to 405 nm of cell expressing the biosensor or the cpVENUS only. No modification in the 488 nm fluorescence of the cpVENUS could be highlighted after treatment with FK866, confirming specificity of the results (relative histograms on the right).
Subcellular NAD+ concentrations and effects of nicotinamide mononucleotide on subcellular NAD+ levels
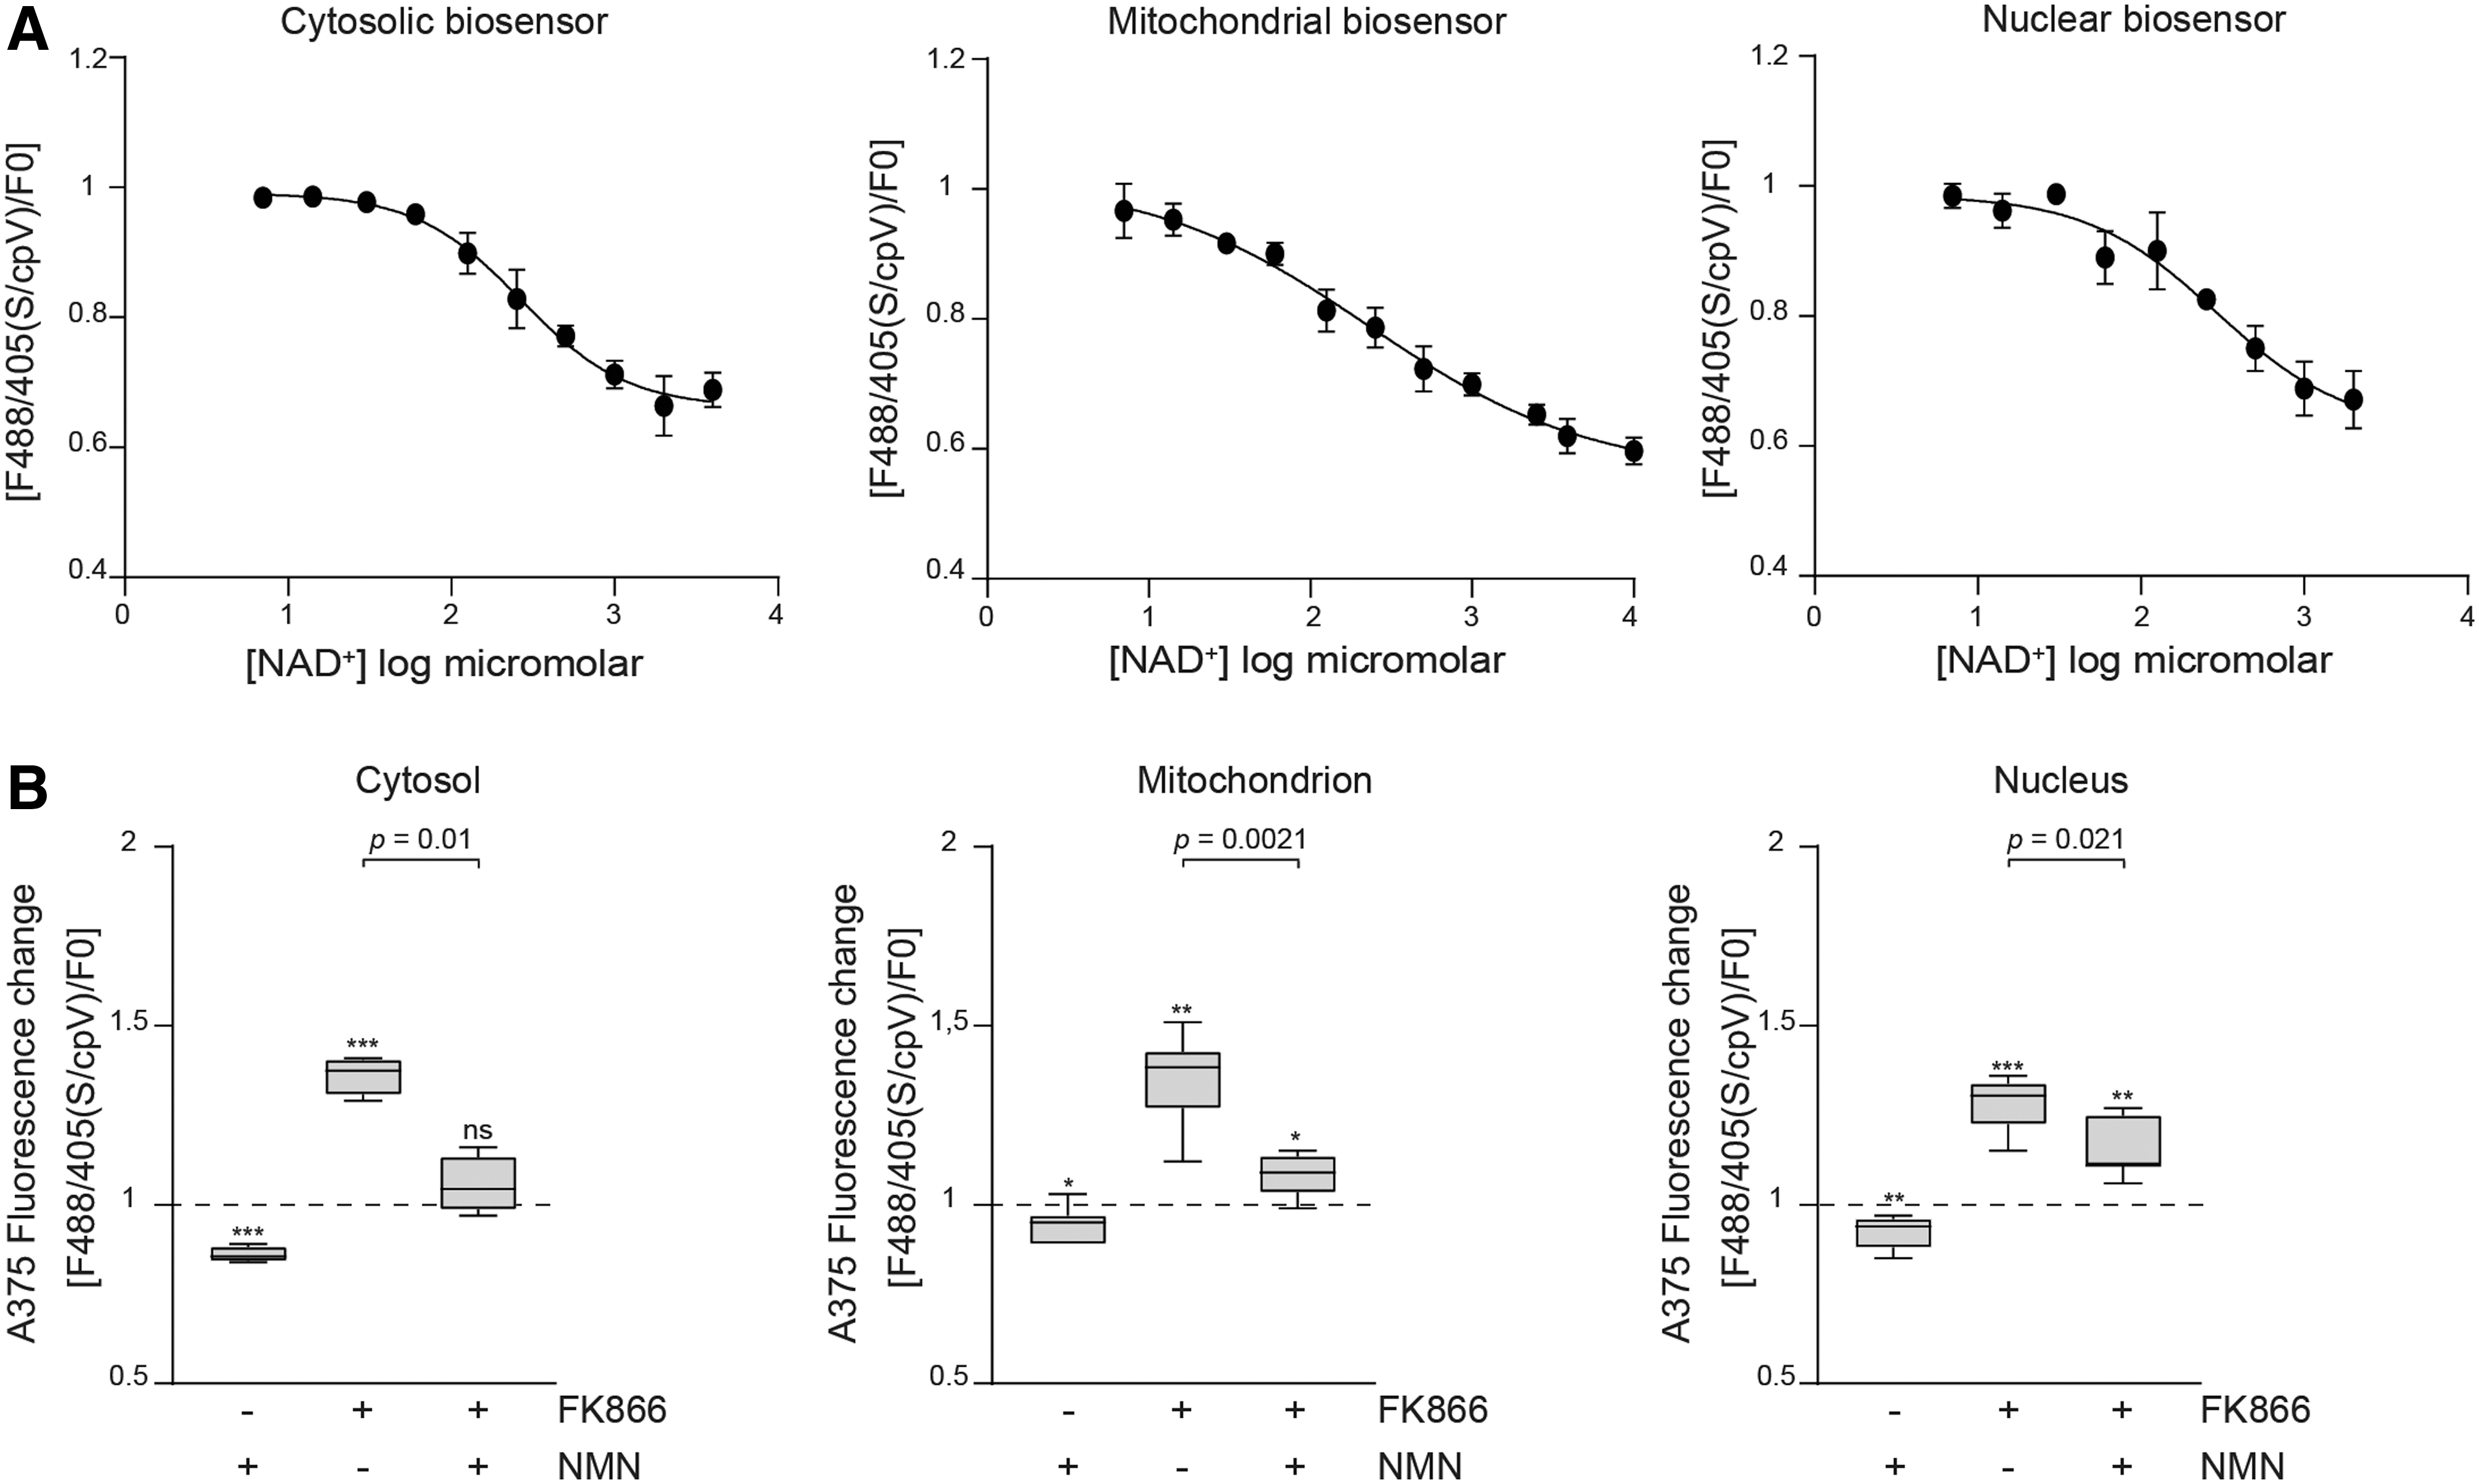
To quantify NAD+ fluctuations, we generated specific calibration curves for the cytosolic, the nuclear, and the mitochondrial biosensors (Fig. 3) (9, 15, 19). To do so, cells expressing cytosolic and nuclear biosensors were saponin-permeabilized to allow exogenous NAD+ (used in a range of concentrations between 0 and 4 mM for the cytosol and from 0 to 3 mM for the nucleus) to enter the cell or nucleus, as previously described (9). For the mitochondrial biosensor, saponin permeabilization was followed by rapid treatment with the ion channel-forming peptide alamethicin (AlaM), which renders mitochondria permeable to low-molecular-mass molecules (4, 23, 37). In this conditions, exogenous NAD+ (from 0 to 10 mM) entered in the organelle, inducing a linear reduction of the sensor fluorescence according to increasing NAD+ concentrations. Table 1 shows fluorescence ratio 488 nm/405 nm calculations obtained from each biosensor and normalized on relative cpVENUS 488 nm/405 nm variations (for the cytosolic and nuclear biosensors, the mean of four replicates is shown, whereas three replicates are shown for mitochondrial biosensor). These cytofluorimetric measurements of fluorescence variations at each NAD+ concentration were used to build specific sigmoidal curves. Finally, by interpolating fluorescence ratio of nonpermeabilized cells expressing the cytosolic biosensor to the relative titration curve, we found basal cytosolic mean values of NAD+ in A375 cells of 261 ± 74 μM.
Fluorescence Variations of Each Biosensor in the Presence of NAD+
Table showing cpVENUS-normalized fluorescence variations of each biosensor when exposed to increasing concentrations of exogenous NAD+ in a condition of saponin or saponin/alamethicin-mediated permeabilization. Reported numbers are the mean of four independent experiments for the cytosolic and nuclear biosensors, of three independent experiments for mitochondrial biosensor.
NAD+, nicotinamide adenine dinucleotide; N.D., not determined.
The same experimental approach was used for the cells expressing the nuclear biosensor, detecting in this compartment a basal nuclear concentration of 259 ± 85 μM, whereas NAD+ concentrations in the mitochondria were in the range of 499 ± 154 μM. Treatment with FK866 diminished cytosolic, nuclear, and mitochondrial NAD+ concentrations to values <0.7 μM, below which the system is no longer sensitive. The amount of this NAD+ depletion is in line with previously reported high-performance liquid chromatography (HPLC) measurements of whole lysates from FK866-treated A375 cells (2).
Next, to further validate the system in our model, we studied the effects of nicotinamide mononucleotide (NMN), the product of the reaction catalyzed by NAMPT, on NAD+ levels with or without treatment with FK866. After being produced by NAMPT, NMN is converted into NAD+ by nicotinamide mononucleotide adenylyltransferases (NMNATs), which are known to be expressed in the nucleus (NMNAT-1), in the cytosol and Golgi (NMNAT-2), and in the mitochondria (NMNAT-3) (7, 45, 46). Therefore, we hypothesized that supplementation of NMN to cells could rescue NAD+ levels in the presence of NAMPTs. As expected, treatment of A375 cells with NMN increased basal NAD+ levels, in all cellular compartments and particularly in the cytosol (Fig. 3C). After treating cells with the NMNAT substrate, we detected a consistent reduction of fluorescence ratio of 14% ± 2% (p = 0.001) in the cytosol corresponding to an increase in NAD+ to 1621 ± 606 μM. In the nuclei, a reduction of fluorescence in the range of 8% ± 4% (p = 0.0037) corresponded to 651 ± 280 μM NAD+. A moderate but consistent fluorescence reduction of 9% ± 3% (p = 0.043) was also detected in mitochondria, where we measured an increase of the cofactor to a mean value of 2012 ± 1855 μM. Importantly, the combination of NMN and FK866, reverted the FK866-induced fluorescence ratio from 36% ± 5% to 6% ± 7% (p = 0.01) in the cytosol, from 35% ± 13% to 8% ± 6% (p = 0.002) in the mitochondria, and from 28% ± 7% to 16% ± 8% (p = 0.021) in the nuclei. The NMN-dependent rescue of NAMPT block is statistically significant when considering fluorescence ratios, and NAD+ levels recover from <0.7 to 167 μM in the cytosol, to 125 μM in mitochondria, and to 9 μM into the nucleus.
Topography of NAD+ biosynthesis: NAM and NA primarily affect cytosolic NAD+ levels
To obtain a complete topography of NAD+ biosynthesis in MM, we then studied the efficacy of different NAD+ precursors, including NAM, NA, NR, and QA, in sustaining NAD+ biosynthesis and in rescuing from FK866-mediated NAD+ depletion in the various compartments. We first treated cells with NAM and NA, substrates of the most relevant NAD+-producing pathways in MM cells. NAM is recycled to NAD+ in a two-step salvage pathway in which NAMPT, using the ribose-5-phosphate group of phosphoribosylpyrophosphate, catalyzes a phosphoribosyl transferase reaction converting NAM to NMN (31).
Treatment of cells with NAM led to a significant increase in cytosolic NAD+ basal levels, as expected based on the documented cytosolic expression of NAMPT (2, 17, 40) (Fig. 4A). In fact, in this compartment, the fluorescence ratio was reduced by 17% ± 7% (p = 0.004), corresponding to an increase in basal NAD+ levels to 1930 ± 980 μM. A slighter decrease in the fluorescence ratio was observed in the nuclei, where we measured an increase in basal levels of the cofactor to 489 ± 195 μM, whereas no changes were measured in mitochondria. An additional mechanism leading to NAD+ accumulation could be linked to block of NAD+ intracellular consumption, as NAM is a powerful noncompetitive inhibitor of NAD+-consuming enzymes (SIRTs and PARPs) (8, 31, 51). Consistently, even when added to A375 cells treated with FK866, NAM was able to partially prevent NAD+ loss. In fact, in the cytosol, we observed a rescue from FK866-induced NAD+ depletion, with fluorescence ratios going from 29% ± 14% to 15% ± 13% (p = 0.02, NAD+ concentration of 36 μM), in mitochondria from 46% ± 20% to 14% ± 20% (p = 0.005), while in the nuclear compartment from 37% ± 6% to 23% ± 8% (p = 0.003). The observed NAM-driven rescue of NAD+ levels would essentially reflect the inhibition of SIRT activities in the three compartments, whereas in the nuclei PARPs activity block could also contribute to the outcome.
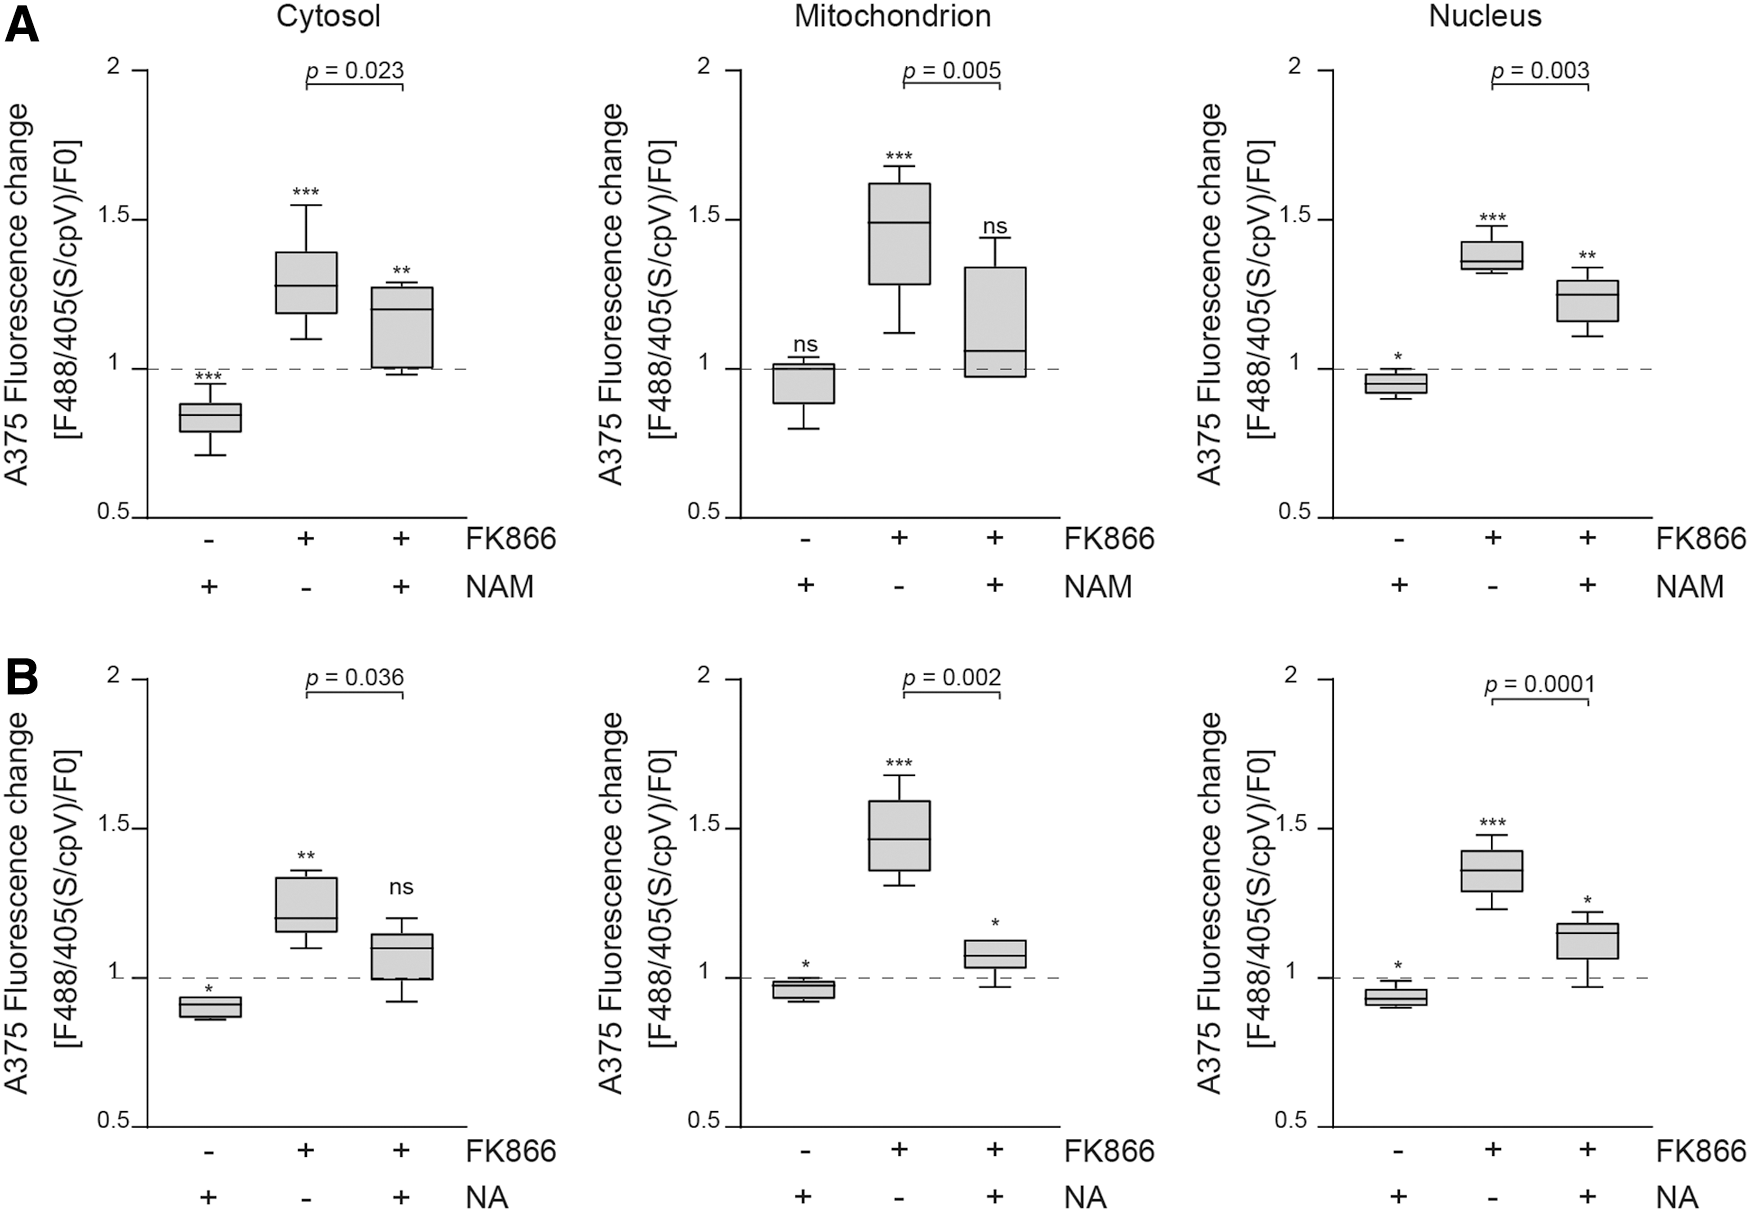
NA is the substrate of NAPRT, which converts NA into nicotinic acid mononucleotide (NaMN) via the Preiss-Handler pathway (11, 29). NA was effective in the cytosol, as well in the nuclei and mitochondria, both in increasing compartmentalized NAD+ basal levels and in countering the effects of NAMPT inhibition (Fig. 4B). The highest NA-dependent increase in basal NAD+ was detected in the cytosol (13% ± 4% of fluorescence ratio reduction, p = 0.013, NAD+ concentration of 976 ± 550 μM), followed by mitochondria (1031 ± 550 μM). The evidence of an NA/NAPRT-mediated rescue from FK866-induced NAD+ depletion confirms the reported finding that NAPRT-mediated NAD+ production limits the action of NAMPTis used in cancer treatment (42, 53).
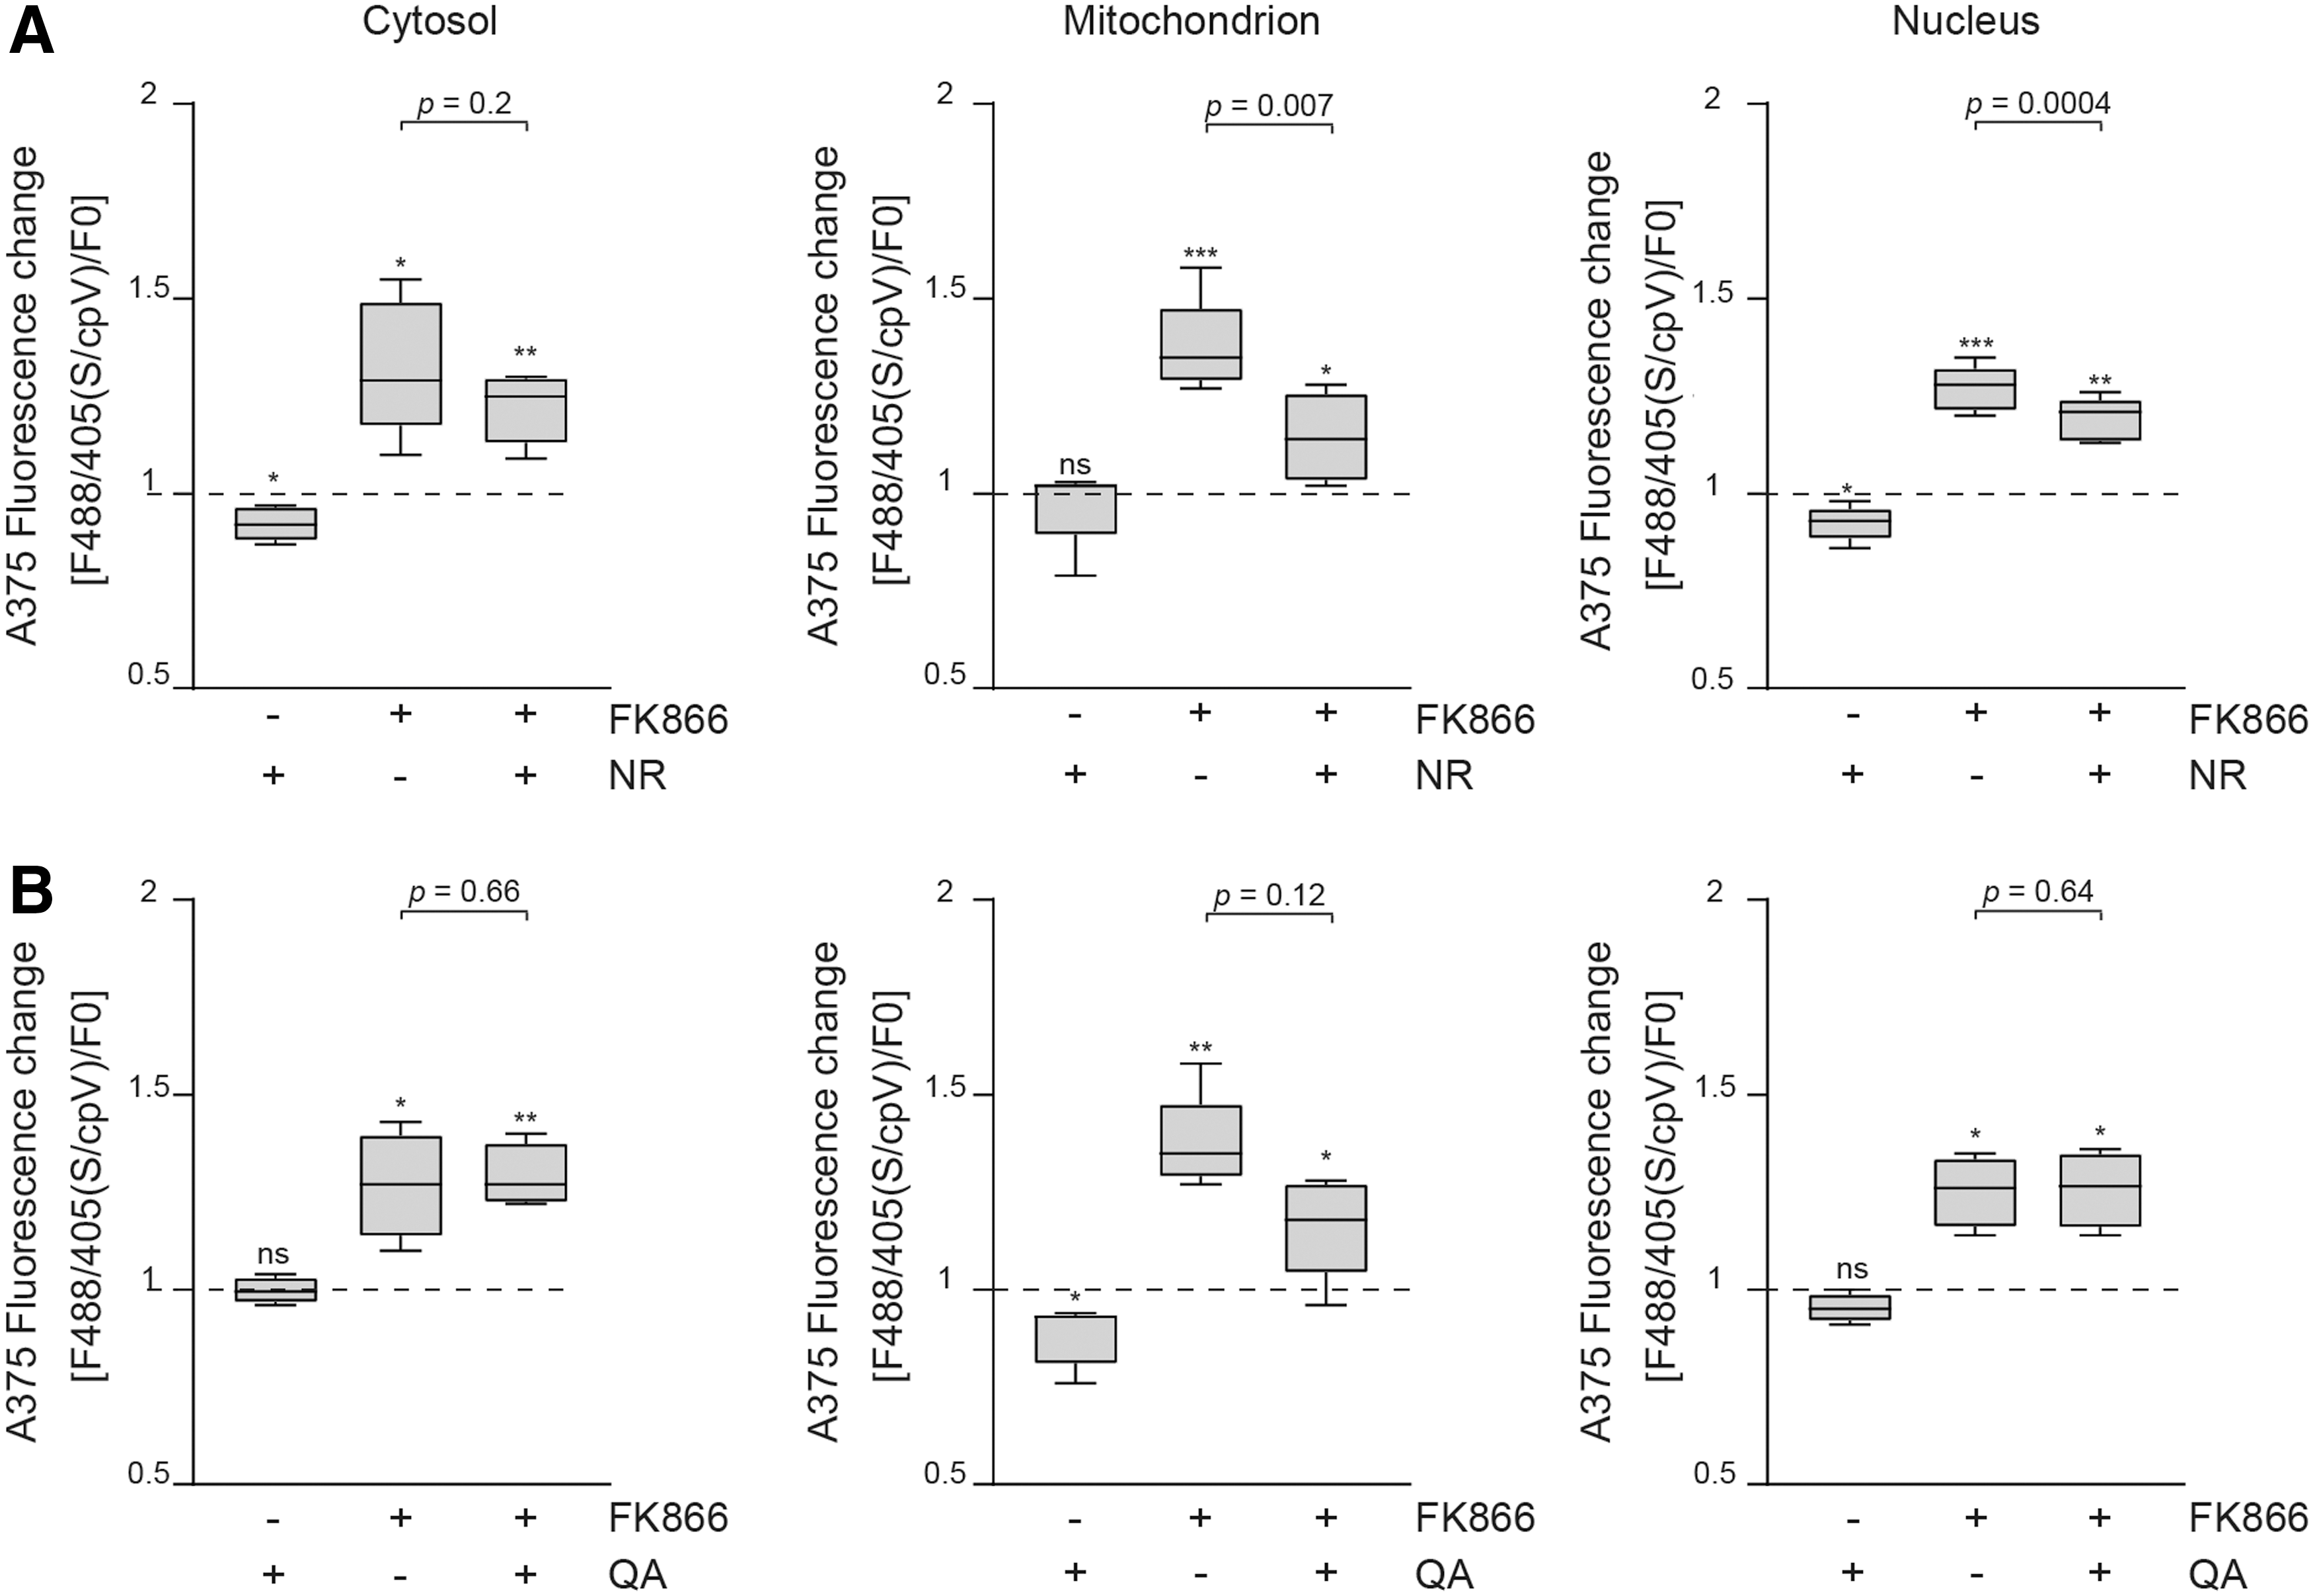
Topography of NAD+ biosynthesis: NR and QA showed an organelle-specific impact on NAD+ levels
We then tested the effects of NR and QA on subcellular NAD+ levels. NR is an additional salvageable NAD+ precursor via the NRKs-mediated pathway. NR conversion to NAD+ is initiated by phosphorylation of NR to NMN by NRKs (47, 56). Studying the subcellular capacity of NR in sustaining NAD+ production in MM, we found NR to be effective in increasing basal NAD+ levels in the cytosol (760 ± 557 μM) and in the nuclei (533 ± 166 μM) (Fig. 5A). However, NR was able to counter the effects of FK866 predominantly in the nuclei (from 27% ± 5% to 19% ± 5%, p = 0.0004) and in mitochondria (from 37% ± 12% to 14% ± 11%, p = 0.007) (Fig. 5A). In mitochondria of cells supplemented with NR and treated with FK866, NAD+ levels were kept between 50 and 240 μM, thus preventing its drop after FK866 exposure. Finally, treatment of A375 with QA, an intermediate precursor of the eight steps de novo synthesis pathway, increased NAD+ levels only in mitochondria. Furthermore, QA offered partial and weak protection from FK866-induced NAD+ depletion selectively in mitochondria (Fig. 5B). This finding is in line with the reported low expression of QPRT in MM (2, 29). Together, these results support the idea of a dominant NAD+ production via the recycling pathways in MM cells, with a clear preference for the cytosolic NAM-NAMPT. In the cytosol, NAPRT can be considered a second active NAD+ producer, whereas in the organelles, NRK appears to play a key role as NBE.
Subcellular localization of NBEs
Subcellular distribution of NBEs remains an incompletely understood aspect of NAD+ physiology, with increasing evidence suggesting that NAD+ biosynthesis is compartmentalized in a cellular- and tissue-dependent way (17, 46). To determine the subcellular expression pattern of NBEs in A375 cells in exponential growth phase and to interpret data obtained with the organelle-specific biosensors, we used confocal microscopy and biochemical analyses. Western blot analyses were performed on the cytosol and isolated mitochondria and nuclei. Confocal microscopy was used to support biochemical analysis. By comparing expression levels of the four NBEs, we confirmed that NAMPT is the dominant NBEs (Fig. 6A–C, left panel).
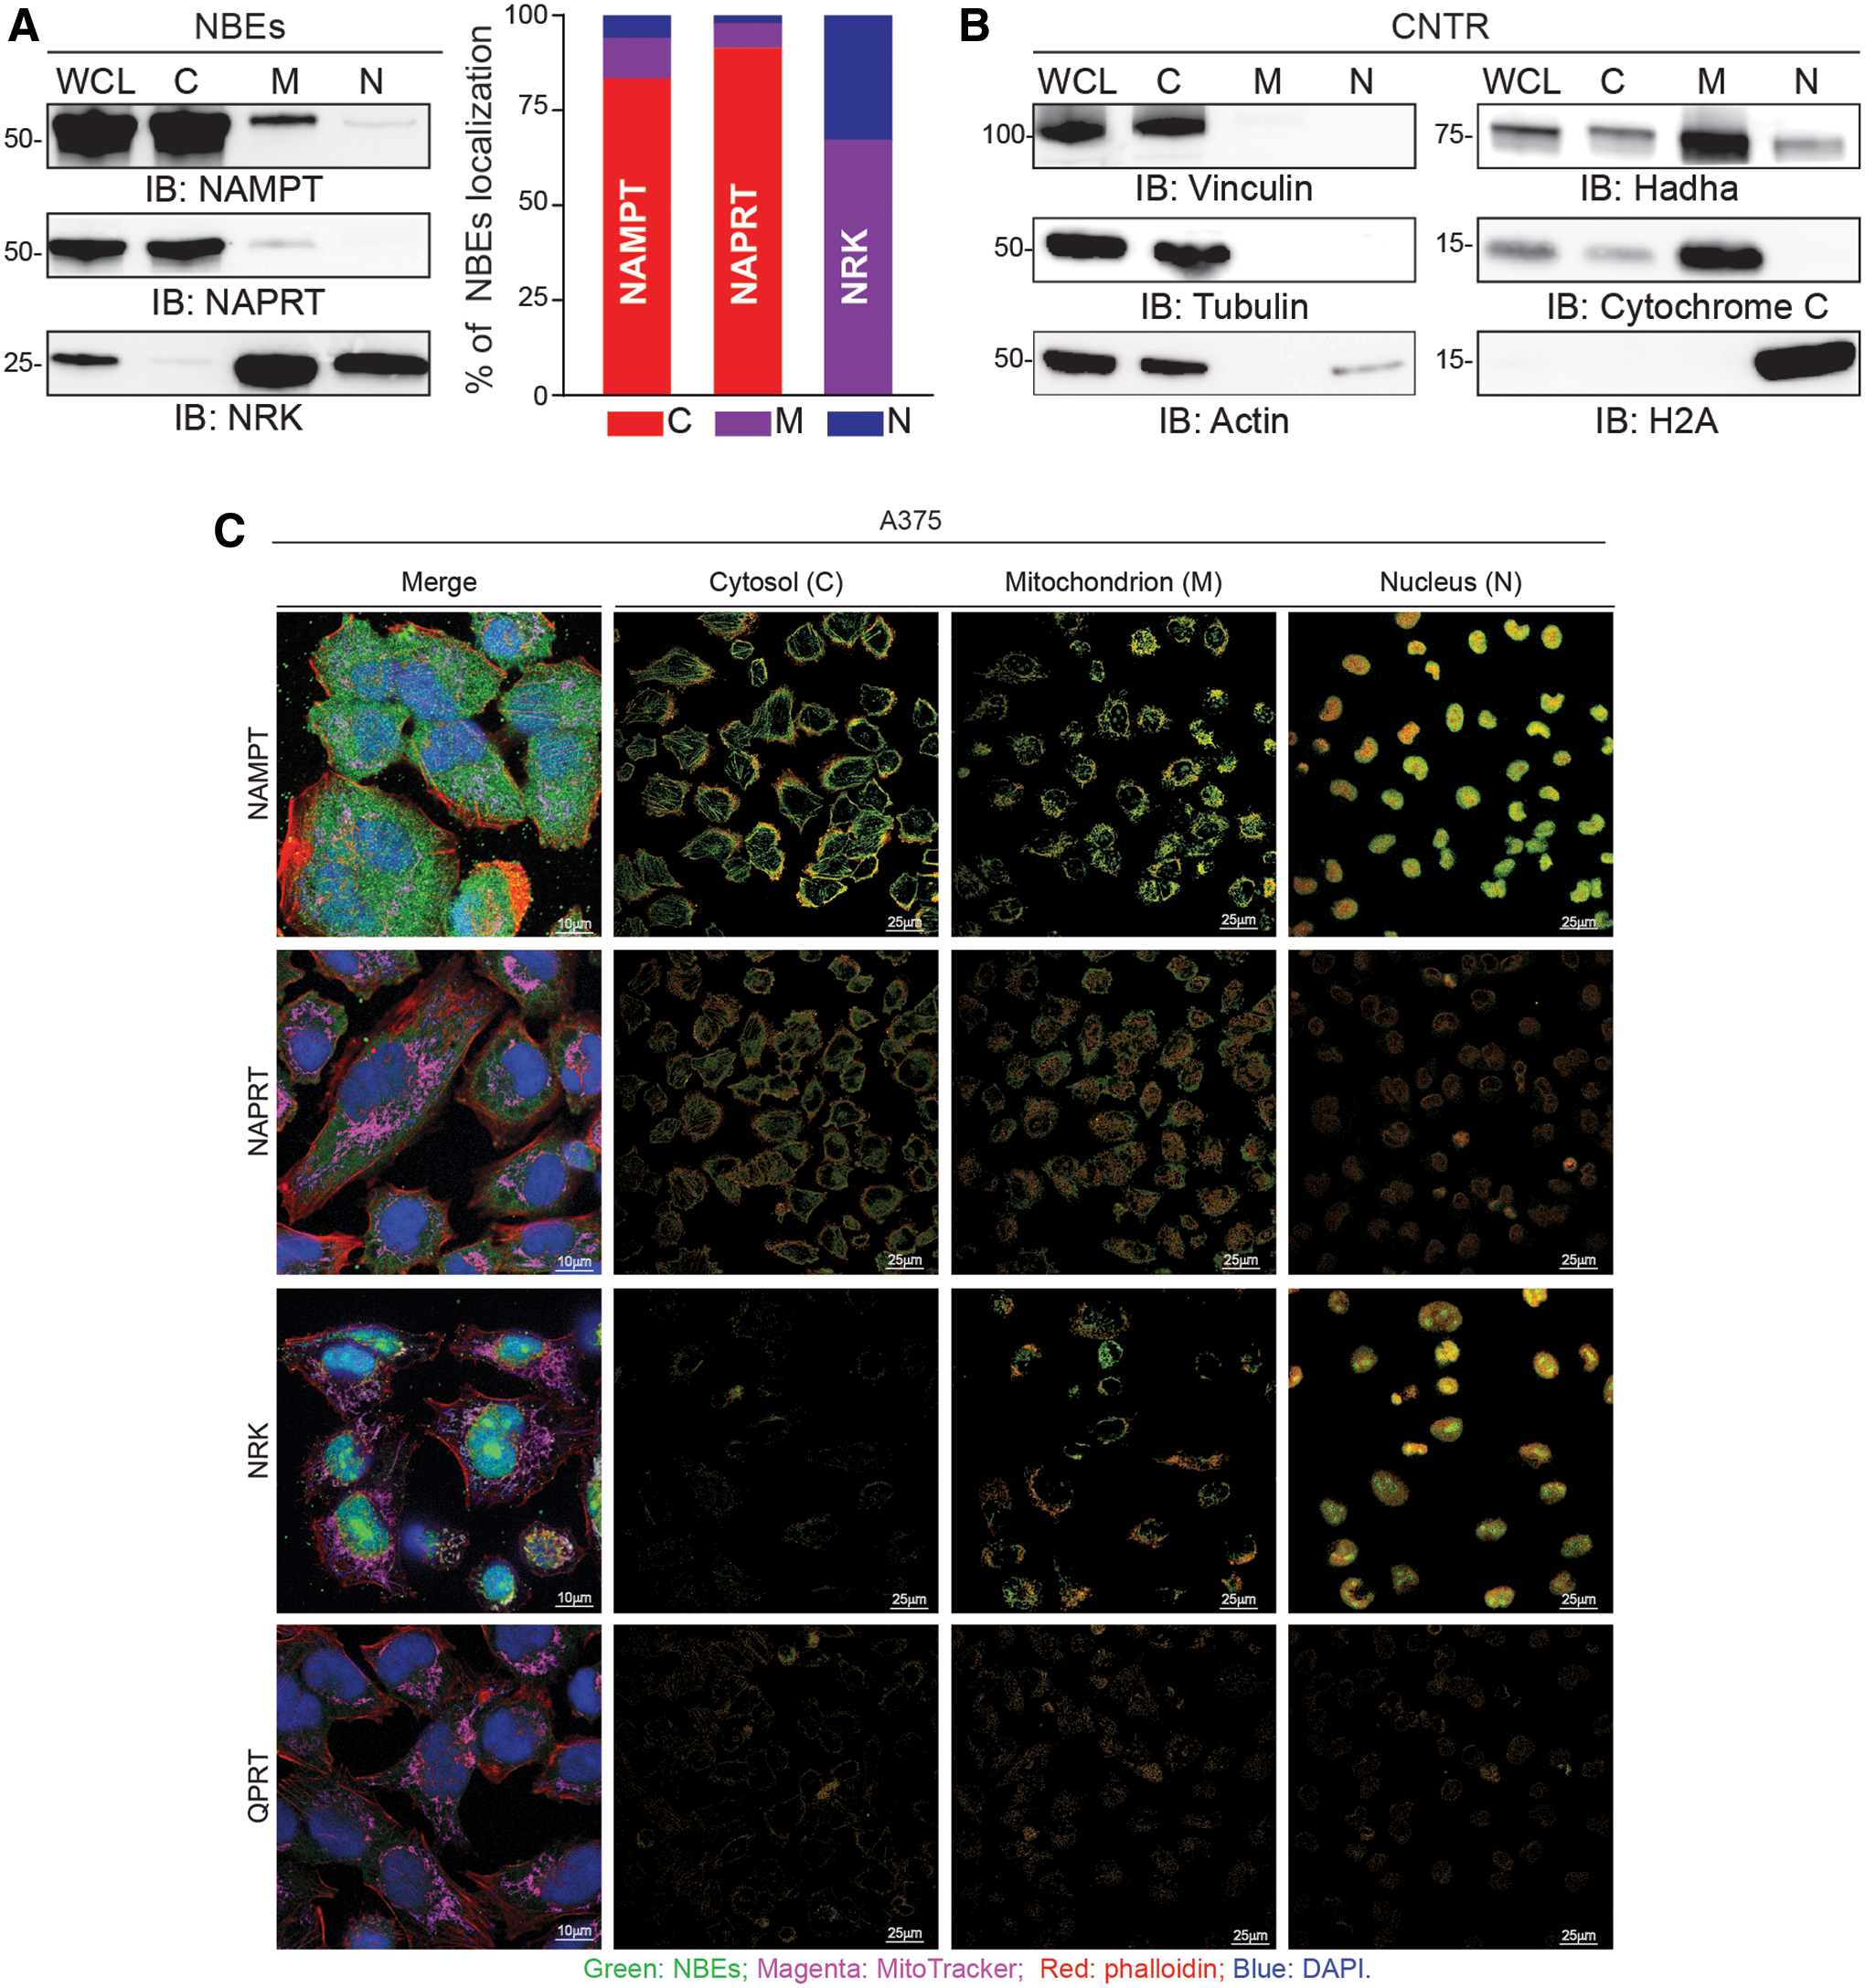
We then dissected NBEs subcellular localization by looking at protein distribution in the separate compartments. A percentage of expression for the different compartments was determined by dividing pixel intensity of the specific bands pertaining to a given compartment by the sum of the pixel intensities of the bands pertaining to all compartments. Western blot analysis showed that NAMPT is mostly cytosolic (84.16% of localization, Fig. 6A), with low mitochondrial (10.74%) and nuclear (5.1%) expression. Organelles purity was confirmed by using specific markers (anti-vinculin, anti-tubulin, anti-actin antibodies specifically highlight cytosolic fraction; anti-hadha and anti-cytochrome C antibodies identify mitochondrial enrichment while anti-H2A antibody was used for nuclear compartment detection). NAPRT was essentially cytosolic (92.2%), with minor fractions present in mitochondria (5.7%) and nuclei (2.1%). Conversely, NRK was mostly mitochondrial (67.2%) and nuclear (32.7%). QPRT was detectable at very low levels only in the cytosol and mitochondria (data not shown). Organelles purity was confirmed by using specific markers.
NBEs subcellular distribution was confirmed by confocal microscopy, by using organelle-specific markers, and by a software colocalization tool (Fig. 6C, right panel). The panel on the left shows the overlay of the NBE under analysis and the compartment specific marker. The three panels on the right show the expression of the NBE under analysis in the indicated compartment.
Proof-of-principle of the use of the biosensor to monitor NAD+ levels
Finally, we decided to use the biosensor to compare NAD+ levels in A375 cells before (S) and after the acquisition of resistance to BRAF inhibitors (BiR). These cellular models offered us a strategic and clinically relevant example of cancer metabolic adaptation suitable for characterization of NAD+ biosynthesis. In keeping with our prior data showing that A375/BiR (A375 resistant to BRAF inhibitors) cells are characterized by higher expression of NAMPT and constitutive higher levels of NAD+ (2), the biosensors showed a more pronounced sensitivity to NAD+ depletion through NAMPT inhibition. Specifically, as evidenced by a higher fluorescence variations, upon FK866 treatment, A375/BiR cells were more severely NAD+-depleted than/S variants, at least in the cytosol and nucleus (Fig. 7).
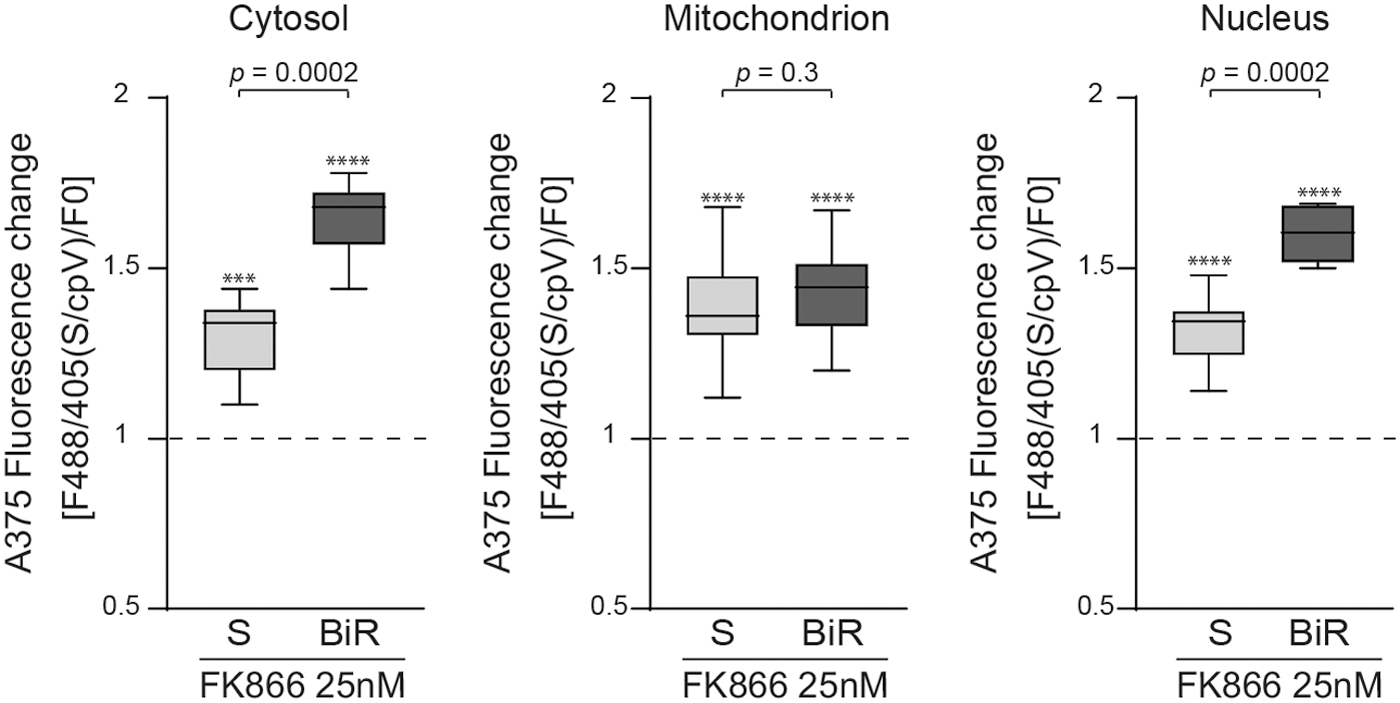
These results not only confirm that NAMPT is the master regulator of NAD+ biosynthesis in A375/BiR cells but also evidence a compartmentalized response to NAMPT inhibition in the two cell lines. Specifically, a highly significant difference in response to FK866 was highlighted in the cytosol and the nuclei, whereas no significant difference was observed in mitochondria. This result is consistent with the literature suggesting a differential behavior of mitochondria compared with the cytosol or the nuclei in the dynamics of metabolites exchange (40, 53). In addition, we found that, in A375, the most mitochondrial expressed NBE is NRK, potentially explaining the lower sensitivity of A375/BiR mitochondria to NAMPT inhibition.
Overall, these data validate NAD+ biosensors as tools to understand whether the main pathways responsible for NAD+ production differ across subcellular compartments or under chemical perturbations.
Discussion
Because of its essential role and ubiquitous presence, alterations of NAD+ concentrations are associated with a large number of pathological conditions, including metabolic diseases such as obesity, diabetes and insulin resistance, inflammation, and immune responses (16, 46, 64). A decrease in NAD+ levels is also a hallmark of aging and aging-associated pathologies, such as neurodegeneration and motor function decline. For these reasons, NAD+ boosting molecules or inhibitors of the NADases received remarkable attention as anti-aging agents or coadjuvants for maintaining NAD+ homeostasis (46). However, a significant branch of research on NAD+ metabolism documented increased levels of the cofactor during tumorigenesis (2, 52), thus rendering NAD+ metabolism an attractive therapeutic target in cancer treatment.
Inhibitors against NAMPT, the major intracellular NBE, are under development for phase I and II clinical trials for patients with ovarian, pancreatic, and rectal cancers or with hematological malignancies, including multiple myeloma and chronic lymphocytic leukemia (28, 58, 60). Even if some clinical responses were observed, patients treated with NAMPTis experienced significant toxicity, including thrombocytopenia and gastrointestinal complications. The modest success of FK866 in cancer patients may be explained by the activation of rescue pathways that can overcome NAMPT block and restore NAD+ levels through alternative routes. Most important in this context is NAPRT, the rate-limiting enzyme in the metabolism of dietary NA into NAD+. Epigenetic regulation of NAPRT leads to gene silencing in some tumors, while in the cases in which it is overexpressed, the enzyme is responsible for the failure of NAMPTi-based treatments (11, 42). Like NA, NR can be introduced through diet, but it is also the by-product of extracellular NMN dephosphorylation reaction carried out by CD73 (53), an ectoenzyme involved in the generation of adenosine, in turn a powerful immunosuppressant.
Recent reports indicate that NR, via NRK activity, maintains cancer NAD+ homeostasis in the presence of NAMPTi, contributing to treatment failure (14, 25, 53). In addition, the dynamic NAD+/NADH balance impacts on the redox state of cancer cells. In fact, tumors possess higher levels of reactive oxygen species (ROS), rendering them more sensitive to changes in the redox status (13, 33). In this context, NAD/NADH and NAD+ phosphate/reduced NAD+ (NADPH) balance regulates glutathione reductase and thioredoxin reductase activities, major components of the antioxidant defense system (24, 39, 59). Specifically, reducing equivalents from NADPH are used to regenerate reduced glutathione (GSH) from the oxidized form (GSSG), fueling the ROS scavenging system of the cell (59). For this reason, the availability of NAD+ precursors and their subcellular-specific employment could regulate the activity of GSH/GSSG system in an organelle-dependent way. The prevalence of a cytosolic GSH pool likely makes it sensitive to the presence of an active NAM/NAMPT axis and to its pharmacological inhibition. In addition, G6PD, which is the major source of NADPH, can also be activated post-transcriptionally by SIRT2-dependent deacetylation (59).
Characterization of subcellular NAD+ pools and compartmentalized NAD+ biosynthetic pathways are pivotal to tailor therapeutic interventions, modulating the balance between NAD+ consumption and production. This work was undertaken with the dual aim of obtaining a clearer picture of NAD+ biosynthesis in BRAF-mutated melanoma cells and to set up conditions to follow its modifications in live cells. To address our aims, of all the tools developed in the last 10 years for real-time measuring of NAD+ or NAD+/NADH levels (50, 65), we used a recently devised genetically encoded NAD+ biosensor (9), which was targeted to the cytosol, nuclei, and mitochondria. The choice of this biosensor is based on its intrinsic properties (i) as a ratiometric tool specific for NAD+ detection, (ii) optimal binding affinity for physiological cellular NAD+ concentrations. In addition, (iii) the biosensor is easy to manipulate and has equally easy readouts.
BRAF-V600E A375 cells were used as experimental model, as it was shown that, to support increased cellular growth rates, they reprogrammed NAD+ biosynthesis by overexpressing NAMPT. This NAMPT overexpression is even stronger during BRAF inhibitors resistance development (2, 3), a frequent clinical complication incurring in MM of patients. The basal NAD+ concentration in the cytosol and nuclei of A375 cells in the exponential growth phase was estimated at 260 μM and at 499 μM in mitochondria (Fig. 8), in keeping with previously reported values for total intracellular free NAD+ levels ranging between 200 and 500 μM (10, 29, 31, 57, 61). In addition, in basal conditions, the recently estimated NAD+ pool concentrations in cultured mammals and murine-derived cell lines (HEK293T, HeLa, U2OS, NIH3T3) move from 60 to 120 μM for the nuclei and cytosol (9, 29, 50), increasing to ∼300 μM in mitochondria (9, 10, 29). These reported compartmentalized NAD+ concentrations are tightly dependent on the cell type. For this reason, it was not surprising for us to find the aforementioned concentration of free NAD+ in the cytosol, nuclei, and mitochondria of A375 cells. Indeed, for these cells, HPLC measurements already detected more than double the NAD+ content compared with normal melanocytes (2). Moreover, by combining dynamic measurements using live cells and organelle fractionation, we can conclude that NAMPT is quantitatively the most expressed NAD biosynthetic enzyme in A375 cells and undoubtedly the dominant one in the cytosol (Fig. 8). If we look at the nuclear compartment, the prevalent NBE is NRK followed by NAMPT. Cytosol and nuclei are considered exchangeable compartments for the diffusion of NAD+ pools (31). This concept, together with the revealed high expression levels of NRK in the nuclei, could explain similar levels of NAD+ concentrations between the cytosol and nucleus of A375 cells.
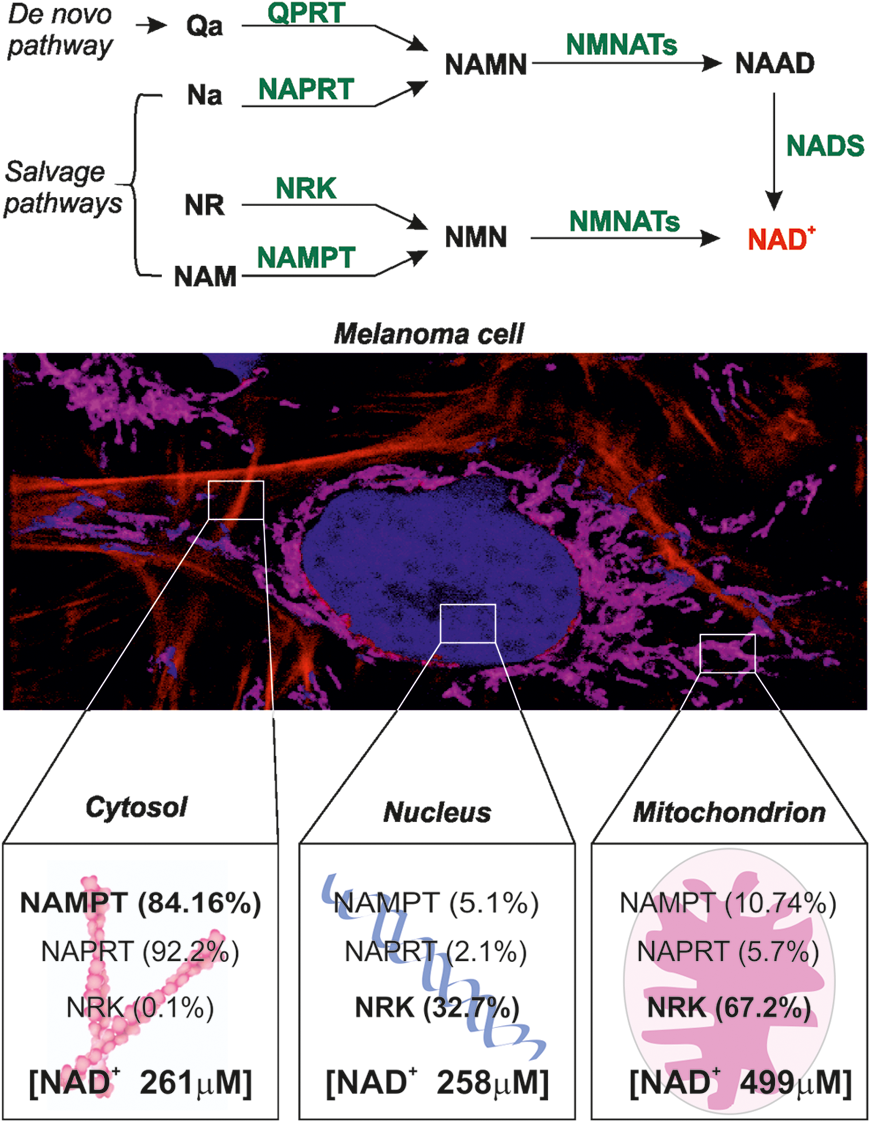
By combining two well-established protocols for mitochondria purification (21, 32, 63), we found that mitochondria of MM cells appear to be equipped predominantly with NRK and possibly with lower levels of NAMPT and NAPRT (Fig. 8). Even though mitochondrial NAD+ contents can reach up to 70% of total intracellular NAD+ (1), how its levels are maintained remains a matter of debate. Two processes, glycolysis and NAD+ biosynthesis, directly link cytoplasmic and mitochondrial NAD+ pools (54). The NADH produced by glycolysis is transported into the mitochondrial matrix by NAD/NADH redox shuttles (62), providing reducing equivalents for the TCA cycle and electron transport chain. The former process reduces O2 to water and NADH to NAD+ to produce ATP, generating mitochondrial NAD+ levels much higher than the other cellular compartment (43). In addition, maintenance of NAD+ levels in the compartment is also dependent on salvaging NAM produced by NAD+-consuming enzymes. The current view of the field is that NRKs are preferentially located in the cytosol and nucleoplasm, and while it is accepted that NR is the preferred NAD+ precursor for mitochondrial NAD+ synthesis (29, 40, 53), no evidence is available indicating NRK activity in mitochondria.
One of the current hypotheses about mitochondrial NAD+ is that it can be maintained by the NMNAT-3 conversion of NMN or by the membrane transport of NAD+ precursors (NAM, NMN) or even NAD+ itself. Indeed, while some demonstrated that NAD+ is unable to cross the mitochondrial membrane and that pyridine nucleotides are instead broken down to the corresponding nucleosides (40, 44, 53, 54), others affirmed that only intact NAD+ can restore depleted mitochondria NAD+ levels (17, 20). Even if the first eukaryotic mitochondrial NAD+ carrier, named Ndt1p, was identified in Saccharomyces cerevisiae (55) and in 2009 Palmieri et al. identified a chloroplast and mitochondrial NAD+ carrier protein in Arabidopsis thaliana (41), no mammalian transporter for NAD+ has yet been found.
For these reasons, whether there is a complete NAD+ biosynthetic apparatus or a system transport for NAD+ in mitochondria remains unclear (17). Our data, both biochemical and biosensor based, suggest that NRK is present in the mitochondria, at least in A375 melanoma cells, arguing in favor of direct NAD+ biosynthesis in these organelles. In addition, the prevalent NRK expression in mitochondria could suggest the use of NRK inhibitors. Consistently, recent data by Chowdhry et al. indicated that NRK-dependent synthesis of NAD+ causes the failure of NAMPTis and that both NRK knockdown or dual inhibition of NAMPT and NRK lowered the dose of FK866 needed to arrest tumor growth, leading to persistent tumor regression in vivo (14).
Intracellular NAMPT is ubiquitously present in human body, even if its expression varies according to tissues (46, 49). Different experimental approaches have been exploited to define mitochondrial presence of NAMPT in different cell lines with controversial results (9, 17, 29, 40, 61). We found that also mitochondria are sensitive to NAMPT inhibition and that a small amount of NAMPT is present in these organelles. However, alternative explanations such as cytosolic import of NAD+ cannot be excluded, as well as a cell-type dependence of NAD+ biosynthetic pathways localization. At the concentrations used, NA raised NAD+ levels rescued FK866-dependent NAD+ depletion in all compartments, pointing to a very efficient NAPRT pathway. On the contrary, neither NR nor NAM raised NAD+ levels in mitochondria, even though both NRK and NAMPT are present in the organelles. The finding that NMN induced a slight increase of mitochondrial NAD+ may reflect regulated transport of these metabolites. With the exception of QA, all tested NAD+ precursors, including NMN, are effective in boosting NAD+ levels in the cytosol and nuclei. Among them, only NR is unable to rescue the FK866-induced NAD+ depletion in the cytosol, in keeping with previous data that suggest that the NAM and NR pathways can converge on NAMPT. According to these data, NR would be converted to NAM by a nucleoside phosphorylase before the NAMPT catalyzed reaction (5, 36). This is in keeping with the very low levels of NRK in the cytosol, as demonstrated by Western blot and confocal microscopy.
Overall, our data provide a proof-of-principle of the validity of the use of organelle-specific biosensors to monitor NAD+ fluctuations that occur in physiopathological conditions. They also reinforce the concept of compartmentalization of NAD+ biosynthesis, an essential aspect to understand how NAD+ metabolism impacts on cancer cell metabolic adaptation. By offering a more complete picture of NAD+ biosynthesis in MM, we aim to open the window of therapeutic strategies combining inhibitors of oncogenic signaling and of NAD+ biosynthesis.
Materials and Methods
cpVENUS-based NAD+ sensor construct
The NAD+ biosensor is a chimeric molecule, composed of a cpVENUS fluorescent protein linked to a bipartite NAD+-binding domain of a bacterial DNA ligase (LigA1b and LigA1a) (9, 15, 19). Cytosolic, nuclear, and mitochondrial biosensor expression vectors were kindly provided by X.A. Cambronne (Department of Molecular Biosciences, University of Texas, Austin).
The incorporation of specific targeting sequences (CTGCAGAAAAAGCTGGAAGAGCTGGAACTGGAC for the cytosol, ATGCTGGCCACCCGCGTGTTCAGCCTGGTGGGCAAGCGCGCCATCAGCACCAGCGTGTGCGTGCGCGCCCAC for mitochondria, and CCAAAGAAGAAGCGTAAGGTA for the nuclei) allows these biosensors to be expressed in an organelle-specific way. DNA was amplified, incorporated in lentiviral particles (see Generation of lentivirus section), and used for stable cell transduction. The LigA-cpVENUS biosensor presents two excitation peaks, one at 488 nm that decreases according to NAD+ elevation and a second one at 405 nm that is unaffected by substrate variations, serving as internal control and system calibrator (9, 15, 19).
Generation of lentivirus
The vector plasmids (CMV-Sensor-IRES-puro-5 μg) together with third-generation packaging plasmids (pMDL-2 μg, pRSV-Rev-2 μg, and the VSVG envelope encoding plasmid-1.2 μg, all from Addgene) were used for 293T cells transfection by using commercial Effectene transfection system (cod. 301425; Qiagen, Milan, Italy). After 48 h, supernatants were collected, cells debris excluded (centrifugation at 600 g for 5 min), and lentiviral particles concentrated (ultracentrifugation at 121,603 g for 2 h) and used for cell transduction.
Generation of cell lines stably expressing biosensors
A375 BRAF-V600E-mutated cell lines were from the American Type Culture Collection (ATCC). BRAF inhibitor-resistant (BiR) variants were generated as described previously (2). Cells expressing cytosolic, nuclear, or mitochondrial biosensors were obtained by transducing both A375/S (A375 sensitive to BRAF inhibitors) and A375/BiR cells with a lentiviral vector carrying the specific organelle-targetable biosensor or with the organelle-targetable cpVENUS alone, using polybrene (8 μg/mL, cod. H9268; Sigma, Milan, Italy). cpVENUS-positive cells were flow sorted (FACSAriaIII; BD Biosciences, Milan, Italy) and used as reported.
Cell treatments
A375/S and A375/BiR lines were cultured in RPMI-1640 (cod. R6504; Sigma) with 10% of fetal calf serum (FCS, cod. F7524; Sigma) and 10 IU/mL of penicillin/streptomycin (cod. P4333; Sigma). Cells were exposed to the following treatments for 16 h. For NAMPT inhibition, cells were treated with 25 nM FK866 (cod. F8557; Sigma). Treatments with NAD+ precursors were with 500 μM NMN (cod. N3501), 6 μM NA (cod. N4126), 0.5 μM NAM (cod. N3376), 200 μM QA (cod. P63204 all from Sigma), and 100 μM NR (kind gift of ChromaDex, Irvine, CA).
Flow cytometry analysis
For flow cytometry analysis, cells were trypsinized (cod. T4049; Sigma) and collected in RPMI 10% FCS. Sensor/cpVenus FITC (excitation 488 nm, emission 530/30 nm) and BV510 (excitation 405 nm, emission 525/50 nm) were measured by flow cytometry (BD FACS Celesta) and data processed with DIVA version 8 (BD Biosciences) and FlowJo version 10.01 softwares (TreeStar, Ashland, OR). Cells were gated using forward scatter (FSC) and side scatter (SSC) for the live cells and then further gated on both SSC and FSC width to exclude doublets, analyzing at least 104 cells per sample. The analysis required a double ratio, expressed as a “ratio of ratios” (i.e., fold change). The first is the ratiometric 488/405 measurement detected by the biosensor, and the second one is obtained by the parallel analysis of 488 nm/405 nm fluorescence changes of cells expressing the cpVENUS-only control (9, 15, 19). The cpVENUS 488/405 nm fluorescence ratio is used to normalize for NAD+ changes independent of the biosensor. F0 refers to the ratio of ratios obtained in untreated conditions (F0 = 1). NAD+ variations are finally expressed as the inverse relationship between the “ratio of ratios” changes and the cofactor concentrations. A “ratio of ratios” value >1 indicates decreased NAD+ concentrations, whereas values <1 indicate increased levels of NAD+.
Calibration curves
Calibration curves of cytosolic and nuclear biosensors were generated as previously described (9). In details, cells expressing correspondent biosensors were permeabilized with saponin (0.005%) in the presence of propidium iodide (PI, cod. P4170; Sigma). Permeabilization status was monitored by looking at the percentage of PI-positive cells. For mitochondrial biosensor-expressing cells, cells were first permeabilized for 10 min with saponin 0.005% and then treated with 30 μg/mL AlaM (cod. A4665; Sigma) to obtain mitochondria permeabilization and NAD+ exchange through the organelle. Permeabilized cells were exposed to increasing concentrations (from 0 to 4 mM for the cytosol and nuclei and from 0 to 10 mM for mitochondria) of exogenous NAD+ (cod. N-1511-1G; Sigma). The NAD+-dependent fluorescence changes were monitored by flow cytometry. Each point composing the curve is the result of the ratio between 488 and 405 nm values of the biosensor normalized to the relative cpVENUS and finally normalized on F0 (0 μM of NAD+).
Mitochondria purification
Mitochondria isolation was performed as previously described (21, 32, 63). Briefly, A375 cells (15 × 107) were resuspended in isolation buffer (chilled) (IPc) (200 mM sucrose, 1 mM Tris-HCL, 1 mM EGTA, pH 7.4). Cells were mechanically disrupted by using an Elvehjem potter (cod. P7734; Sigma), and suspension was centrifuged (600 g, 10 min, 4°C). This step was repeated twice to increase purification efficiency. Pellet was discarded and mitochondria-containing supernatant was centrifuged (8000 g, 10 min, 4°C). A centrifugation (8500 g, 10 min, 4°C) on a discontinuous Percoll gradient (60%, 30%, and 18% Percoll, cod. GE17-0891-01; GE Healthcare, Milan, Italy), in IBc, was used as last step of purification. The fraction between the 30% and 18% gradients was collected and washed three times by centrifugation at 19,000 g for 10 min. Purified mitochondria were then lysed in a 1% NP-40 based buffer, subjected to Bradford quantification, and prepared for Western blot analysis with the same technical approach used for whole cell lysates (see Western blot analysis section).
Nuclei purification
Nuclei were isolated through a salt-based protocol and differential centrifugation steps. Cells (8 × 10⁶) were collected from culture and resuspended in Buffer A (300 mM sucrose, 10 mM HEPES, 10 mM KCl, 2 mM MgCl2, 1 mM EGTA, KOH pH 7.9, complete of phosphatase and protease inhibitors). To lyse cells, NP-40 (0.15%) was added to the suspension, before centrifuging (1300 g for 5 min), and the supernatant was centrifuged (16,000 g, 15 min, 4C°) to eliminate membrane residues and used as cytosolic portion of the fractionating protocol. The pellet was then washed five times in Buffer B (50 mM HEPES, 400 mM NaCl, 1 mM EDTA, pH 7.5 NAOH) (1300 g, 5 min) and subjected to five sonication steps. Finally, the suspension was centrifuged (130,000 g for 15 min) and the obtained supernatant was used as pure nuclear protein fraction.
Western blot analysis
Whole cells or subcellular fractions obtained as described above were resolved by sodium dodecyl sulfate–polyacrylamide gel electrophoresis (SDS-PAGE) and transferred to nitrocellulose filter membranes (cod. 1704158; Bio-Rad, Milan) (2). After blocking (5% not-fat dry milk, cod. sc2325; Santa Cruz Biotechnology, Heidelberg, Germany), membranes were incubated with anti-GFP (cod 2555S; Cell Signaling Technologies, Danvers, MA), anti-vinculin (cod. 130007; Abcam, Cambridge, United Kingdom), anti-tubulin (cod. 2114; Cell Signaling Technologies), anti-actin (cod. sc-47778; Santa Cruz Biotechnology), anti-Hadha (cod. 203114; Abcam), anti-cytochrome C (cod. 556433; BD Bioscience), anti-H2A (cod. ab18255; Abcam), anti-NAMPT (cod. A300-779A; Bethyl Laboratories, Montgomery, TX), anti-NAPRT1 (cod. NBP1-87243; Novus Biologicals, Cambridge, United Kingdom), anti-C9orf95 (NRK1, cod. ab169548), and anti-QPRT (cod. ab57125 both from Abcam). After incubation with horseradish peroxidase-conjugated secondary antibody (cod. NEF822001EA; PerkinElmer, Milan, Italy), reaction was visualized with ECL (cod. 1705061; Bio-Rad) using ImageQuant LAS4000 (GE Healthcare).
Confocal microscopy
Cells expressing organelle-specific biosensors were cultured on glass coverslips in 24-well plates, rinsed once with phosphate-buffered saline (PBS), fixed (4% paraformaldehyde, 10 min, room temperature), permeabilized (0.1% saponin in PBS, 20 min, room temperature), and saturated with preimmune goat serum (1:100, 1 h, 4°C). For NBEs localization studies, after saturation, cells were incubated with primary antibodies: anti-NAMPT, anti-NAPRT1, anti-C9orf95, anti-QPRT, and anti-TOM20 (cod. SC-11415 from Santa Cruz Biotechnology). MitoTracker Deep Red (ThermoFischer, cod. M22426) was used for mitochondria staining. TCS SP5 laser scanning confocal microscope equipped with an oil immersion 63 × objective, was used for fluorescence acquisition. Images were acquired with the LAS AF software (Leica Microsystem), files were processed with Photoshop (Adobe Systems, San Jose, CA), and pixel intensity was calculated using the ImageJ software.
Time-lapse analysis
For time-lapse imaging, A375 cells (12 × 105) were cultured into a μ-Slide 4-well Ibidi Chambered coverslips (cod. 80426; Ibidi, Giemme Snc, Milan, Italy) in RPMI-1640 with 10% of FCS. TCS SP5 was also equipped for maintaining cells under physiological conditions (5% CO2 and 37°C) for the duration of the experiments. At time 0 (t = 0), cells were treated with FK866 25 nM for a period of 6 h. Time-lapse series were acquired with 10 min intervals for mitochondrial and nuclear biosensor, with 5 min for cytosolic biosensor, between successive frames. To obtain the full cell thickness, for each acquisition field, different z-stacks were acquired, and the sum of z stacks obtained with the ImageJ software analysis was used for video generation. Finally, the ImageJ plugin “image calculator” was used to obtain the values of fluorescence ratio between 488 and 405 nm channels.
Statistical analyses
Statistical analyses were performed with GraphPad version 6.0 (GraphPad Software, Inc., La Jolla, CA). Data were analyzed by two-sided paired Student's t-test. Results are reported as box plots, where the top and bottom margins of the box define the 25th and 75th percentiles, the line in the box defines the median, and the error bars define the minimum and maximum of all data. p Value <0.05 was considered to be statistically significant.
Footnotes
Acknowledgments
Thanks are given to Dr. Xiaolou Cambronne (University of Austin, TX) for providing the constructs, to Dr. Marta Gai (University of Turin, Turin Italy) for assistance in the use of the confocal microscope and in data analysis, and to Dr. Ambra Grolla (University of Eastern Piedmont, Novara, Italy) for providing protocols for nuclei isolation. Experiments were performed in the laboratories of the Italian Institute for Genomic Medicine (IIGM).
Author Disclosure Statement
No competing financial interests exist.
Funding Information
This work was supported by the GILEAD Fellowship Program (Gilead Italia 2018 to S.D.) and by the Ministry of Education, University and Research, PRIN Project 2017CBNCYT (to S.D.) and “Dipartimenti di Eccellenza 2018–2022” (project #D1518000410001) to the Department of Medical Sciences of the University of Turin.
Supplementary Material
Supplementary Movie S1
Supplementary Movie S2
Supplementary Movie S3
Abbreviations Used
References
Supplementary Material
Please find the following supplemental material available below.
For Open Access articles published under a Creative Commons License, all supplemental material carries the same license as the article it is associated with.
For non-Open Access articles published, all supplemental material carries a non-exclusive license, and permission requests for re-use of supplemental material or any part of supplemental material shall be sent directly to the copyright owner as specified in the copyright notice associated with the article.