
Abstract
Aims:
To understand the molecular pathways involved in oxidative stress (OS)-mediated sperm dysfunction against a hypoxic and hyperthermic microenvironment backdrop of varicocele through a proteomic approach.
Results:
Protein selection (261) based on their role in redox homeostasis and/or oxidative/hyperthermic/hypoxic stress response from the sperm proteome data set of unilateral varicocele (UV) in comparison with fertile control displayed 85 to be differentially expressed. Upregulation of cellular oxidant detoxification and glutathione and reduced nicotinamide adenine dinucleotide (NADH) metabolism accompanied with downregulation of protein folding, energy metabolism, and heat stress responses were observed in the UV group. Ingenuity pathway analysis (IPA) predicted suppression of oxidative phosphorylation (OXPHOS) (validated by Western blotting [WB]) along with augmentation in OS and mitochondrial dysfunction in UV. The top affected networks indicated by IPA involved heat shock proteins (HSPs: HSPA2 and HSP90B1). Their expression profile was corroborated by immunocytochemistry and WB. Hypoxia-inducible factor 1A as an upstream regulator of HSPs was predicted by MetaCore. Occurrence of reductive stress in UV spermatozoa was corroborated by thiol redox status.
Innovation:
This is the first evidence of a novel pathway showing aberrant redox homeostasis against chronic hypoxic insult in varicocele leading to sperm dysfunction.
Conclusions:
Upregulation of antioxidant system and dysfunctional OXPHOS would have shifted the redox balance of biological redox couples (GSH/GSSG, NAD+/NADH, and NADP+/NADPH) to a more reducing state leading to reductive stress. Chronic reductive stress-induced OS may be involved in sperm dysfunction in infertile men with UV, where the role of HSPs cannot be ignored. Intervention with antioxidant therapy warrants proper prior investigation.
Introduction
Varicocele is the abnormal dilation and tortuosity of the pampiniform venous plexus within the spermatic cord (5). Decreased blood supply in a varicocele testis may lead to hypoxia-mediated oxidative stress (OS) and subsequently impaired sperm function. Moreover, distinct increment in the levels of reactive oxygen species (ROS) in chronic hyperthermic conditions has been demonstrated in cellular models (26). However, fertile men with varicocele might have cytoprotective mechanisms to combat the aforementioned oxidative damage (9). It could be hypothesized that ischemic/hypoxia and hyperthermia combined with induced OS is the mediating machinery for testicular tissue damage in infertile men with varicocele (9, 30, 33, 49).
Innovation
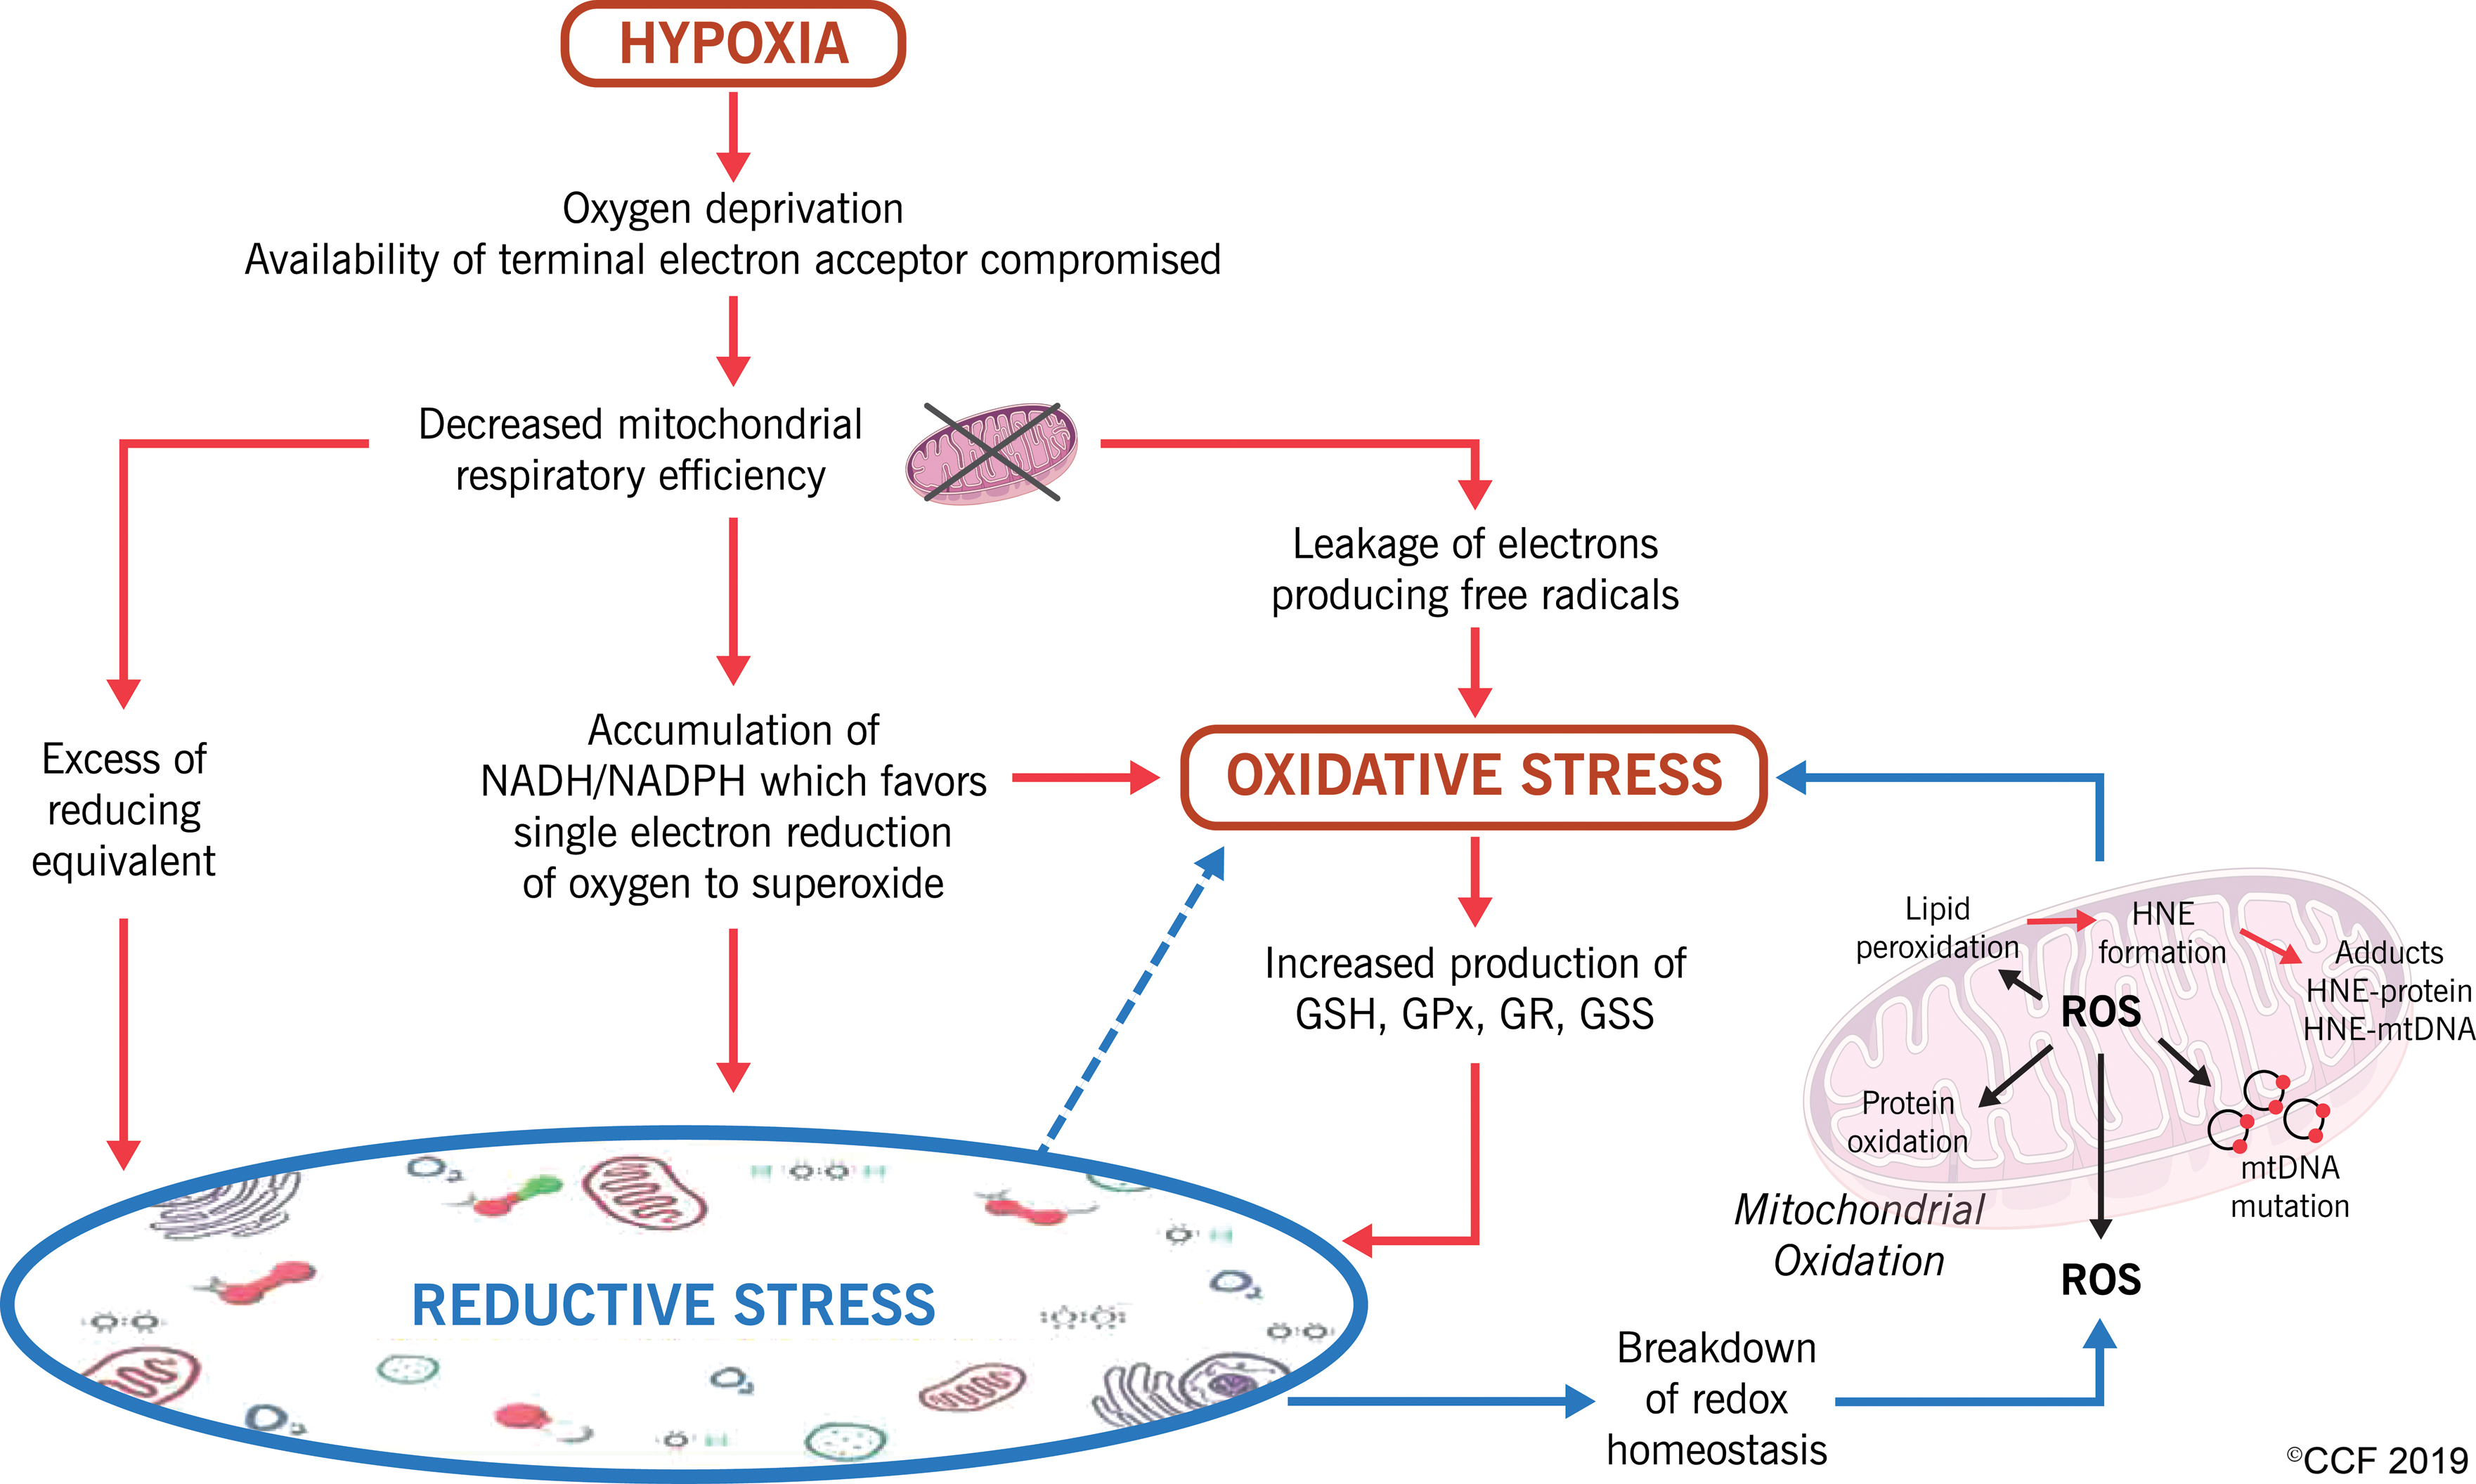
Oxidative stress has been advocated as the common consequence to a diverse etiology of infertility, including varicocele. Nevertheless, there remains a paucity of information regarding the mechanism involved. This novel study demonstrates the distinct role of chronic reductive stress in reactive oxygen species generation in spermatozoa from infertile men who presented with unilateral varicocele (Fig. 9). Our findings have for the first time demonstrated reductive stress as an adaptive response, which when not reconciled, results in sperm damage where the role of heat shock protein downregulation cannot be undermined. Therefore, special caution should be taken before advising antioxidant therapy for sperm quality enhancement.
Despite being principally a unilateral disease, Wang et al. for the first time reported the bilateral damage caused by unilateral varicoceles (UVs) (69). Left-sided varicocele is reported to induce bilateral testicular hypoxia that could eventually lead to bilateral germ cell apoptosis. In a pioneering study by our group, we had reported the differentially expressed proteins (DEPs) in infertile men with unilateral varicocele (UV) in comparison with healthy fertile donor (FD) men (7).
Recently, we demonstrated impairment of the mitochondrial structure and function, including hypoxia sensing, in infertile men with varicocele and hypothesized that this in turn might have altered the mitochondrial redox circuitry of sperm, resulting in sperm dysfunction. We validated the hypothesis using a combination of wet laboratory and in silico techniques (59).
The present study aims to further explore the DEPs detected in UV men compared with fertile men and to characterize the proteins into those related or responsive to (1) redox homeostasis and/or (2) stress (OS/heat stress/hypoxic stress). The aberrant redox homeostasis on exposure to chronic hypoxic and hyperthermic conditions would explain the molecular mechanisms leading to sperm OS in varicocele. Furthermore, with the etiology of varicocele being multifactorial, researchers have also explored the exposure of exogenous toxicants in mediating oxidative testicular damage in the testis of varicocele patients (62). A recent report determined the impact of metal toxicity in inducing oxidative and nitrosative stresses (27). The present work also targeted the major toxicity functions enriched by selected DEPs to postulate the contribution of the latter in causing varicocele-associated infertility.
Results
Semen analysis and assessment of OS in sperm
Semen results showed that infertile men with UV had a sperm concentration of 22.55 (12.21, 35.53) × 106/mL compared with FD having 64.90 (46.46, 75.58) × 106/mL. Percentage motility and normal morphology were significantly lower in the infertile UV group [40.23 (35.6, 47)%; 4.4 (2.39, 6.38)%] in comparison with the FD group [60.2 (55.5, 63.28)%; 8.4 (6.26, 18.03)%], respectively. Evaluation of seminal oxidation/reduction potential (ORP) revealed significantly higher levels in the UV group [2.2 (1.76, 3.3) mV/million sperm/mL] when compared with the FD group [1.23 (0.8, 1.53) mV/million sperm/mL], which indicated an imbalance in seminal redox homeostasis in UV subjects. ROS levels were 1436.22 (416.25, 2791.2) RLU/Sec/million sperm in UV, and 66.26 (24.1, 112.1) RLU/Sec/million sperm in FD, specifying significant increment in ROS levels in spermatozoa of UV patients.
Selection of DEPs from the data set based on their involvement in redox homeostasis and/or oxidative/heat/hypoxic stress response
Using the gene ontology (GO) analysis platform, 261 proteins were selected based on their involvement in (1) redox homeostasis and/or (2) response to stress (OS/heat stress/hypoxic stress), of which, 85 were DEPs, with 28 DEPs being overexpressed and 33 DEPs underexpressed in UV (Fig. 1a and Supplementary Table S1). Seventeen DEPs were uniquely detected in FD and seven DEPs were uniquely detected in UV sperm. Clustering of DEPs between FD and UV groups was distinctly represented by principal component analysis (PCA)—biplot, heatmap, and scatterplot (Fig. 1b–d).

GO enrichment analysis of selected DEPs
Molecular functions and biological processes associated with the selected proteins as investigated using the bioinformatic tool suggest that redox homeostasis is severely impaired. The proteins found in the respiratory chain complex (GO:0098803), mitochondrial protein complex (GO:0098798), catalytic complex (GO:1902494), transferase complex (GO:1990234), and oxidoreductase complex (GO:1990204) were mostly underexpressed in the UV group. DEPs enriched in biological processes such as cellular oxidant detoxification (GO:0098869); regulation of cell redox homeostasis (GO:0045454); glutathione (GSH) metabolism (GO:0006749); and reduced nicotinamide adenine dinucleotide (NADH) (GO:0006734) metabolic process were mostly overexpressed in UV group and enriched by overexpressed proteins. On the contrary, a higher percentage of underexpressed proteins in UV group were associated with protein folding (GO:0035966, GO:0006986, GO:0042026, and GO:0051131); energy metabolism (GO:0045333, GO:0006120, GO:0022904, GO:0042773, GO:0042775, GO:0006119, and GO:0043462); and cellular response to heat stress (GO:1900034, GO:0034605, GO:0009408), resulting in downregulation of the above processes. Similarly, an overview of enriched functions demonstrated that proteins associated with oxidoreductase activity with NAD(P) as an H acceptor (GO:0016668), peroxidase activity (GO:0004601), and flavin adenine dinucleotide (FAD) binding (GO:0050660) were mostly overexpressed in UV group; whereas proteins with NADH dehydrogenase (ubiquinone) activity (GO:0008137), unfolded protein binding (GO:0051082), isomerase activity (GO:0003756), and oxidoreductase activity (GO:0015037) of protein disulfide were underexpressed in UV group compared with FD group.
Pathway enrichment analysis of selected DEPs
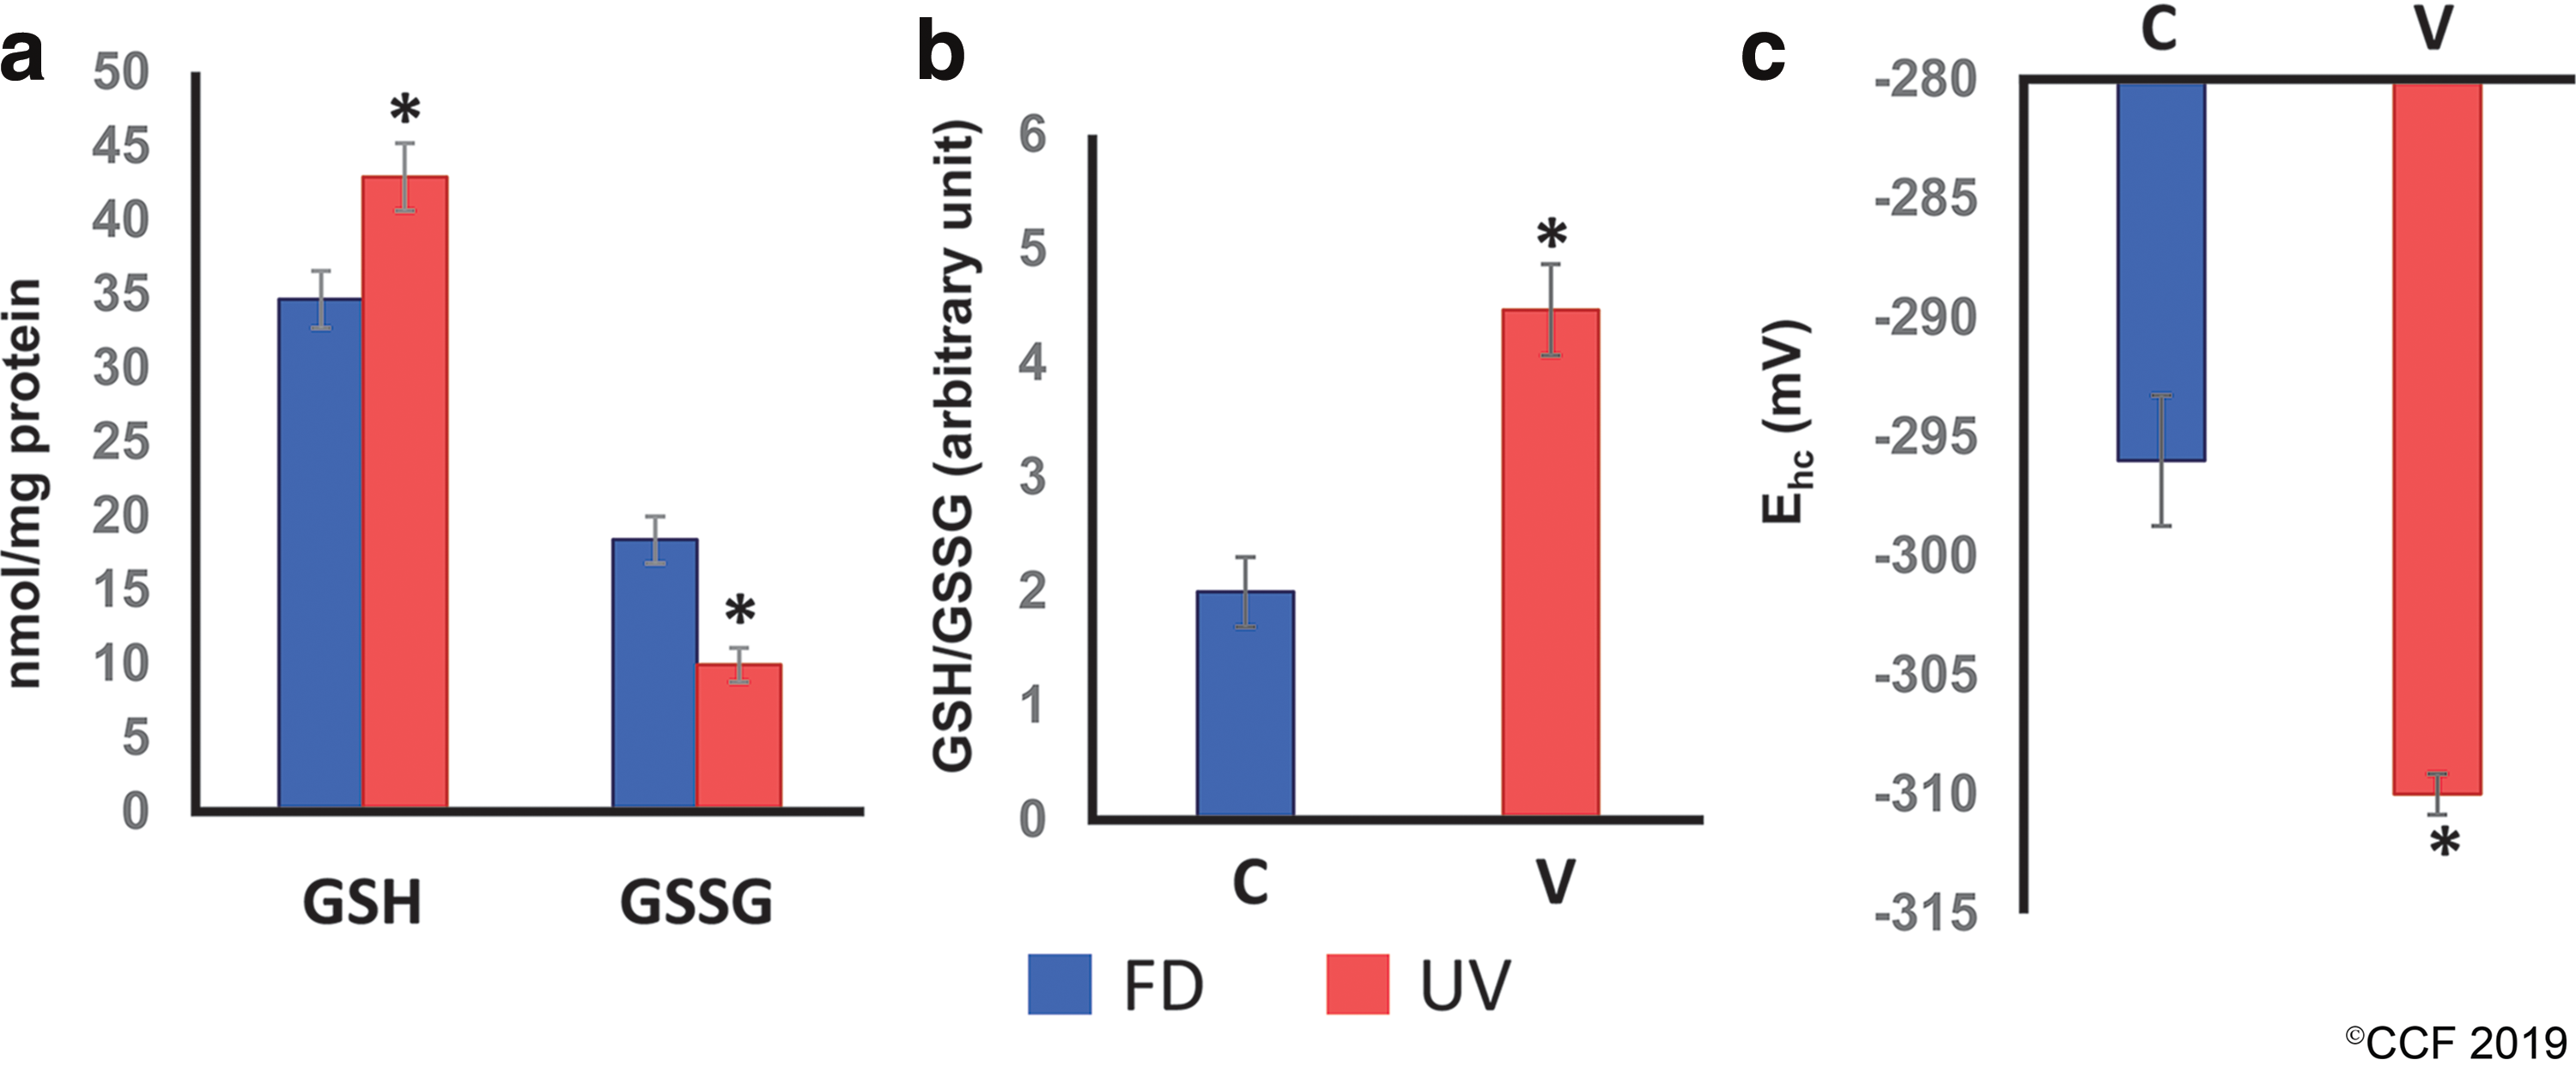
ClueGO pathway enrichment analysis of DEPs demonstrated enrichment of 233 pathways curated from KEGG, REACTOME, and Wiki pathway databases (Supplementary Fig. S1). The metabolic pathways mostly affected included glycolysis (KEGG:00010 and R-HSA:70171), TCA cycle/ETC (KEGG:00020, R-HSA:71403, R-HSA:1428517, R-HSA:71406, WP:78, WP:2453, KEGG:00190, R-HSA:611105, R-HSA:163200, and WP:111), and fatty acid metabolism (R-HSA:611105 and R-HSA:163200). In addition, attenuation of the following pathways (KEGG: 04714, R-HSA: 3371453, and R-HSA: 3371556) indicated poor heat shock response (HSR). Furthermore, a disturbed regulatory and metabolic signaling in an imbalanced redox state would be apparent from the dysregulated expression of proteins associated with OS (R-HSA: 3299685 and WP: 408) and glutathione metabolism (KEGG: 00480, R-HSA: 174403, R-HSA: 156590, and WP: 100). To corroborate the alteration in the redox environment of sperm in the UV patients, GSH/glutathione disulfide (GSSG) concentrations as a representative redox couple were measured. An upsurge in the absolute concentrations in GSH indicated an enhanced reducing capacity (Fig. 2a), while the increased GSH/GSSG ratio further testified the occurrence of reductive stress in spermatozoa of UV group (Fig. 2b). Correspondingly, a lower steady-state reduction potential, that is, a more negative E hc value in UV patient's sperm compared with FD men (Fig. 2c), demonstrated a reductive state in the spermatozoa of UV men.
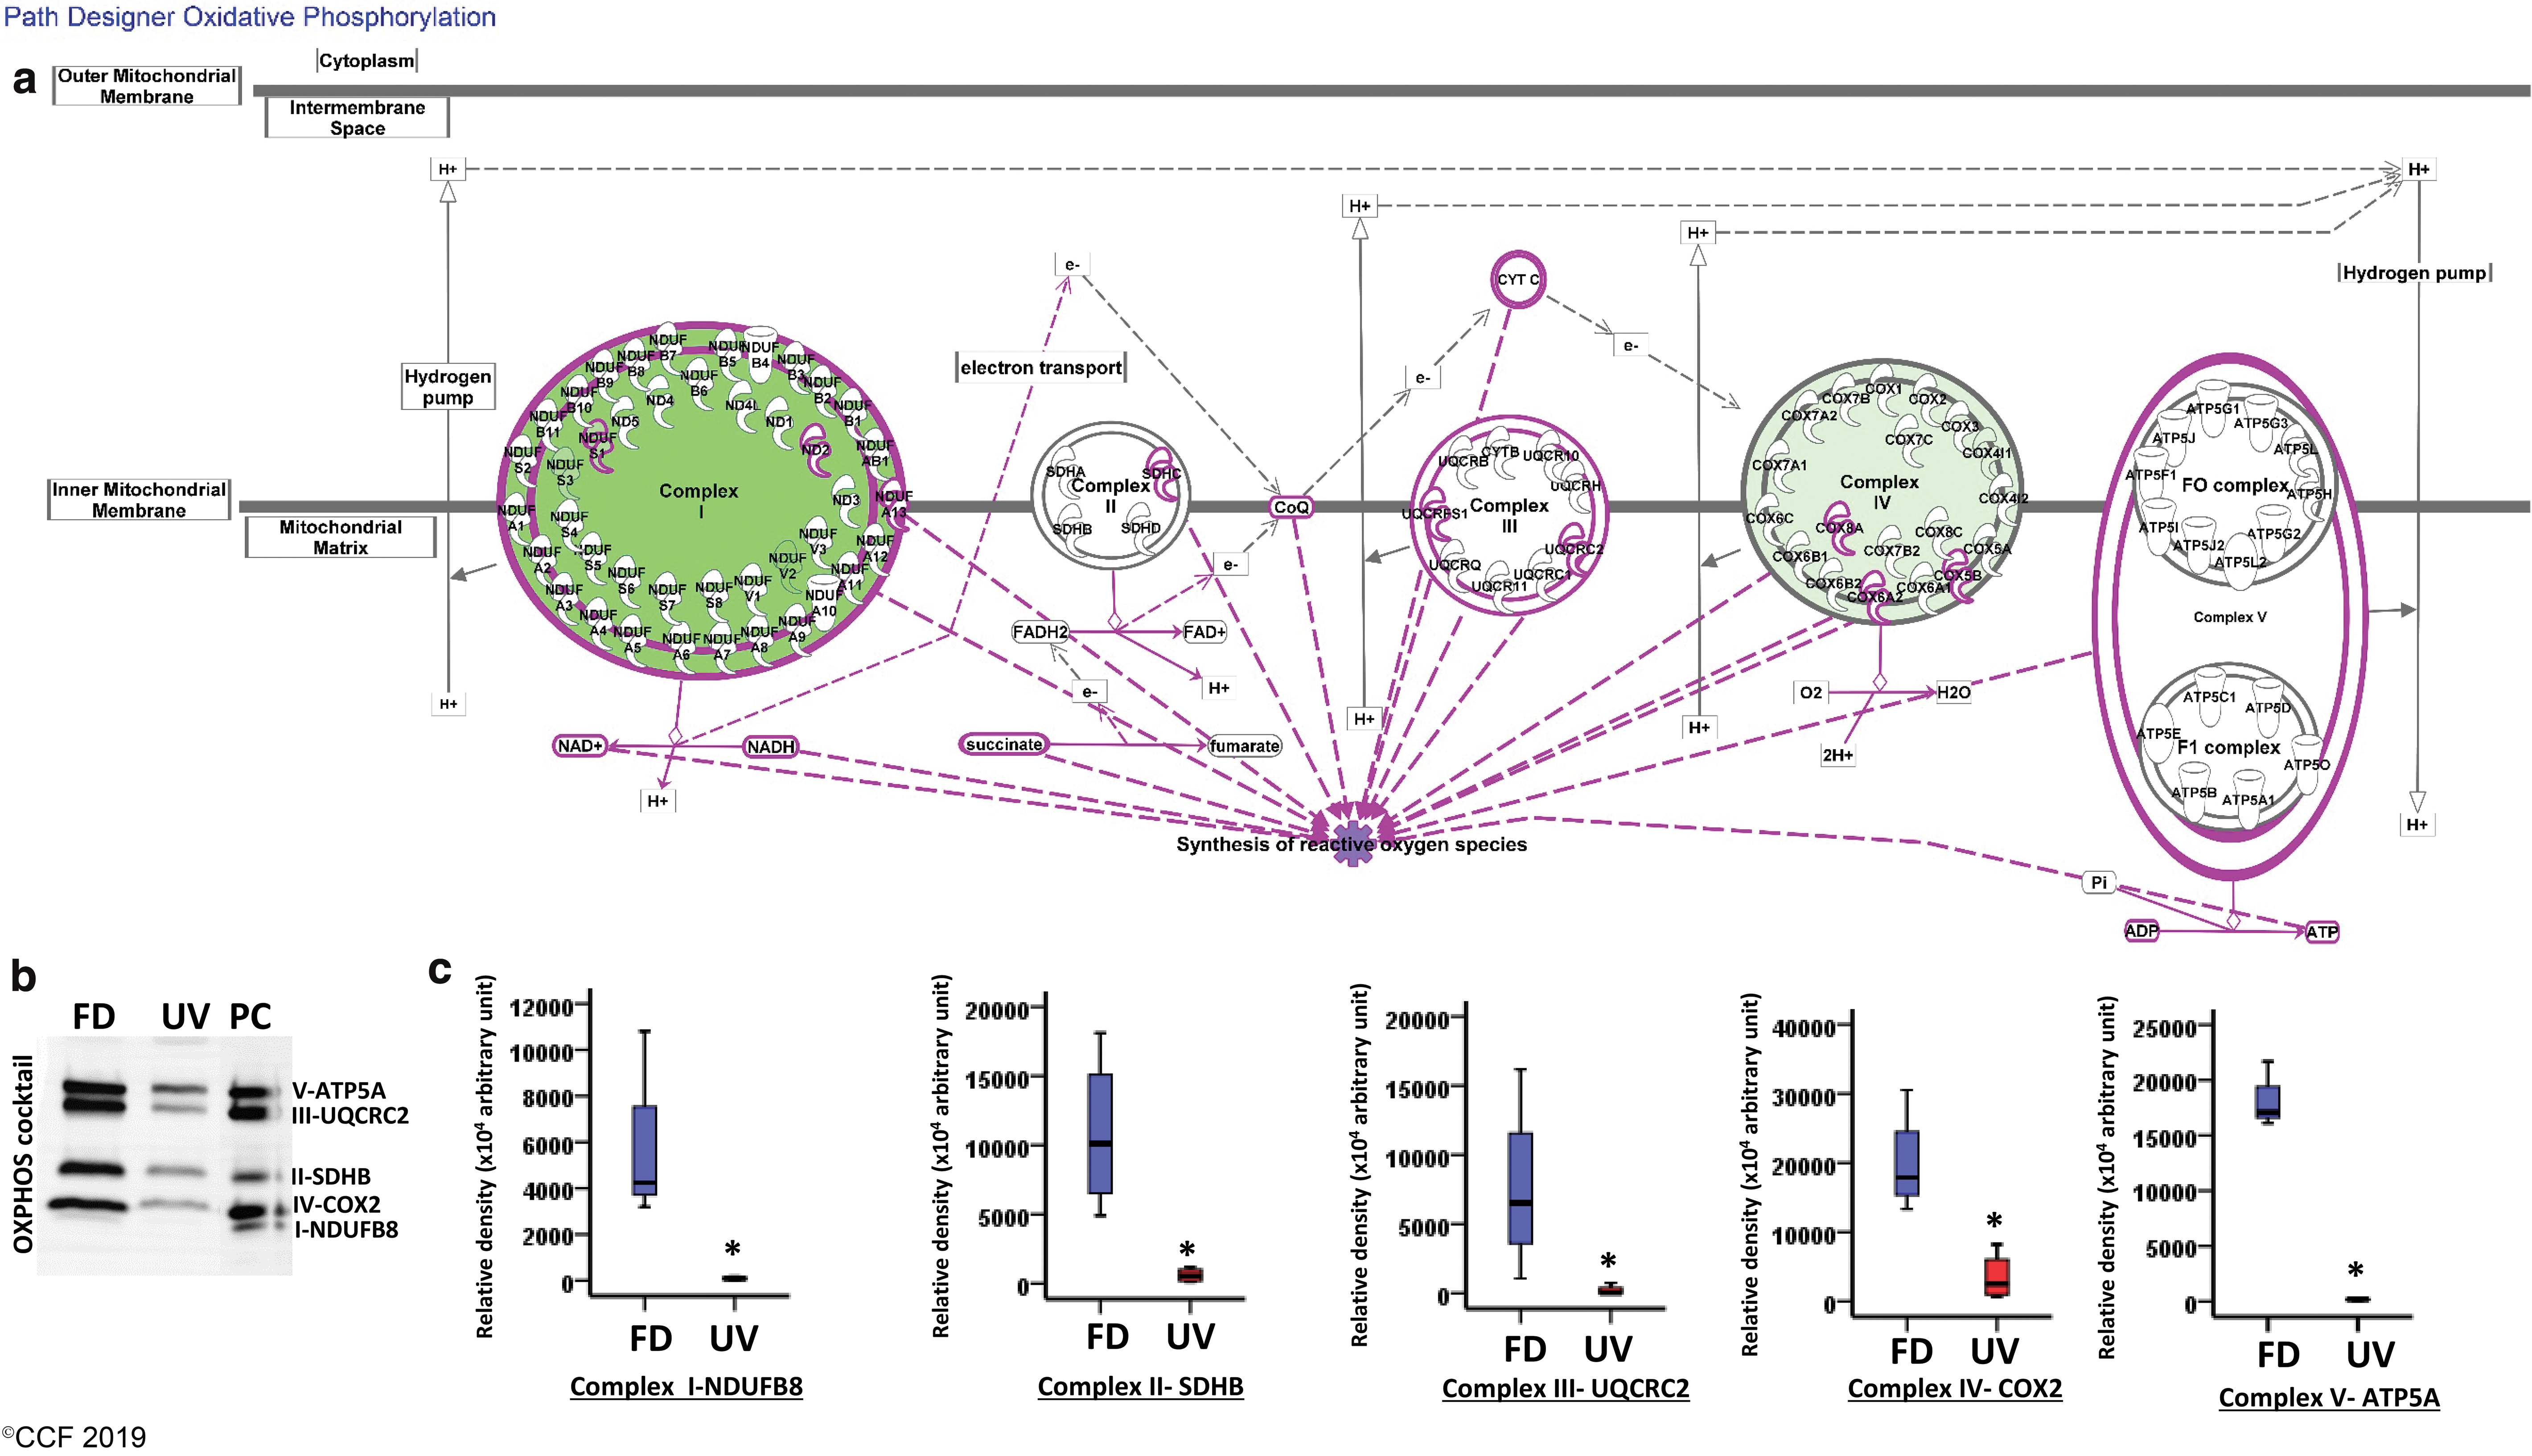
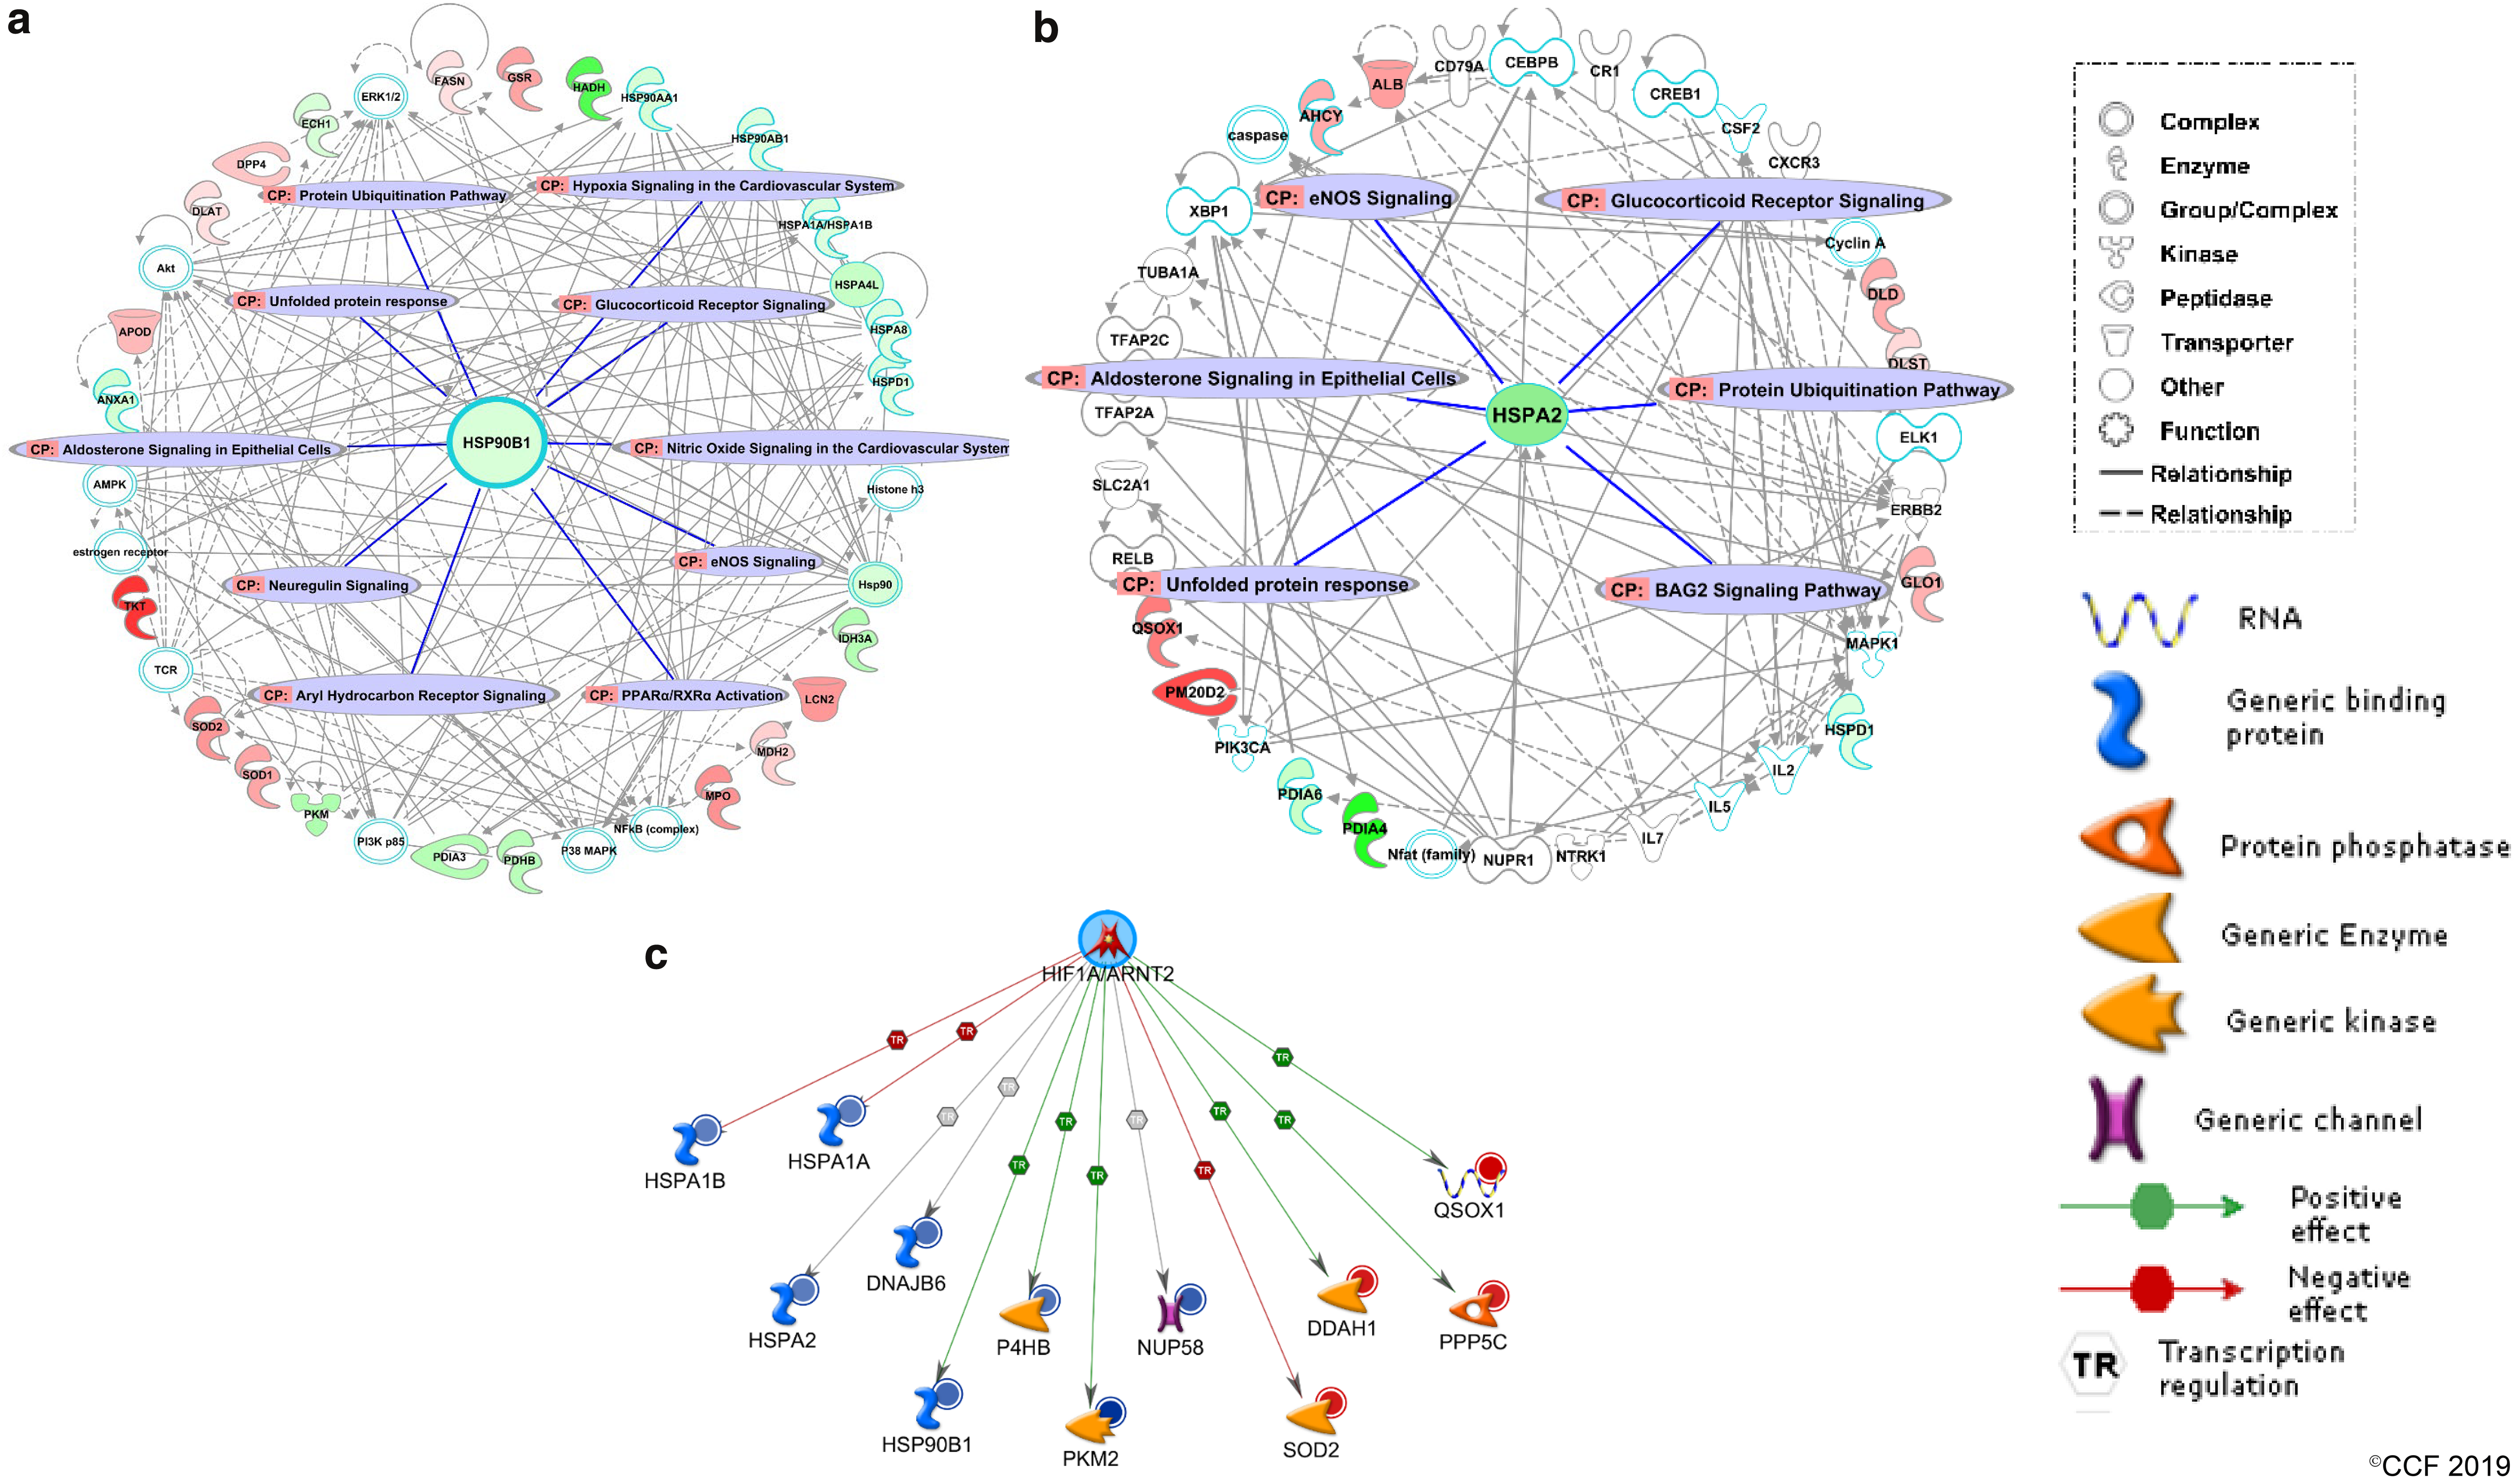
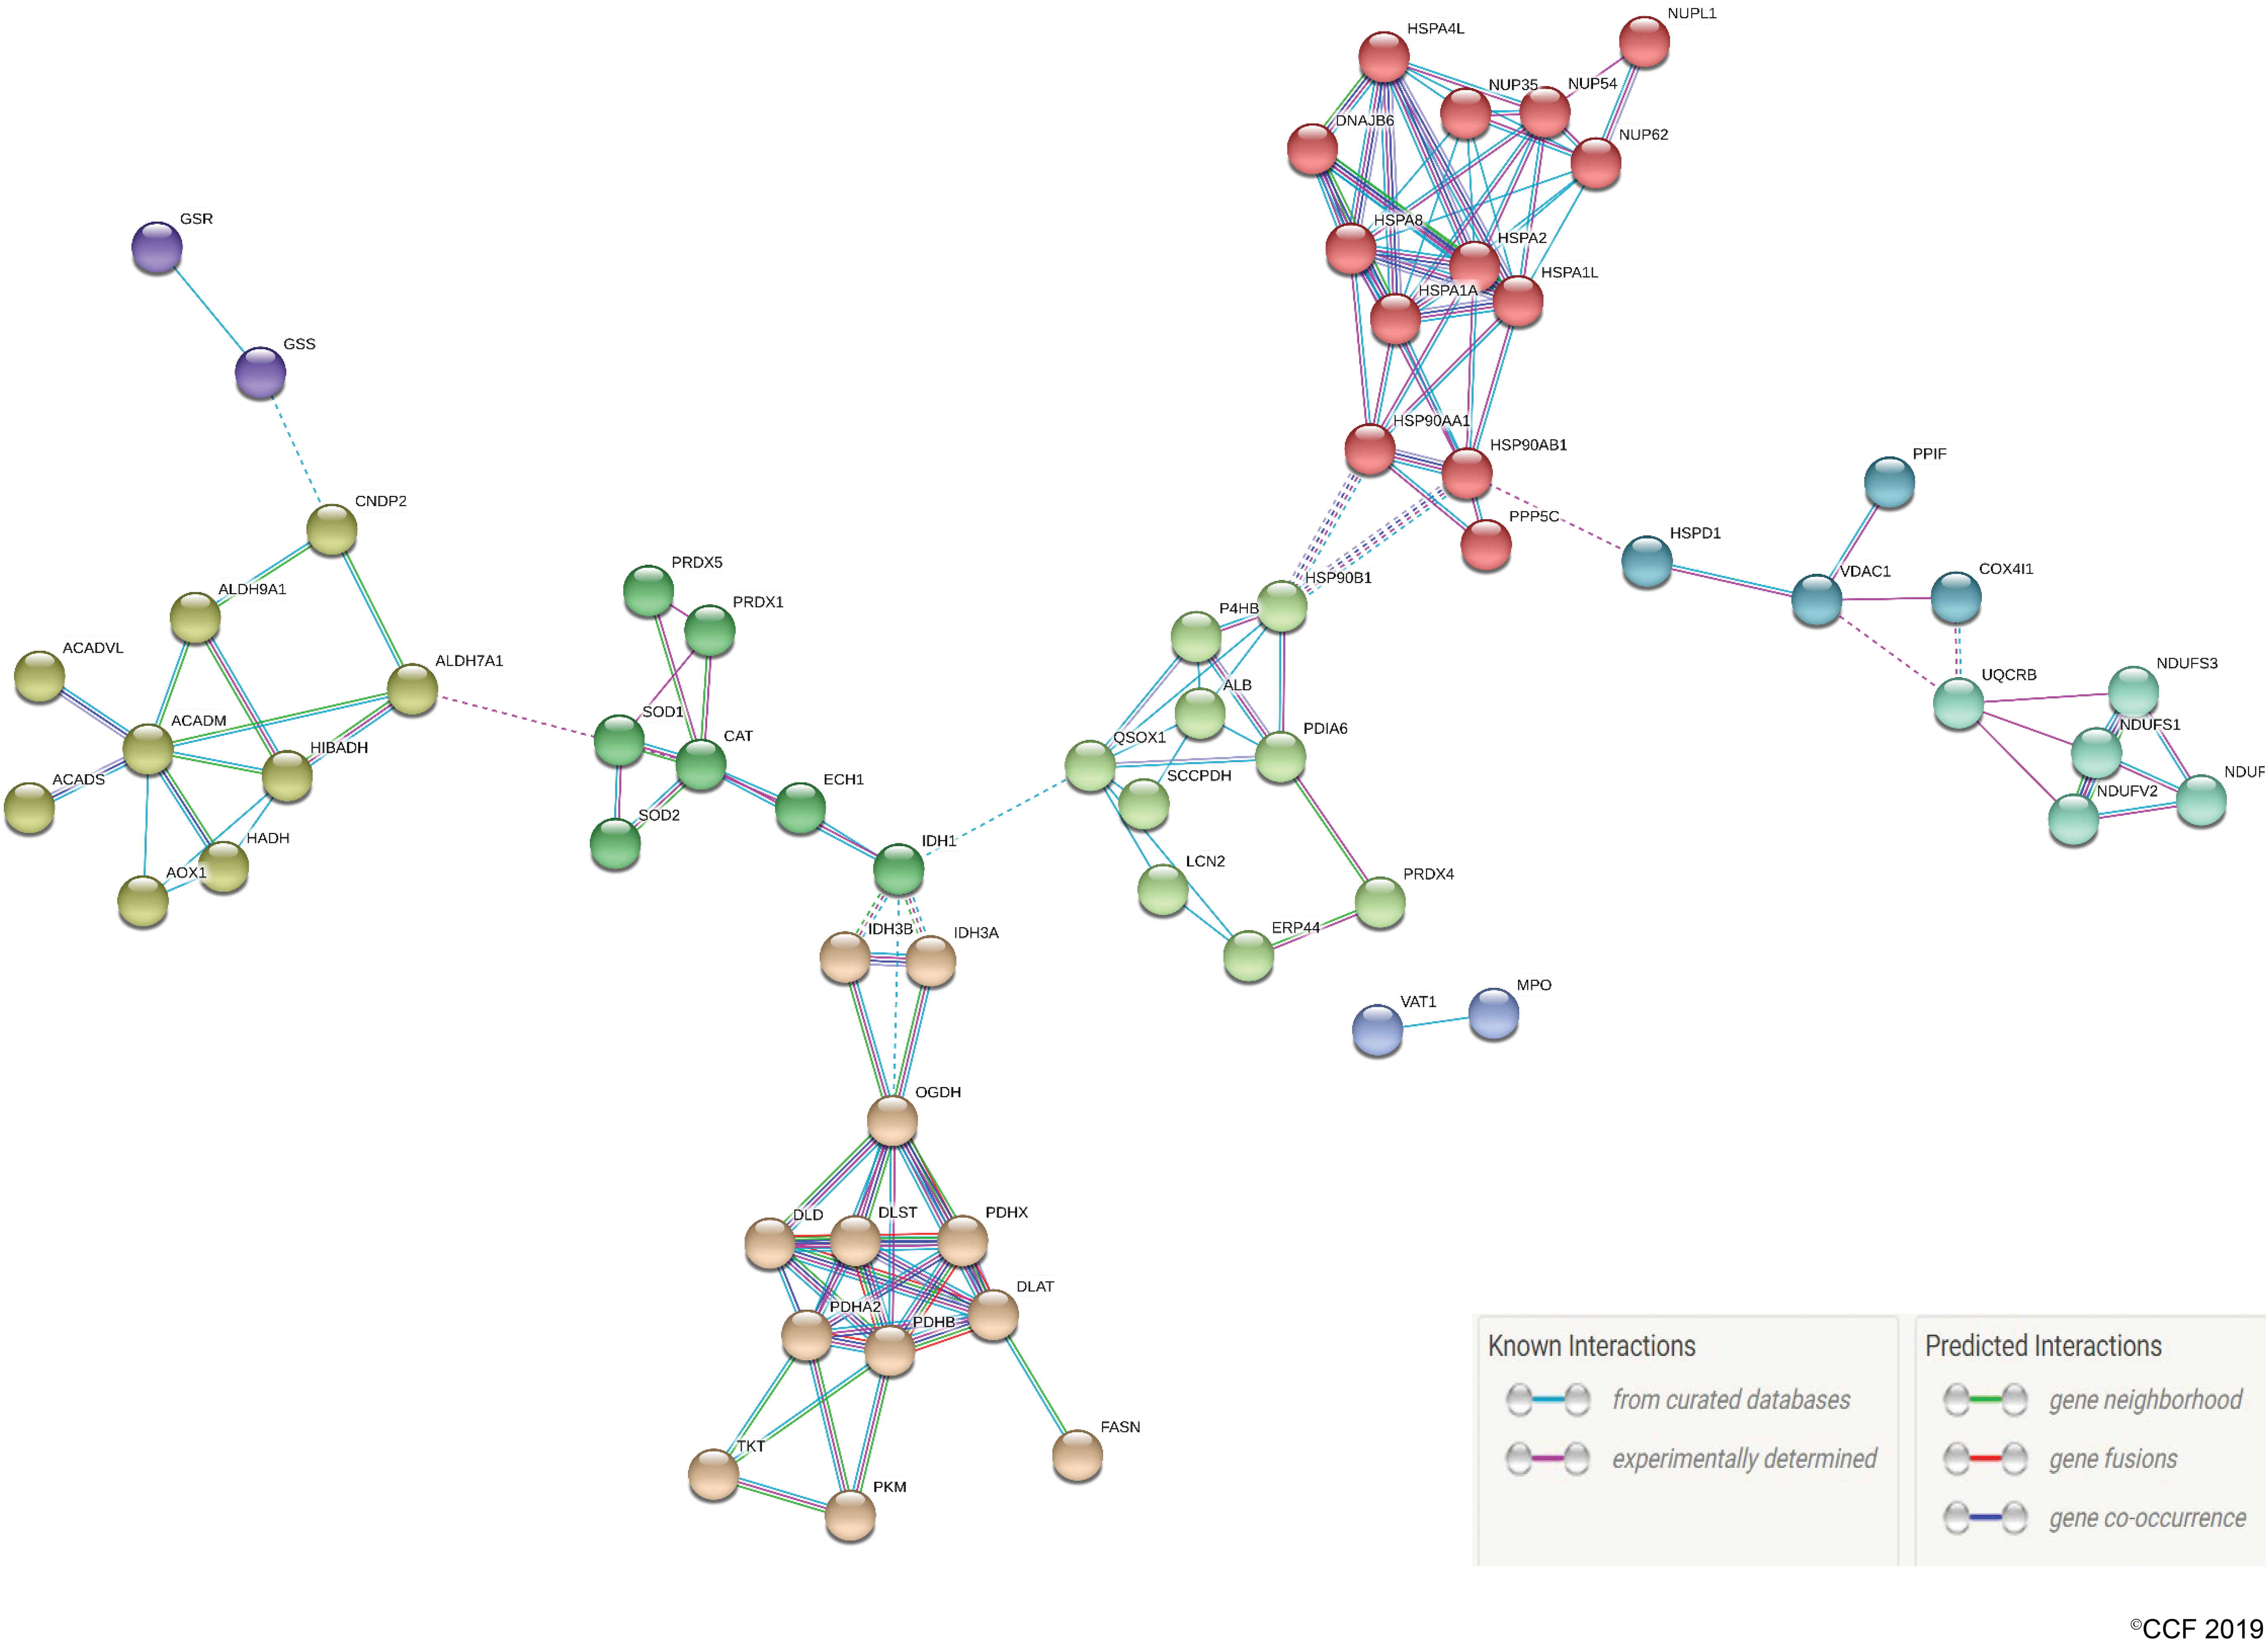
The possible activation or suppression states of targeted pathways were analyzed using the ingenuity pathway analysis (IPA). The IPA canonical pathway clearly predicted the suppressed activity of oxidative phosphorylation (OXPHOS) pathway with a negative activation z score of −2.0, conceivably due to downregulation of associated DEPs. The customized OXPHOS pathway generated by IPA also highlighted the presumed sites of ROS production in mitochondria (Fig. 3a). Diminished expression of OXPHOS proteins as corroborated by Western blot (Fig. 3b) and band intensities (Fig. 3c) further indicated the inhibition of proper OXPHOS in spermatozoa from the UV group and subsequent accumulation of unused reducing equivalents. Out of the eight heat shock proteins (HSPs) downregulated in UV, HSP90B1 (HSP90β) and HSPA2 were selected for validation based on their involvement with top two affected disease and function networks as revealed by IPA network analysis (Fig. 4a, b). The most enriched pathophysiological functions affected by HSP90B1 was “posttranslational modification, protein folding, cancer” (IPA score = 53), while HSPA2 was found to be associated with “cell death and survival, cellular development, cellular growth and proliferation” (IPA score = 18) (Supplementary Table S2). Transcriptional regulation of 12 key proteins, including HSPA2 and HSP90B1 by hypoxia-inducible factor 1A (HIF1A), was probed using MetaCore (Fig. 4c). Furthermore, the top five Tox Lists and Tox Functions determined by IPA-Tox showed that OS and mitochondrial dysfunction are the most affected toxicity functions (Supplementary Table S3). Protein–protein interaction analysis from the STRING database showed a strong association among the DEPs with a very high combined interaction score >0.9, thereby offering additional information about the complex interactive links between these DEPs (Fig. 5).
Expression and localization pattern of the HSPs in sperm
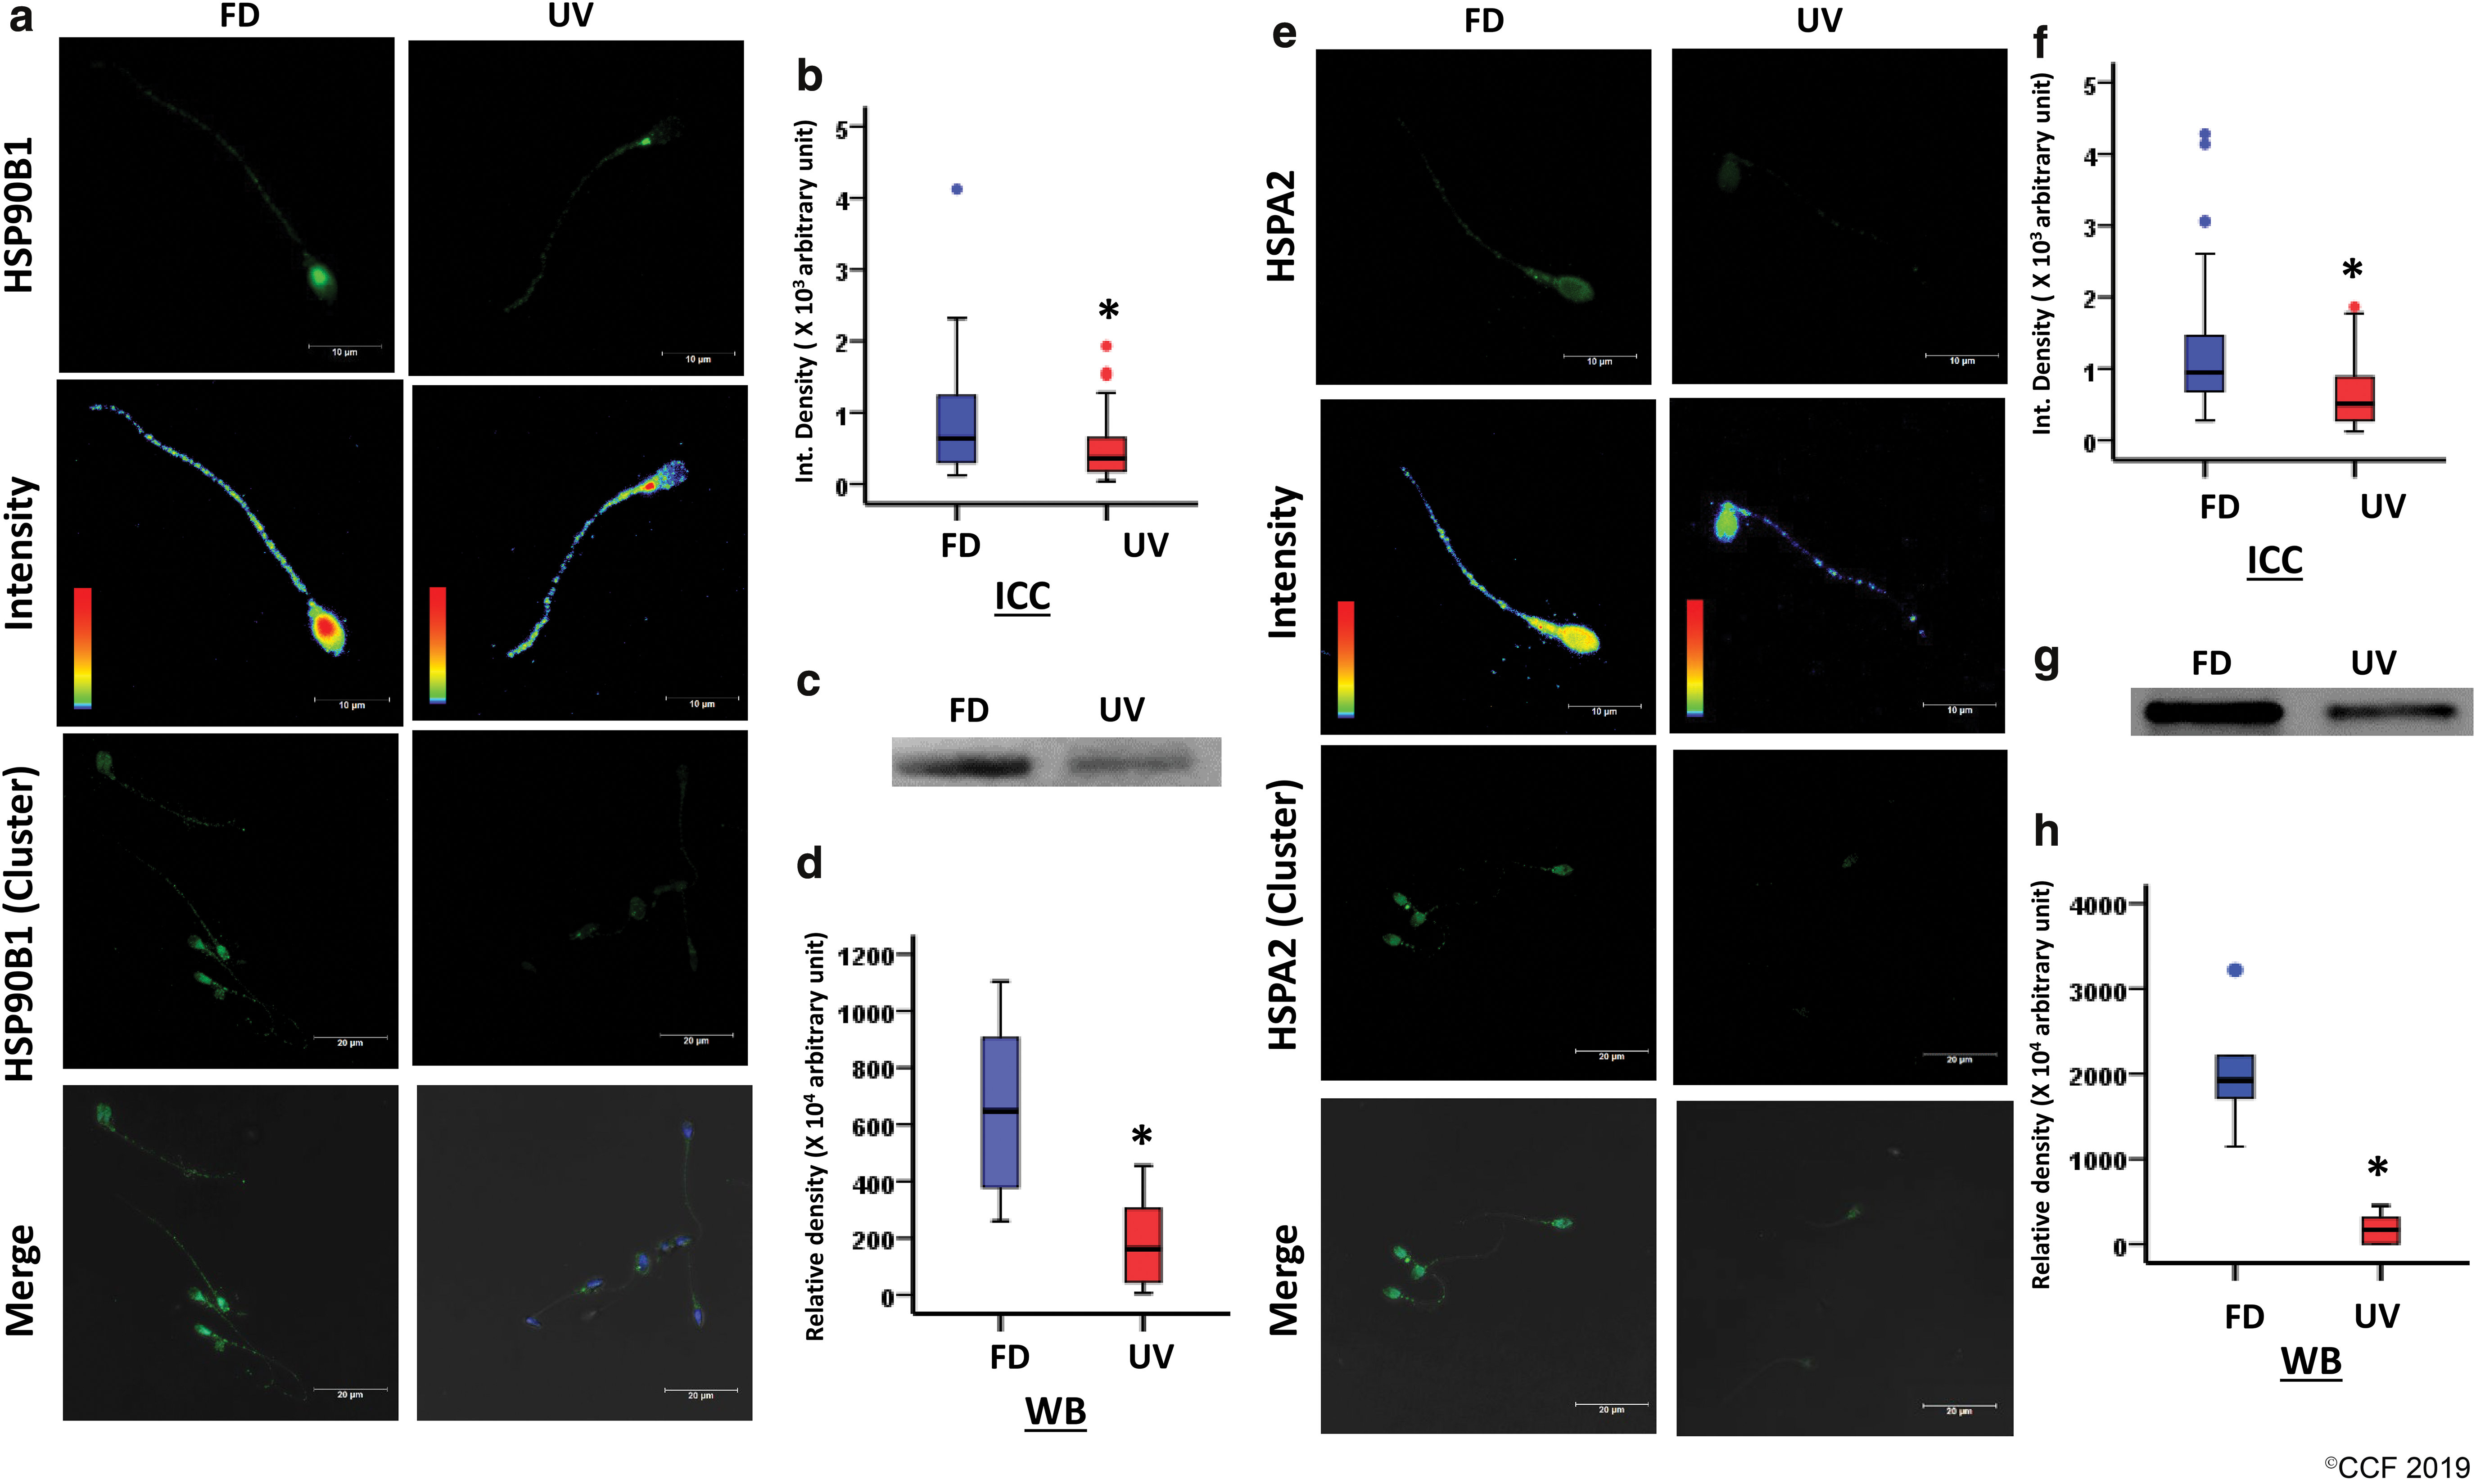
Low expression of HSPA2 and HSP90B1 in spermatozoa of UV patients compared with FD was validated by both immunocytochemistry (ICC) and Western blot results (Fig. 6). Immunocytochemically, both HSPA2 and HDP90B1 were observed to be localized throughout the sperm (Fig. 6a, e). HDP90B1 had a predominant expression at the posterior portion of head, in most of the sperm of FD. In contrast, HSPA2 was seen to be uniformly distributed at the head and neck region, with a punctate expression at the tail in both the groups. No change in the distribution/localization pattern of the aforementioned proteins was detected in the sperm of both groups, however, decreased expression of these proteins could be evidently inferred from the intensity spectrum images and integrated density measurements (Fig. 6a, b, e, and f). The Western blot results (Fig. 6c, d, g, and h) further corroborated an obliterated expression of HSPs in the sperm of varicocele patients, implying poor protection to hypoxia- and hyperthermia-mediated OS in the UV group.
Discussion
Augmented levels of ROS despite the unusual overexpression profile of antioxidants in spermatozoa of UV patients implicated the possible occurrence of reductive stress in this patient group. Although the term reductive stress was first introduced by Albrecht Wendel in 1987 (70), it remains less explored. Reductive stress is characterized by an imbalanced redox state associated with an aberrant increment in levels of reducing equivalents, such as NADH/reduced NAH phosphate, along with increased activation of antioxidant enzymes and reduced pro-oxidant capacity (21). Deleterious effects of reductive stress with overproduction of ROS were reported to be prevalent in hypoxic conditions where the availability of terminal electron acceptor (oxygen) is compromised (28, 51, 53). This makes the sperm samples in the UV patient group an ideal model to study the incidence of reductive stress in augmenting ROS production with respect to sperm biology.
Due to reduced venous outflow from the testis and epididymis, a state of relative hypoxia develops in varicocele patients (12). Cellular hypoxia is characterized by genetic and metabolic reprogramming that is facilitated by stabilization of a transcription factor such as HIF1A. Studies have reported HIF1A to induce testicular hypofunction in varicocele condition (38, 41, 69). In a hypoxic milieu, HIF1A enhances the expression of glycolytic genes (42), especially glucose transporters, glycolytic enzymes, lactate dehydrogenase A (LDHA), and pyruvate dehydrogenase kinase (60). In our study, we have detected overexpression of LDHA (nSC ratio = 1.09) and several glycolytic enzymes such as triose phosphate (nSC ratio = 1.53), glucose-6-phosphate isomerase (nSC ratio = 5.87), testis-specific glyceraldehyde-3-phosphate dehydrogenase (nSC ratio = 1.49), and α-enolase (nSC ratio = 1.42) in spermatozoa from UV group. However, the glycolytic kinases were underexpressed in varicocele sperm, namely hexokinase (nSC ratio = 0.69), phosphofructokinase (nSC ratio = 0.69), and pyruvate kinase isoenzyme M1/M2 (nSC ratio = 0.21), implying a disturbed glycolysis. HIF-1A is a ubiquitous, constitutively synthesized nuclear factor that, in normal conditions, is hydroxylated by prolyl hydroxylase domain (PHD) enzyme and subsequently degraded by the ubiquitin/proteasome pathway (74). In UV spermatozoa, upregulation of components of oxoglutarate dehydrogenase complex (nSc ratio = 2.09) and malate dehydrogenase (nSC ratio = 2.45) could be presumed to convert 2-oxoglutarate to succinyl-CoA (11). Lower levels of 2-oxoglutarate and higher levels of succinate are reported to inactivate PHD enzymes and stabilize HIF1 A (1).
NADH is formed mainly by conventional glucose metabolic pathways. As schematically illustrated in Figure 7a, it is plausible that overproduction of NADH can be predicted due to upregulation of NADH producing glycolytic and TCA cycle enzymes in UV spermatozoa. However, a major cohort of sperm in a varicocele patient has been reported to have inactive mitochondria (15) and poor mitochondrial respiratory efficiency (25). In congruence with the above results, we found a downregulated expression of all OXPHOS proteins in UV sperm sample (Fig. 3a). Incompetent oxidation of reductive respiratory equivalents, such as NADH, hydroquinone (fully reduced) form of FAD, ubiquinone, and respiratory cytochromes, creates an electron pressure in the mitochondria (66). The major sites of an electron leakage occur at mitochondrial complex I and III, where monoelectronic reduction of O2 is thermodynamically and kinetically feasible (19, 47, 68). Due to damage to the electron transport chain (ETC) or low adenosine triphosphate synthesis, electrons can be speculated to prematurely escape from ETC and produce ROS (43, 44) (Fig. 3b). Moreover, accumulation of cytosolic NADH inhibits glyceraldehyde-3-phosphate dehydrogenase favoring alternate utilization of glycolysis-derived triose phosphates (72). As the glycolytic intermediaries are directed to the advance glycation end-product pathway, methylglyoxal is generated, which is a potent intracellular glycating agent and ROS producer (58). The conversion of methylglyoxal to lactate in varicocele sperm could be mediated by overexpression of lactoylglutathione lyase (nSC ratio = 4.53) and hydroxyacylglutathione hydrolase (nSC ratio = 1.53) (22) (Fig. 5b). Accumulation of lactate with an underexpressed pyruvate dehydrogenase (nSC ratio = 0.37 for subunit α, 0.26 for subunit β) would lead to reductive stress in varicocele patients. Switching from glycolysis to the pentose phosphate pathway enhances the formation of NADPH as shown in Figure 7a (31). In UV spermatozoa, a significant overexpression of 6-phosphogluconate dehydrogenase (nSC ratio = 2.01) would have further augmented reductive stress. Thus, in an environment where redox homeostasis is severely impaired, mitochondria become both a source and a target of ROS. Moreover, reductive stress can lead to generation of ROS due to autoxidation of one and more mitochondrial complex(es) (23, 65).
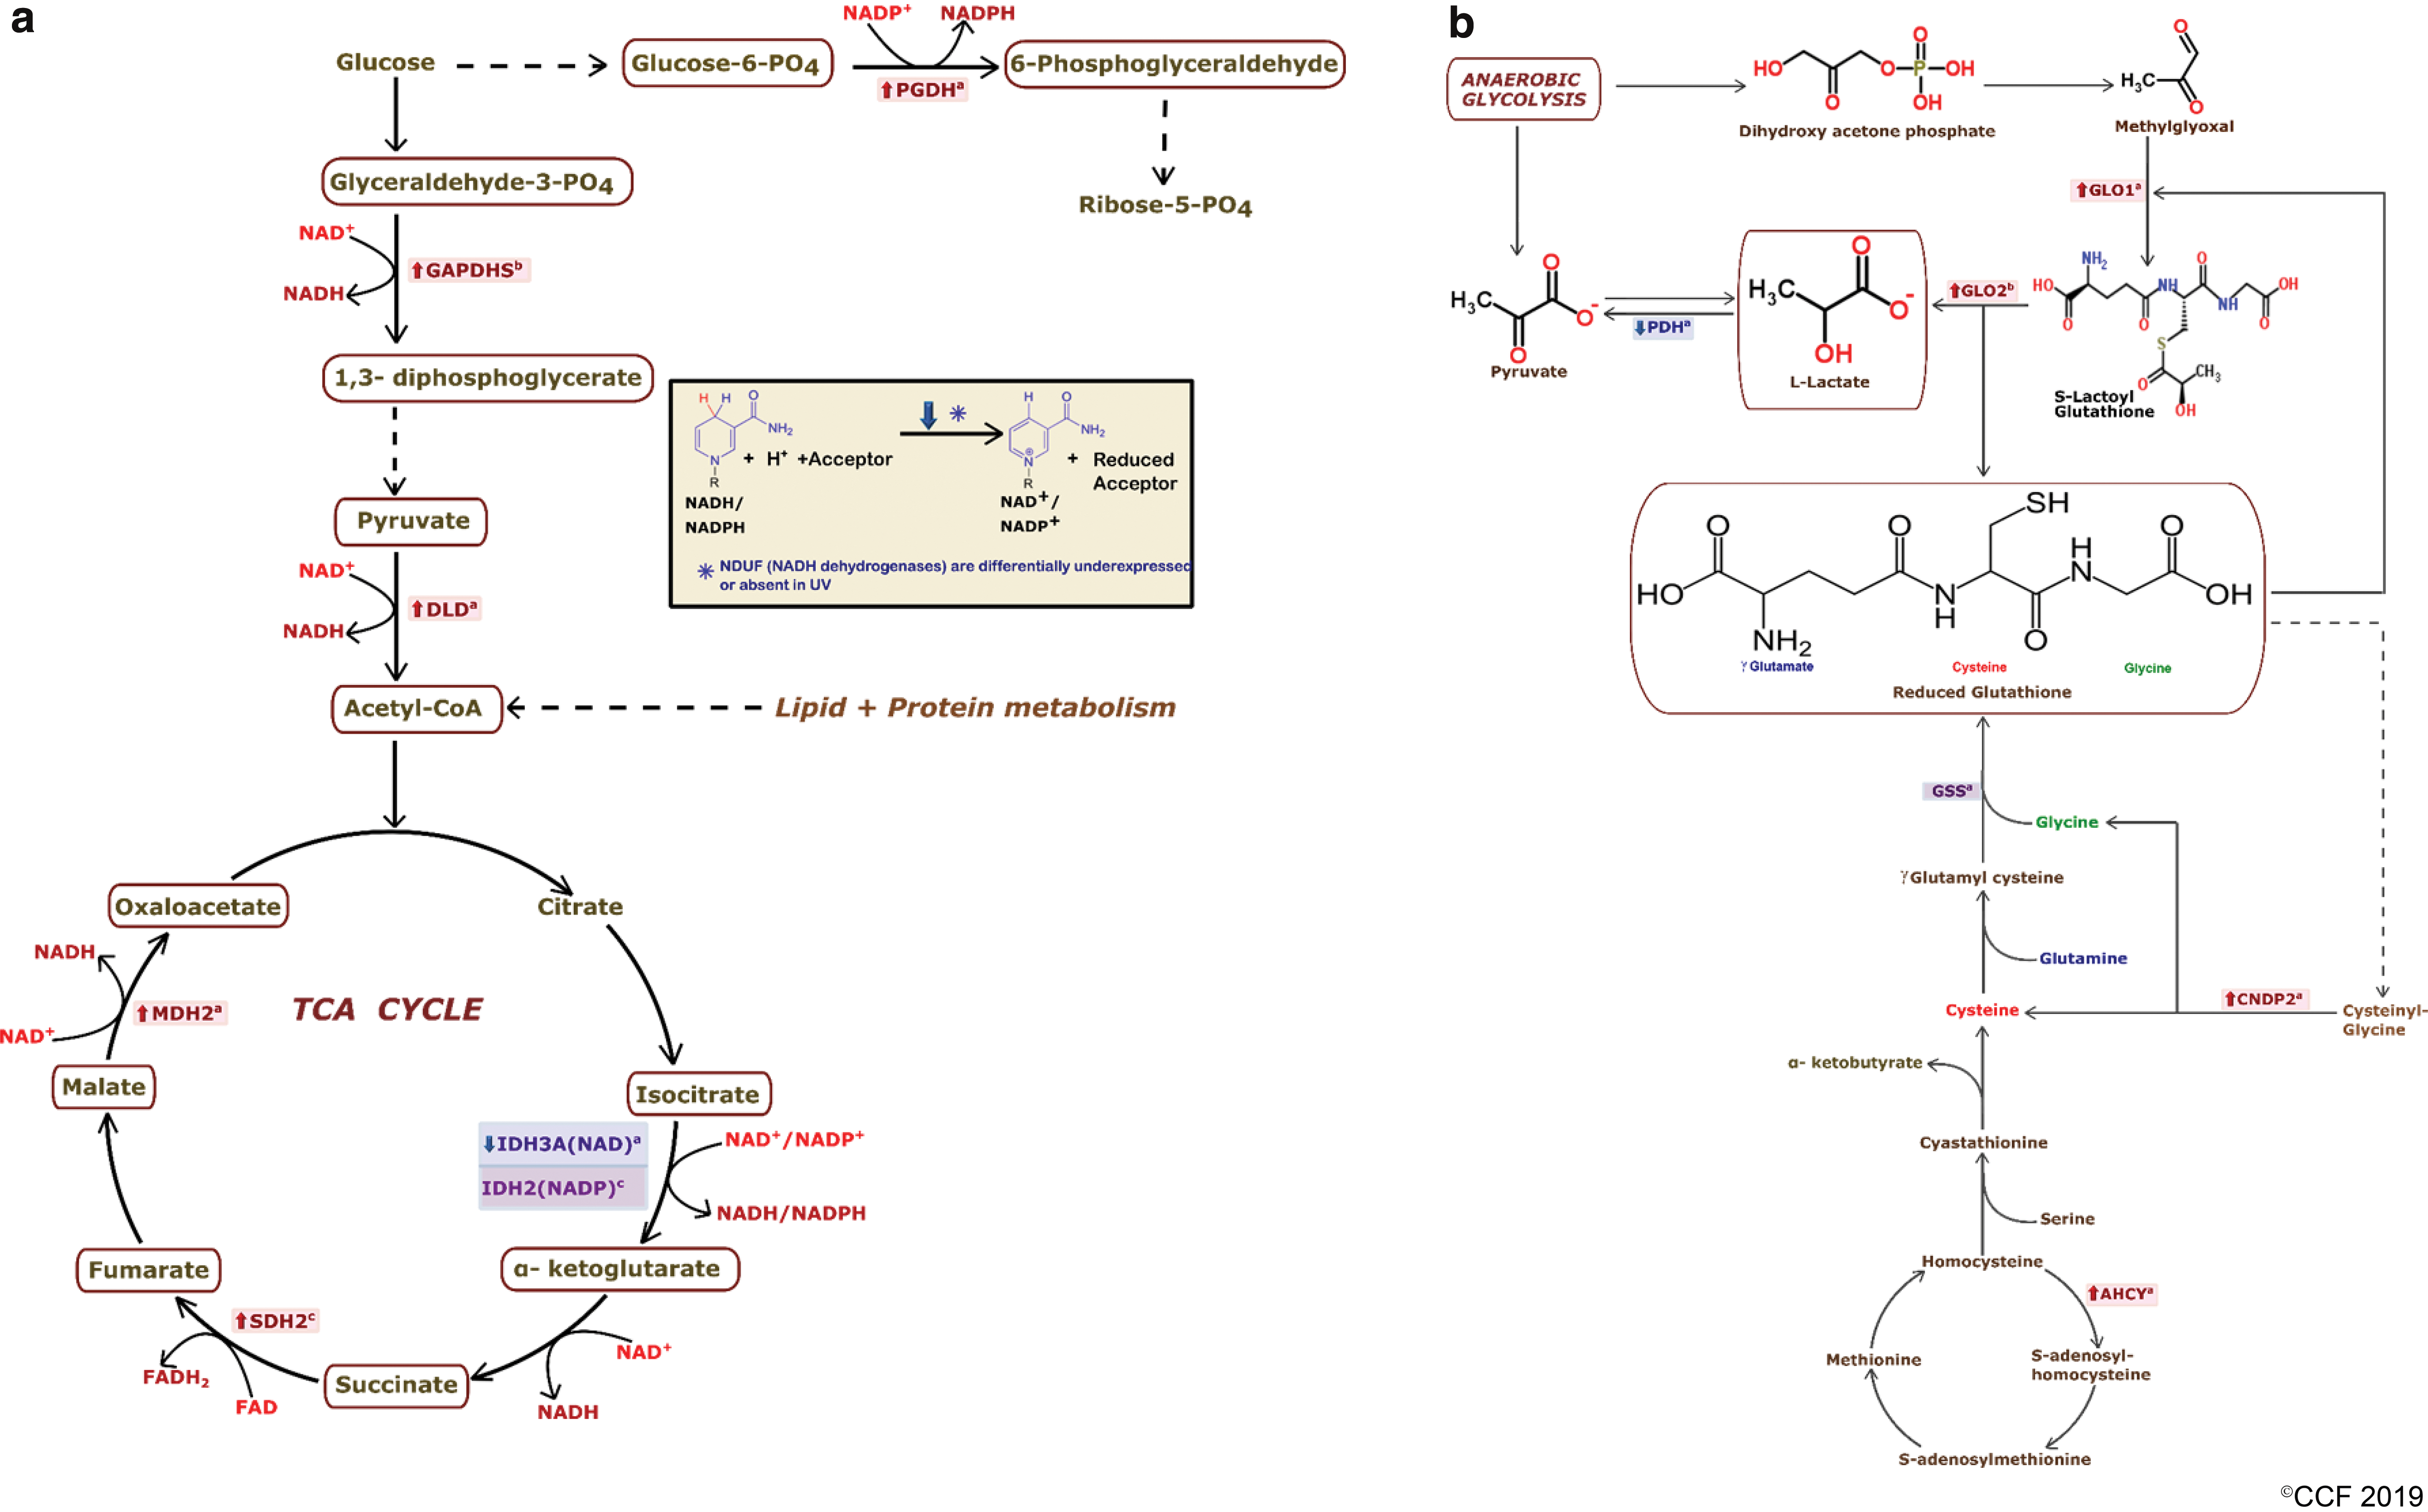
Nuclear factor erythroid 2-related factor 2 (NRF2) is a redox-sensitive transcription factor that is activated in response to hypoxia (67). The activated NRF2 then binds to the antioxidant responsive element and enhances the expression of several antioxidants (50). Unrestricted activation of NRF2 would lead to reductive stress, due to augmented production and accumulation of antioxidant enzymes and reducing equivalents (17, 54). The entire array of antioxidant defence work in cascade and such a scenario would eventually result in increased ROS generation (40). A disturbed feedback regulating the entire redox homeostasis was corroborated by high-level static ORP (sORP) in the semen of UV group in comparison with the FD group. Figure 7b schematically represents the de novo synthesis of GSH, which is increased in varicocele sperm due to the exclusive presence of GSH synthetase. Recycling of Cys-Gly of the γ-glutamyl cycle (36) and synthesis of cysteine by the trans-sulfuration pathway (45) are mediated by an upregulated level of cytosolic nonspecific dipeptidase isoform 2 (nSC ratio = 2.22) and adenosylhomocysteinase isoform 1 (nSC ratio = 5.10), respectively, in varicocele sperm. The higher levels of absolute GSH and a subsequent decrease in reduction potential in sperm of UV patients have further substantiated the above findings (Fig. 2).
The GSH (GSH/GPx) and thioredoxin/peroxiredoxin (TRDX-PRDX) are the primary regulatory antioxidant systems. However, when the supply of their natural electron acceptors such as GSSG or oxidized TRDX is limited, these antioxidant systems convert to oxidant generators. Under reductive stress, NADPH could be presumed to supply electrons to the FAD unit of glutathione reductase (GR) and thioredoxin reductase (TXNRD) subsequently to oxygen to produce O2 −• (Fig. 8a) (39). In UV group, we found high amounts of GR (nSC ratio = 5.77) and absence of glutathione peroxidase 1 (GPX1). It has been demonstrated that absence of GPX1 with high amounts of GSH would deteriorate the reductive stress condition (10). Likewise, NADPH-dependent augmented ROS generation may result from high amounts of TXNRD (nSc ratio = 2.98) as its preferred endogenous oxidized thioredoxin 1 (Trx) substrate is in limited supply in sperm from UV group (nSc ratio of TRDX = 0.60) (20). The thioredoxin domain-containing proteins, such as TXNDC2, TXNDC3, TXNDC12, and TXNDC17 required for proper disulfide bridge formation in the sperm tail proteins, are also found at undetectable levels in the UV sperm (46). Moreover, GSH could be postulated to increase mitochondrial membrane potential, thereby resulting in redox recycling of ubiquinone or reverse electron flow from succinate to NAD+ and thereby increasing mitochondrial ROS production (63). The most abundant redox couple in a cell is the GSSG/2GSH couple. The biological status of the cell is correlated with the half-cell reduction potential (E hc) of the GSSG/2GSH couple. In fact, the results of the present study showed a perturbed GSH to GSSG ratio and increased E hc. Glutathionylation of mitochondrial target(s) would also drive ETC toward superoxide (O2 −•) generation (75). As shown in Figure 8b, the generated O2 −• is rapidly converted to hydrogen peroxide (H2O2) with high levels of superoxide dismutase as detected in sperm from the UV group (nSc ratio = 2.48 of SOD1, 2.94 of SOD2) (75). In addition, protein folding enzymes such as protein disulfide-isomerase (PDI) were downregulated (nSC ratio = 0.56 of PDIA1, 0.24 of PDIA3, 0.01 of PDIA4, and 0.35 of PDIA6), while quiescin-sulfhydryl oxidase (QSOX1) was upregulated (nSc ratio = 12.73). With QSOX1 being the major enzyme for protein folding in sperm from the UV group, large amounts of H2O2 would be produced as a by-product (32). In such a scenario, overexpression of myeloperoxidase (nSC ratio = 8.20) in sperm from UV would catalyze the formation of hypochlorous acid from H2O2, which will subsequently yield many species of ROS as shown in Figure 8b (48).

Several studies have demonstrated lower sperm concentration, motility, sperm function, higher sperm DNA damage, as well as increased levels of ROS after scrotal hyperthermia in varicocele animal models (55, 56). Transient mild testicular hyperthermia instigates complex stress response, including activation of genes associated with OS and hypoxia (52). In fact, hyperthermia may contribute to cellular hypoxia-related OS injury and vice versa. Heat stress has been found to elevate hypoxia-induced free radical generation (29). The rise in testicular temperature is reported to aggravate oxidoreductive stress, especially in chronic hypoxia (57). Shiraishi et al. (64) demonstrated a strong correlation between testicular apoptosis and OS with increased scrotal temperature in testis with varicocele. In such a scenario, hypoxic tolerance is mediated by stimulation of HSR, as chaperone activity of HSP might help to combat hypoxia-induced OS (34, 35). However, lower expression of HSPs detected in our study would have undermined the multifaceted prosurvival effects of HSPs in varicocele sperm.
In silico analysis along with validation of annihilated expression of nodal proteins, dysfunctional OXPHOS pathway, and a more negative reduction potential with the disturbed balance in the pivotal redox couple (GSH/GSSG) in varicocele patients support our hypothesis (Fig. 9). A further detailed measurement of other redox couples, particularly NAD+/NADH and NADP+/NADPH, and expression profile of few more key proteins of the redox regulatory pathways in a larger cohort of patients will further strengthen our findings and help designing special treatment modalities for these patients.
Materials and Methods
Selection of patients
The study was carried out in 2015–2016, after obtaining approval from the Institutional Review Board of Cleveland Clinic, USA. Signed written consent was obtained from all subjects before enrollment. Thirty-three infertile patients diagnosed with UV and 10 fertile normozoospermic men without clinical varicocele (categorized as FD), all with an age limit of 20–40 years, were included in the study. All fertile subjects had no clinical history of varicocele and had fathered at least one healthy child naturally within the last 2 years. Infertile patients were diagnosed with clinical varicocele based on scrotal palpation in a temperature-controlled room (23.8°C) with adequate illumination, and the gradation of varicocele was done based on criteria by Dubin and Amelar (24). Both infertile men and control subjects with a sperm concentration <10 × 106/mL, leukocyte concentration ≥1 × 10⁶/mL, history of any systemic illnesses and chronic fever before enrollment, and female factor infertility were excluded.
Sample collection and processing
Semen samples were collected by masturbation after 2–3 days of ejaculatory abstinence. Following complete liquefaction for 15–30 min at 37°C, routine semen analysis was performed according to the WHO guidelines (71) as depicted earlier (4). Sperm concentration and motility were determined by manual semen analysis using a MicroCell counting chamber (Vitrolife, San Diego, CA). Percent viability was determined by eosin/nigrosin staining. Sperm morphology was assessed by staining semen smears with a Diff-Quik kit (Baxter Healthcare Corporation, Inc., McGaw Park, IL). Sperm morphology was evaluated according to Kruger's strict criteria as described in the WHO, 2010 guidelines (71). Semen samples having a round cell concentration >1 × 10⁶/mL were tested for leukocytospermia, by the peroxidase or the Endtz test.
Measurement of ORP in semen
ORP is the measurement of oxidative or reductive stress (redox balance) in semen. The ORP was measured in the semen using the MiOXSYS™ System (Aytu Bioscience, Englewood, CO), as described earlier (3, 6, 8). Normalized ORP was expressed as mV/million sperm/mL. Using the MiOXSYS System, a 30 μL sample was loaded and the test starts when the sample fills the reference electrode. The electrochemical circuit is completed and sORP is displayed on the MiOXSYS Analyzer display screen. ORP provides a snapshot of current redox balance. A higher sORP reading is indicative of OS. Normalized ORP is expressed as mV/million sperm/mL.
Measurement of ROS in sperm
ROS was measured by chemiluminescence assay using luminol (5-amino-2, 3-dihydro-1, 4-phthalazinedione) as the probe (2, 61). Luminol is an extremely sensitive dye that detects both extracellular and intracellular ROS at neutral pH. Luminol generates light signal after combining with oxidative end-products, which is measured with a luminometer.
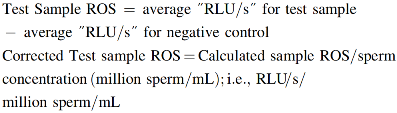
For measuring ROS, a working solution of luminol (Sigma-Aldrich, United Kingdom) (5 mM) was prepared from a stock solution (100m) of luminol in dimethyl sulfoxide. For positive control, 50 μL of 30% H2O2 was used. The assay mixture consisted of only phosphate-buffered saline (PBS) (400 μL) for the blank; PBS (400 μL) +5 mM luminol (10 μL) for the negative controls; PBS (395 μL) +30% H2O2 (5 μL) + of 5 mM luminol (10 μL) for the positive controls; and sperm suspension (400 μL) +5 mM luminol (10 μL) for test sample. All samples were vortexed gently immediately, and levels of ROS were assessed by measuring the luminol-dependant chemiluminescence with the Berthold luminometer (Model: AutoLumat plus LB 953, Oakridge, TN). ROS of the test sample were calculated by subtracting the negative control average from their average. The sample ROS are then corrected by dividing them with “sperm concentration/mL.” Results were expressed as relative light units, RLU/s/million sperm/mL.
Assessment of reductive stress and calculation of redox potential
Total GSH equivalents (GSH + GSSG) were measured spectrophotometrically by GR recycling assay at the expense of oxidation of NADPH using 5-5′-dithiobis 2-nitrobenzoic acid (DTNB; Ellman's reagent); and GSSG was measured under similar conditions after masking GSH with 2-vinylpyridine as described elsewhere (18). For measuring the total GSH equivalents (GSH + GSSG), GR was added to the assay for reduction of GSSG to GSH at the expense of oxidation of NADPH. The reduction potential (Ehc) of GSH/GSSG couple was calculated using the Nernst equation.
Postseparation from seminal plasma, spermatozoa were washed twice with chilled PBS, and then sonicated in 6 repeated cycles of 10 s sonic pulses at high intensity with 1-min intervals between pulses on ice. Then, the sperm lysates were centrifuged at 10,000 g for 15 min at 4°C. The proteins in the supernatant were estimated by bicinchoninic acid assay (Pierce BCA Protein assay kit; Thermo Fisher Scientific) as per the manufacturer's protocol. Then, they were precipitated with ice-cold 5% trichloroacetic acid containing 0.01 N HCl, and cleared by centrifugation. The deproteinized supernatants were used for the assay. In brief, the assay mixture (final volume 200 μL) contained 3 mM NADPH in 125 mM phosphate buffer containing 6.3 mM EDTA (pH 7.5), DTNB (0.6 mM), and sperm lysate (30–40 μg protein). The reaction was started with the addition of 2 μL GR (∼1 U; Sigma-Aldrich, St. Louis, MO). Subsequently, the yellow chromatophore (2-nitro-5-thiobenzoate: TNB2–) formed by the interaction of contributing SH groups from GSH and GSSG (after conversion by GR) with DTNB was monitored at 405 nm in an ELx800 Absorbance Microplate Reader (BioTek Instruments, Inc., Winooski, VT) at 1-min intervals for 6 min. All the determinations were normalized to protein content. The absolute GSH amount was quantified from difference between the total GSH equivalent and the obtained GSSG value. Reductive stress index was calculated as ratio between GSH and GSSG. The glutathione redox potential was calculated by Nernst equation for half-reaction: E hc = −240–61.5/2 ln{[GSH]2/GSSG} mV; where −240 mV is the standard redox potential (Eo) of GSH at pH 0, −61.5/2 denotes RT/zF, that is, R = gas constant (8.314 J/K/mol), T = absolute temperature of 37°C or 310 K, F = Faraday constant (9.64853 × 10⁴ C/mol); z = number of electrons exchanged in the chemical reaction GSSG +2e− + 2H 2GSH.
Identification of differentially expressed sperm proteins
The DEPs reported in our earlier publication (7) were selected for secondary in silico analysis based on the following criteria: (1) those related to redox homeostasis, and/or (2) those responsive to stress (OS/heat stress/hypoxic stress). DEPs were identified by the spectral count (SC) method, considering their normalized spectral abundance factor (NSAF). NSAF of a particular protein “j” with total “n” no. of proteins was calculated from the following formula: [(NSAF) j = (SC/protein length)j/∑ n (SC protein length)]. The average value of NSAF for each identified protein taking into account all the replicates of sample is used for further quantitative analysis. This approach takes into account the sample-to-sample variation that is obtained when performing replicate analyses of a sample. The abundance of the proteins was classified as high (H), medium (M), low (L), or very low (VL) based on their average SC among the three replicate runs. Different constraints for significance tests (p value) and/or fold change cutoffs (or NSAF ratio) were applied for these four abundance categories for selection of DEPs, as explained in the aforementioned published study (7).
Categorization and selection of DEPs were performed using the GO analysis platform, which comprised publicly available bioinformatic annotation tools and databases such as GO Term Finder (16), GO Term Mapper, UniProt (73), and Software for Researching Annotations of Proteins [STRAP] V_1.5.0.0 (13). Quantitative patterns across the selected DEPs and samples were organized in a matrix format using the heatmap (37). To visualize hierarchical clustering, a heatmap was constructed in R.3.4.4 package using the ComplexHeatmap library. Hierarchical clustering was performed taking the Euclidean distance correlation matrix for complete linkage to design the heatmap dendrogram.
Bioinformatic analysis
GO enrichment analysis was conducted using the ClueGO plugin V_2.5.2 (75) using Cytoscape software V_3.6.1. A two-sided hypergeometric test was performed using this platform for the enrichment of GO terms, followed by the Bonferroni p-value correction method for multiple testing. Functionally grouped networks with GO terms as nodes were linked based on their kappa score level (≥0.3). Enriched GO terms were classified according to their enrichment score, for “biological processes,” “cellular component,” and “molecular function” using functional annotations. The gene ontological relationship was retrieved from EBI-UNIPROT_GOA (September 4, 2018).
Key biological pathways affected by selected DEPs were queried using both open source tools such as ClueGO plugin V_2.5.2 (14) in Cytoscape software V_3.6.1, and commercial pathway packages such as IPA as provided by Ingenuity Systems, V_ 47547484, release date: February 8, 2019; and MetaCore™ Pathway Maps and Disease Marker Sets (as provided by GeneGo, Inc., V_19.1, release date: May 2019). IPA-Tox was used to determine the top toxicity functions in combination with toxicity lists and link experimental data to clinical pathology endpoints. The known and predicted protein interactions of DEPs were explored from STRING database using STRING web tool V_10.5.
Western blot validation
Expression of the OXPHOS mitochondrial complexes and HSPs was verified in sperm samples of seven fertile men, and five infertile UV patients using Western blotting (WB). Washed spermatozoa were lysed in RIPA lysis buffer (Sigma-Aldrich, St. Louis, MO) containing proteinase inhibitor cocktail (Roche, Indianapolis, IN). The supernatants were collected and treated with the required volume of Laemmli sample application buffer (BioRad, CA) containing 1% β-mercaptoethanol. The mixture (∼20–30 μg of protein) was boiled for 5 min; 15 μL of each sample was applied to each well of a 4%–15% Mini-PROTEAN TGX Precast gel (Biorad, CA) and electrophoresed for 2 h at 90 V along with a set of molecular weight markers (Sigma Chemical Co., St. Louis, MO). The resolved protein bands were transferred onto polyvinylidene difluoride (PVDF) membranes at 20 V for 30 min using a transfer buffer of 25 mmol/LTris base, 192 mmol/L glycine, and 20% methanol. The blots were blocked for 2 h at room temperature with SuperBlock blocking buffer (Thermo Scientific, Rockford, IL). The blocking buffer was decanted and blots were incubated overnight at 4°C, with a primary antibody diluted at 1:1000 concentration in 3% bovine serum albumin (BSA) in tris-buffered saline with Triton X (TBST). The respective primary antibodies used were total OXPHOS Human WB Antibody Cocktail (mouse IgG; ab110411; Abcam), anti-HSP90B1 (rabbit IgG; AB3468; Millipore), and anti-HSPA2 (rabbit IgG;ab154374; Abcam). Blots were then washed using TBST and incubated with horseradish peroxidase-conjugated respective IgG (anti-mouse IgG; ab6728; Abcam; anti-rabbit IgG; ab97051; Abcam) in 1:10,000 dilution for 1 h at room temperature following washes in TBST. Antibody/protein complexes were visualized using an enhanced chemiluminescence kit-Pierce™ ECL Western Blotting Substrate (Thermo Scientific, Rockford, IL) using ChemiDoc™ MP Imaging System (BioRad, Hercules, CA). Post-Western blot detection, the PVDF membranes were stripped. After washing with TBST, the membranes were treated with colloidal gold total protein stain (#170-6527; BioRad, CA ) and imaged. The developed blots were subjected to densitometric analysis using Image Lab™ software (BioRad) according to standard methods normalizing with total protein stained with colloidal gold. In addition to individual (n = 4) WB analyses, pooled specimens (n = 3) from both UV and FD group were run against each other to maintain biological variability. Normalization of sample pooling was performed by both sperm number (each sample contributed with an equal number of spermatozoa) and protein content.
ICC validation of HSPs
Semen was collected from seven fertile men, and five infertile UV patients for validation. For ICC analysis of the two selected HSPs, spermatozoa were isolated from seminal plasma postliquefaction by centrifugation and fixed with paraformaldehyde (PFA) (final concentration 2%). After fixing the cells with PFA, the cells were permeabilized with 0.1% Triton X-100 in PBS (5 min). Subsequently, the cells were blocked with 5% BSA for 2 h. The blocking buffer was removed, and cells were incubated overnight at 4°C, with the rabbit primary antibody specifically recognizing HSPA2 (ab154374; Abcam) and HSP90β (AB3468; Millipore). Both the antibodies were used at a dilution of 1:100 in 1% BSA in PBST buffer (PBS supplemented with 0.1% Tween-20). After extensive washings, detection was carried out using appropriate AlexaFluor-488-labeled anti-rabbit (ab150077; Abcam) at 1:1000 dilutions. Cells were counterstained with Hoechst (bisbenzimide; H 33258; Sigma ). All images were taken on a confocal laser-scanning microscope (Leica Microsystems) with a 63 × -objective and analyzed with the Leica Application Suite X image examiner software. After background correction, the intensity of single sperm cells (acquired at zoom4) was quantified using Fiji software (free software developed by NIH). Fluorescence intensity measurements were performed in three hundred spermatozoa per group.
Statistical analysis
The Shapiro–Wilk test was used to assess data normality, and Levene's test for homogeneity of variance. Data are represented as median (25th, 75th percentile) and compared between infertile UV men and FD control men by the nonparametric Mann–Whitney test for semen analysis and ICC results. A two-tailed Student's t-test was used to compare intensity readings of WB and biochemical data on GSH/GSSG redox couple. All analyses were done using IBM-SPSS software V_21 and p-value <0.05 was considered significant. A PCA of quantified NSAF of selected DEPs was performed as an indicator of the variance in the data set using Origin software V_2017. A biplot demonstrating the two first principal components (PC1 and PC2) was constructed to represent the variance of proteomic profiling between the three FD and three UV samples. Schematic representations and graphical abstracts were drawn with Inkscape V_0.92.2.
Footnotes
Author Disclosure Statement
No competing financial interests exist.
Funding Information
This research was supported by Cleveland Clinic and Higher Education Department, Government of Odisha, India, under OHEPEE (Grant no 26913/HE-PTC-WB-02-17). The sponsors played no role in the study design, data collection and analysis, data interpretation, writing of the report, or decision to submit the report for publication.
Supplementary Material
Supplementary Table S1
Supplementary Table S2
Supplementary Table S3
Supplementary Figure S1
Abbreviations Used
References
Supplementary Material
Please find the following supplemental material available below.
For Open Access articles published under a Creative Commons License, all supplemental material carries the same license as the article it is associated with.
For non-Open Access articles published, all supplemental material carries a non-exclusive license, and permission requests for re-use of supplemental material or any part of supplemental material shall be sent directly to the copyright owner as specified in the copyright notice associated with the article.