
Abstract
Aims:
Nitrobindins (Nbs) are evolutionary conserved all-β-barrel heme-proteins displaying a highly solvent-exposed heme-Fe(III) atom. The physiological role(s) of Nbs is almost unknown. Here, the structural and functional properties of ferric Mycobacterium tuberculosis Nb (Mt-Nb(III)) and ferric Homo sapiens Nb (Hs-Nb(III)) have been investigated and compared with those of ferric Arabidopsis thaliana Nb (At-Nb(III), Rhodnius prolixus nitrophorins (Rp-NP(III)s), and mammalian myoglobins.
Results:
Data here reported demonstrate that Mt-Nb(III), At-Nb(III), and Hs-Nb(III) share with Rp-NP(III)s the capability to bind selectively nitric oxide, but display a very low reactivity, if any, toward histamine. Data obtained overexpressing Hs-Nb in human embryonic kidney 293 cells indicate that Hs-Nb localizes mainly in the cytoplasm and partially in the nucleus, thanks to a nuclear localization sequence encompassing residues Glu124-Leu154. Human Hs-Nb corresponds to the C-terminal domain of the human nuclear protein THAP4 suggesting that Nb may act as a sensor possibly modulating the THAP4 transcriptional activity residing in the N-terminal region. Finally, we provide strong evidence that both Mt-Nb(III) and Hs-Nb(III) are able to scavenge peroxynitrite and to protect free
Innovation:
Data here reported suggest an evolutionarily conserved function of Nbs related to their role as nitric oxide sensors and components of antioxidant systems.
Conclusion:
Human THAP4 may act as a sensing protein that couples the heme-based Nb(III) reactivity with gene transcription. Mt-Nb(III) seems to be part of the pool of proteins required to scavenge reactive nitrogen and oxygen species produced by the host during the immunity response.
Introduction
Globins are globular heme-proteins that have evolved across all domains of life to sense, bind, store, and transport gases. Typically, globins (e.g., hemoglobin [Hb] and myoglobin [Mb]) are composed of eight α-helical segments that are shaped around heme with a 3/3-fold, in which the A, B, and E α-helices face the heme on one side and the F, G, and H α-helices on the other side (9, 20, 51, 63). A smaller group of all-α-helical globins display a 2/2-fold, in which two antiparallel pairs of helices (i.e., B/E and G/H) enclose the heme (52, 53). In globins, the heme-Fe atom is protected from the oxidation thanks to the hydrophobic pocket in which the prosthethic group is deeply buried (9, 52).
Nitrophorins (NPs) and nitrobindins (Nbs) are the only all-β-barrel heme-proteins displaying a highly solvent-exposed heme-Fe atom that is stable in the ferric form (5, 6, 26, 70). In both NPs and Nbs, the penta-coordinated heme-Fe atom is anchored to the protein by the proximal His residue (18, 19, 25, 26). The 8-stranded β-barrel NPs have been described only in the hematophagous bug Rhodnius prolixus (Rp), playing a pivotal role in the insect feeding. NPs store nitric oxide (NO) in the salivary glands. When the insect feeds on his victim, the saliva is pumped into the victim tissues and NO is released, with the consequent vasodilation. Then Rhodnius prolixus NPs (Rp-NPs) bind host histamine, thus reducing inflammation and itch (3, 25, 41, 47, 58).
Innovation
Nitrobindins (Nbs) form a new class of heme-binding proteins that were uncovered in the genome of several species but whose function is still unknown. Here, the structural and functional properties of Mycobacterium tuberculosis and Homo sapiens Nbs have been investigated by an integrated approach. The stable ferric form of Nbs and their ability to scavenge peroxynitrite suggest that these proteins play a role in nitric oxide sensing and in the detoxification of reactive nitrogen and oxygen species (RNS and ROS, respectively). Moreover, present results suggest a possible role of human THAP4 as a sensing protein that couples the heme-based Nb reactivity with gene transcription. Besides, the ability of mycobacteria to survive in the host implies the presence of effective detoxification systems (14, 67) and supports the notion that ferric Mycobacterium tuberculosis Nb (Mt-Nb(III)) could be part of the pool of proteins required to scavenge RNS and ROS produced by the host during the immunity response. Therefore, Mt-Nb(III) may become a novel therapeutic target for the treatment of M. tuberculosis infections as reported for mycobacterial truncated hemoglobins (11).
The physiological role(s) of the evolutionary conserved 10-stranded β-barrel Nbs is still unknown. The only function hypothesized for Arabidopsis thaliana Nb (At-Nb) is the transport and release of NO at the infection site after wounding and pathogenic infections; in turn, the delivered NO may reduce O2 to superoxide radicals with the generation of reactive oxygen species (ROS) that increase pathogen burden (19, 28, 72). Differently from monomeric NPs (5, 6, 36, 41, 43, 45, 59, 62, 70, 71), ferric Mycobacterium tuberculosis Nb (Mt-Nb) (PDB ID: 2FR2), and At-Nb (PDB code: 3EMM) (19), ferric Homo sapiens Nb (Hs-Nb) is the C-terminal domain of the single-chain nuclear protein THAP4 (567 amino acids long). The C-terminal Nb domain could act as a NO sensor modulating THAP4 transcriptional function residing at its N-terminal modified zinc finger domain. However, the role of THAP4 and specifically of the Nb domain is still unknown (18).
With the aim of seeking the Nbs physiological role, the structural and functional properties of ferric Mt-Nb (Mt-Nb(III)) and of the isolated C-terminal domain of human THAP4 (hereafter Hs-Nb(III)) have been investigated and analyzed in parallel with those of At-Nb(III), Rp-NP(III)s, and the prototypical all-α-helical Equus caballus and Physeter catodon myoglobin (Ec-Mb(III) and Pc-Mb(III), respectively). Results obtained contributed toward shedding light on the protective role of Nbs toward the detrimental effects of reactive nitrogen and oxygen species (RNS and ROS, respectively).
Results
Mt-Nb(III) displays the typical Nb fold
Mt-Nb(III)-H2O (present study), Mt-Nb(III)-cyanide (present study), At-Nb(III)-H2O (19), and Hs-Nb(III) (18) display the typical Nb fold consisting of a 10-stranded antiparallel β-barrel hosting the heme group (Fig. 1). Circular dichroism (CD) spectra of Mt-Nb(III) and Hs-Nb(III) (Supplementary Fig. S1) confirm the prevalence of β-sheet in the structural arrangement of these Nbs. According to literature (69), the different CD spectra of Mt-Nb(III) and Hs-Nb(III) may be associated with a diverse contribution of the aromatic residues of the two Nbs to the near- and far-UV CD spectra.
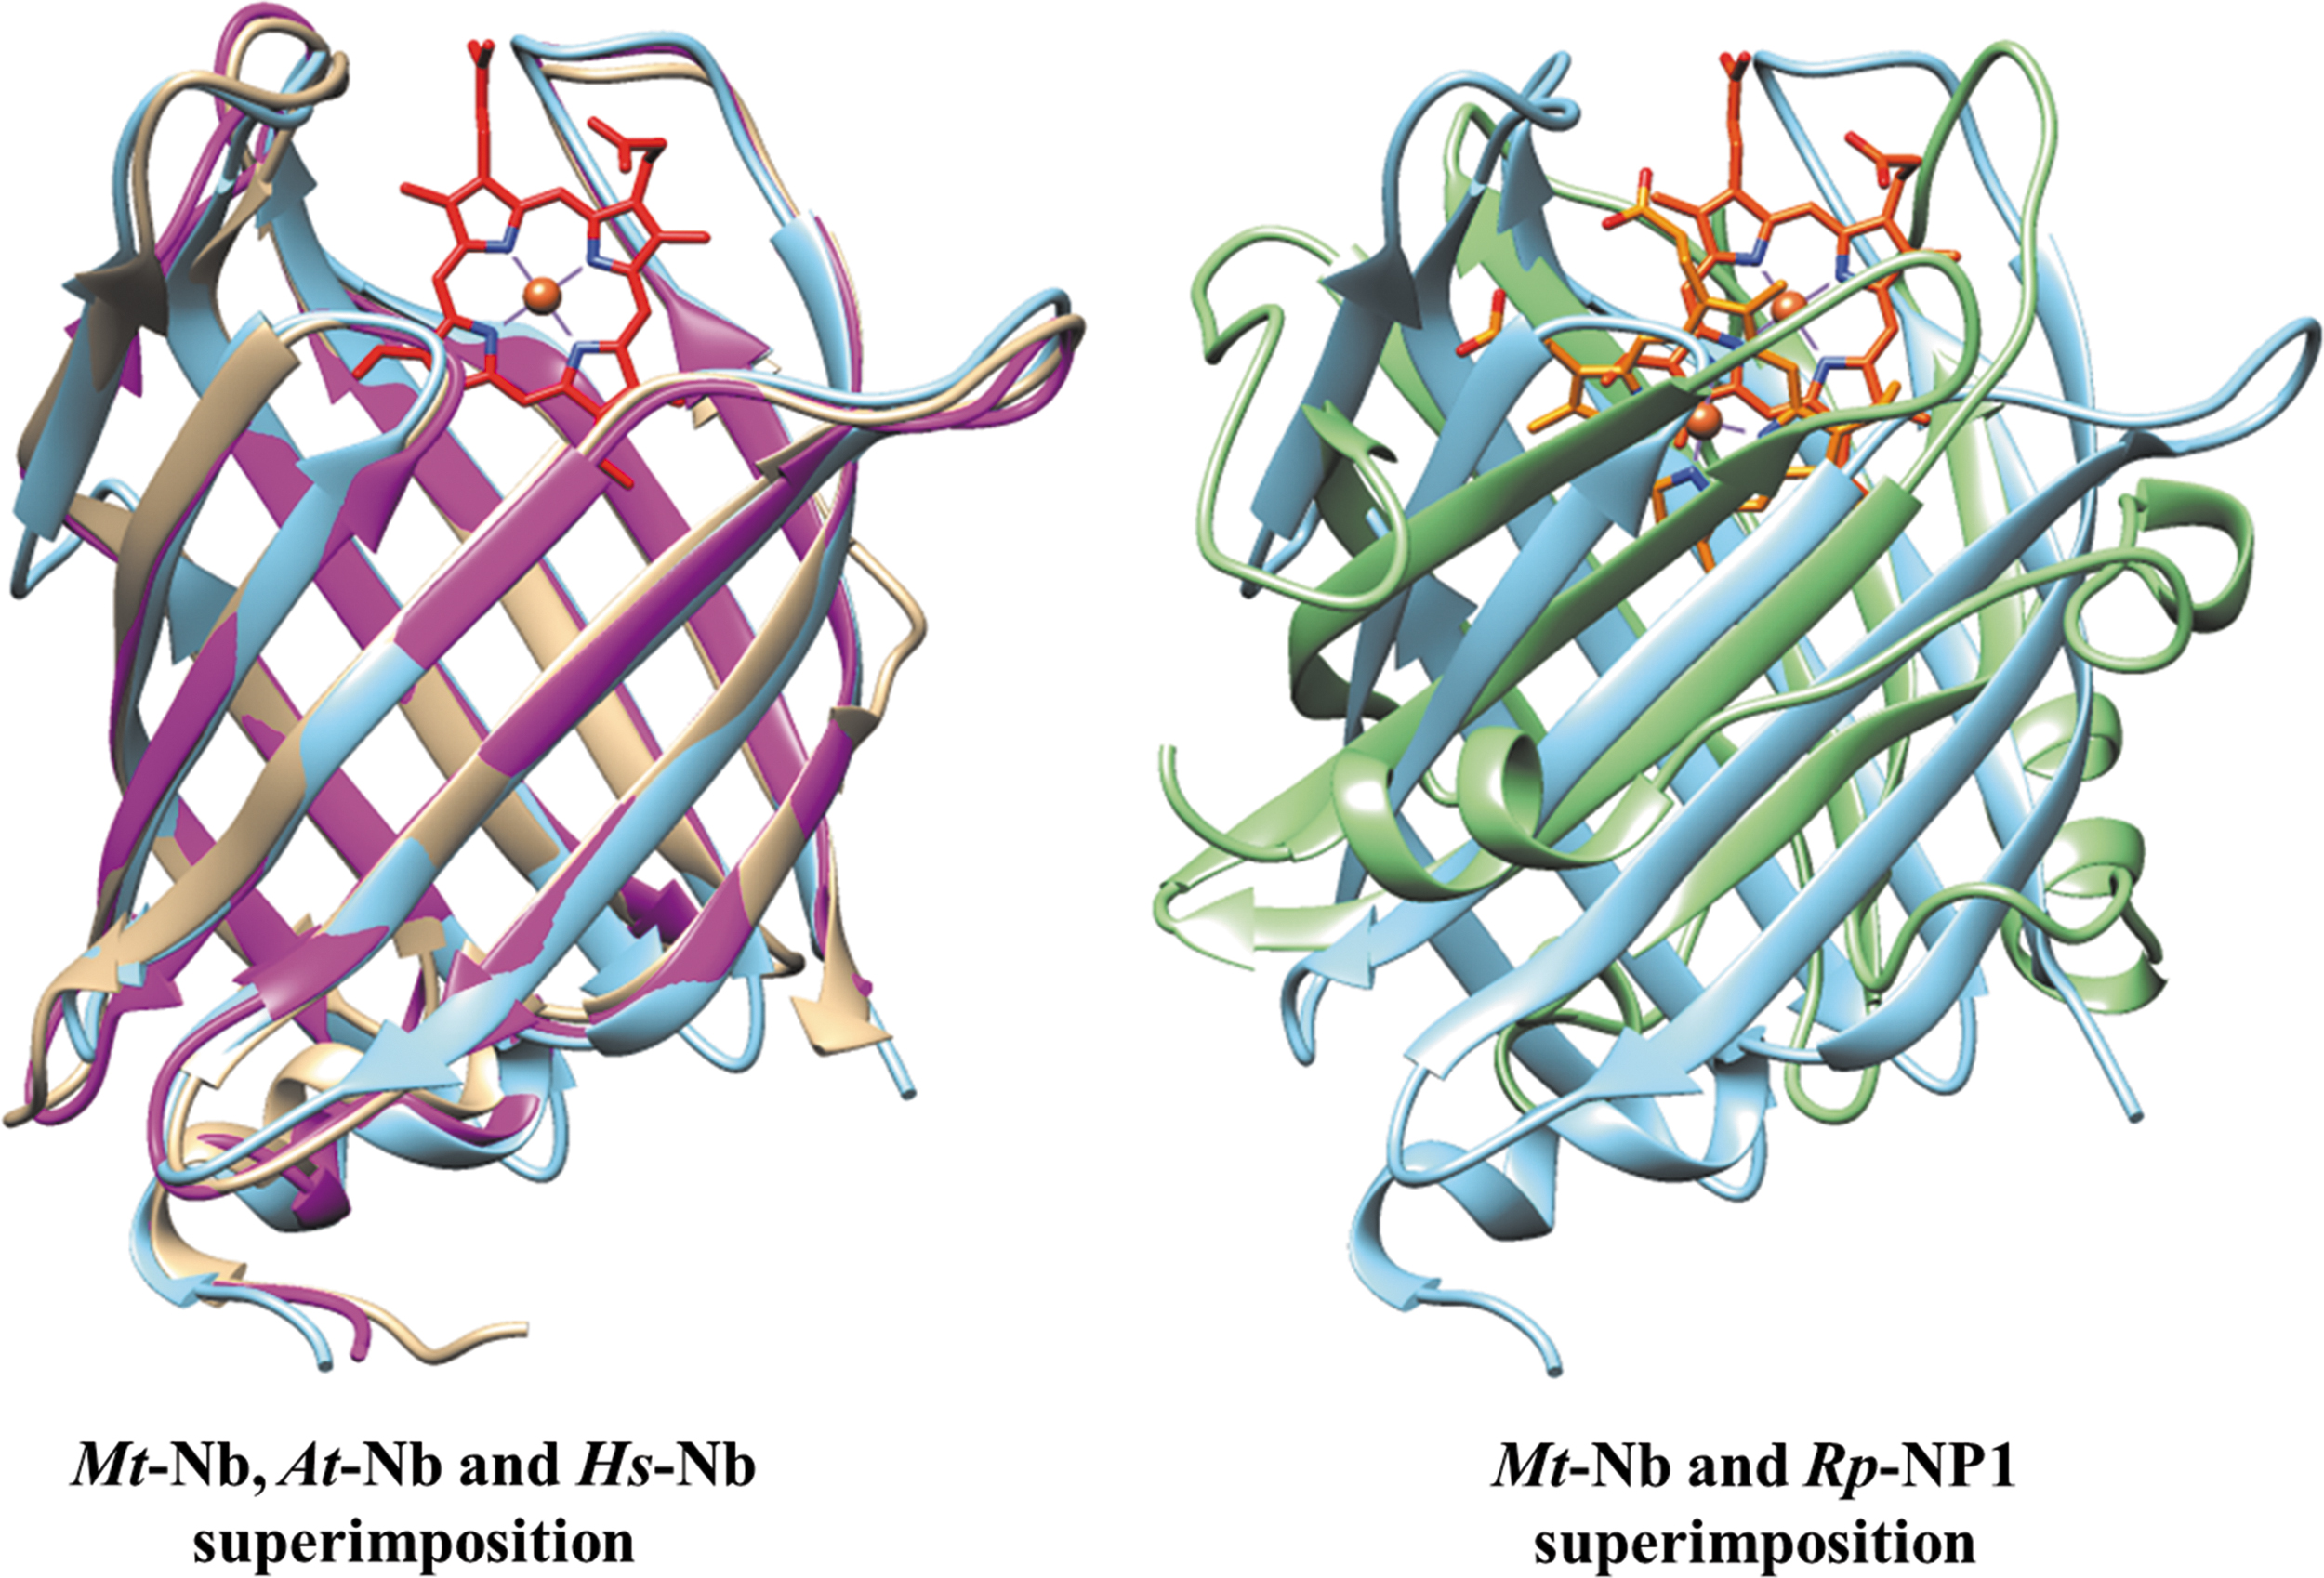
At the light of the strong fold conservation, Mt-Nb(III)-H2O matches closely the tertiary structures of: (i) Hs-Nb(III) subunit A (PDB code: 3IA8) (18) with a rmsd of 0.95 Å (for 143 Cα pairs), (ii) At-Nb(III) (PDB code: 3EMM) (19) with a rmsd of 0.81 Å (for 145 Cα pairs), and (iii) apo-Mt-Nb (PDB code: 2FR2) with a rmsd of 0.25 Å (for 161 Cα pairs) (Fig. 1). The largest structural deviation of Mt-Nb(III)-H2O with respect to At-Nb(III) (19) is located at the exposed residues of the β7-β8 inter-strand loop (largest deviation of 7.4 Å at Pro120) due to the deletion of six residues in At-Nb(III). Such a deviation may also be linked to marked bulging of the β7 strand in Mt-Nb(III)-H2O at residues Arg111-Asp113. Similarly, loop deviations are observed also in the structural overlay with Hs-Nb(III) (18), where the largest structural deviation relative to Mt-Nb(III)-H2O is observed at the β6-β7 inter-strand loop (residues Gly101-Asp102, 6.7 Å), at the opposite tip of the barrel. Locations of the heme-Fe atom in the three protein structures match within 0.85 Å (Fig. 1).
As reported for NP(III)s, consisting of an 8-stranded antiparallel β-barrel (5, 6, 36, 41, 43, 45, 59, 62, 70, 71), in Mt-Nb(III)-H2O (present study), Mt-Nb(III)-cyanide (present study), At-Nb(III) (19), and Hs-Nb(III) (18), the heme is hosted in a wide surface cleft. In Mt-Nb(III), the distal porphyrin face is largely accessible to the solvent, facilitating ligand binding (Figs. 1 and 2) and auto-oxidation of the metal center. Despite the contained structural differences among the three Nbs considered, the matching location, and the solvent exposure of their heme groups, in Mt-Nb(III)-H2O and Mt-Nb(III)-cyanide the heme groups are rotated by 180° around the methinic CHA-CHC atoms direction with respect to both Hs-Nb and At-Nb (18, 19) (Fig. 2 and Supplementary Fig. S2).
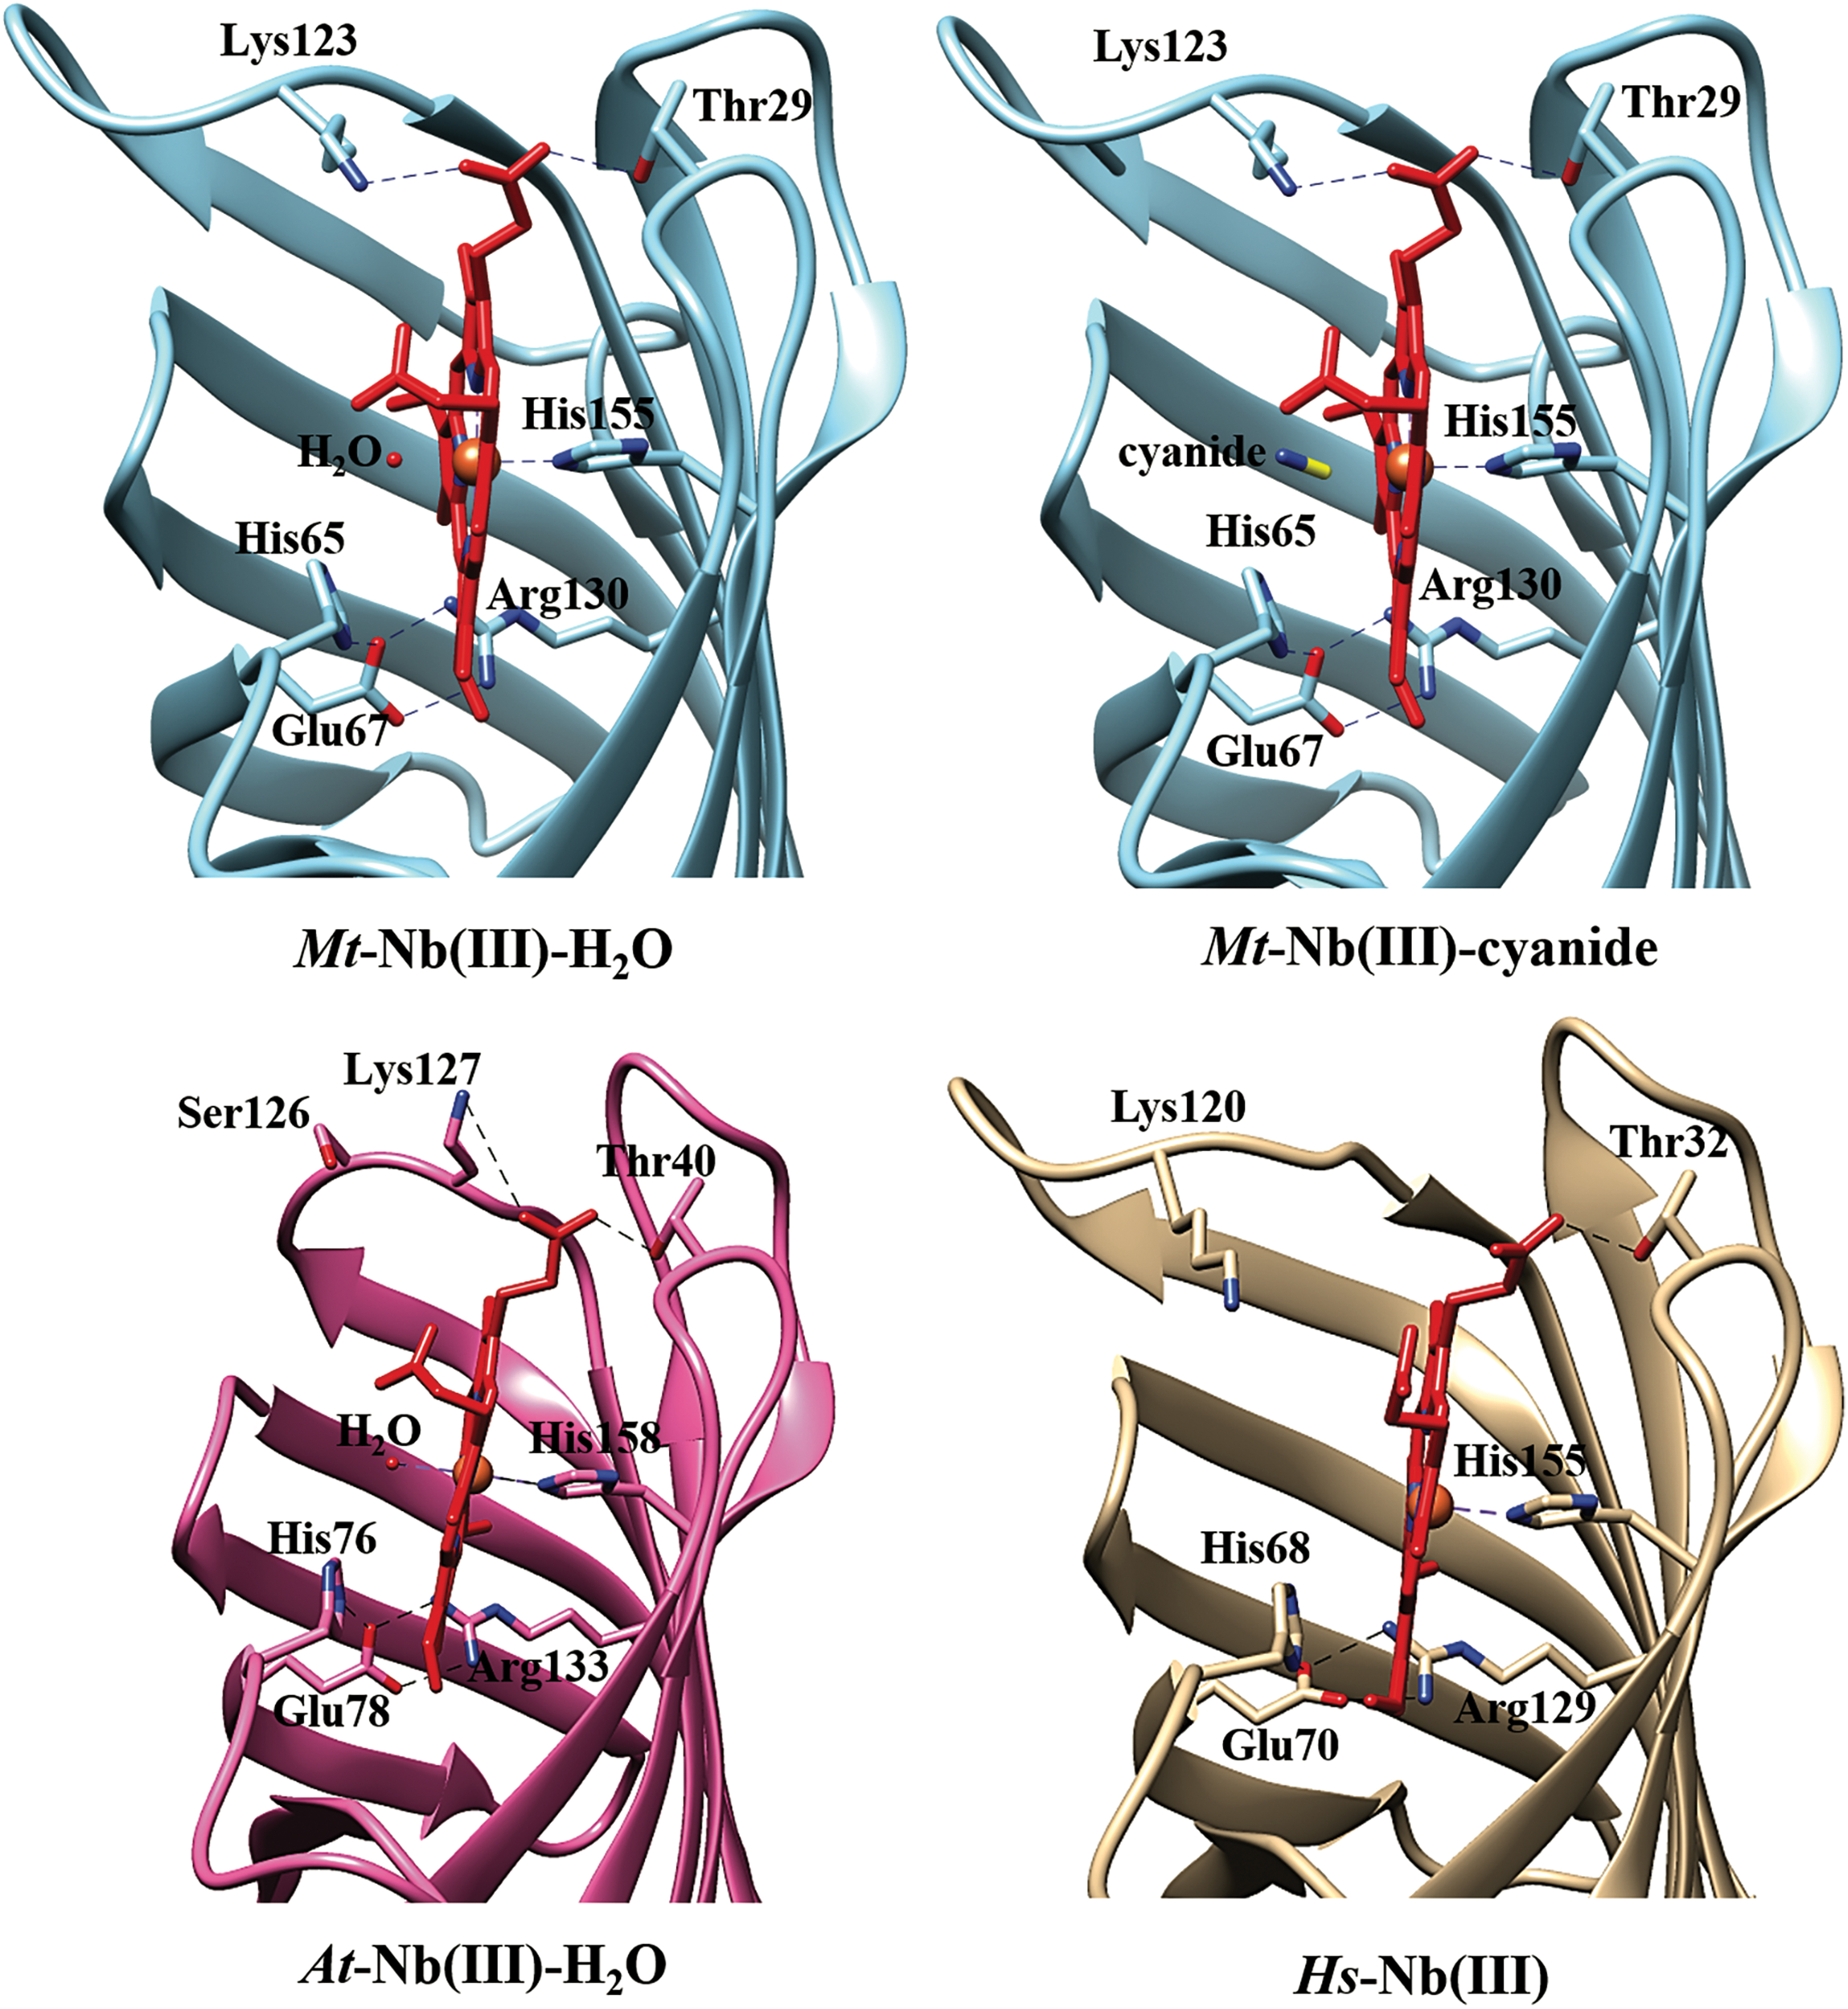
In both Mt-Nb(III)-H2O and Mt-Nb(III)-cyanide structures the proximal His155 side chain is stabilized by a hydrogen bond to the backbone O atom of Lys26, the D propionate is hydrogen-bonded to Thr29 and Lys123, and the A propionate is fully solvent exposed. Moreover, residues surrounding the heme pocket on the distal side (i.e., His65, His85, Glu91, and Glu93) build a hydrogen-bonded network that connects three β-strands possibly contributing to the stabilization of the distal site structure. A comparable network is present also in At-Nb and Hs-Nb (18, 19), where residue 85 is Gln (Fig. 2 and Supplementary Fig. S2). In At-Nb, the heme Fe-atom is coordinated to His158 (NE2-Fe distance 2.22 Å) and to a water molecule (Fe-O distance 2.51 Å), which is further stabilized by hydrogen bonds with two other water molecules. The A propionate is hydrogen-bonded to Thr40, and the D propionate is fully solvent exposed. The His158 residue is stabilized by a hydrogen bond with backbone O atom of Glu37, corresponding to Lys26 in Mt-Nb (19) (Fig. 2). In Hs-Nb, no exogenous ligand is observed, and the heme Fe-atom is only coordinated to His155 (NE2-Fe distance 2.27 Å), possibly reflecting the photoreduction of the heme-Fe(III) atom during X-ray irradiation. Moreover, the Fe atom is out of the heme plane by ∼0.25 Å toward the proximal His155 residue. The A propionate is hydrogen-bonded to Thr32, and the D propionate is fully solvent exposed. The His155 residue is stabilized by a hydrogen bond with backbone O atom of Thr29, corresponding to Lys26 in Mt-Nb (18) (Fig. 2).
In Mt-Nb(III)-H2O, the Fe atom is in the heme plane and is coordinated to the proximal residue His155 (NE2-Fe distance 2.20 Å) and to a water molecule on the distal heme side (Fe-O distance 2.15 Å); the distal ligand is not stabilized by any interaction with protein residues or other water molecules. In Mt-Nb(III)-cyanide, the heme-Fe atom is coordinated to the proximal His155 (NE2-Fe distance 2.21 Å) and to the distal cyanide anion (Fe-C distance 2.22 Å), which is not stabilized by interaction with either protein residues or water molecules. The heme-Fe-C-N angle of Mt-Nb(III)-cyanide is 144°, the tilted orientation of the diatomic ligand likely reflects a partial reduction of the heme-Fe atom during X-ray data collection as already reported for monomeric globins (e.g., Pc-Mb(III)-cyanide) (21) (Fig. 2 and Supplementary Fig. S2).
In cyanide-bound Rp-NP1(III), Rp-NP2(III), and Rp-NP4(III) structures (PDB ID: 3NP1, 2HYS, and 1EQD, respectively), the proximal HisNE2-Fe distance is 1.97, 2.09, and 1.95 Å, respectively, and the distal Fe-cyanide (i.e., Fe-C) distance is 1.88, 1.99, and 1.92 Å, respectively. In Rp-NP2(III) and Rp-NP4(III), the heme-bound cyanide is stabilized by hydrogen bonding to two water molecules, whereas heme-bound cyanide is not stabilized by interaction with either protein residues or water molecules in Rp-NP1(III). In Rp-NP1(III), Rp-NP2(III), and Rp-NP4(III), the cyanide orientation is more perpendicular to the heme plane than in Mt-Nb(III), the heme-Fe-C-N angle being 173°, 174°, and 158°, respectively. This is in agreement with the very low tendency of heme-Fe(III) reduction in Rp-NPs (62, 70, 71) (Fig. 1).
The Mt-Nb(III)-H2O and Mt-Nb(III)-cyanide β-barrel core displays a large inner cavity (260 and 278 Å3, respectively) located below the heme group next to the B and C pyrrole rings and the joining CHC methinic bridge. The cavity is lined with several polar residues (Glu67, His85, Glu91, Glu93, His95, and Arg130) stabilizing some water molecules. The cavity part located further from the heme (i.e., deeper in the protein core) is instead lined with large apolar residues. At-Nb(III) and Hs-Nb(III) also display topologically equivalent core cavities, even though they are smaller (136 Å3 in At-Nb and 88 Å3 in Hs-Nb) and match the cavity of Mt-Nb(III) mostly in the region closer to the heme (Fig. 2).
In Mt-Nb and Hs-Nb, the heme is highly solvent exposed
UV-Visible and Resonance Raman spectra
Resonance Raman (RR) spectroscopy provides a means to assess the correspondence between structural and solution studies. In combination with the electronic absorption UV-Visible [UV-Vis] spectroscopy, RR allowed us to focus on the heme active site of Nb(III)s by monitoring the ligation and spin status of the heme-Fe(III) atom and the influence of the protein environment surrounding the metal center (64, 65).
In agreement with X-ray data, UV-Vis and RR spectra of Mt-Nb(III) at pH 6.0 and 7.4 are indicative of a six-coordinated high spin (6cHS) His-Fe-H2O species [Soret and CT1 bands at 407 and 635 nm, respectively (Fig. 3A); core-size marker bands at 1484 (ν3), 1566 (ν2), and 1613 cm−1 (ν10) (Fig. 3B)]. A pH-independent penta-coordinated high spin (5cHS) species (ν3 at 1492 cm−1 and ν2 at 1566 cm−1, possibly resulting from the contribution of both the 5cHS and 6cHS species) is also observed (Fig. 3B). In the Q region, the broad bands at 533 and 570 nm, which disappear by lowering the pH from 7.3 to 6.0 and increase at alkaline pH, are due to a His-Fe-OH− 6c low spin species (core-size marker bands at 1506 [ν3], 1579 [ν2], and 1640 cm−1 [ν10]). No investigation of the alkaline transition has been performed because at pH 10.5–11.0 the protein undergoes denaturation.
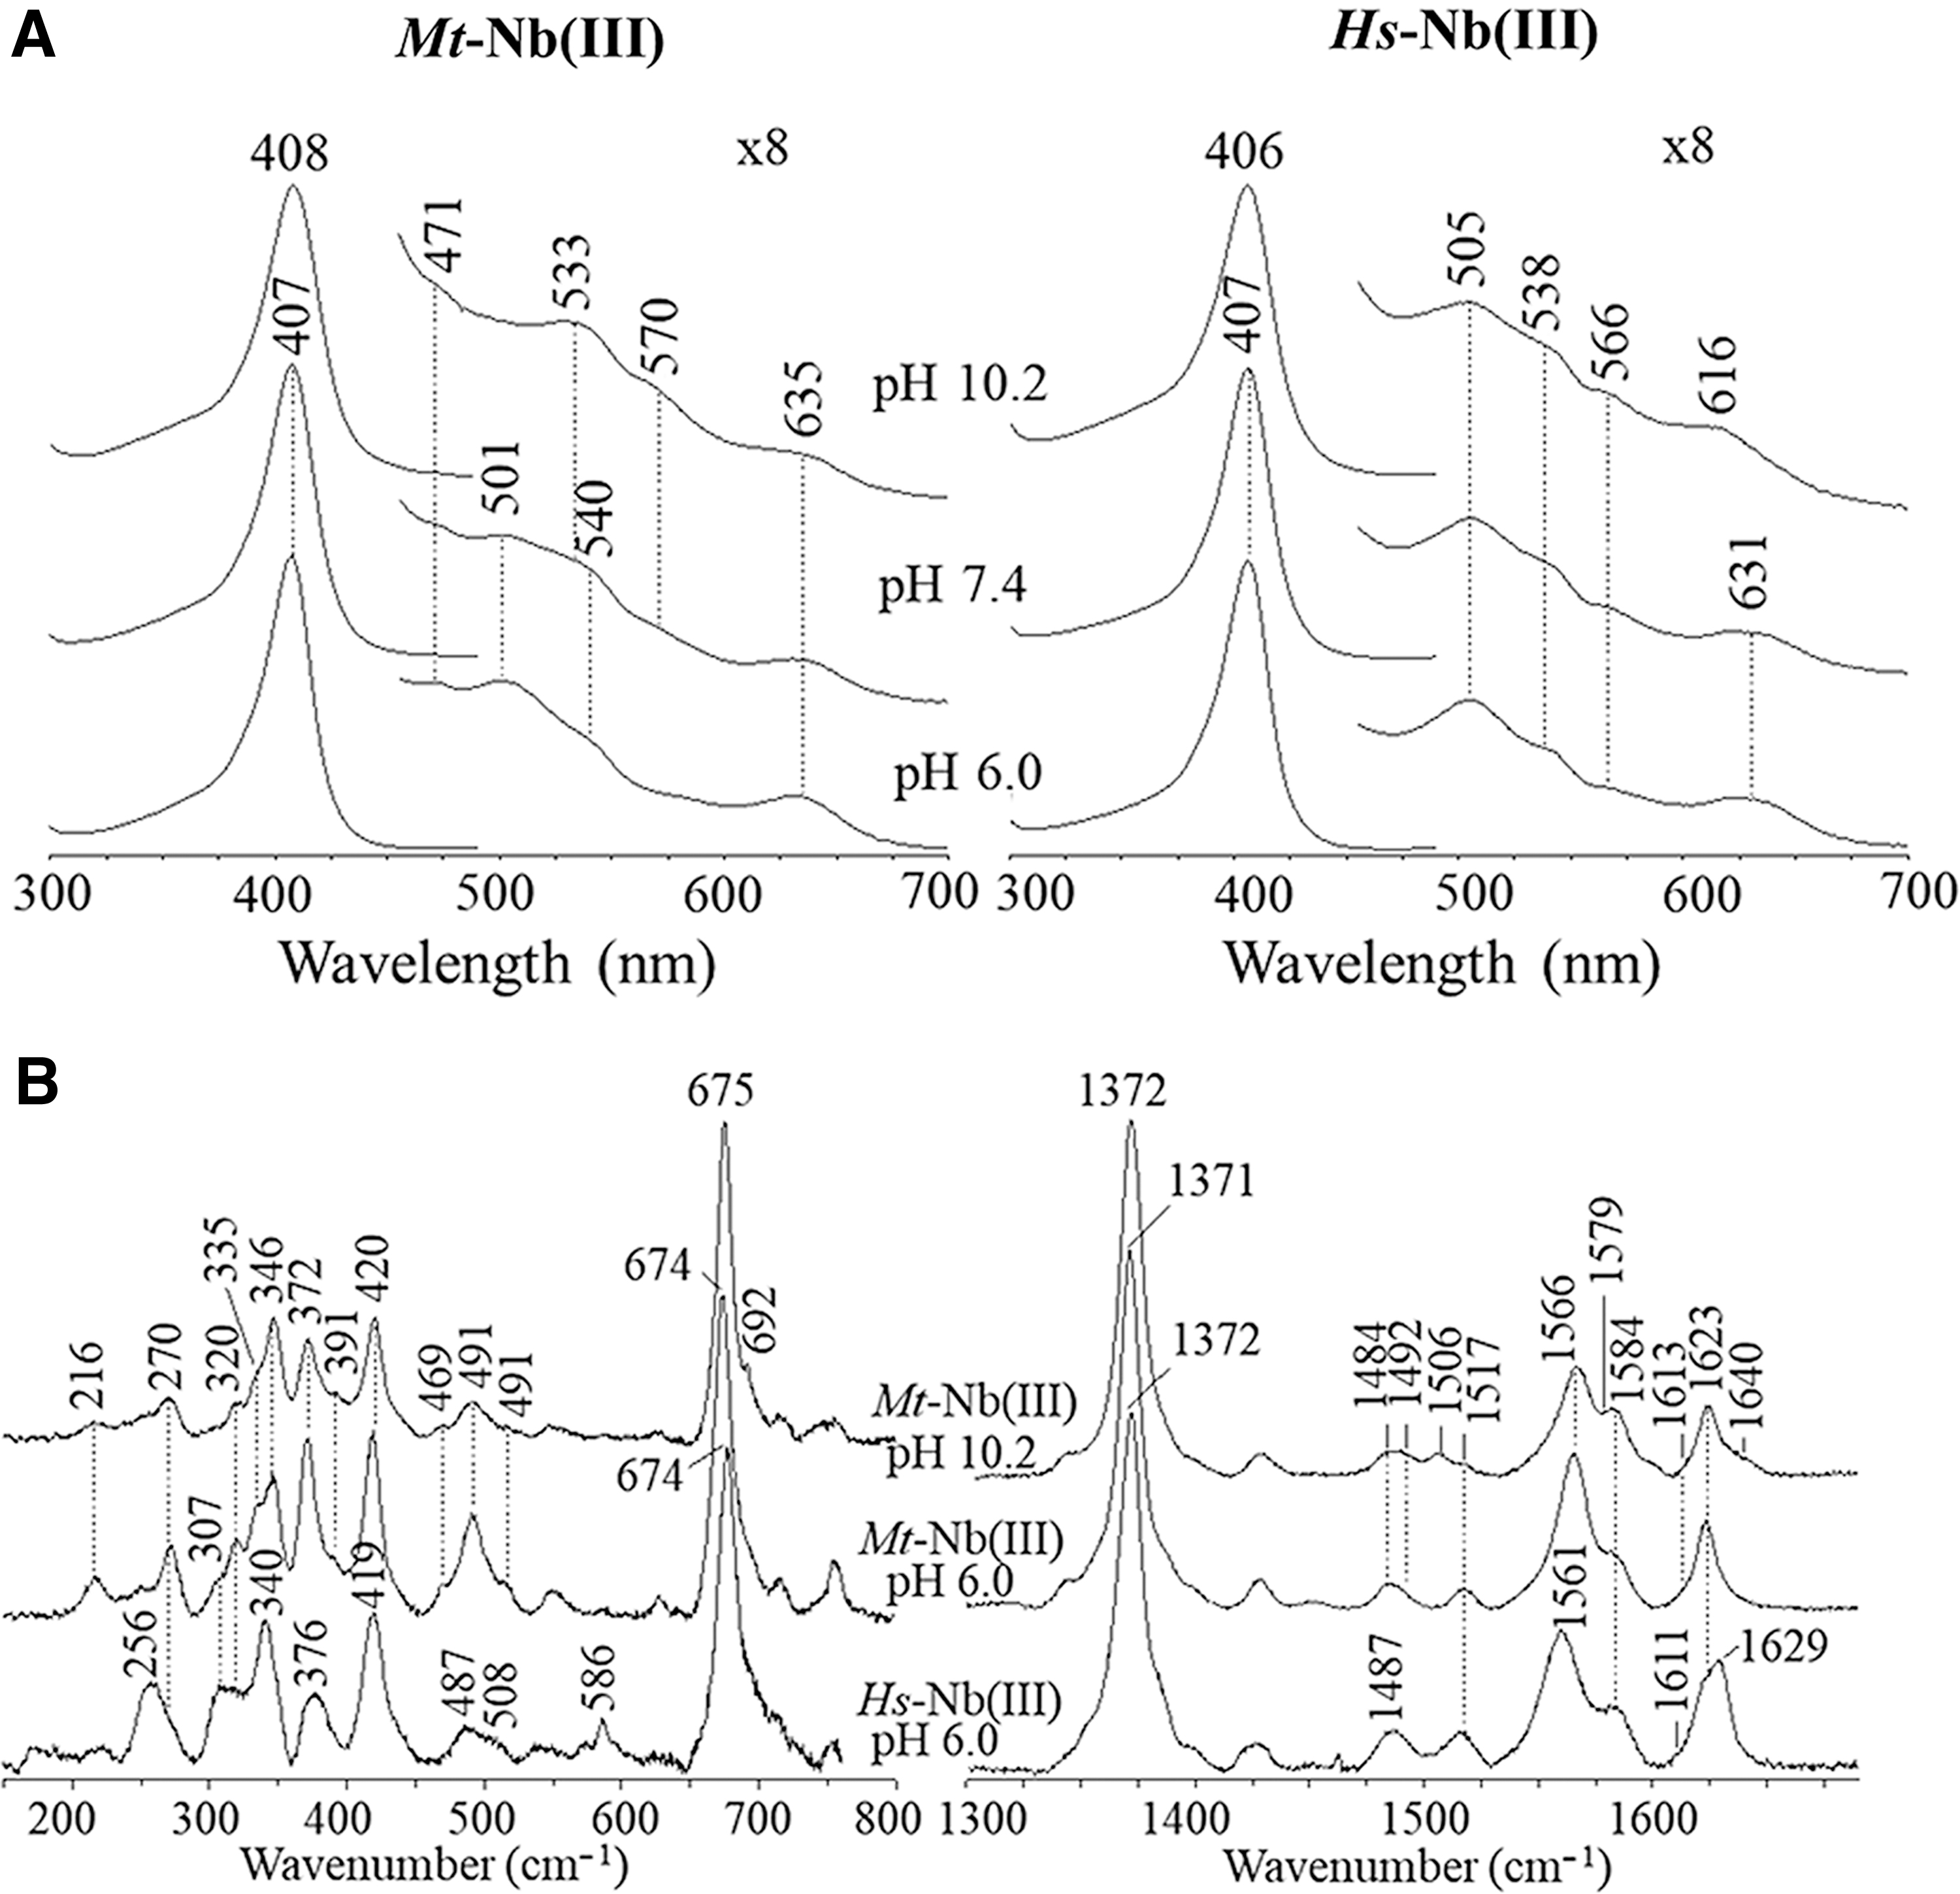
At pH 6.0 and 7.4, the UV-Vis and RR spectra of Hs-Nb(III) are similar to those of Mt-Nb(III), being typical of a 6cHS aquo species (Soret band at 407 nm; CT1 band at about 631 nm; Q bands at 505, 538, and 566 nm; core size marker bands at 1487 [ν3], 1561 [ν2], and 1611 cm−1 [ν10]) (Fig. 3A, B). Unlike Mt-Nb(III), only the shift of the CT1 band from 631 to 616 nm is clearly observed at alkaline pH values (Fig. 3A). However, the X-ray structure of Hs-Nb(III) does not show any water molecule coordinated to the heme-Fe-atom (PDB code: 3IA8) (18). This discrepancy possibly reflects the photoreduction of the heme-Fe(III) atom during X-ray irradiation.
The RR spectra in polarized light allowed us to assign the polarized ν(C = C) vinyl stretching modes. Both modes give rise to a band at 1623 cm−1 in Mt-Nb(III), whereas in Hs-Nb(III) the corresponding bands are at 1623 and 1629 cm−1 (Supplementary Fig. S3). An identical frequency indicates that in Mt-Nb(III) the two vinyl groups have very similar orientation with respect to the porphyrin double bonds (Cα = Cβ) and, as in Ec-Mb(III) (39) and Physeter catodon Mb (Pc-Mb(III)), are almost coplanar [in “trans” configuration (46)], with a high degree of conjugation. Conversely, in Hs-Mb(III), the two vinyl groups have different orientation, with one vinyl being less conjugated. These data are in perfect agreement with the measured torsional angles (Supplementary Fig. S4).
The propionate gives rise to the δ(CβCcCd) in-plane bending at 372 cm−1 with a shoulder at 379 cm−1 in Mt-Nb(III), and to a broader less intense band centered at 376 cm−1 in Hs-Nb(III). A frequency up-shift suggests a different H-bonding network (54) involving at least one propionate in Hs-Nb(III), as compared with Mt-Nb(III). Accordingly, the heme cavity structures of Mt-Nb(III) and Hs-Nb(III) show that the D propionate is hydrogen-bonded to Thr29 and Lys123 in Mt-Nb(III) and to Thr32 in Hs-Nb(III); whereas the A propionate is fully solvent exposed but H-bonded to a water molecule, which is, in turn, H-bonded to propionate D (Supplementary Fig. S5).
As already reported for At-Nb(III) (19) and NPs (5, 6, 36, 41, 43, 45, 59, 62, 70, 71), the current results indicate that in Mt-Nb(III) and Hs-Nb(III) the heme is highly solvent exposed and the heme-Fe(III) atom is stably present as His-Fe-H2O in solution.
Nuclear magnetic relaxation dispersion relaxometry
Nuclear magnetic relaxation dispersion (NMRD) profiles are a useful tool to investigate water dynamics in biological macromolecules, in particular in paramagnetic metalloproteins (1). The bulk water magnetic relaxation is affected by the number of water molecules bound either directly or in close proximity of the paramagnetic Fe(III) ion and by their exchange rate. In particular, measurements performed at variable temperature allow the determination of the exchange rate. NMRD profiles of Mt-Nb(III) and Hs-Nb(III) were measured at three different temperatures, and a detailed variable temperature observation was performed by operating at a fixed magnetic field (corresponding to a proton Larmor frequency of 0.02 MHz). Figure 4A shows the NMRD profiles of Mt-Nb(III) and Hs-Nb(III) that converge at high field, whereas a marked temperature-dependent separation was observed at low field. This suggests a situation of fast exchange between coordinated and bulk water and a modulation of the paramagnetic contribution to the water relaxation rate by the temperature effect on the electron relaxation rate and/or the molecular tumbling rate. Molecular correlation times are in the order of magnitude of nanoseconds (Supplementary Table S1), which are reasonable values for the field-independent electron spin relaxation time (42). The amplitudes of the observed NMRD profiles appear to be extremely high if compared with high-spin Fe(III) Mbs and Hbs (1, 2, 31, 42). As already proposed for ferric heme-albumin, such a large enhancement may be attributed to an extensive hydration of the heme proximity in terms of water molecules that experience dipolar interaction with unpaired electrons in a fast-exchange regime (30).

Measurements of R 1p at fixed (low) magnetic field and variable temperature allowed us to confirm that the water molecule(s) in close proximity of the paramagnetic metal center is in fast exchange with bulk water. Figure 4B shows that the millimolar paramagnetic relaxivity of both Mt-Nb(III) and Hs-Nb(III) solutions decreases with temperature, which is in keeping with a fast exchange regime. According to equation 5, ΔH≠ values for the molecular correlation times are 14.0 ± 0.8 and 19.9 ± 0.8 kJ/mol for Mt-Nb(III) and Hs-Nb(III), respectively. This finding suggests a different temperature dependence of the electron relaxation time of high-spin Fe(III), which, in turn, reflects structural changes in the heme environment. Such changes also include a difference in the hydration of the heme proximity, which is higher in Mt-Nb(III) than in Hs-Nb(III). As comparison, the slow-exchange behavior observed for the Equus caballus heart Mb (Ec-Mb(III)) is reported (Supplementary Fig. S6). In this case, R 1p markedly increases with increasing temperature, in agreement with a much larger ΔH ≠ for the exchange process ( = 95.5 ± 4.7 kJ/mol).
As a whole, both Mt-Nb(III) and Hs-Nb(III) display high NMRD relaxivity at low magnetic field compared with Ec-Mb(III). Although a high number of fast-exchanging water molecules approach the heme-Fe(III) atom, the reactivity of Mt-Nb(III) and Hs-Nb(III) appears to be modulated by motions of amino acid residues paving the heme distal pocket (see below).
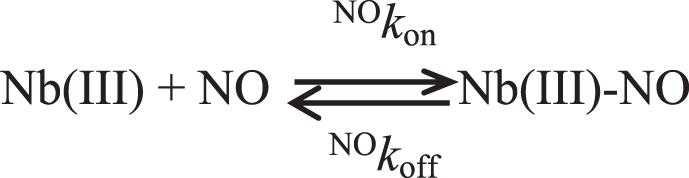
Mt-Nb(III) and Hs-Nb(III) bind NO
Considering the capability of At-Nb(III) and Rp-NP(III)s (5, 19) to bind NO, here we investigated Mt-Nb(III) and Hs-Nb(III) nitrosylation.
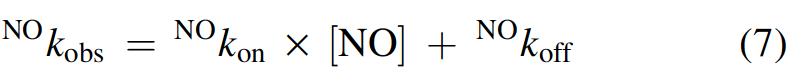
The time course for Mt-Nb(III) and Hs-Nb(III) nitrosylation corresponds to a single exponential process for 89% ± 8% of its course. Values of the apparent pseudo-first-order rate constant of Mt-Nb(III) and Hs-Nb(III) nitrosylation (i.e., NO k obs), determined according to equation 7, depend linearly on the NO concentration (Fig. 5A and Supplementary Fig. S7). The analysis of data, according to equation 7, allowed the determination of values of NO k on (representing the slope of the straight line) and of NO k off (representing the ordinate of the intercept of the straight line with the y-axis).
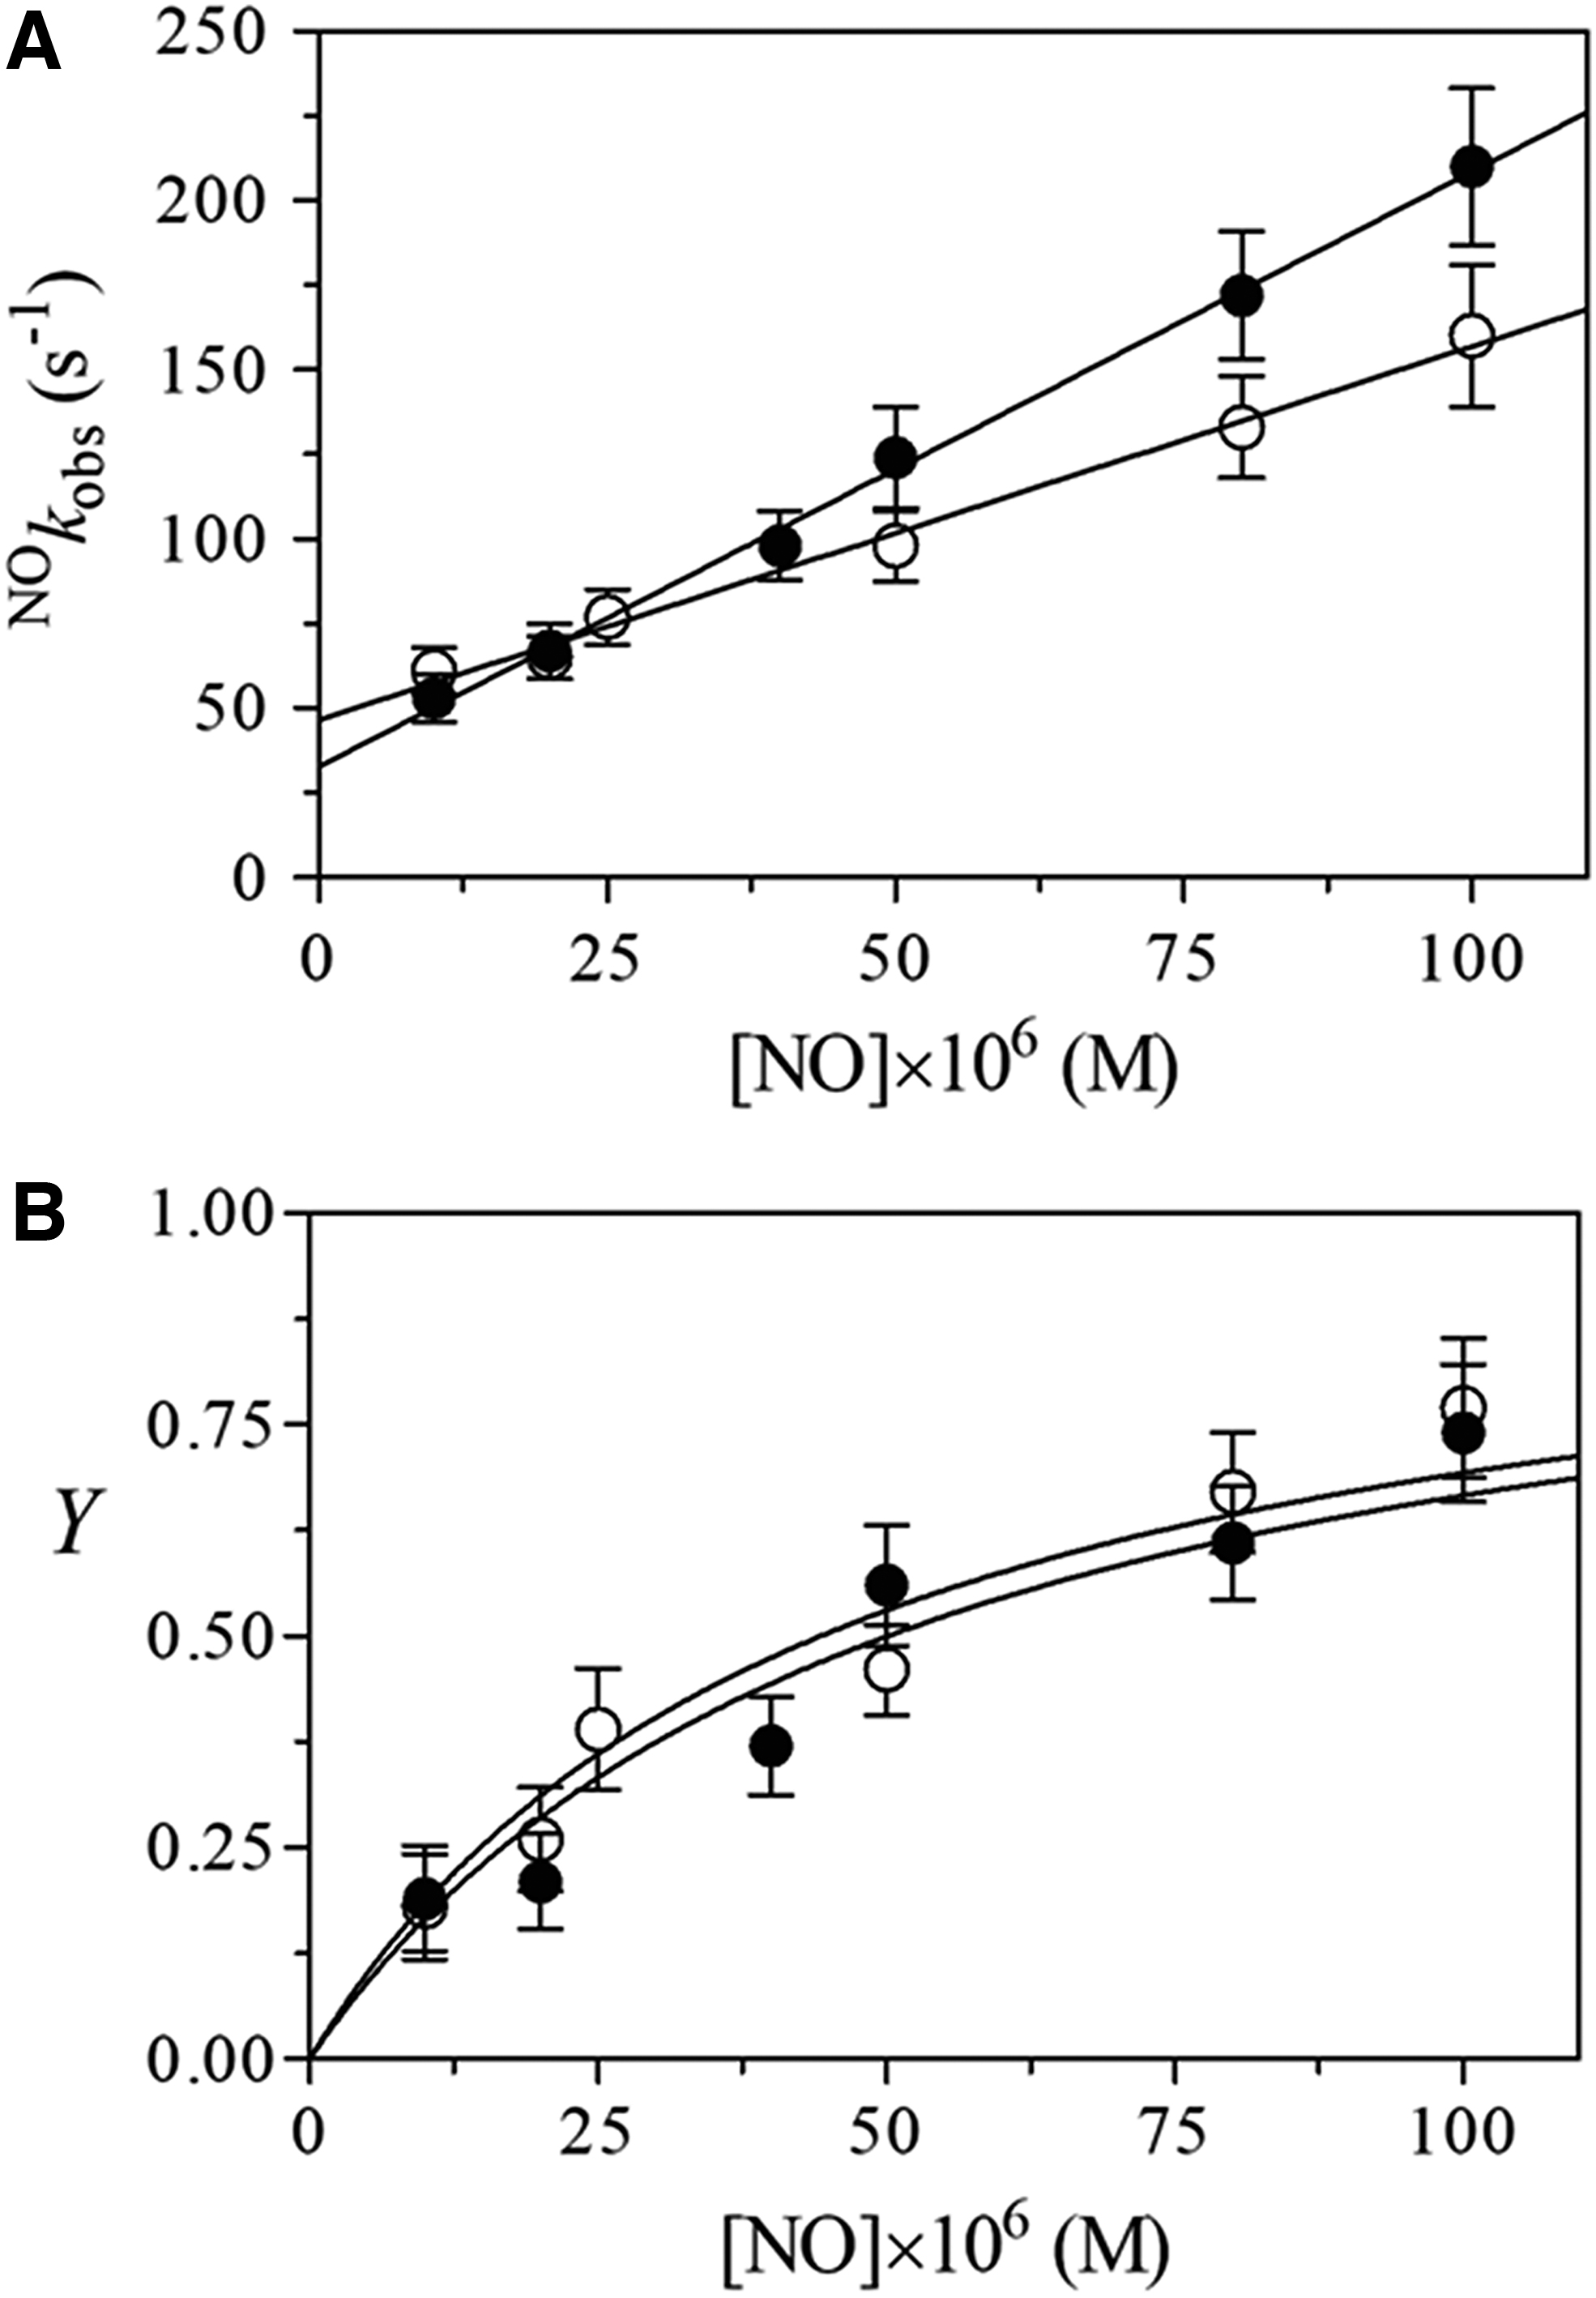
Values of Y for NO binding to Mt-Nb(III) and Hs-Nb(III) increased hyperbolically with the NO concentration tending to level off at 1.0 when [NO] was greater than 5 to 10 times NO K (Fig. 5B). The analysis of data, according to equation 8, allowed the determination of values of NO K. As expected for a simple equilibrium (i.e., data fitting with eqn. 8), values of the Hill coefficient n for Mt-Nb(III) and Hs-Nb(III) nitrosylation are 1.01 ± 0.02 and 0.98 ± 0.03, respectively. Moreover, values of the NO k off/NO k on ratio for NO binding to Mt-Nb(III) and Hs-Nb(III) match very well with those of NO K, highlighting the correctness of Scheme 1.
Values of NO k on for NO binding to Mt-Nb(III) and Hs-Nb(III) match very well with those reported for At-Nb(III) (19) as well as for Rp-NP1(III) and Rp-NP4(III) (5), but they are lower than those for Rp-NP2(III) and Rp-NP3(III) nitrosylation (5). The lowest value of NO k on is that for Pc-Mb(III) nitrosylation (13) (Table 1). The very slow nitrosylation process of Pc-Mb(III) could reflect the lower solvent accessibility to the heme with respect to Nb(III)s (18, 19, present study) and NP(III)s (5).
Apparent Kinetic and Thermodynamic Parameters for Nitric Oxide and Histamine Binding to Ferric Heme-Proteins
pH 7.0 and 20.0°C. Present study.
pH 7.0 and 20.0°C. From (19).
pH 8.0 and 25.0°C. Unlike for Nb(III)s and Pc-Mb(III), in the case of NP(III)s the NO binding process is more complex, implying a slow multistep mechanism; therefore, values of the overall dissociation equilibrium constant NO K obtained at equilibrium do not correspond to the NO k off/NO k on ratio obtained from kinetic experiments. From (4).
pH 8.0 and 12.0°C. From (4).
pH 7.2 and 20.0°C. From (14).
At, Arabidopsis thaliana; Hs, Homo sapiens; n.a., not available; Nb, nitrobindin; NO, nitric oxide; NP, nitrophorin; Pc-Mb, Physeter catodon Mb; Rp, Rodius prolixus.
Values of NO k off for NO denitrosylation from At-Nb(III) (19), Mt-Nb(III)-NO, Hs-Nb(III)-NO, Rp-NP2(III)-NO (5), and Rp-NP3(III)-NO (5) match well with each other, but they are higher than those of Rp-NP1(III)-NO (5), Rp-NP4(III)-NO (5), and Pc-Mb(III) (13) (Table 1). The different rates of NO dissociation from Nb(III)s (19, present study), Rp-NP(III)s (5) and Pc-Mb(III) (13) could reflect the different stabilization mode of the Fe(III)-bound NO by heme distal hydrogen bond network(s) (50).
The large difference of NO K ( = NO k off/NO k on) values for NO binding to Nb(III)s (19, present study), Rp-NP(III)s (5), and Pc-Mb(III) (13) (about 150-fold) mainly reflects differences of NO k on values (about 350-fold), values of NO k off changing by about 15-fold (Table 1).
Interestingly, despite the unrelated structural organization of all-β-barrel Nbs and NPs and of all-α-helical Ec-Mb, these heme-proteins display reminiscent kinetic and thermodynamic parameters, suggesting that the main ligand binding determinant is represented by the metal center chemistry.
Mt-Nb(III) and Hs-Nb(III) bind histamine with a very low affinity
Rp-NPs are able to bind histamine to reduce inflammation (22, 70). Considering the structural similarities between Rp-NPs and Nbs (18, 19, 70, present study), we investigated histamine binding to Mt-Nb(III), At-Nb(III), and Hs-Nb(III).
Since histamine binding to Nb(III)s is appreciable only at histamine concentrations ≥5.0 × 10⁻² M (data not shown), values of the dissociation equilibrium constant must be larger than 5.0 × 10⁻¹ M. Therefore, the affinity of histamine for Mt-Nb(III), At-Nb(III), and Hs-Nb(III) is seven to eight orders of magnitude lower than that for Rp-NPs (17) (Table 1). In agreement with these observations, superposition of molecular models for the Rp-NP1(III)-histamine complex (PDB code:1NP1) (70), Mt-Nb(III) (present study), At-Nb(III) (PDB code: 3EMM) (19), and Hs-Nb(III) (PDB code: 3IA8) (18) suggests that histamine binding to the heme-Fe(III) atom is impaired by steric clashes with the side chains of His85 and Ser87 in Mt-Nb(III), Ser97 and Thr98 in At-Nb(III), and Thr91 and Asn90 in Hs-Nb(III) facing the heme distal side (Supplementary Fig. S8).
Mt-Nb(III), At-Nb(III), and Hs-Nb(III) detoxify peroxynitrite
With the aim of seeking a function of Nbs, the ability of Mt-Nb(III), At-Nb(III), and Hs-Nb(III) to detoxify peroxynitrite has been deeply studied by combined approaches based on in vitro assays and prokaryotic and eukaryotic cells survival analysis.
Peroxynitrite scavenging in vitro
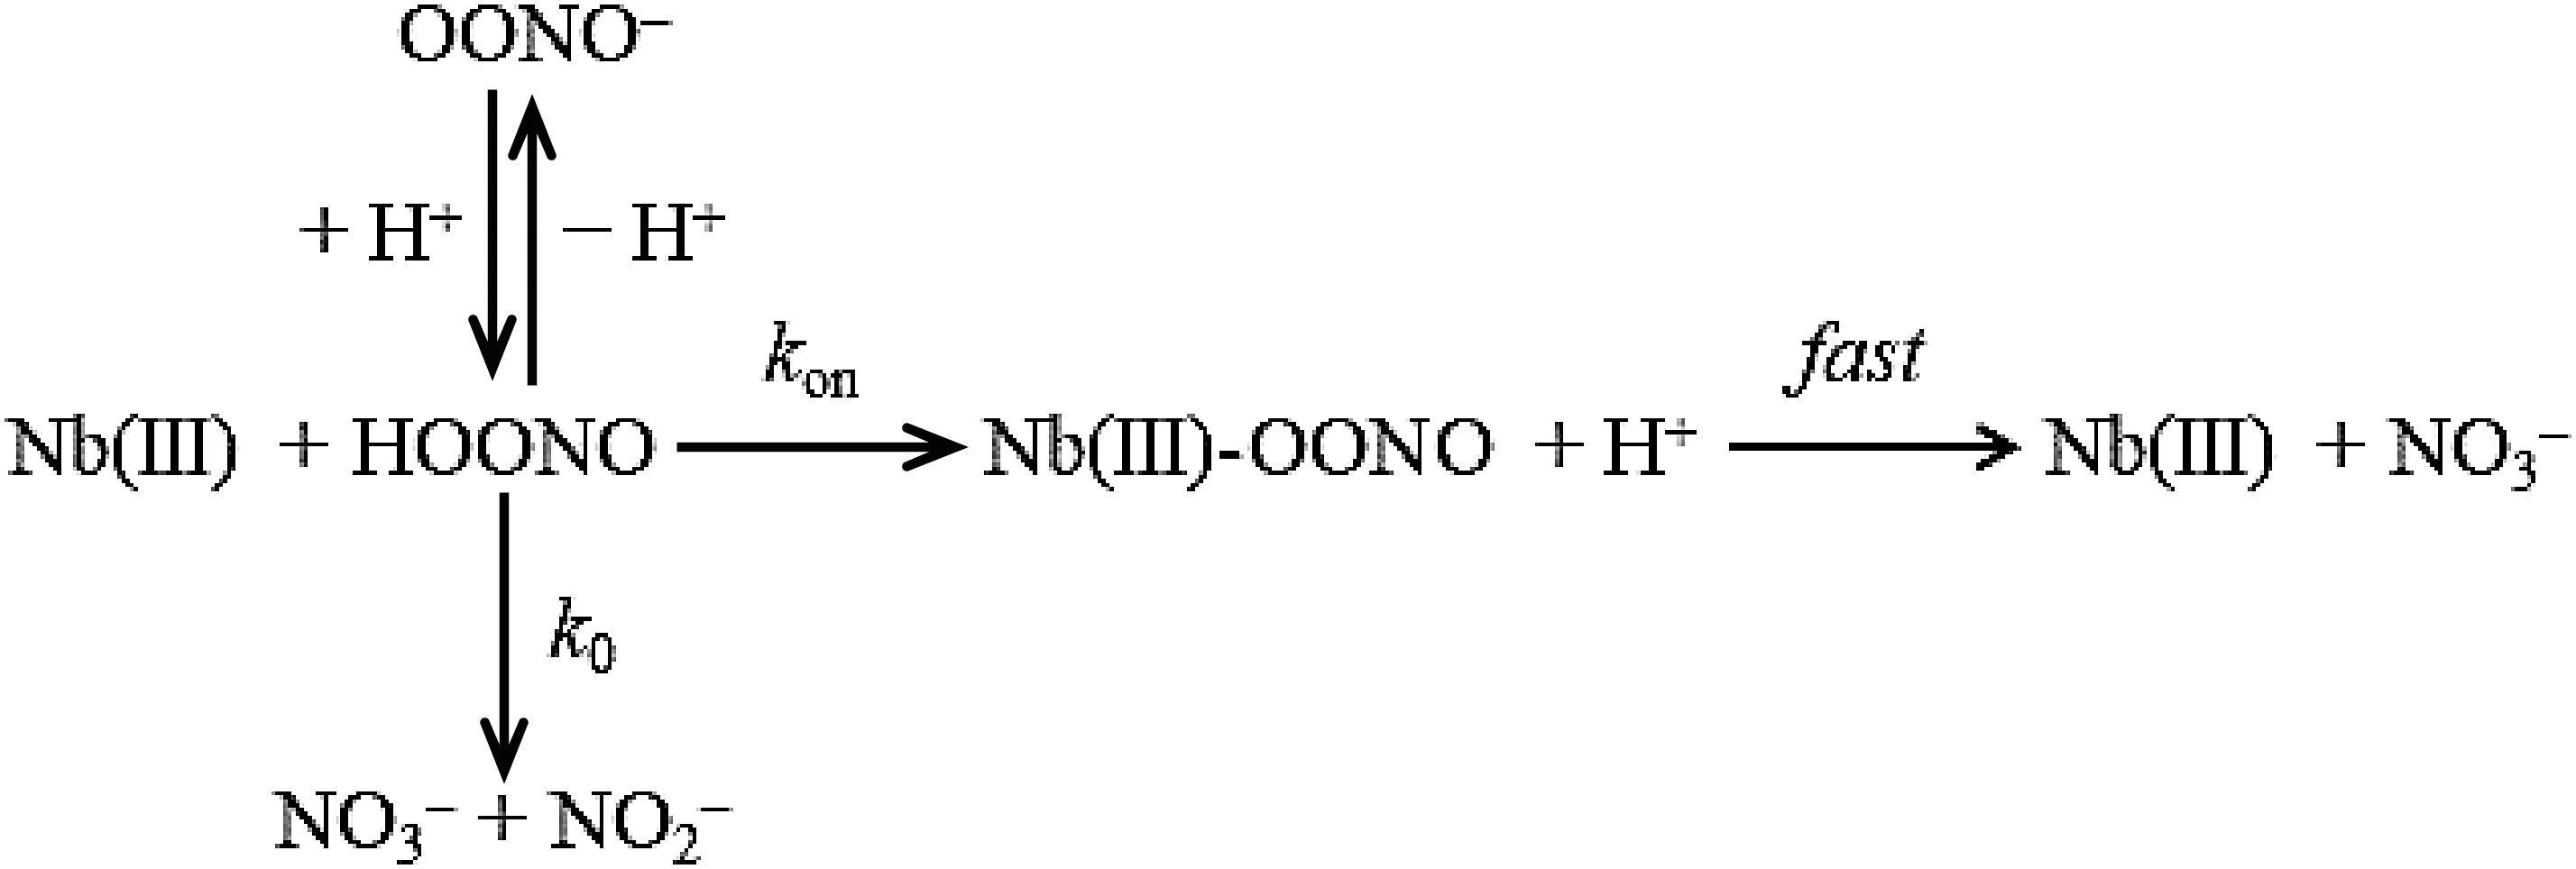
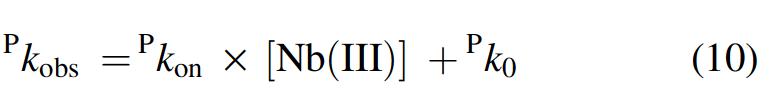
Under all the experimental conditions, most of the time course of peroxynitrite isomerization (>95%) has been fitted to a single-exponential decay according to equation 9 (Fig. 6A). The pseudo-first-order rate constant for peroxynitrite isomerization by Mt-Nb(III) (Fig. 6B), At-Nb(III) (Supplementary Fig. S9), and Hs-Nb(III) (27) (i.e., P k obs) increases linearly with the heme-protein concentration. Moreover, no absorbance spectroscopic changes were observed in the Soret region in the course of the Mt-Nb(III)-, Mycobacterium tuberculosis apo-Nb (Mt-apo-Nb)-, and At-Nb(III)-mediated isomerization of peroxynitrite. This suggests that: (i) the formation of the transient Nb(III)-OONO species represents the rate-limiting step in catalysis, and (ii) the conversion of Nb(III)-OONO to Nb(III) and NO3 − and NO2 − is faster than Nb(III)-OONO formation by at least 10-fold. According to equation 10, values of the second-order rate constant for peroxynitrite isomerization by all the three Nb(III)s (i.e., P k on, corresponding to the slope of the linear plots) and of the first-order rate constant for the spontaneous peroxynitrite isomerization (i.e., P k 0, corresponding to the y intercept of the linear plots) (Fig. 6) agree with those reported for Pc-Mb(III) (P k on = 1.6 × 10⁴ M−1 s−1 and P k 0 ∼ 0.3 s−1, at pH 7.5 and 20.0°C) (37).

To confirm the role of the heme-Fe(III) atom in catalysis, values of P k obs have been determined in the presence of Mt-apo-Nb, which does not catalyze the peroxynitrite isomerization. Indeed, values of P k obs obtained in the presence of Mt-apo-Nb correspond to those of P k 0 (Fig. 6B) as reported, among others, for Hs-apo-Nb and Ec-apo-Mb (27, 38).
In the presence of Mt-Nb(III), the values of the relative yield of NO3 − and NO2 − for the isomerization of peroxynitrite are 91% ± 3% and 10% ± 2%, respectively. However, in the absence of Mt-Nb(III) and in the presence of Mt-apo-Nb, the values of the relative yield of NO3 − and NO2 − are 71% ± 4% and 28% ± 3%, and 69% ± 4% and 32% ± 3%, respectively. These data well agree with those reported for peroxynitrite isomerization by ferric heme-proteins such as Hs-apo-Nb and Ec-apo-Mb (27, 38).
The pH dependence of P k on and P k 0 values for peroxynitrite (Supplementary Fig. S10) allowed to tentatively identify the species that preferentially react(s) with the heme-Fe(III) atom. The close similarity of the pH dependence of P k on and P k 0 suggests that the HOONO species (see Scheme 1) reacts preferentially with the heme-Fe(III) atom (27, 35, 37).
To analyze the protective role of Mt-Nb(III) against peroxynitrite-mediated nitration, the relative yield of nitro-
Mt-Nb mediates peroxynitrite detoxification in vivo
To investigate the capability of bacterial Nb to detoxify peroxynitrite in vivo, Mt-Nb protein has been transformed in the BL21(DE3) Escherichia coli strain (Supplementary Fig. S11), which has been subsequently treated for 24 h with increasing concentrations of the peroxynitrite generator 3-morpholino-sydnonimine (SIN-1) (i.e., 5.0 × 10⁻⁴, 1.0 × 10⁻³, and 1.5 × 10⁻³ M). Results obtained show that SIN-1 causes a dose-dependent decrease in the growth of wild-type BL21(DE3) E. coli (hereafter named BL21) and BL21(DE3) E. coli transformed with the empty vector (hereafter named BL21-pET28a) (Fig. 6D). Of note, BL21(DE3) E. coli overexpressing Mt-Nb (hereafter named BL21-Mt-Nb) and treated with SIN-1 displays a growth comparable to untreated bacteria and ∼10% significantly higher compared with BL21 and BL21-pET28a (Fig. 6D). Notably, the transformation with the pET28a(+) empty vector causes a 10% reduction in BL21-pET28a bacteria viability compared with BL21 (p < 0.001), as clearly visible at 5.0 × 10⁻⁴ M SIN-1. These results nicely demonstrate that Mt-Nb is able to detoxify peroxynitrite in vivo, thus ensuring bacteria growth also in the presence of RNS.
Hs-Nb allows the detoxification of peroxynitrite in human embryonic kidney 293 cells (HEK293)
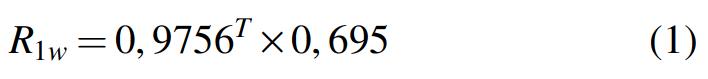
First, we asked where Hs-Nb localized after its overexpression in HEK293 cells. The subcellular fractionation of cell lysates indicates that Hs-Nb mostly localizes in the cytoplasm (Fig. 7A, lane C). As a minor part of Hs-Nb localizes in the nucleus (Fig. 7A, lane N), we analyzed the Hs-Nb sequence by the nuclear localization sequence (NLS) mapper (44), which allows the identification of regions mediating proteins imported into the nucleus. Results obtained indicate the presence of an NLS between Glu124 (E124) and Leu154 (L154) at the C-terminus of Hs-Nb (Fig. 7B).
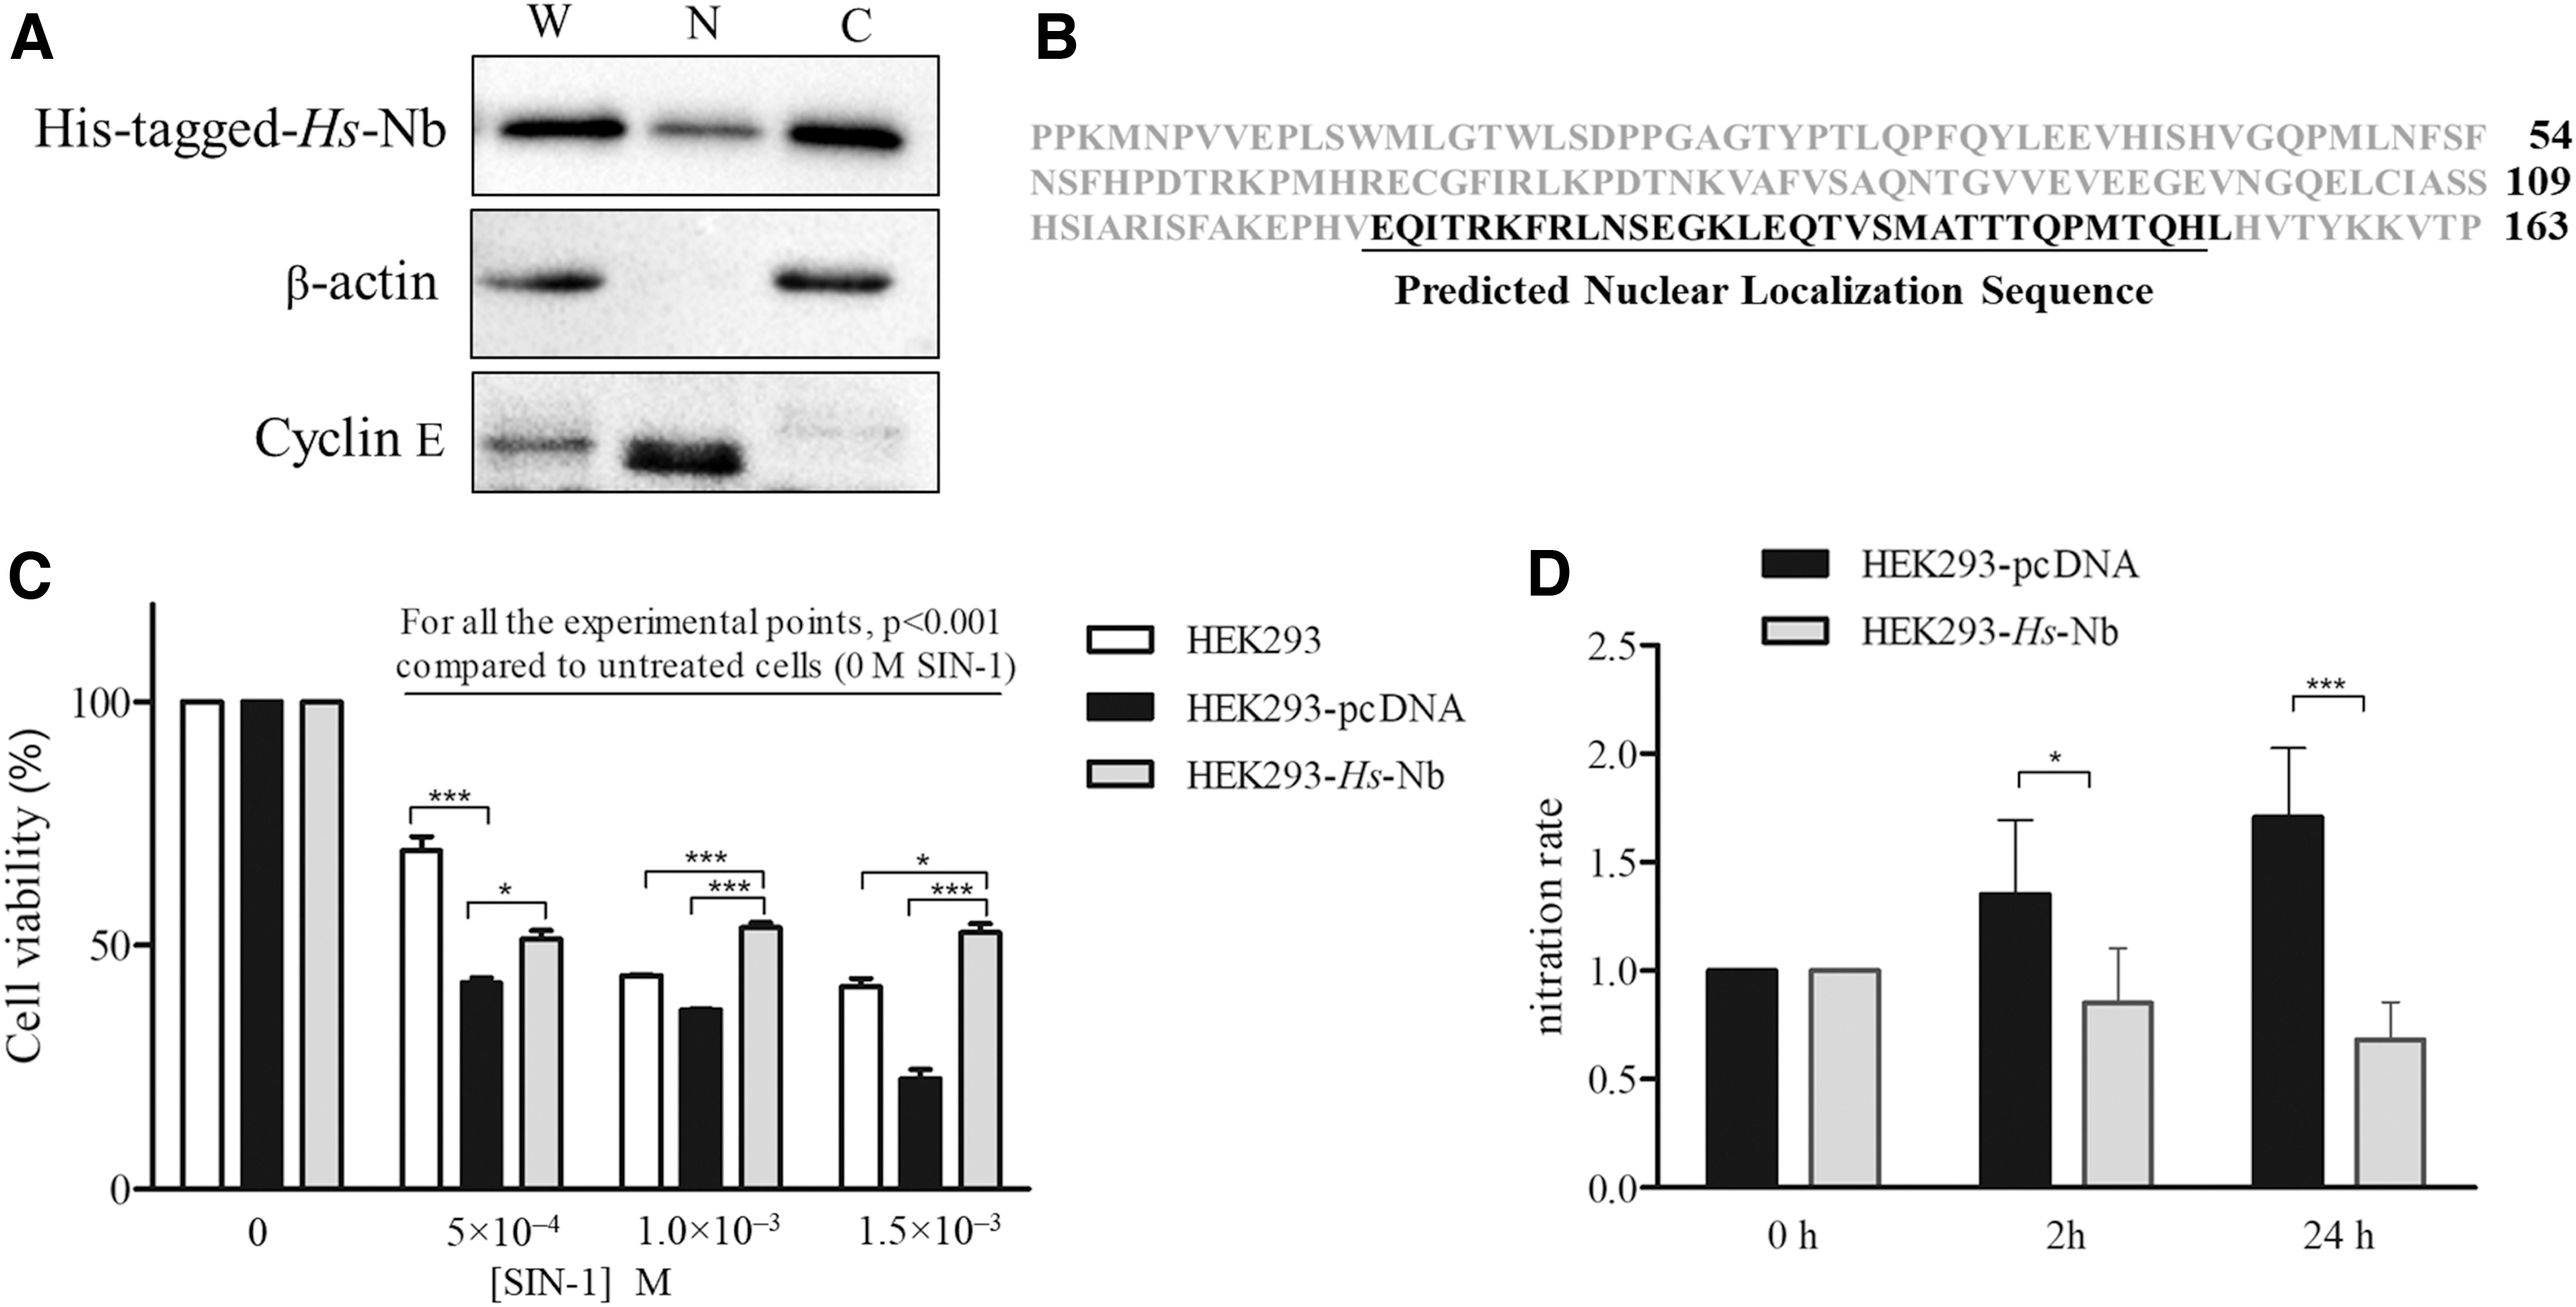
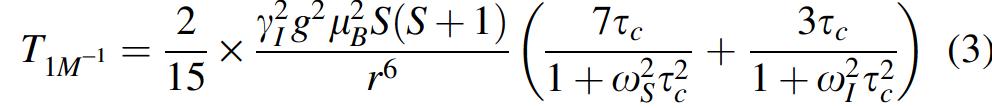
To test whether Hs-Nb is able to protect human cells from peroxynitrite detrimental effects, Hs-Nb has been ectopically overexpressed in HEK293 cells (Supplementary Fig. S11). The exposure for 2 h to SIN-1 (i.e., 5.0 × 10⁻⁴, 1.0 × 10⁻³, and 1.5 × 10⁻³ M) causes a dose-dependent reduction in the viability of both untransfected (HEK293) and empty vector-transfected (HEK293-pcDNA) cells, compared with relatively untreated cells (p < 0.001) (Fig. 7C). As observed in bacteria, the transfection itself causes a 40% reduction in HEK293-pcDNA cell viability compared with HEK293 (p < 0.001), as clearly visible at 5.0 × 10⁻⁴ M SIN-1. Cells overexpressing Hs-Nb (HEK293-Hs-Nb) show at 1.0 × 10⁻³ and 1.5 × 10⁻³ M SIN-1 a percentage of cell viability that is significantly higher compared with HEK293 (30% and 20%, respectively; p < 0.001); besides, HEK293-Hs-Nb cells show that at all SIN-1 doses there is a significantly higher percentage of cell viability compared with HEK-pcDNA (18% at 5.0 × 10⁻⁴ M [p < 0.05], 30% at 1.0 × 10⁻³ M [p < 0.001], and 67% at 1.5 × 10⁻³ M [p < 0.001]) (Fig. 7C).
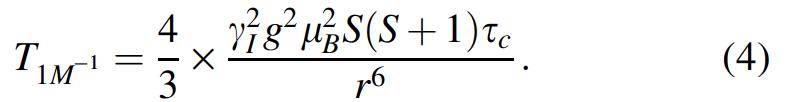
To evaluate whether Hs-Nb could exert a protective effect toward peroxynitrite-dependent proteins nitration, whole proteins extracts derived from HEK293-pcDNA and HEK293-Hs-Nb cells treated with 3.0 × 10⁻³ M SIN-1 have been analyzed by immunoblot using a monoclonal antibody directed against 3-nitro-tyrosine. Results obtained in HEK293-Hs-Nb cells show that Hs-Nb overexpression causes a 40% (p < 0.05) and 60% (p < 0.001) reduction of protein nitration after 2 and 24 h from SIN-1 exposure, respectively, compared with HEK293-pcDNA (Fig. 7D).
Overall, these results suggest that, similarly to Mt-Nb, Hs-Nb also is able to detoxify human cells from peroxynitrite.
Discussion
Here, the structural and functional properties of the 10-stranded β-barrel Mt-Nb(III) and Hs-Nb(III) are reported for the first time and compared with those of At-Nb(III), of the 8-stranded β-barrel Rp-NP(III)s, and of the all-α-helical mammalian Ec-Mb(III) and Pc-Mb(III).
Nbs cannot form stable complexes with O2 and carbon monoxide (CO) since the heme-Fe atom undergoes fast auto-oxidation under aerobic conditions (19). However, the similar physicochemical properties of Nbs (18, 19) and Rp-NPs (5, 6, 36, 41, 43, 45, 59, 62, 70, 71) suggest closely related physiological roles, possibly related to RNS metabolism (19, 27). Data here reported demonstrate that Mt-Nb(III) (present results), At-Nb(III) (19), and Hs-Nb(III) (present results) weakly bind NO and display a very low reactivity, if any, toward histamine.
In human cells, Hs-Nb is the C-terminal domain of the human nuclear protein THAP4. Therefore, it can be speculated that the Nb domain may act as a sensor that modulates THAP4 transcriptional activity residing at the N-terminal region (15, 18, 23, 25, 26, 61). The possible role of THAP4 as a protein that couples the heme-based ligand properties to the transcriptional function is reminiscent to that of heme-based sensors that are key regulators of adaptative responses to fluctuating NO, CO, and O2 levels (9, 32, 33, 57). The fact that Hs-Nb is stable in the ferric form could allow the selective binding of NO without recognizing CO and O2, which are the typical diatomic gaseous ligands of ferrous metal centers. However, the low affinity of NO for Hs-Nb excludes the possibility that this heme-protein can act as an NO sensor. Despite this, although Hs-Nb ectopically overexpressed in HEK293 cells mostly localizes in the cytoplasm, it possesses an NLS-encompassing residue Glu124-Leu154 located at the C-terminus. This seems to suggest that the Hs-Nb domain may mediate THAP4 translocation from the cytoplasm to the nucleus on ligand binding.
Results obtained by our group indicate that Nbs scavenge peroxynitrite and protect free
Overall, data here reported suggest that Hs-Nb could act as a sensor of peroxynitrite levels, in which peroxynitrite binding to the C-terminal Hs-Nb domain of THAP4 may regulate the transcriptional activity residing at the N-terminal domain. Future experiments aimed at validating this intriguing hypothesis will be fundamental to shed light on the physiological role of THAP4 in humans.
Materials and Methods
At-Nb, Mt-Nb, and Hs-Nb cloning, expression, and purification
The genome of Mycobacterium tuberculosis was used to obtain the gene of Mt-Nb through polymerase chain reaction (PCR). Gene amplification was achieved by using the following pair of primers: 5′-GCCCAAGCTTCATATGACCCGAGATCTGGCC-3′ and 5′-CGCGGATCCTCAGCGCTGCCGATGCAA-3′ (Merck KGaA, Darmstadt, Germany). The Mt-Nb amplicon of 500 bp was first sub-cloned in the pBluescript KS(−) and finally cloned in the pET-28a (+) vector. The E. coli PIR1 (clone 1039) expressing pUni51 vector with the At-Nb cDNA was obtained from Arabidopsis Biological Resource Center (The Ohio State University, OH). The At-Nb cDNA was amplified by PCR using the following pair of primers: 5′-GCCCAAGCTTCATATGAATCAGCTGCAGCAA-3′ and 5′-CGCGGATCCTCAAAGCTTATCGAG-3′ (Merck KGaA). The At-Nb amplicon of 501 bp was sub-cloned in the pET-28a (+) vector. Hs-Nb was cloned as previously reported (27).
The E. coli BL21(DE3) strain was used to express At-Nb, Mt-Nb, and Hs-Nb in the presence of 2.0 × 10⁻⁴ M δ-aminolevulinic acid. The expression of the 6 × His-tagged Nbs was induced by adding 1.0 × 10⁻³ M isopropyl-β-d-thiogalactoside for 16 h at 25.0°C for At-Nb (19 and present study) and 37.0°C for Mt-Nb (present study) and Hs-Nb (27). The bacterial pellet was lysed at pH 7.4 (2.0 × 10⁻² M phosphate buffer, 1.4 × 10⁻¹ M NaCl, and 0.015% Tween-20), and the supernatant was loaded onto a His-Trap affinity chromatography column (GE Healthcare Bio-sciences, Amersham, United Kingdom). The adsorbed 6 × His-tag-Nbs were eluted by a linear gradient of imidazole (2.0 × 10⁻² M phosphate buffer pH 7.4, 5.0 × 10⁻¹ M NaCl, and 1.0 × 10⁻² to 1.0 M imidazole). The fractions containing the His-tagged proteins were dialyzed against 1.0 × 10⁻² M phosphate buffer at pH 7.0 for At-Nb and pH 7.4 for Mt-Nb and Hs-Nb and subsequently analyzed by Western blot using the primary anti-6 × His-tagged antibody (Thermo Fisher Scientific, MA). The Mt-Nb, At-Nb, and Hs-Nb concentration was determined spectrophotometrically by using the following extinction coefficients at λmax = 407 nm: ɛ = 100, 80, and 147 mM−1 cm−1, respectively. Values of ɛ were determined through the pyridine-hemochromogen method (8). As reported for Hs-Nb (27), Mt-apo-Nb was prepared according to the acid-acetone method (8).
Chemicals
Gaseous NO (Linde Caracciolossigeno S.r.l., Roma, Italy) was purified under anaerobic conditions by flowing through a glass column packed with NaOH pellets and then by passage through a trap containing 20 mL of 5.0 M NaOH solution to remove traces impurities. The NO pressure was 760.0 mmHg (16). The stock NO solution was prepared anaerobically by keeping the degassed 5.0 × 10⁻² M phosphate buffer solution (pH 7.2) in a closed vessel under NO at P = 760.0 mm Hg (T = 20.0°C). The solubility of NO in the aqueous buffered solution is 2.05 × 10⁻³ M, at P = 760.0 mm Hg and T = 20.0°C (8). The concentration of NO was determined spectrophotometrically, in the presence of dithionite (5.0 × 10⁻³ M), by titration of ferrous sperm whale Mb; no gaseous phase was present (10).
Peroxynitrite was purchased from Cayman Chemical (Ann Arbor, MI). The concentration of peroxynitrite was determined spectrophotometrically before each experiment by measuring the absorbance at 302 nm (ɛ = 1.705 × 10³ M−1 cm−1) (35). Histamine, SIN-1,
Crystallization of Mt-Nb(III)-H2O and Mt-Nb(III)-cyanide and X-ray data collection
Crystals of Mt-Nb(III)-H2O and Mt-Nb(III)-cyanide grew after about 10 days at 21.0°C by the vapor diffusion technique under the following conditions: (i) for Mt-Nb(III)-H2O crystals, 2.0 × 10⁻¹ M MgCl2, 1.0 × 10⁻¹ M Tris pH 8.5, and polyethylene glycol (PEG) 4 k 30%; and (ii) for Mt-Nb(III)-cyanide crystals, 1.0 × 10⁻² M NiCl2, 1.0 × 10⁻¹ M Tris pH 8.5, PEG MM 2 k 20%, and 1.0 × 10⁻¹ M potassium cyanide. The X-ray data of Mt-Nb(III)-H2O and Mt-Nb(III)-cyanide crystals were collected at the European Synchrotron Radiation Facility (beamline ID23-2) (Grenoble, France). Diffraction data were reduced and scaled by using XDS (40) and Scala (29) programs. The three-dimensional structures of both Mt-Nb(III) species were solved by the Molecular Replacement method using the PHASER program (66). The structure of Mt-apo-Nb (PDB ID: 2FR2) was used as the search model. Mt-Nb(III)-H2O and Mt-Nb(III)-cyanide structures have been refined with Refmac program (48) to a final R-factor/R-free of 14.0/17.6% and 17.8/20.2%, respectively. Data collection and refinement statistics for Mt-Nb(III)-H2O and Mt-Nb(III)-cyanide are reported in Supplementary Table S2. Representative electron density for the two structures is displayed in Supplementary Figure S2. The coordinates have been deposited in the Protein Data Bank (60) with access codes 6R3W (Mt-Nb(III)-H2O) and 6R3Y (Mt-Nb(III)-cyanide).
CD measurements of Mt-Nb(III) and Hs-Nb(III)
The CD spectra of Mt-Nb(III) and Hs-Nb(III) in the far-UV region (190 to 250 nm) were recorded by using a Jasco-710 spectropolarimeter (Jasco, Tokyo, Japan) at pH 7.0 (1.0 × 10⁻² M phosphate buffer) and 25.0°C. Quartz cells with 2-mm path lengths were used. The molar ellipticity (deg × cm2 × dmol−1) is expressed as mean residue ellipticity [Θ] by taking 112 g/mol as the mean residue molecular weight. The spectra were acquired with 0.5 nm/min resolution and eight scans per spectrum. The Mt-Nb(III) and Hs-Nb(III) concentration was 1.0 × 10⁻⁵ M.
UV-Vis spectroscopy of Mt-Nb and Hs-Nb
UV-Vis spectra of Mt-Nb and Hs-Nb were collected from 250 to 700 nm by using a Cary 300 or a Cary 60 spectrophotometer (Agilent Technologies, Santa Clara, CA) at pH 6.0 (1.0 × 10⁻¹ M citrate buffer), 7.4 (2.0 × 10⁻² M phosphate buffer), and 10.2 (1.0 × 10⁻¹ M borate buffer) and by using a 5-mm NMR tube (scan rate: 300 nm min−1) or a 1-mm cuvette (scan rate: 600 nm min−1) at 25.0°C, with a resolution of 1.5 nm. To ensure the complete oxidation of Mt-Nb and Hs-Nb, 1 to 3 μL of a 3.0 × 10⁻³ M freshly prepared potassium ferricyanide solution was added to 40 μL of the protein samples. The Mt-Nb and Hs-Nb concentration ranged between 2.0 × 10⁻⁵ and 3.0 × 10⁻⁵ M.
RR measurements of Mt-Nb and Hs-Nb
The RR spectra of Mt-Nb and Hs-Nb were collected at pH 6.0 (1.0 × 10⁻¹ M citrate buffer) and 10.2 (1.0 × 10⁻¹ M borate buffer), at 25.0°C. To ensure the complete oxidation of Mt-Nb and Hs-Nb, 1 to 3 μL of a 3.0 × 10⁻³ M freshly prepared potassium ferricyanide solution was added to 40 μL of the protein samples. The Mt-Nb and Hs-Nb concentration ranged between 2.0 × 10⁻⁵ and 3.0 × 10⁻⁵ M.
The RR spectra were recorded by using a 5-mm NMR tube by excitation with the 406.7 and 413.1 nm lines of a Kr+ laser (Coherent, Innova 300 C; Coherent, Santa Clara, CA) The RR spectra were recorded by using the experimental setup as previously reported (68). Backscattered light from a slowly rotating NMR tube was collected and focused into a triple spectrometer (consisting of two Acton Research SpectraPro 2300i and a SpectraPro 2500i in the final stage with a grating of 3600 or 1800 grooves mm−1; Princeton Instruments, Trenton, NJ) working in the subtractive mode, equipped with a liquid nitrogen-cooled CCD detector. A spectral resolution of 1.2 cm−1 and spectral dispersion of 0.4 cm−1 pixel−1 were calculated theoretically on the basis of the optical properties of the spectrometer for the 3600 grating. The RR spectra were calibrated with indene, n-pentane, and carbon tetrachloride as standards to an accuracy of 1 cm−1 for intense isolated bands.
Polarized spectra were obtained by inserting a Polaroid analyzer between the sample and the entrance slit of the monochromator. The depolarization ratios of the bands at 314 and 460 cm−1 of CCl4 were measured to check the reliability of the polarization measurements. The values obtained, 0.73 and 0.00, compare well with the theoretical values of 0.75 and 0.00, respectively.
On Soret excitation, when the heme is planar (in the D
4h
pseudosymmetry, considering the eight side substituents as point masses), the RR spectrum is characterized by strong bands due to A
1g
modes (ν4, ν3, and ν2, polarized, with depolarization ratio, ρ
To improve the signal-to-noise ratio, a number of spectra were accumulated and summed only if no spectral differences were noted. All spectra were baseline corrected. The UV-Vis spectra were measured both before and after RR measurements to ensure that no degradation occurred under the experimental conditions that were used.
NMRD relaxometry of Mt-Nb(III) and Hs-Nb(III)
NMRD profiles of Mt-Nb(III) and Hs-Nb(III) (i.e., plots of the solvent water proton relaxation rate as a function of the applied magnetic field) were measured on a Stelar Spinmaster FFC field cycling spectrometer (Stelar, Mede, PV, Italy), operating in the field range from 2.4 × 10⁻⁴ to 3.05 × 10⁻¹ T (corresponding to proton Larmor frequencies from 0.01 to 13 MHz). The temperature was controlled by a Stelar VTC-91 airflow heater (Stelar), equipped with a copper-constantan thermocouple and coupled to a liquid nitrogen evaporator. As a blank, the neat water relaxation rate was calculated according to the following empirical equation 1:
The R 1p millimolar relaxivity values (i.e., the paramagnetic contributions to the solvent water longitudinal relaxation rate referenced to a 1.0 × 10⁻³ M concentration of the paramagnetic agent) were determined by subtracting from the observed relaxation rate the blank relaxation rate value R 1w, divided by the concentration of the paramagnetic species. For 1H nuclei, R 1p values are mostly affected by dipolar interaction with unpaired electrons of the paramagnetic center. For water molecules coordinated to the metal ion or bound to the protein in close proximity of the paramagnetic center, R 1p values are affected by the exchange lifetime of those water molecules, τM, according to equation 2:

where q is the average number of water molecules close to the metal center, T 1M is the longitudinal relaxation time of localized water protons, and τM is their exchange lifetime (1). In particular, T1M −1 is described by the Solomon-Bloembergen equation (1) (eqn. 3):
where S is the electron spin quantum number, γ I is the proton nuclear magnetogyric ratio, g and μ B are the electronic Lande factor and the Bohr magneton, respectively, r is the average distance between the metal ion and the protons of localized water molecules, and ω I and ω S are the proton and electron Larmor frequencies, respectively. In particular, ω S = 658 × ω I . The dipolar correlation time τc is the shortest among the reorientational correlation time τ R , the water exchange lifetime τ M , and the longitudinal electron spin relaxation time τS. At low-field approximation (i.e., at 0.02 MHz), both Lorentzian dispersion terms approximate to the numerator (eqn. 4):
As correlation times depend on temperature according to van't Hoff equation, under fast exchange conditions and the low field approximation, equation 5 may be derived to describe the temperature dependence of R 1p:

NO binding to Mt-Nb(III), At-Nb(III), and Hs-Nb(III)
Kinetics of NO binding to Mt-Nb(III), At-Nb(III), and Hs-Nb(III) were investigated at pH 7.0 (2.0 × 10⁻² M phosphate buffer) and 22.0°C by rapid mixing of ferric heme-protein solutions (final concentration, 2.5 × 10⁻⁶ and 2.7 × 10⁻⁶ M, respectively) with NO solutions (final concentration ranging between 1.0 × 10⁻⁵ and 1.0 × 10⁻⁴ M). Kinetics of NO binding to Mt-Nb(III), At-Nb(III), and Hs-Nb(III) was recorded by using the SFM-20/MOS-200 rapid-mixing stopped-flow apparatus (BioLogic Science Instruments, Claix, France), under anaerobic conditions, at 405 nm (12).
NO binding to Mt-Nb(III), At-Nb(III), and Hs-Nb(III) was analyzed in the framework of Scheme 1:
where Nb(III) is either Mt-Nb(III) or At-Nb(III) or Hs-Nb(III) and NO k off/NO k on = NO K.
Values of the apparent pseudo-first-order rate constant (k = NO k obs), of the total amplitude (A tot = [Nb(III)]i − [Nb(III)]∞), and of the amplitude at a given time (A t=x = [Nb(III)]t=x − [Nb(III)]∞) of the absorbance changes for NO binding to Mt-Nb(III), At-Nb(III), and Hs-Nb(III) (where [Nb(III)]I is the concentration at t = 0 and [Nb(III)]∞ is the concentration at the end of the reaction, respectively) were obtained according to equation 6:

Values of the apparent second-order rate constant for Mt-Nb(III), At-Nb(III), and Hs-Nb(III) nitrosylation (i.e., NO k on) and of the apparent first-order rate constant for Mt-Nb(III)-NO, At-Nb(III)-NO, and Hs-Nb(III)-NO denitrosylation (i.e., NO k off) were obtained from the dependence of NO k obs on the NO concentration (i.e., [NO]) according to equation 7:
Values of the apparent dissociation equilibrium constant (i.e., NO K) and of the Hill coefficient (i.e., n) for NO binding to Mt-Nb(III), At-Nb(III), and Hs-Nb(III) were obtained from the dependence of the relative absorbance amplitude (i.e., of the molar fraction; Y = A [NO]/A [NO]∞) on [NO] according to equation 8:

Histamine binding to Mt-Nb(III), At-Nb(III), and Hs-Nb(III)
Thermodynamics of histamine binding to Mt-Nb(III), At-Nb(III), and Hs-Nb(III) were investigated spectrophotometrically at pH 7.0 (1.0 × 10⁻¹ M phosphate buffer) and 20.0°C by adding histamine solutions (final concentration ranging between 1.0 × 10⁻⁴ and 1.0 × 10⁻¹ M) to ferric heme-protein solutions (final concentration ranging between 4.0 × 10⁻⁶ and 5.0 × 10⁻⁶ M). Absorbance spectra were recorded with a Jasco V-560 spectrophotometer, between 360 and 460 nm. Values of the overall dissociation equilibrium constant for histamine binding to Mt-Nb(III), At-Nb(III), and Hs-Nb(III) (i.e., Im K obs) were estimated in the framework of Scheme 2:

where Nb(III) is either Mt-Nb(III) or At-Nb(III) or Hs-Nb(III).
Docking of histamine to Mt-Nb(III), At-Nb(III), and Hs-Nb(III)
The superposition of the three-dimensional structure of the Rp-NP1-histamine complex (PDB code: 1NP1; 70) onto those of Mt-Nb(III), At-Nb(III), and Hs-Nb(III) has been carried out by the best fitting of structures taking as reference atoms of the heme moiety and of the proximal His residue using the appropriate Biopython module (24).
Peroxynitrite scavenging by Mt-Nb(III), At-Nb(III), and Hs-Nb(III)
Peroxynitrite isomerization was investigated by rapid mixing of the Mt-Nb(III) or Mt-apo-Nb solutions (final concentration ranging between 5.0 × 10⁻⁶ and 3.5 × 10⁻⁵ M) with the peroxynitrite solution (final concentration, 2.0 × 10⁻⁴ M). Kinetics was recorded by using the SFM-20/MOS-200 rapid-mixing stopped-flow apparatus (BioLogic Science Instruments) monitoring absorbance changes at 302 nm (27, 34, 35).
As already reported for Hs-Nb(III)-mediated peroxynitrite isomerization (27), the conversion of peroxynitrite to nitrate by Mt-Nb(III) and At-Nb(III) was analyzed in the framework of the reaction Scheme 3:
where Nb(III) is either Mt-Nb(III) or Mt-apo-Nb or At-Nb(III).
Values of the pseudo-first-order rate constant for peroxynitrite isomerization in the presence of Mt-Nb(III), Mt-apo-Nb, and At-Nb(III) (i.e., P k obs; P indicates peroxynitrite) were determined from the analysis of the time-dependent absorbance decrease at 302 nm, according to equation 9 (27):

Values of the second-order rate constant for peroxynitrite isomerization by Mt-Nb(III) and At-Nb(III) (i.e., P k on; P indicates peroxynitrite) and of the first-order rate constant for the spontaneous decay of peroxynitrite (i.e., P k 0) were obtained from the dependence of P k obs on the Nb(III) concentration (i.e., [Nb(III)]), according to equation 10 (27):
The reaction of peroxynitrite with free
The NO2 − and NO3 − concentrations were determined spectrophotometrically at 543 nm by using the Griess reagent and VCl3 to catalyze the conversion of NO3 − to NO2 −. The samples were prepared by mixing 0.5 mL of either an Mt-Nb(III) or an Mt-apo-Nb solution (final concentration, 3.5 × 10⁻⁵ M in 5.0 × 10⁻² M phosphate buffer, pH 7.1) with 0.5 mL of a peroxynitrite solution (final concentration, 2.0 × 10⁻⁴ M in 1.0 × 10⁻² M NaOH) while vortexing, at 25.0°C. The reaction mixture was analyzed within 10 min (27).
For comparison, data regarding peroxynitrite isomerization by Hs-Nb(III) were obtained from literature (27).
E. coli survival assays
E. coli BL21(DE3) strains overexpressing Mt-Nb were grown in Luria Bertani (LB) broth at 37°C until OD600 = 1. After that point, cultures were diluted in a 96-well plate to OD600 = 0.004 in LB broth containing increasing concentrations of the peroxynitrite generator SIN-1 (Santa Cruz, CA) (1 × 10⁻⁴, 5 × 10⁻⁴, 1 × 10⁻³, 1.5 × 10⁻³, 2 × 10⁻³ M). Bacteria were incubated for 20 h at 37°C. Bacterial growth was measured at 600 nm by using a microplate reader (Victor3V; PerkinElmer, MA). E. coli BL21(DE3) wild-type strain and E. coli BL21(DE3) transformed with the pET28a(+) empty vector treated with SIN-1 were used as control; DMSO was used as control vehicle.
Cell culture and transient transfection
HEK293 cells were grown in Dulbecco Modified Eagle's (DMEM; Biowest, Nuaillé, France) supplemented with 10% fetal bovine serum (Corning, NY), 2.0 × 10⁻³ M
HEK293 cell viability assay
After 48h from transient transfections, HEK293 cells were seeded at the density of 3 × 10⁴ cells mL−1 per well in 96-well plates and grown to 80% confluency. After 24 h, cell monolayers were exposed to either DMSO control vehicol or SIN-1 (1 × 10⁻⁴, 1 × 10⁻⁴, 1 × 10⁻³ M) for 2 h, and then they were postincubated in plain medium without SIN-1 for an additional 20 h at 37°C in a humidified atmosphere of 5% CO and 20% O2. Cell viability was assessed by the 3-[4,5-dimethylthiazole-2-yl]-2,5-diphenyltetrazolium bromide (MTT) assay (49). Briefly, an MTT solution (stock solution of 0.5 mg mL−1) was added to the cells and incubated for 2.5h at 37°C. Formazan crystals were then dissolved in lysis buffer (4 mM HCl, 0.1% NP40 (v/v) in isopropanol). Plates were analyzed by using a microplate reader at 570 nm (BioTek ELx800 Absorbance Microplate Reader, Winooski, VT). Untrasfected HEK293 cells and HEK293 transfected with the pcDNA3.1-HisA empty vector represented the controls of the experiment.
Immunoblot
To obtain whole protein lysates, cells were lysed with urea buffer (8.0 M urea, 5.0 × 10⁻² M Tris-HCl pH 7.5, 1.5 × 10⁻² M β-mercaptoethanol, 1.0 × 10⁻³ M dithiothreitol, and protease inhibitors). To obtain subcellular protein fractionation (i.e., nuclear and cytoplasmic proteins), cells were lysed as previously described (7). Lysates were quantified by using the Bradford protein assay (Bio-Rad, Hercules, CA). Twenty micrograms of protein extracts were resolved by sodium dodecyl sulfate–polyacrylamide gel electrophoresis and transferred onto PVDF membranes (Bio-Rad). After blocking for 1 h at room temperature (RT) with 3% bovine serum albumin (w/v) and dissolving in TBS buffer and 0.5% Tween-20 (v/v), membranes were probed overnight at 4°C by using the following primary antibodies: anti-3-nitro-tyrosine (sc-65385; Santa Cruz Biotechnology, Santa Cruz, CA), anti-poly-Histidine (H1029; Merck KGaA), anti-β-actin (sc-47778; Santa Cruz Biotechnology), and anti-cyclin E (sc-247; Santa Cruz Biotechnology). Membranes were then incubated for 1 h at RT with the appropriate HRP-conjugated secondary antibody (Bio-Rad). Blots were acquired and processed by using the ChemiDoc™ Imaging system (Bio-Rad). The protein levels and quantification were determined by using the Image Lab software (version 5.2.1 build 11; Bio-Rad Laboratories).
Protein nitration
HEK293 cells transiently transfected with either the pcDNA3.1-HisA empty vector or the pcDNA3.1-HisA-Hs-Nb were exposed to 3 × 10⁻³ M SIN-1 in serum-free DMEM for 2 and 24 h. Whole protein lysates were obtained and processed as described in the previous section.
Data analysis
Spectroscopic data were analyzed using LabCalc (Galactic Industries Corporation, Salem, NH) and OriginPro (OriginLab Corporation, Northampton, MA). Data were analyzed using the MatLab (The Math Works, Inc., Natick, MA), the OriginPro (OriginLab, Northampton, MA), and the GraphPad Prism (GraphPad Software, La Jolla, CA) programs. The results are given as mean values of at least three experiments plus or minus the corresponding standard deviation. The statistical analysis was performed by using an unpaired Student's t-test (*p < 0.05; **p < 0.01; ***p < 0.001).
Footnotes
Acknowledgments
The authors wish to thank Dr. Emanuela Frangipani for the kind gift of the Mycobacterium tuberculosis genome. They apologize to many authors of the outstanding papers that were not cited here due to space limitation.
Author Disclosure Statement
No competing financial interests exist.
Funding Information
The grant of Excellence Departments, MIUR-Italy (Articolo 1, Commi 314-337, Legge 232/2016) is gratefully acknowledged. SA and CV acknowledge the support from Fondazione di Piacenza e Vigevano and Azienda USL di Piacenza.
Supplementary Material
Supplementary Figure S1
Supplementary Figure S2
Supplementary Figure S3
Supplementary Figure S4
Supplementary Figure S5
Supplementary Figure S6
Supplementary Figure S7
Supplementary Figure S8
Supplementary Figure S9
Supplementary Figure S10
Supplementary Figure S11
Supplementary Table S1
Supplementary Table S2
Abbreviations Used
References
Supplementary Material
Please find the following supplemental material available below.
For Open Access articles published under a Creative Commons License, all supplemental material carries the same license as the article it is associated with.
For non-Open Access articles published, all supplemental material carries a non-exclusive license, and permission requests for re-use of supplemental material or any part of supplemental material shall be sent directly to the copyright owner as specified in the copyright notice associated with the article.