
Abstract
Aims:
Although preeclampsia (PE) has been attributed to excessive oxidative stress (OS) in the placenta, mild antioxidants failed to prevent PE in clinical trials. As mitochondria are a major source of OS, this study assessed the potential of a potent mitochondria-targeting antioxidant MitoQ in the prevention of PE.
Results:
Placentas from women with PE and from reduced uterine perfusion pressure (RUPP) mice demonstrated significantly higher OS, along with increased mitochondrial damage and compromised glutathione peroxidase (GPx) activities. MitoQ administration during late gestation alleviated RUPP-induced PE; whereas early-pregnancy MitoQ treatment not only exacerbated blood pressure, fetal growth restriction, and proteinuria but also reduced the labyrinth/spongiotrophoblast ratio and blood sinuses in the labyrinth. Invasion (Matrigel transwell) and migration (wound healing assay) of trophoblasts were greatly improved by 1 μM hydrogen peroxide (H2O2), but this improvement was abolished by MitoQ or MitoTempo. Mild OS enhanced the expression of miR-29b-3p, which regulates five genes involved in viability and mobility, in HTR8-S/Vneo cells.
Innovation and Conclusions:
Although the potent mitochondrial-targeting antioxidant MitoQ protects against hypertension and kidney damage induced by RUPP in mice when administered in late gestation, it exacerbates the PE-like phenotype when given in early gestation by interfering with placenta formation because mild OS is required to stimulate trophoblast proliferation, invasion, and migration. Eliminating trophoblastic OS during early pregnancy may lead to compromised placentation and a risk of diseases of placental origin. Therefore, antioxidant therapy for pregnant women should be carefully considered.
Introduction
Preeclampsia (PE), recurrent miscarriage, and fetal growth restriction (FGR) share various similarities in placental pathology (6, 15, 40, 42), and aberrant placentation increases the risk of adverse maternal and fetal outcomes in late gestation (65). In normal pregnancy, trophoblasts invade the spiral arterial wall, destroy the media, and transform spiral arteries from narrow-diameter to large-diameter vessels, which increases blood flow and enables adequate placenta perfusion (7). The failure of physiological remodeling of the spiral arteries leads to intermittent hypoxia and reoxygenation (8), producing excess reactive oxygen species (ROS) and consequent oxidative stress (OS). OS has long been implicated in diseases of placental origin, and a disturbed redox state has been associated with early-onset PE (63). Moreover, antioxidant administration in a rodent animal PE (60) model and women diagnosed with PE (27, 60) or FGR (48) alleviated clinical manifestations. In contrast, efforts to prevent PE by antioxidant therapy before the onset of clinical signs failed in multiple clinical randomized controlled trials (35, 50, 51, 58), potentially attributable to the use of mild natural antioxidants, such as vitamin C and E, in those trials. Nevertheless, accumulative evidence has suggested that antioxidant supplementation does not always demonstrate benefits, especially in chronic diseases such as cardiovascular diseases and cancers (4, 18), but rather promotes the incidence and progression of chronic diseases, and hence may increase mortality (5). Therefore, the use of potent antioxidants for PE prevention sounds promising but is also uncertain.
Innovation
This study developed from the hypothesis that mitochondrial-targeting antioxidants might be an effective choice for preventing preeclampsia (PE). However, antioxidant administration in early gestation resulted in a worse outcome, which is consistent with previous clinical trials. This phenomenon leads to a novel perspective on redox in diseases of placental origin, especially PE. Certain levels of oxidative stress should be maintained for placentation, because redox signaling is involved in the regulation of trophoblast functions via modulating miR-29b-3p and downstream targeting gene expression.
There are explanations for the failure of antioxidant trials for PE treatment. First, their bioavailability (F) has been argued, and it has been found that antioxidants targeted to placenta by the use of nanoparticles (23) or more potent antioxidants might prevent PE development (13, 23, 63). Second, understanding the molecular pathways has implicated redox-dependent signaling as essential to a host of cellular decisions, including differentiation, growth, cell death, and senescence (21, 54). Moreover, the release of oxidants triggers protective responses that appear to insulate the organism from subsequent larger stresses (66), while scavenging ROS surrender such protection, leaving the organism more vulnerable.
Mitochondria are the major source of ROS in cells. Electrons “leak” while being transferred along the electron transport chain, particularly at Complexes I and III. The reduction of oxygen by the respiratory chain generates superoxide, which is effectively transformed to hydrogen peroxide (H2O2) in the mitochondrial matrix and intermembrane space by superoxide dismutase (SOD) 1 or 2. Thus, the involvement of mitochondrial ROS in the relationship between PE and mitochondrial dysfunction (20, 38) cannot be obviated. Therefore, MitoQ (24 –26), a ubiquinone (Coenzyme Q) compound on a lipophilic cation that accumulates 1- to 10-fold within the cell cytoplasm and several hundred folds within mitochondria, confers potent mitochondria-specific antioxidative effects and might be an effective therapy to prevent PE.
MitoQ was first developed in the 1990s and then marketed since 2012. Its benefits have been observed across a variety of health-related issues. In animal studies, MitoQ treatment reduced OS and inflammatory cytokines in the lungs of offspring in a long-term maternal cigarette-smoking mouse model (57), improved fetal brain development in a hypoxic rat model (43), and alleviated signs of PE in a rat reduced uterine perfusion pressure (RUPP) model (60).
Due to the role of dysfunctional placentation in the pathogenesis of diseases such as PE and FGR, the aim of this study was to investigate whether administration of the potent mitochondria-targeting antioxidant MitoQ during early and late gestation prevents and releases the development of PE.
Results
Preeclamptic and RUPP-induced placentas are associated with mitochondrial dysfunction and elevated OS
To investigate whether the increased OS in the placentas from PE pregnancies was derived from mitochondria, the subcellular localization of lipid peroxidation and mitochondria was detected in human placenta tissue. As shown in Figure 1A, the level of 4-hydroxynonenal (4HNE) was significantly higher in placentas from PE pregnancies. Coincidently, the staining of 4HNE was largely colocalized with that of TOMM20. Then, to determine whether mitochondria were responsible for the elevated OS in placentas from PE pregnancies, placental mitochondria were isolated, and electron microscopy (EM) revealed that mitochondria from placentas from PE pregnancies were swollen and associated with membrane rupture (Fig. 1B). In accordance with the structural damage, the activity of glutathione peroxidase (GPx), a well-studied mitochondrial antioxidative enzyme, was significantly compromised in placentas from PE pregnancies in comparison with placentas from uncomplicated pregnancies, whereas the activity of Mn-SOD (SOD2) also exhibited a trend of reduction (Fig. 1C, D).
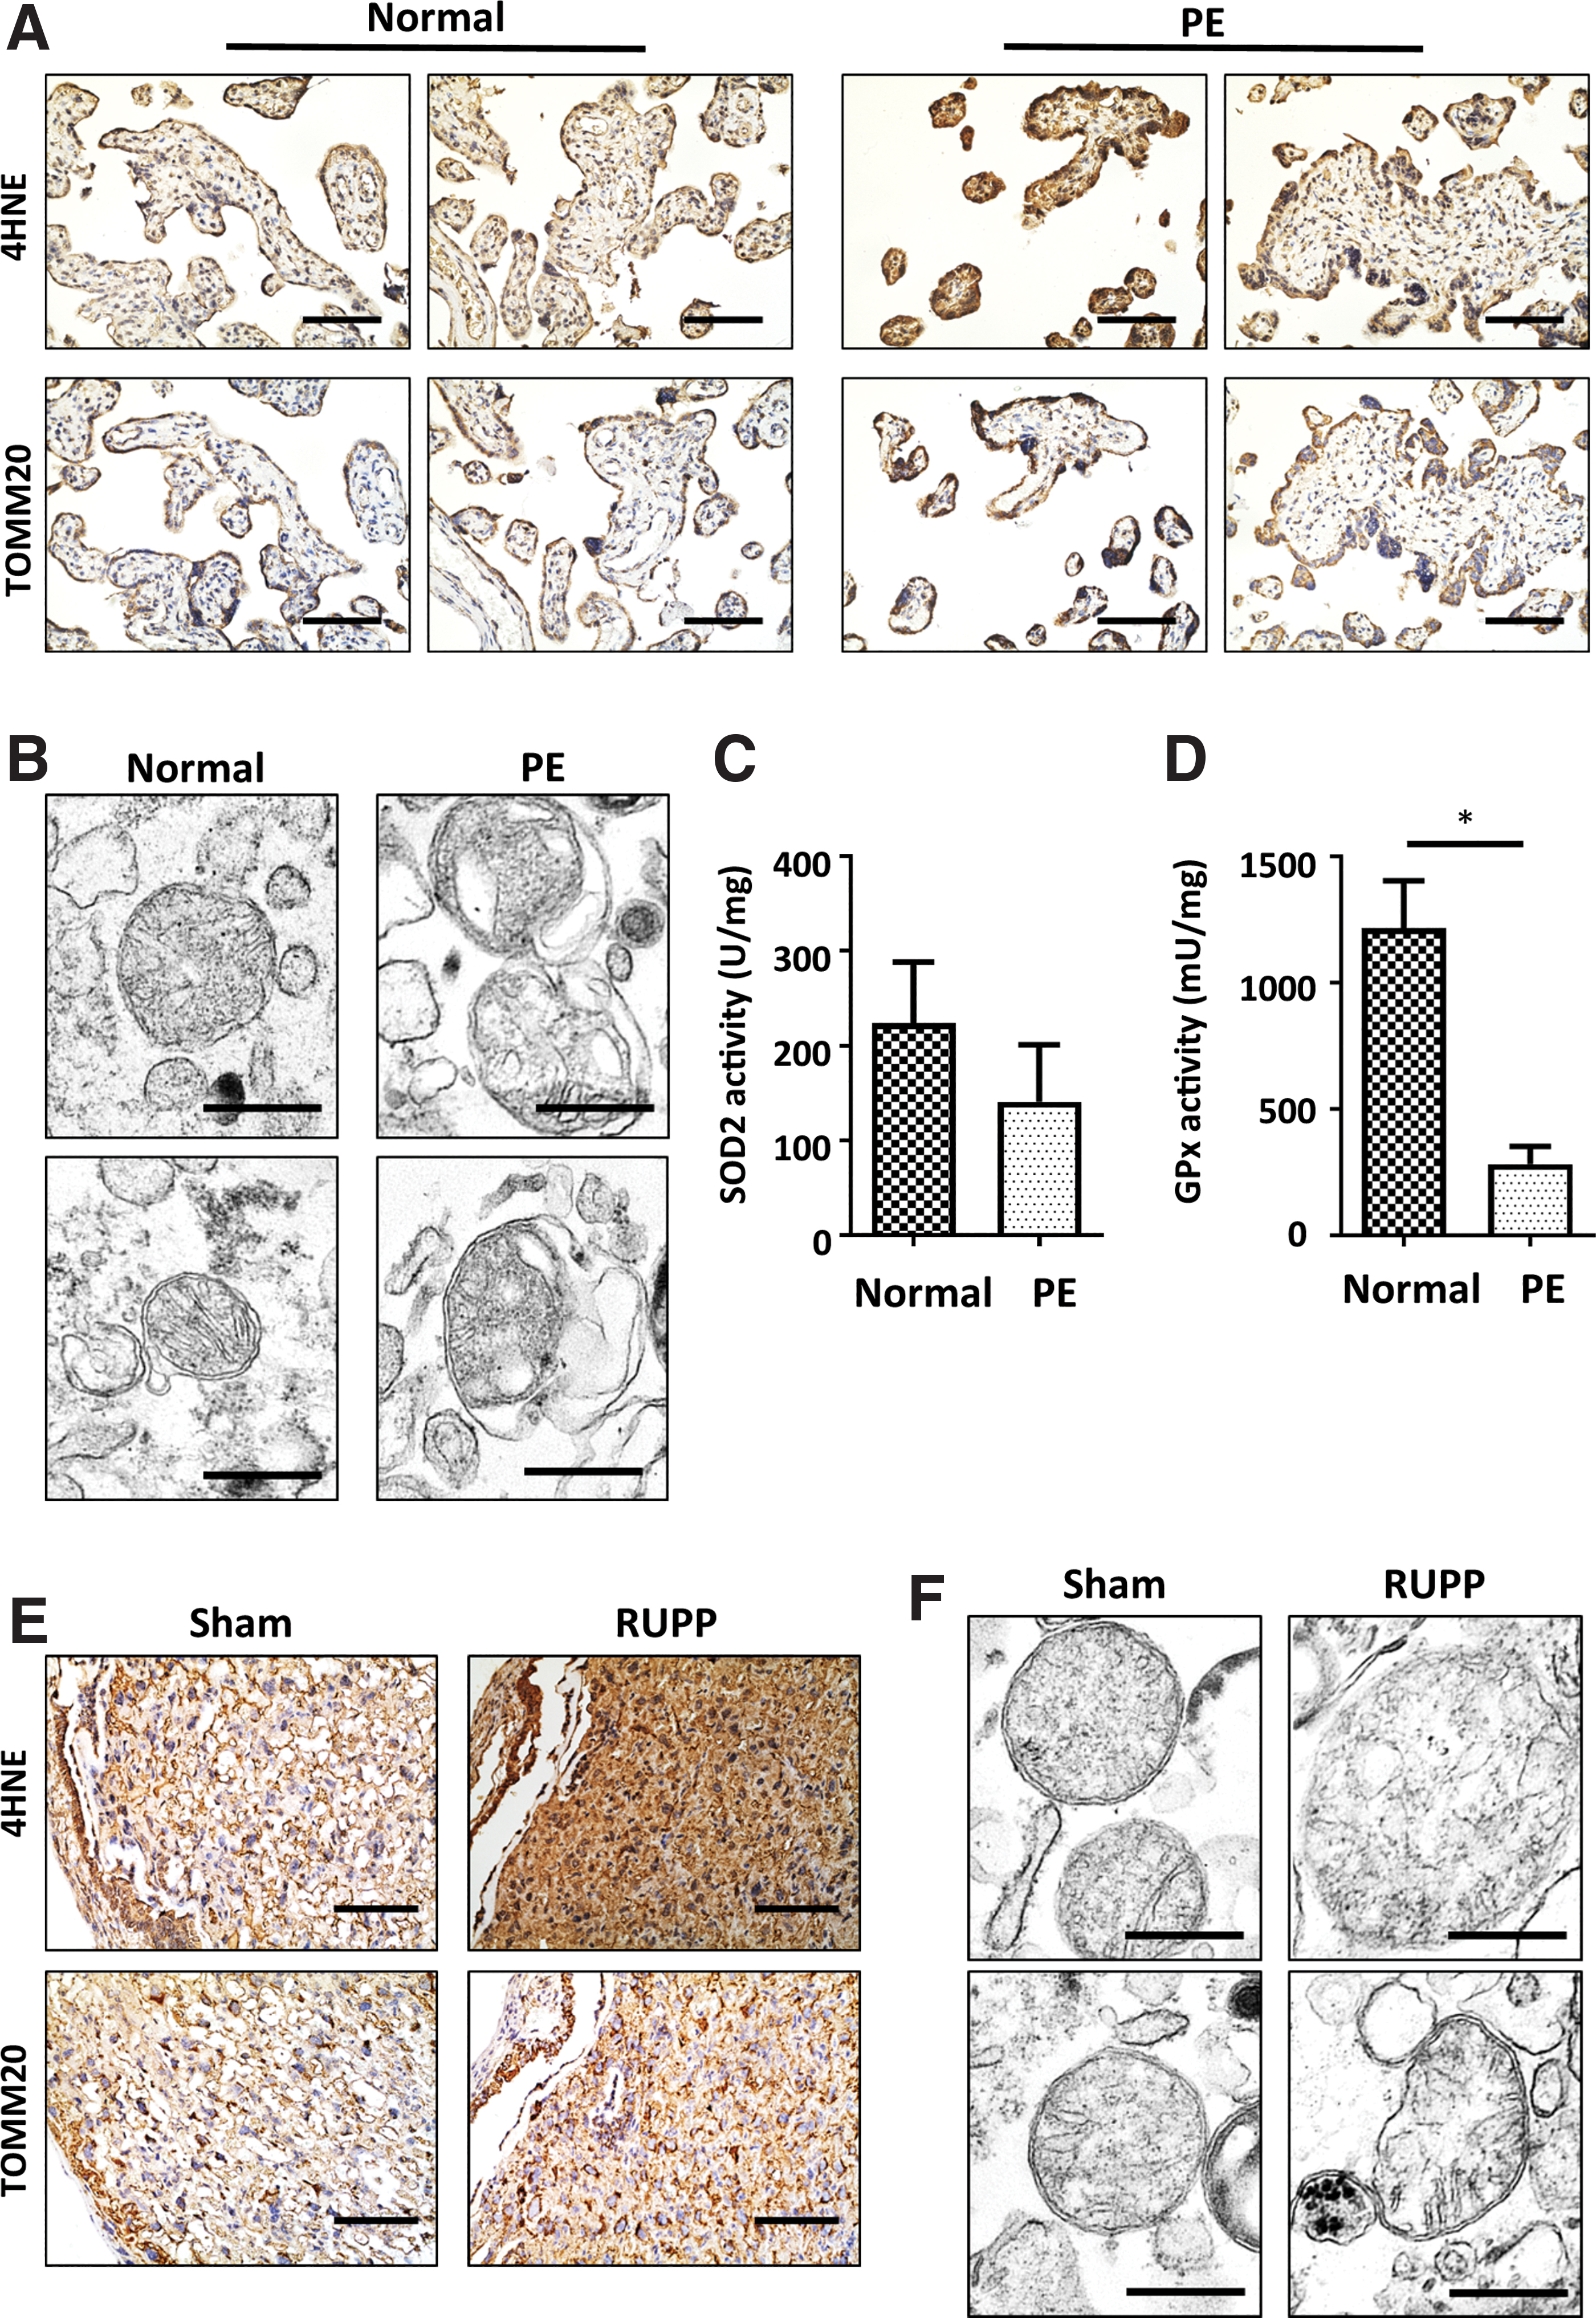
To validate the earlier findings, a mouse PE model was established by RUPP surgery. Elevated average systolic and diastolic blood pressure (BP) from gestational day (GD) 14.5 to 18.5 (108.43 ± 9.56/57.80 ± 6.09 mmHg, 96.62 ± 8.81/46.10 ± 3.66 mmHg, and 95.34 ± 2.85/44.95 ± 3.81 mmHg in the RUPP, Sham, and control groups, respectively) (Fig. 2A) and proteinuria were observed in PE mice (233.58 ± 35.89 mg/mL vs. 76.93 ± 26.73 mg/mL vs. 46.49 ± 25.26 mg/mL in the RUPP, Sham, and control groups, respectively) (Fig. 2B). Consistently, kidney damage was found in RUPP mice (Fig. 2C). Although placental weight did not differ among the groups (Fig. 2E), fetal birth weight was significantly decreased in the RUPP group compared with the Sham and control groups (1.28 ± 0.11 g vs. 1.40 ± 0.10 g and 1.46 ± 0.12 g) (Fig. 2D). In addition, litter size was much smaller in the RUPP group (4.8 ± 4.42, 12.67 ± 4.03, and 13.71 ± 2.19 in RUPP, Sham, and control groups, respectively), presumably resulting from the difference in miscarriage rates (Fig. 2F).

Consistent with the results of the human placental tissue, 4HNE was significantly increased in the labyrinth of the RUPP mouse placenta (Fig. 1E). Similarly, TOMM20 colocalized with 4HNE staining in both Sham and RUPP placentas. EM confirmed that the isolated mitochondria from the RUPP placenta swelled and ruptured compared with those from the Sham placenta (Fig. 1F). Taken together, these facts imply that mitochondrial dysfunction might be the major OS source in placentas from PE pregnancies.
Oral administration of MitoQ alleviates placental OS
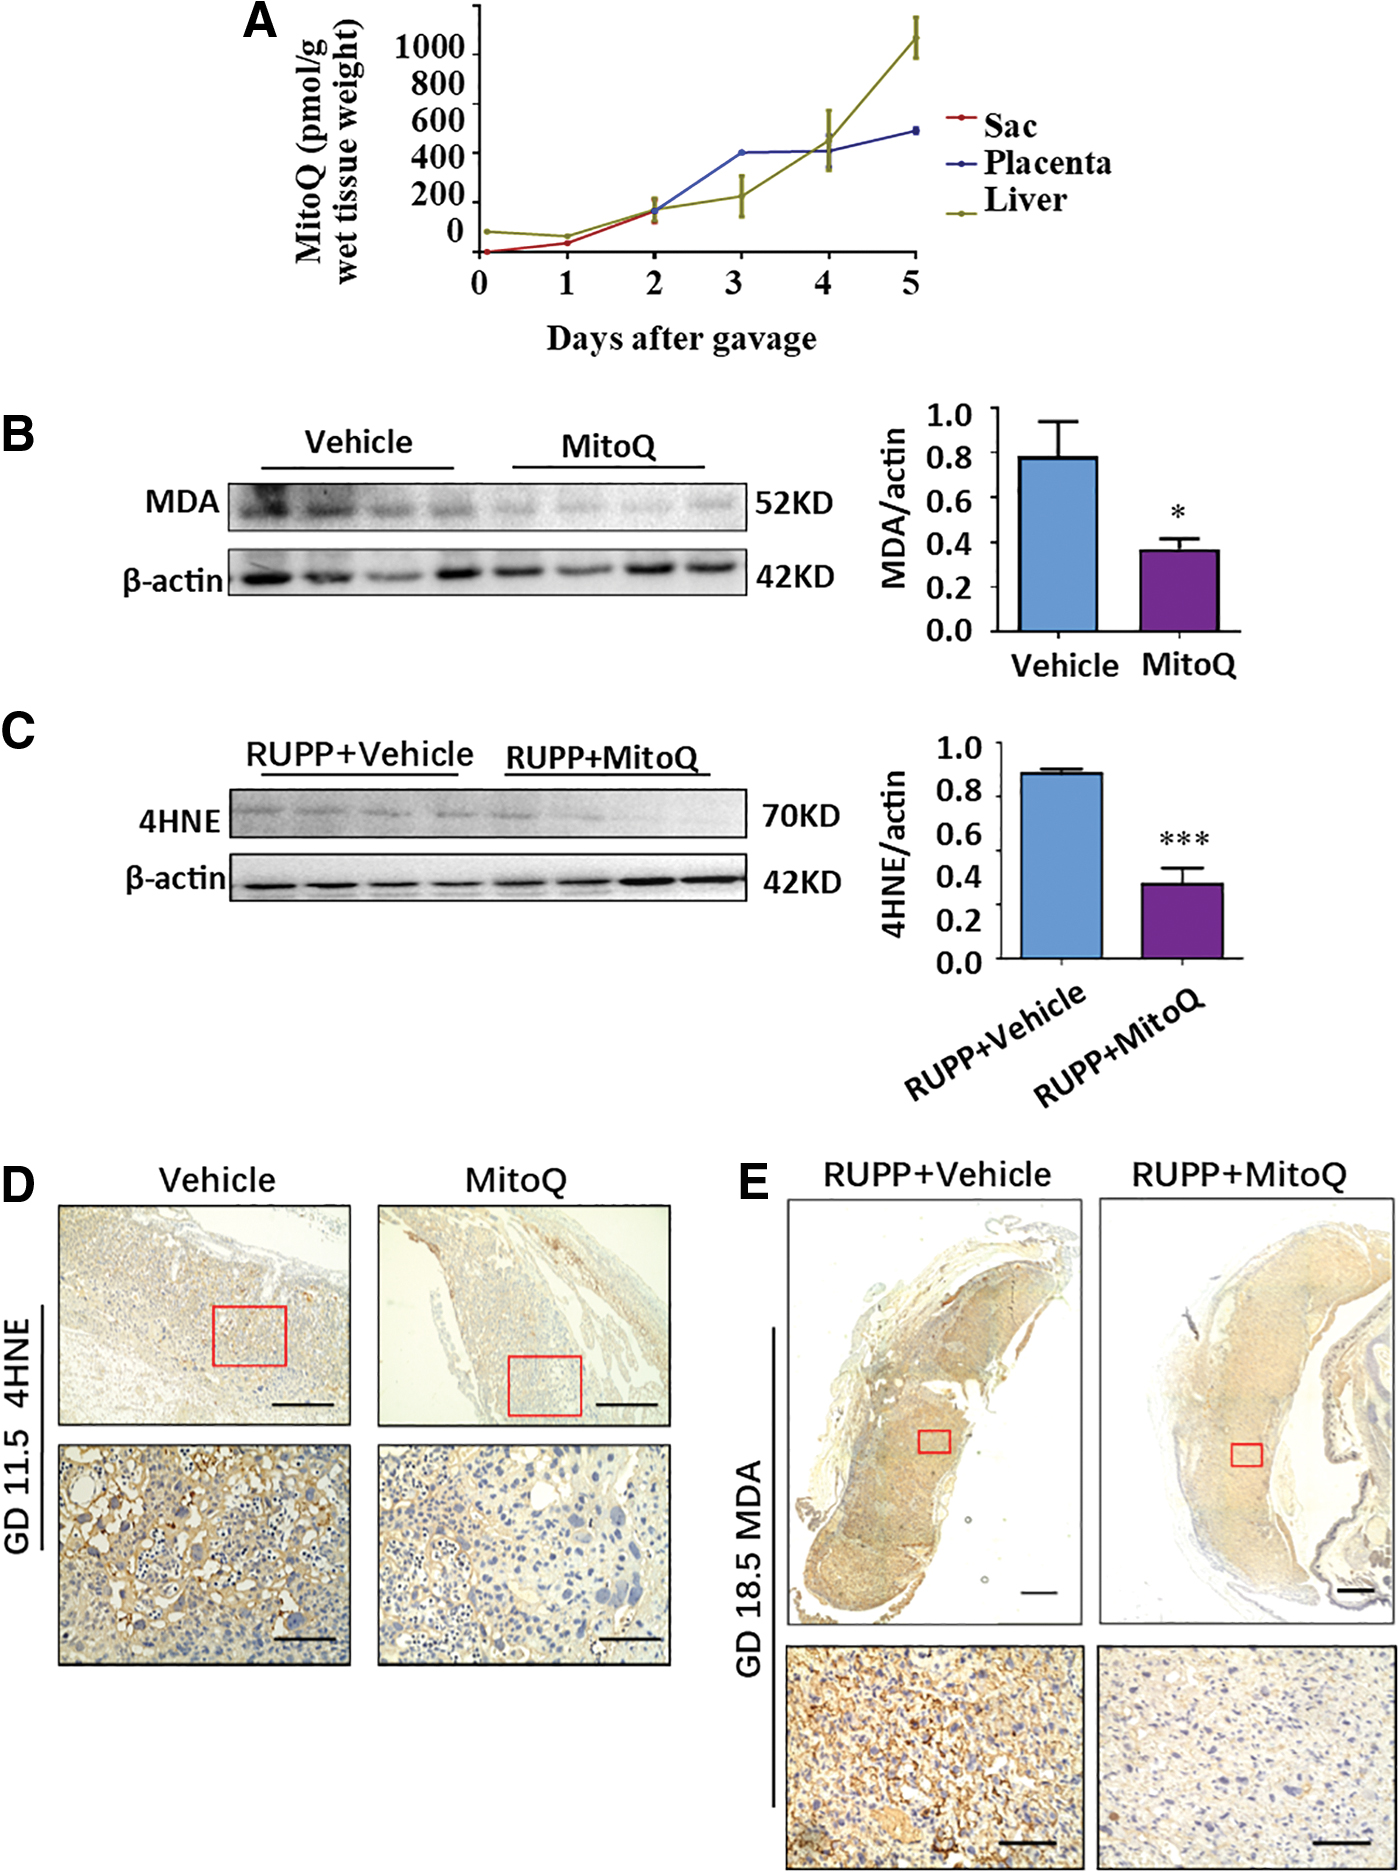
Although a previous study reported that MitoQ is distributed in the livers, hearts, and kidneys of nonpregnant mice via oral administration (17), it remains unknown whether orally delivered MitoQ is transported into the placenta in mice. Therefore, pregnant mice were orally administered MitoQ from GD 7.5 to 11.5; then, the sac, placenta, and liver were collected at 2 h, 1, 2, 3, 4, or 5 days after treatment for liquid chromatography-mass spectrometry (LC/MS) analysis. Compared with the initial concentration (at 2 h) in the sac (35.88 ± 7.13 pmol/g), the concentration of MitoQ after 5 days of administration increased 14-fold in the placenta (492.27 ± 15.29 pmol/g). The concentration of MitoQ after 5 days of treatment in the liver also increased over 13-fold (64.99 ± 10.02 pmol/g to 868.36 ± 82.80 pmol/g) compared with the 2-h data (Fig. 3A). Relative bioavailability was calculated as the ratio of the area under the curve for the placenta to the liver. Fplacenta was 85.7%, which indicated that MitoQ could be efficiently delivered to the placenta via oral administration. Moreover, placental malondialdehyde (MDA) or 4HNE was significantly reduced in the MitoQ group after gavage for 5 consecutive days in early or late gestation (Fig. 3B–E), implying that placental OS might be lowered by MitoQ.
The PE phenotype was relieved by MitoQ administration during late gestation but exacerbated if administered during early gestation in the RUPP-induced mouse PE model
MitoQ treatment during late gestation rescued RUPP-induced PE in rats (60). To determine whether MitoQ is beneficial for preventing PE development when administered before disease onset, MitoQ was given to pregnant mice during placentation, namely, GD 7.5–11.5 (22, 55, 61), or during late gestation, GD 13.5–17.5, as a control, and when RUPP or Sham surgery was performed on GD 13.5. MitoQ administration during early gestation elevated post-RUPP surgery BP (113.0 ± 5.32/59.33 ± 4.27 mmHg), with a peak systolic BP on GD 16.5 (124.43 ± 7.80 mmHg), compared with the vehicle group (110.24 ± 7.60/58.21 ± 7.89 mmHg), which had a peak systolic BP on GD 17.5 (112.97 ± 9.57 mmHg). Even in Sham mice, MitoQ administration increased BP (105.36 ± 5.82/51.76 ± 3.59 mmHg) compared with that in the vehicle group (98.80 ± 5.48/49.37 ± 3.16 mmHg). In contrast, MitoQ administered during late gestation significantly lowered systolic BP in the RUPP group (103.72 ± 7.59 mmHg vs. 108.18 ± 10.17 mmHg in the vehicle group), whereas it had no effect on BP in the Sham groups (Fig. 4A).

In line with these results, although MitoQ supplementation after RUPP significantly improved fetal birth weight (1.34 ± 0.10 g vs. 1.24 ± 0.10 g in the RUPP vehicle group), MitoQ pretreatment had a reduced trend (p = 0.0969) on fetal birth weight in the RUPP group compared with the vehicle control (1.19 ± 0.12 g vs. 1.25 ± 0.13 g). Meanwhile, early administration with MitoQ even led to lower fetal birth weight in the Sham group compared with the vehicle control (1.26 ± 0.11 g vs. 1.35 ± 0.13 g); whereas different timing of vehicle treatment did not result in differences in fetal birth weight in either the Sham group or the RUPP group (Fig. 4B).
In addition, although administration of MitoQ in late gestation did not affect the size of the placenta, MitoQ treatment in early gestation led to a smaller placenta in both the RUPP group (0.087 ± 0.010 g vs. 0.095 ± 0.014 g in RUPP vehicle) and Sham mice (0.090 ± 0.015 g vs. 0.100 ± 0.013 g in Sham vehicle) compared with that of mice treated with water (Fig. 4C).
Moreover, kidney periodic acid–Schiff (PAS) staining also showed that the glomerulus open capillary area in the early gestation MitoQ treatment group was reduced by nearly 2/3 compared with that in the RUPP vehicle group (4.29% ± 3.17% vs. 6.36% ± 2.76%) (Fig. 4D); whereas a similar reduction occurred in the Sham group (8.74% ± 4.52% in the MitoQ group vs. 15.26% ± 5.76% in the vehicle group). However, when MitoQ was administered after RUPP, the glomerular open capillary area increased (8.01% ± 4.56% vs. 5.14% ± 1.82% in the vehicle group), with no change in the Sham group. Accordantly, urine protein levels were significantly elevated in the RUPP group, but proteinuria was notably rescued by MitoQ administration during late gestation. In contrast, MitoQ administration before RUPP surgery resulted in a tendency toward further elevation of urine protein compared with RUPP alone (Supplementary Fig. S1).
Consistently, RUPP significantly increased the risk of miscarriage; oral gavage of water before or after RUPP surgery did not influence the chance of miscarriage in mice. Importantly, the miscarriage rate was increased by MitoQ treatment in early pregnancy compared with the vehicle group (69.92% ± 32.57% vs. 48.49% ± 35.65%) but decreased by MitoQ if given in later gestation (14.04% ± 19.42% vs. 45.05% ± 34.19% in vehicle group) (Fig. 4E).
Although RUPP reduced maternal body weight gain after surgery (Supplementary Fig. S2A), MitoQ administration in early gestation resulted in an earlier reduction of gestational body weight gain in both the RUPP and Sham groups (Supplementary Fig. S2B); however, this treatment did not impact maternal body weight when administered in late gestation (Supplementary Fig. S2C).
These findings imply that MitoQ treatment in early gestation may cause fetal loss and/or FGR before RUPP surgery, namely, GD 13.5, possibly by interfering with placentation. Thus, a certain level of ROS may be critical for normal placental development.
MitoQ administration in early gestation induced miscarriage and a PE-like phenotype in mice
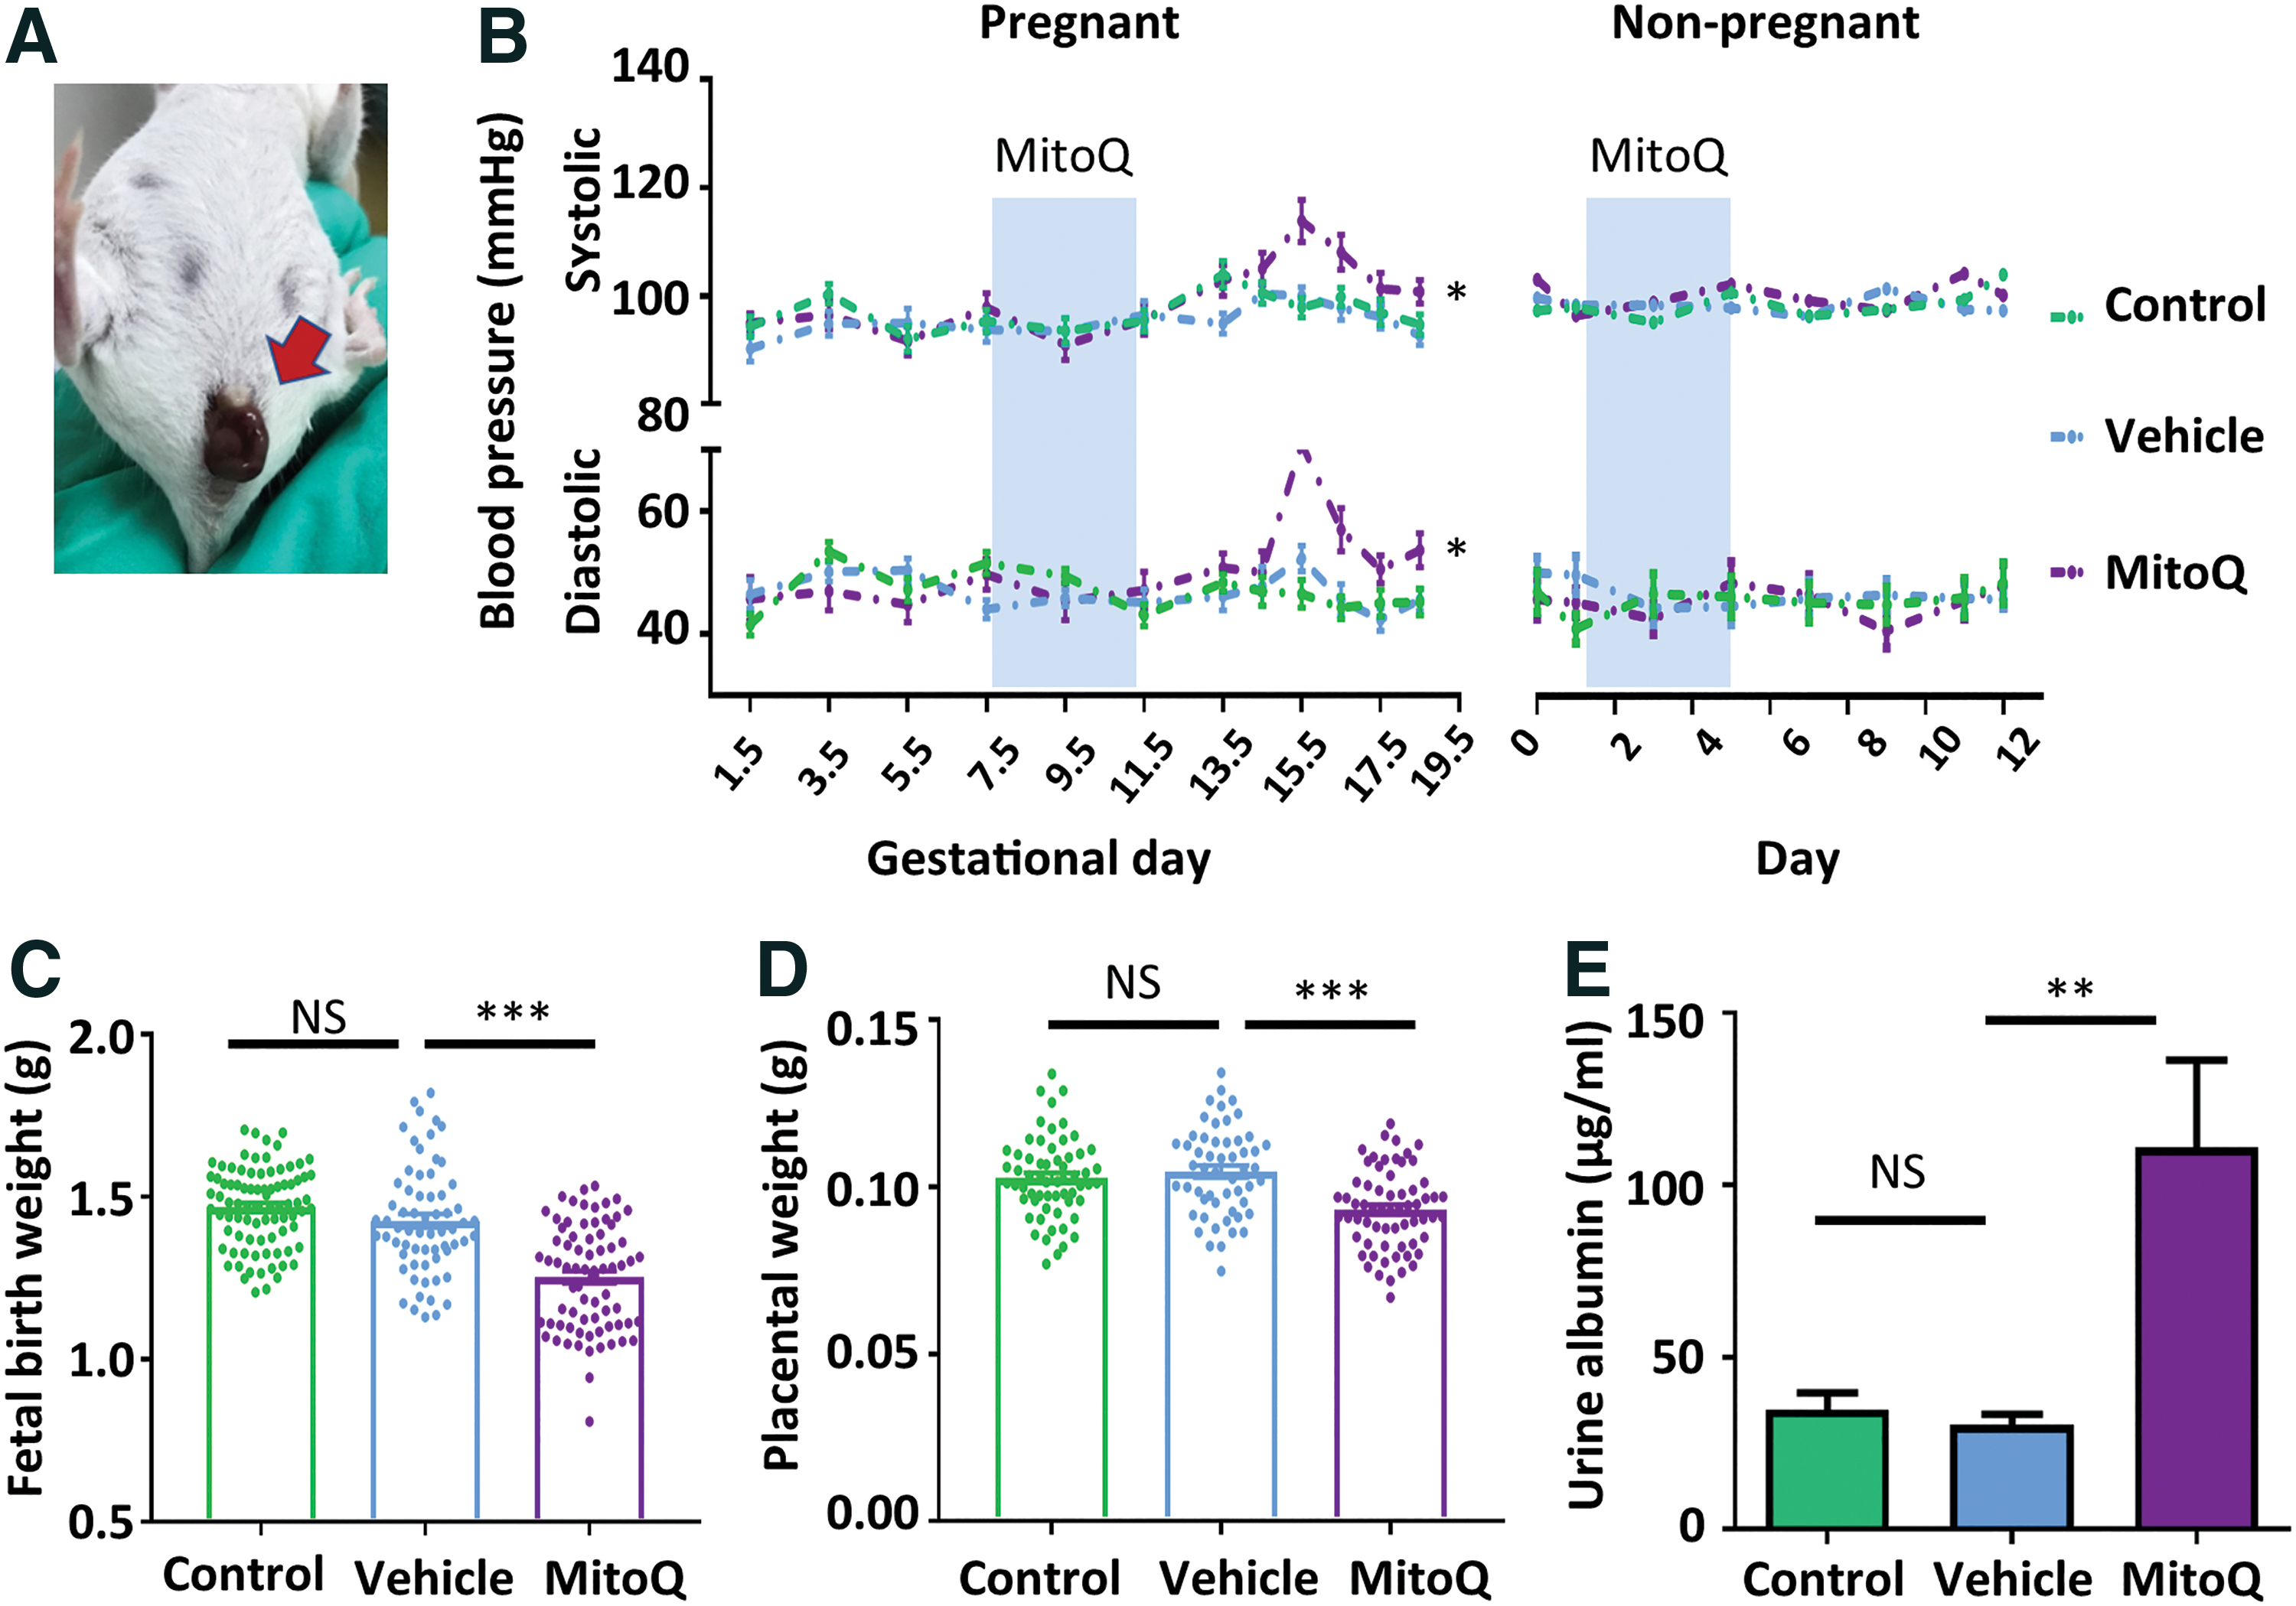
To further verify the involvement of ROS in placental development during early pregnancy and rule out the influence of RUPP surgery. MitoQ was given to pregnant mice during GD 7.5 to 11.5 or age-matched nonpregnant female controls via oral gavage. MitoQ-treated mice exhibited fetal loss at 2 days after administration (Fig. 5A). Further, MitoQ led to a significant elevation of systolic/diastolic BP (105.77 ± 8.62 mmHg/56.46 ± 8.71 mmHg vs. 97.36 ± 5.49 mmHg/46.70 ± 6.54 mmHg in the vehicle group) in pregnant mice but did not alter BP in nonpregnant mice (Fig. 5B). Similar to the findings from the RUPP model, fetal birth weight was significantly downregulated by MitoQ treatment (1.25 ± 0.16 g vs. 1.43 ± 0.17 g in vehicle group) (Fig. 5C); placental weight was also lower in the MitoQ treatment group (0.093 ± 0.012 g vs. 0.105 ± 0.013 g in vehicle group) (Fig. 5D). Consistently, the level of urine albumin was elevated in the presence of MitoQ (110.99 ± 35.88 μg/mL vs. 30.3 ± 5.53 μg/mL in the vehicle group) (Fig. 5E).
Consistently, MitoQ administration during placenta formation significantly reduced maternal bodyweight gain from GD 11.5 but did not affect maternal bodyweight gain in nonpregnant mice (Supplementary Fig. S2D, E).
Taken together, these data show that eliminating OS in early gestation by the potent mitochondria-targeting antioxidant MitoQ induced a PE-like phenotype in mice, which implies that deficient OS might be a causative factor for PE development.
MitoQ treatment in early gestation resulted in placental deregulation
To validate the regulatory effects of redox signaling on placental and fetal development during early gestation, placentas and fetuses were collected at different gestational ages from normal pregnant mice treated with MitoQ during early gestation. We found that placental and fetal growth were restricted from GD 13.5 to the end of gestation by MitoQ (Fig. 6A–C). Because the formation of the placental labyrinth is vital for placental function and intrauterine fetal growth in mice, we then evaluated the impact of MitoQ on labyrinth angiogenesis. As shown in Figure 6D, administration of MitoQ in early gestation significantly reduced the labyrinth/spongiotrophoblast ratio. Accordingly, the density of placental blood sinuses in the MitoQ group was significantly compromised (Fig. 6E).

Mitochondria-targeting antioxidants abolished low-dose H2O2-mediated improvements in proliferation, invasion, and migration in HTR8-S/Vneo cells
To ascertain the role of redox signaling in placentation, different dosages of H2O2 were applied to HTR8-S/Vneo trophoblast cells. We found that although H2O2 induces HTR8-S/Vneo cell death in a dose-dependent manner, intriguingly, low-dose H2O2 (1 μM) significantly increased the number of live cells (Supplementary Fig. S3A), indicating that low-dose H2O2 might improve trophoblast proliferation. Indeed, 5-ethynyl-2′-deoxyuridine (EdU) staining revealed that 1 μM H2O2 significantly stimulated DNA synthesis in HTR8-S/Vneo cells, and this improvement was inhibited by additional MitoQ or MitoTempo, a SOD mimetic (13, 34) (Fig. 7A). Consistently, 1 μM H2O2 treatment significantly augmented the number of trophoblasts (Fig. 7B), and this effect was also abolished in the presence of MitoQ or MitoTempo.

The motility of trophoblasts is critical for placental development. To assess the impact of mild OS on trophoblastic invasion and migration, HTR8-S/Vneo cells were subjected to Matrigel transwell assays and wound-healing assays. The results demonstrated that 1 μM H2O2 significantly improved the invasion and migration of trophoblasts; these effects were blocked by additional MitoQ or MitoTempo (Fig. 7C, D); whereas the dosages of MitoQ and MitoTempo efficiently reduced OS levels (Supplementary Fig. S3B, C). Meanwhile, this treatment did not interfere with the proliferation and mobility of HTR8-S/Vneo cells when added alone with MitoQ or MitoTempo (Supplementary Fig. S3D–F). Moreover, neither 1 μM H2O2 treatment alone nor in combination with MitoQ or MitoTempo influenced the phosphorylation of JNK and p38 in trophoblasts (Supplementary Fig. S3C), indicating that the regulatory effects of low OS on trophoblastic proliferation and invasion are independent of inflammation.
To further confirm these findings, HTR8-S/Vneo cells were treated with an OS inducer tetrahydroxyquinone (Tetra) (9) for 24 h. Cell invasion was significantly enhanced by a low dose (10 μM) but was suppressed by a high dose (100 μM), and similar effects were observed on cell migration (Supplementary Fig. S4A, B). In addition, HTR8-S/Vneo cells were subjected to various degrees of hypoxia for 24 h to induce different OS levels. Both invasion and migration were significantly improved by mild hypoxia (8% O2) but inhibited by severe hypoxia (1% O2) (Supplementary Fig. S4C, D).
Mild OS suppressed miR-29b-3p in trophoblasts
To elucidate the underlying molecular basis of the impact of mild OS on trophoblasts described earlier, HTR8-S/Vneo cells were given 1 μM H2O2 treatment (denoted as the H2O2 group) and co-treatment with 1 μM H2O2 and 0.1 μM MitoQ (denoted as Q group) and were then subjected to whole-genome RNA sequencing along with the control (normal [N] group). In comparison to the N group, low-dose H2O2 treatment resulted in changes in 6357 messenger RNAs (mRNAs), including upregulation of 3196 mRNAs and downregulation of 2944 mRNAs. In contrast, additional MitoQ in the low-dose H2O2 treatment resulted in the upregulation of 1541 mRNAs and the downregulation of 1263 mRNAs (Supplementary Fig. S5A); 1023 of these 2804 perturbations were also disturbed by low-dose H2O2 alone. Among them, 268 mRNAs were elevated by low-dose H2O2 treatment but suppressed by additional MitoQ, whereas 306 mRNAs were downregulated in the H2O2 group but upregulated in the MitoQ group (Supplementary Fig. S5B). Enriched Gene Ontology (GO) analysis of these changed genes demonstrated that genes involved in proliferation, cell growth, negative regulation of cell death, movement, cell migration, and angiogenesis were upregulated by mild OS but downregulated by additional MitoQ (Supplementary Fig. S5C). In contrast, genes involved in apoptosis and cell death were downregulated in the H2O2 group but upregulated in the MitoQ group (Supplementary Fig. S5D).
Expression of 0 microRNAs (miRNAs) and 466 circular RNAs (circRNAs) increased in HTR8-S/Vneo cells as H2O2 was given but declined when MitoQ was added. Conversely, 1 miRNA and 173 circRNAs were decreased in the H2O2 group but were rescued by additional MitoQ (Fig. 8A, B). Based on the competitive endogenous RNA (ceRNA) hypothesis (59), we found that miR-29b-3p, which is downregulated in the H2O2 group and upregulated in the MitoQ group, might play a pivotal role in a regulatory network that includes 59 circRNAs and 5 mRNAs (Fig. 8C). Consistently, RNA-seq results also showed that H2O2 enhanced the mRNA levels of five putative targeting genes, CYREN (cell cycle regulator of NHEJ), uveal autoantigen with coiled-coil domains and ankyrin repeats (UACA), glycerate kinase (GLYCTK), cofilin 1 (CFL1), and cortistatin (CORT), and this effect was further abolished in the presence of MitoQ (Fig. 8D).
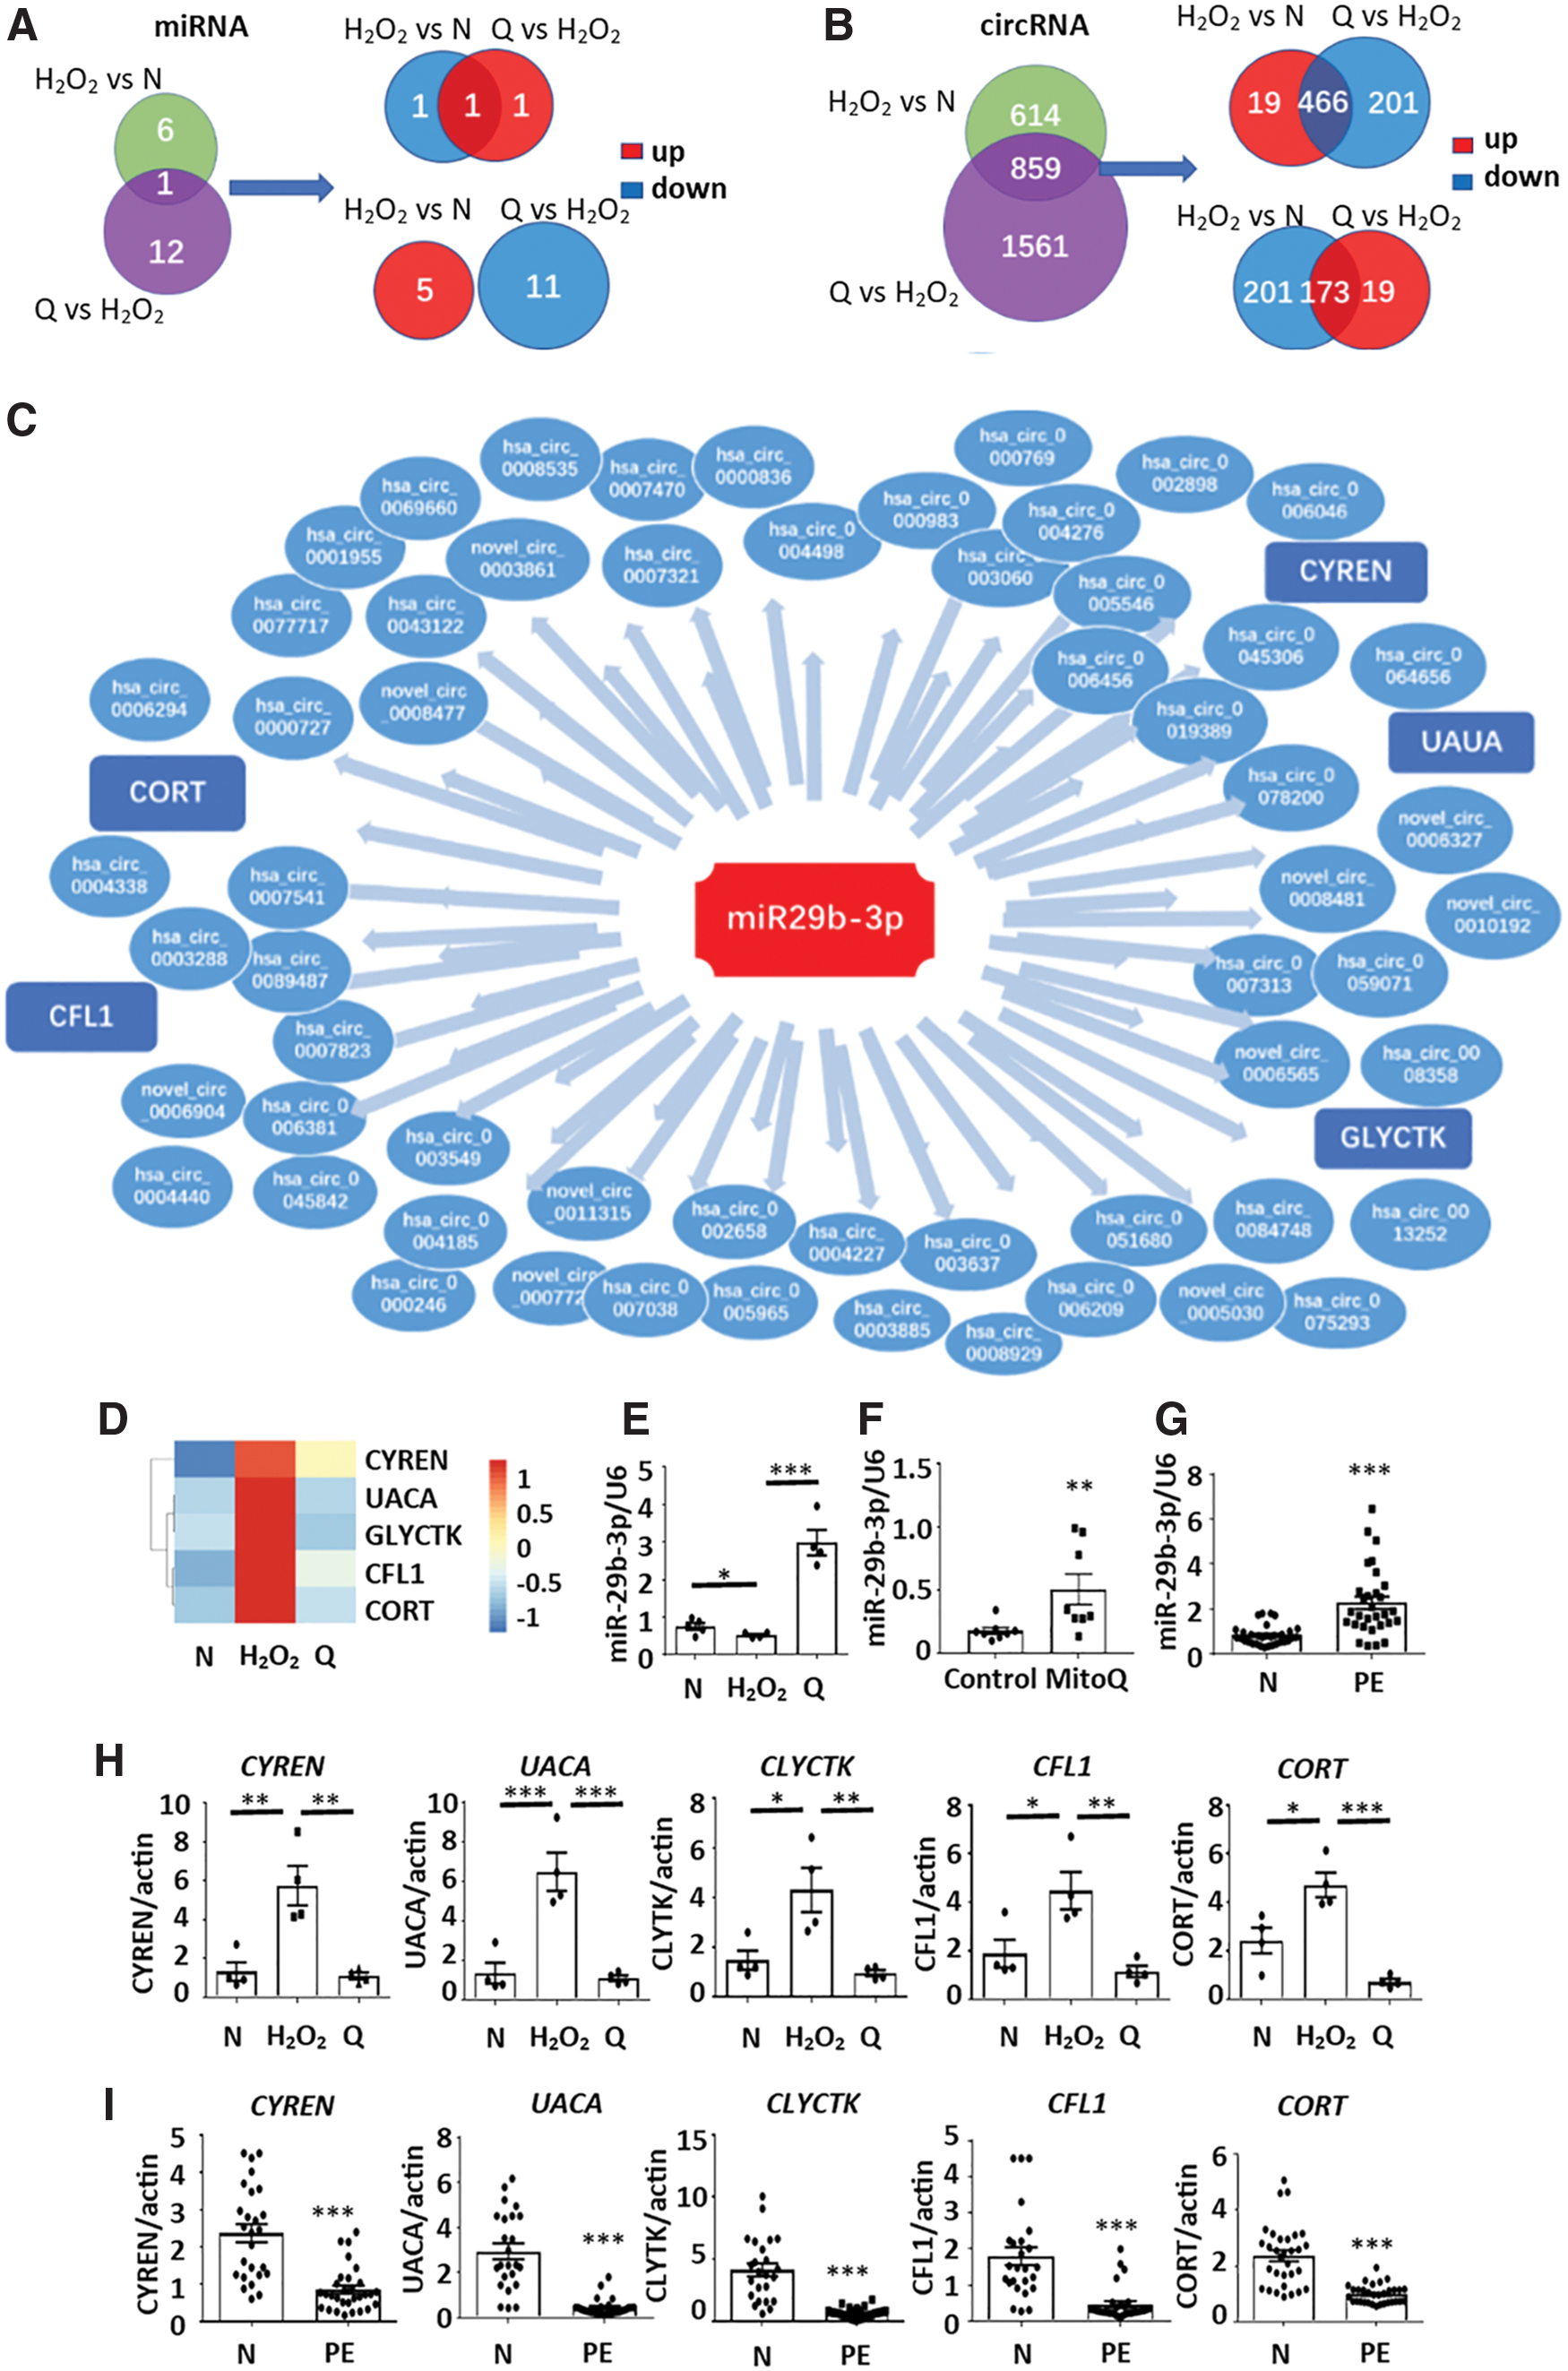
The expression levels of miR-29b-3p in HTR8-S/Vneo cells were further validated by quantitative real-time polymerase chain reaction (RT-qPCR) (Fig. 8E). Moreover, the expression level of miR-29b-3p in placenta from mice administered MitoQ in early gestation was significantly higher than that from control mice (Fig. 8F). Finally, upregulation of miR-29b-3p was also found in PE-complicated pregnancies compared with normal controls (Fig. 8G).
Accordingly, in contrast to the changes in miR-29b-3p, the mRNA expression levels of CYREN, UACA, GLYCTK, CFL1, and CORT were upregulated in the H2O2 group but downregulated in the MitoQ group (Fig. 8H); whereas expression levels were repressed in placentas from PE patients compared with normal pregnancies (Fig. 8I).
Discussion
The etiology of PE is multifactorial and has not yet been fully elucidated. Abundant evidence suggests that shallow implantation of trophoblast, abnormal uterine spiral artery remodeling and endothelial dysfunction should be the core factors for the pathogenesis of PE. The classic theory of the pathogenesis of PE is referred to as the two-stage process (46, 47, 49). In the two-stage model, a hypoxic and dysfunctional placenta is considered to release factors into the maternal circulation that cause the clinical features of this condition. The hypoxic placenta of PE suffers OS, a disequilibrium between antioxidant defenses and production of ROS in favor of the latter (47). In this study, we confirmed that OS was markedly elevated in the placentas from PE pregnancies and that lipid peroxidation was concentrated in mitochondria (20, 38, 60). Therefore, we speculated that inhibition of mitochondrial damage by alleviation of OS might be beneficial for PE. The potent mitochondria-targeting antioxidant, MitoQ, was chosen for the subsequent experiments. Our results demonstrated that MitoQ effectively reduced lipid peroxidation in the placenta. However, although MitoQ treatment during late gestation alleviated RUPP-induced hypertension, MitoQ administration during early gestation exacerbated, rather than protected, severe kidney damage, FGR, and miscarriage in RUPP mice. These results are in accordance with previous clinical trials in human pregnancy (35, 44, 50, 51) and indicate that the timing of administration, rather than the potency of the therapy, may be key to the effects of antioxidants in the prevention/management of PE.
The RUPP model of PE, in which placental blood flow is mechanically restricted, has been extensively studied and well characterized in regard to maternal responses. Traditional RUPP surgery on rats is an efficient animal model to simulate PE but has a notable drawback of inconvenient BP testing (2, 30). In this study, we established the RUPP mouse model by partially clamped uterine vessels only rather than both uterine vessels and the abdominal artery, allowing us to perform noninvasive BP measurement by tail-cuff to obtain continuous and reliable BP data (16, 39). However, as with many other PE animal models, the modified RUPP model does not represent a perfect model of early-onset PE since it cannot mimic the compromised placentation. Therefore, the data obtained from the RUPP model can only reveal that antioxidant treatment during placentation potentiates RUPP-induced PE signs. In other words, in our study, RUPP is used as “a second hit” to assess the impact of MitoQ treatment on placental development.
Nevertheless, our investigation on non-RUPP mice further demonstrated that redox homeostasis may play a critical role in physiological events during early gestation. To be more specific, we then provided evidence that MitoQ during early gestation reduced the area of the labyrinth and blood sinuses in the mouse placenta, which might be responsible for the consequent PE phenotype, suggesting that diminishing OS by antioxidants in early gestation disrupts placental development. Nezu et al. (41) reported a similar result. In a mouse model of RAS-induced PE, Nrf2 deficiency would be expected to impair cellular antioxidant responses and lead to adverse outcomes; however, it increased endothelial cell proliferation and improved maternal and fetal survival. In contrast, the placentas of PE-phenotype mice with overactive Nrf2 showed repressed angiogenesis. Taken together, these results indicate that redox signaling is essential for the development of mouse placenta.
Excessive ROS can irreversibly destroy cellular structures, whereas more recently, studies have shown that low concentrations of ROS act as second messengers and are protective for multiple cellular functions, such as improving invasion and migration (3, 36), regulating cell cycle (10, 52), activating autophagy to maintain homeostasis (53), and triggering defense mechanisms that prevent cellular damage (66). In our study, we demonstrated that mild OS, induced by low-dose H2O2 or Tetra, and mild hypoxia, improved proliferation, invasion, and migration in HTR8-S/Vneo cells; whereas antioxidants blunted these effects. High-dose H2O2 (≥25 μM) has been reported to induce OS and consequent cell death in trophoblast cell lines (11, 12, 31), which was confirmed by this study. We are the first to report that low-dose H2O2 (1 μM) exerts the opposite effects on trophoblast proliferation and invasion. Our findings suggest that mild OS is essential for the function of trophoblast cells. ROS have long been deemed a damaging factor produced by dysfunctional mitochondria, though this generalization is clearly not the case. In fact, as the major source of ROS, mitochondria play critical roles in major evolutionary events in animals and plants, including adaptive responses (14, 29, 45). This study suggested that mitochondria are involved in regulating placentation through modulating redox.
Although proinflammatory cytokines can be released by trophoblast cells due to OS33 and play a progressive role in the pathogenesis of PE, inflammatory signaling molecules, including JNK and p38, were not activated in HTR8-S/Vneo cells by low-dose H2O2 alone or in combination with antioxidants, implying that the low-dose H2O2 does not stimulate inflammatory pathways, but rather modulates the transcription of downstream genes in trophoblast cells. To determine the regulation of gene expression by mild OS in trophoblasts, HTR8-S/Vneo cells that had been treated with 1 μM H2O2 alone or combined with MitoQ were subjected to RNA-seq. The results showed a ceRNA regulatory network (19, 28, 59), in which miR-29b-3p was centrally associated with 59 circRNAs and 5 mRNAs: CYREN, UACA, GLYCTK, CFL1, and CORT. Supporting these findings, a previous study showed that miR-29b inhibits the proliferation and invasion of trophoblast cells (32). We then confirmed the abnormal upregulation of miR-29b-3p in both the mouse placenta with MitoQ treatment in early gestation and human PE placenta. Although we provided evidence that the mRNA levels of five predicted miR-29b-3p downstream genes are consistently changed in both human placenta and HTR8-S/Vneo cells, our data did not rule out the involvement of other genes and regulatory networks in trophoblasts in response to OS stimuli.
Since current clinical guidelines do not provide a clear opinion regarding the use of antioxidants for PE prevention (1), our findings that early administration of antioxidants led to placenta dysfunction in mice, with previous clinical study data on the failure of vitamin C and vitamin E in preventing PE, may draw attention from clinicians, who should reconsider the prescribing practices of antioxidants for normal pregnant women during the first and second trimesters. On the other hand, the effectiveness of MitoQ administered in late gestation for relieving RUPP-induced PE manifestations in our study suggests that it could be a promising treatment for PE and may also be valuable for the intervention of FGR, which is consistent with Vaka's study (60). The varying BP-lowering effects of MitoQ among different studies might be caused by differences in species and dosages.
In summary, redox homeostasis is vital for a successful pregnancy. Excessive OS lead to a series of cellular damages, with manifestations such as miscarriage, PE, and FGR; whereas appropriate OS is essential for maintaining trophoblastic functions. Therefore, interrupting the redox homeostasis might provide a potential explanation as to why antioxidants have failed in preventing PE in clinical practices, which could draw further attention from clinicians and mothers to be more careful in using antioxidants in early gestation.
Materials and Methods
Human placenta sampling
Women with PE (n = 36) and age-matched women with normotensive pregnancies who were admitted to the Department of Obstetrics at The First Affiliated Hospital of Chongqing Medical University for elective caesarian delivery (n = 35) were randomly recruited into this study. The diagnosis of PE was based on the guidelines of the American College of Obstetrics and Gynecology (ACOG). Exclusion criteria included infection, gestational diabetes mellitus, chronic hypertension, immune diseases, and other gestational complications and chronic health conditions. Non-infective premature deliveries were included to match the gestational age of PE. The clinical characteristics of the study populations are shown in Table 1.
Clinical Characteristics of the Study Population
BP, blood pressure; PE, preeclampsia.
Placental specimens were collected immediately after delivery, washed with cold 0.9% sterile normal saline, quick-frozen in liquid nitrogen, and stored at −80°C for further use or immersed in 4% formaldehyde.
This work was approved by the Ethics Committee of The First Affiliated Hospital of Chongqing Medical University (No. 2018-113), and all procedures were performed in accordance with the principles stated in the Declaration of Helsinki. Informed consent was obtained from all participants.
Mouse model of PE induced by RUPP
An RUPP-induced PE mouse model was established according to a previously described method with modification (16). Briefly, on GD 13.5, pregnant Institute of Cancer Research (ICR) mice (Huafukang Bioscience Co., Inc., Beijing, China) were anesthetized with isoflurane by using an animal anesthesia apparatus (No. Table Top 723012; Surjivet) and a coupled rodent ventilator (INSPIRA ASV; Harvard Apparatus). Body temperature was maintained at 37°C with a heating pad. A 1-cm incision was made on the abdomen and extended to include the skin and the peritoneum, as close as possible to the linea alba. Next, four silver clips (80 μm) were placed around the arterial and venous branches of the vascular arcade of both the ovarian and uterine vessels (16, 30). The peritoneum and skin were sutured with a 7–0 nylon suture (Lingqiao, Ningbo, China). No clips were used in the Sham group. The number of embryos was counted intraoperatively.
All animal procedures were conducted in accordance with the Guidelines of Chongqing Medical University and approved by the Ethics Committee of the First Affiliated Hospital of Chongqing Medical University.
Procedures used in the mouse studies
Gavage
MitoQ was purchased from Antipodean Pharmaceuticals, Inc.; dissolved in sterile water; and administered to RUPP, Sham, and control mice by oral gavage at 100 μmol/kg/day, during either early gestation (GD 7.5–11.5) or late gestation (GD 13.5–17.5). The same volume of water was given as a vehicle control to a “vehicle” group. The “blank” group included mice that were not gavaged.
Measurement of BP
BP was measured by tail-cuff plethysmography (Visitech Systems) every 2 days from GD 1.5–13.5 and every day from GD 14.5–18.5. The mice were conscious and maintained in restrainers, with 10–20 actual measurements obtained after normalization.
Measurement of urinary albumin
Spot urine was collected when sacrificed at GD 18.5 and centrifuged at 4000 g for 10 min. The supernatant was removed and stored at −80°C. Urinary albumin was measured with a Mouse Albumin enzyme-linked immunosorbent assay (ELISA) Quantitation kit (No. EMA3201-1; Assaypro), whereas total urine protein levels were measured by using a BCA protein concentration test kit (Beyotime Biotechnology, Shanghai, China), both according to the manufacturer's protocols. Samples were diluted 1:1000 with distilled water for the ELISA samples or 1:10 for the BCA samples, and absorbances were read on a microplate reader (Thermo Fisher).
Morphological assays of renal tissue
The kidneys were fixed in paraformaldehyde, embedded in paraffin, cut into sections with a 3-μm thickness, and treated with PAS staining. Glomerular open capillary areas were measured as a percentage of the glomerular tuft area. A total of 10–15 randomly selected glomeruli from each mouse were analyzed with ImageJ 1.50i software.
Cell culture
The immortalized HTR8-S/Vneo trophoblast cell line was purchased from American Type Culture Collection (Manassas, VA) and cultured in serum-free cell freezing medium Roswell Park Memorial Institute 1640 (RPMI 1640) with
Placental mitochondria isolation
Mitochondria from human and mouse placentas were isolated by using the differential centrifugation method (37, 56, 62). In brief, tissues were rinsed with homogenization buffer [HB, 250 mM sucrose, 10 mM Tris pH 7.5, 1 mM ethylenediaminetetraacetic acid (EDTA), 1 mM ethylenebis(oxyethylenenitrilo)tetraacetic acid (EGTA)] and homogenized with a Dounce homogenizer on ice. Next, the homogenate was centrifuged at 800 g for 15 min at 4°C. The pellet was resuspended in HB and then centrifuged under the same settings. The supernatant was centrifuged at 12,000 g for 15 min at 4°C. The collected pellet was resuspended in HB and centrifuged under the same settings. The last supernatant was collected to maximize mitochondrial isolation. The final pellet was resuspended in mitochondrial storage buffer (Beyotime Biotechnology) and separated into three samples. One sample was centrifuged at 12,000 g for 15 min at 4°C and dipped in 2.5% glutaraldehyde solution in preparation for transmission electron microscopy. Another sample was immediately used for Western blotting. Finally, a small fraction of the mitochondrial sample was flash frozen and stored at −80°C for the enzyme activity assays.
Transmission electron microscopy
Isolated mitochondria were fixed in a 2.5% glutaraldehyde solution, post-fixed in 1% osmic acid at 35°C for 60 min, dehydrated in a gradient of ethyl alcohol (50%–100%) and epoxypropane, embedded in Epon, and cured at 40°C overnight, followed by a 24-h incubation at 60°C. Ultrathin sections (50–70 nm) were placed onto 200 mesh copper grids and stained with uranyl acetate and lead citrate before transmission electron microscopy (JEOL JEM-1400PLUS).
Enzyme activity assay of SOD2 and GPx
The enzyme activity of SOD and GPx was assessed by using a CuZn/SOD2 assay kit and a Total Glutathione Peroxidase Assay Kit (Beyotime Biotechnology) according to the manufacturer's protocol. In brief, assessment of SOD2 activity was performed on isolated mitochondria that were resuspended in storage buffer. Protein concentration was measured by using a Bradford protein quantification kit (Beyotime Biotechnology). Then, Cu/Zn-SOD inhibition solution was added to stop SOD1 activity and specifically test SOD2 activity. After incubation for 30 min in WST-8 (a water-soluble tetrazolium dye) work buffer at 37°C, the samples were measured with a microplate reader (Thermo Fisher) at 450 nm. GPx activity was assayed by quantifying the rate of oxidation of reduced glutathione to oxidized glutathione by H2O2 catalyzed by GPx. The mitochondria were prepared as previously mentioned but incubated at 25°C, and then the absorbance at 340 nm was measured by using a microplate reader. Total GPx enzyme activity was calculated according to the manufacturer's instructions and normalized by protein concentration.
Immunohistochemical assay of human and mouse placental tissues
Paraformaldehyde-fixed placental tissue from the maternal side of the human placenta and mouse placenta were embedded in paraffin and sectioned to 3 μm in thickness. Slides were treated with EDTA buffer (pH 9.0) for antigen retrieval and incubated with 3% H2O2 for 5 min to neutralize endogenous peroxidases. Primary antibodies against 4HNE (1:200, No. ab6545; Abcam, UK), TOMM20 (1:200, No. ab186734; Abcam, USA), or isolectin B4 (ILB4; 1:50, No. L2140; Sigma) were used. Signals were developed by using diaminobenzidine (DAB staining; ZSGB-BIO).
Western blotting
The mouse placentas or HTR8-S/Vneo cells were homogenized with RIPA buffer (Beyotime Biotechnology) containing phenylmethylsulfonyl fluoride (PMSF; 1:100, Beyotime Biotechnology) on ice and centrifuged at 12,000 g for 15 min. The protein concentration of the supernatant was normalized and added to Laemmli Sample Buffer (LDS, No. 1610747; Bio-Rad) and dithiothreitol (DTT); then, it was subjected to 10% discontinuous SDS-PAGE and transferred to polyvinylidene difluoride membranes (Merck Millipore). Membranes were blocked for 1 h with 5% nonfat dried milk in Tris-buffered saline (TBS) containing 0.05% Tween-20 (TBST) and then probed with rabbit polyclonal antibodies against 4HNE (1:200, No. ab6545; Abcam, UK), MDA (No. CAU27565; Biomatik), JNK (No. A18287; ABclonal), p-JNK (No. AP0473; ABclonal), p38 (No. sc-7972; Santa Cruz Biotechnology), p-p38 (No. sc-166182; Santa Cruz Biotechnology), or mouse monoclonal antibodies specific for β-actin (1:5000, No. 3700; Cell Signaling Technology) or GAPDH (1:5000, No. ab8245; Abcam, UK) overnight at 4°C. Membranes were then incubated with horseradish peroxidase-conjugated goat anti-mouse IgG or goat anti-rabbit IgG for 1 h at room temperature. Band densitometry was performed by using the Quantity One System image analyzer (Bio-Rad).
LC/MS analysis
Sac, placenta, and liver samples from mice were weighed (100 mg wet weight) and homogenized in 0.5 mL of 50 mM Tris (pH 7.0). MitoQ was extracted from samples into 2 × 1.5 mL of 95% acetonitrile with 0.1% formic acid. The pooled organic phases were dried under vacuum (Thermo Fisher) and resuspended in 200 μL of 60% acetonitrile with 0.1% formic acid. Aliquots of ∼150 μL were transferred to glass autosampler vials for LC/MS analysis. MitoQ standards within the range of 0–100 pM were added into blank tissue and prepared in parallel to make standard samples.
The LC/MS system consisted of a Waters Xevo G2-S QTOF mass spectrometer and a binary I-Class pump. Liquid chromatography was performed at 30°C by using an ACQUITY UPLC BEH C18 column, 130 Å (1.7 μm, 2.1 × 50 mm), with a VanGuard C18 column (2.1 × 5 mm; both from Waters). The mobile phase consisted of 0.1% formic acid in water (A) and acetonitrile (B), delivered in a linear gradient as follows: 0–3 min, 50% B; 3–5 min, 50–90% B; 5–8 min, 90% B; 8–8.5 min, 90%–50% B; and 8.5–11 min, 50% B. The flow rate was 0.2 mL/min, and 5 μL of sample extract was injected. An in-line valve was used to divert the eluent away from the mass spectrometer between min 0–4 and 7–11 of the acquisition time. For mass spectrometry, electrospray ionization in positive ion sensitivity mode was employed. MS1 without fragmentation but enhanced at m/z 583.3 was used to evaluate MitoQ10. The instrument parameters were as follows: source spray voltage at 3 kV, ion source temperature at 120°C, and cone voltage at 40 V. Nitrogen was used as the cone gas at 50 L/h and as desolation gas at 600 L/h. Data were analyzed with MassLynx software.
Cell counting kit-8 assay
HTR8-S/Vneo cells were seeded onto 96-well plates at 5000 cells/well and treated with each of the compounds (DMSO, MitoQ, MitoTempo, and H2O2) after adhesion. The supernatant was discarded after treatment for 24 h. Next, base medium with 10% cell counting kit-8 (CCK8) assay buffer (Dojindo) was added to the plates at 100 μL/well for a 2-h incubation and then measured with a microplate reader (Thermo Fisher) at 450 nm.
EdU staining
EdU was tested by using the BeyoClick™ EdU Cell Proliferation Kit (Beyotime Biotechnology). Specifically, HTR8-S/Vneo cells were seeded onto 96-well plates (8000 cells/well) and treated with the compounds after adhesion. Then, 20 μM EdU was added to the culture medium after treatment for 20 h and incubated for another 4 h. Next, the supernatant was discarded; the cells were washed twice with phosphate-buffered saline (PBS) and then fixed with 4% paraformaldehyde for 30 min. After rewashing with 3% bovine serum albumin (BSA) and permeation with 0.3% Triton X-100 PBS, the cells were incubated in Click Additive Solution for 30 min in the dark. Hoechst staining was used to identify cell nuclei. Images were taken with fluorescence microscopy, and cell counts were calculated by using ImageJ 1.50i software.
Cell viability assay
HTR8-S/Vneo cells were seeded onto 24-well plates (10,000 cells/well) and treated with the compounds after adhesion. Two fluorescent probes (Live/Death cell imaging kit; 1 drop/500 μL medium; Invitrogen) were used in each well and incubated for 15 min before photography under fluorescence microscopy. Five fields of view were imaged for each group. The counts of total and dead cells were calculated by using ImageJ 1.50i software.
Matrigel transwell invasion assay
HTR8-S/Vneo cells were resuspended in the compounds dissolved in RPMI 1640 medium without FBS (50,000 cells/well) and seeded into the upper compartment of the invasion chamber (8 μm; BD Falcon), coated with previously diluted Matrigel (BD Biosciences). After incubation for 24 h, the upper chambers were fixed with 4% paraformaldehyde, washed with PBS, and stained with crystal violet boric acid. Nonmigrating cells in the top compartment were completely removed with a sterile cotton swab. The cleaned upper chambers were photographed under microscopy. Stained cells were counted per 20 × field of view. Each experiment was performed in triplicate.
Cell migration assay
HTR8-S/Vneo cells were seeded onto 12-well plates and grown to more than 90% confluence before treatment with the compounds. A 200 μL pipette tip was used to scratch a cross shape, and pictures were taken at 0 and 24 h. The area of wound healing was measured with ImageJ software. Each experiment was performed in triplicate.
Measurement of ROS
Intracellular ROS levels were assessed with a 2,7-dichlorodihydrofluorescein diacetate (DCFH-DA) probe (Beyotime Biotechnology) as previously described (64). Briefly, cells were seeded onto 96-well microplates (5000 cells/well) and incubated with the compounds for 24 h. The cells were then incubated with a DCFH-DA probe (1:1000) in RPMI 1640 for 20 min and washed twice with PBS. Fluorescence intensity was measured with a fluorescence microplate reader (Thermo Fisher). In addition, CCK8 was tested to normalize cell counts.
RNA sequencing
HTR8-S/Vneo cells were grown to 60%–70% confluency and then exposed to 1 μM H2O2 (H2O2) in the absence or presence of 0.1 μM MitoQ (Q) in RPMI 1640 with 10% FBS for 24 h. Total RNA was extracted by using TRIzol (No. 15596026; Invitrogen), and the concentration was measured by using an Agilent 2100 Bioanalyzer (Agilent Technologies). A total of 5 μg RNA per sample was used as input material for the transcriptome libraries. The sequencing libraries were generated with a NEBNext® Ultra™ Directional RNA Library Prep Kit for Illumina® (NEB), following the manufacturer's recommendations. The differential expression analysis of two samples was performed by using the differentially expressed genes from RNA-seq data (DEGseq; 2010) R package. The p value was adjusted by using the q value. A q value <0.01 and |log2(foldchange)| >2 was set as the default threshold for significantly differential expression. GO enrichment analysis was used on the target gene candidates of differentially expressed miRNAs (hereafter referred to as “target gene candidates”).
Reverse transcription and RT-qPCR
Total RNA was extracted from the cultured cells and placenta tissues by using TRIzol reagent (Invitrogen) according to the manufacturer's instructions. Mature miR-29b-3p (UAGCACCAUUUGAAAUCAGUGUU; No. 000413; TaqMan) expression was determined by using TaqMan assays, whereas U6 small nuclear RNA (snRNA; No. 001973; TaqMan) was set as the internal reference control. The method to quantify mature miRNA was performed according to the manufacturer's instructions. Highly target-specific stem loop structure and reverse transcription primers were used for reverse transcription. RT-PCR was performed by using a TaqMan PCR kit on a Bio-Rad CFX Manager System. Expression relative to U6 was determined by using the ▵▵Cq method. For the quantification of CYREN, UACA, GLYCTK, CFL1, and CORT, 1 μg of total RNA was reverse-transcribed to complementary DNA (cDNA) with oligo-dT (No. 07912455001; Roche) and Thermoscript (Bio-Rad). RT-PCR was then performed by using SYBR green dye (No. 06924204001; Roche) in an Applied Biosystems PCR cycler. The primer sequences (Takara) are shown in Table 2. The reactions were incubated in a 96-well plate at 95°C for 10 min, followed by 40 cycles of 95°C for 10 s, 63.3°C for 30 s, and 72°C for 10 s. The housekeeping gene actin was used as an endogenous control for RNA normalization. All experiments were performed in triplicate. The threshold cycle Ct value was defined as the fractional cycle number at which the fluorescence passes the fixed threshold.
Primers Used for Quantitative Real-Time Polymerase Chain Reaction Amplification
Statistical analysis
Statistical analyses were performed by using GraphPad Prism 7. Data in bar and line graphs represent means ± standard errors of the means. Student's t test was applied when comparisons were made between two groups. For comparisons among three or more groups, data were analyzed by means of one-way or two-way repeated measurements analysis of variance (Bartlett's test for equal variances), followed by Tukey's, Sidak's, or Dunnett's multiple-comparison tests. Extreme data from BP testing, fetal birth weight, placental weight, and PCR experiments were excluded based on the mean ± 2 standard deviation. Results with p < 0.05 were considered statistically significant.
Footnotes
Acknowledgments
The authors would like to acknowledge support from the “111 program” of the Ministry of Education P.R.C. and State Administration of Foreign Experts Affairs P.R.C.
Author Disclosure Statement
No competing financial interests exist.
Funding Information
This work was supported by grants from the National Key R&D Program of China (2018YFC1004103), the National Natural Sciences Foundation of China (81671488, 81871189, 81520108013, 81771613, and 81701479), and the Science and Technology Commission of Chongqing (cstc2017jcyjBX0045).
Supplementary Material
Supplementary Figure S1
Supplementary Figure S2
Supplementary Figure S3
Supplementary Figure S4
Supplementary Figure S5
Abbreviations Used
References
Supplementary Material
Please find the following supplemental material available below.
For Open Access articles published under a Creative Commons License, all supplemental material carries the same license as the article it is associated with.
For non-Open Access articles published, all supplemental material carries a non-exclusive license, and permission requests for re-use of supplemental material or any part of supplemental material shall be sent directly to the copyright owner as specified in the copyright notice associated with the article.