
Abstract
Aims:
We sought to investigate the relationship between macrohemodynamic resuscitation and microcirculatory parameters with the response of microcirculatory flow, tissue-specific parameters of metabolic stress and injury. We hypothesized that early resuscitation based on macrohemodynamic parameters does not prevent the development of organ dysfunction in a porcine model of endotoxemic shock, and that sublingual microcirculatory parameters are associated with markers of tissue metabolic stress and injury.
Results:
Both resuscitation groups had significant increases in creatinine and neutrophil gelatinase-associated lipocalin as compared with baseline. Neither the macrovascular response to endotoxemia or resuscitation, nor group allocation predicted the development of acute kidney injury (AKI). Only a microvascular flow index (MFI) <2.5 was associated with the development of renal tubular injury and AKI, and with increased renal, liver, peritoneal, and sublingual lactate/pyruvate (L/P) ratio and lactate. Among systemic parameters, only partial pressure of carbon dioxide (PCO2) gap >6 and P(a-v)CO2/C(v-a)O2 >1.8 were associated with increased organ L/P ratio and AKI.
Innovation and Conclusion:
Our findings demonstrate that targeting macrohemodynamics to guide resuscitation during endotoxemic shock failed to predict tissue metabolic stress and the response of the microvasculature to resuscitation, and was unsuccessful in preventing tubular injury and AKI. Mechanistically, our data suggest that loss of hemodynamic coherence and decoupling of microvascular flow from tissue metabolic demand during endotoxemia may explain the lack of association between macrohemodynamics and perfusion goals. Finally, we demonstrate that MFI, PCO2 gap, and P(v-a)CO2/C(a-v)O2 ratio outperformed macrohemodynamic parameters at predicting the development of renal metabolic stress and tubular injury, and therefore, that these indices merit further validation as promising resuscitation targets. Antioxid. Redox Signal. 35, 1407–1425.
Innovation
Microcirculatory dysfunction has been associated with organ dysfunction and poor outcome in human sepsis. However, there is controversy on whether microcirculatory dysfunction is in the causal pathway to organ dysfunction, whether changes in sublingual microcirculatory flow relate to the status of remote vital organs and therefore, whether microcirculatory flow changes could serve as a potential resuscitation target. Our study demonstrates that kidney metabolic stress and injury is determined by disrupted microcirculatory flow and not by altered macrohemodynamic parameters. This establishes a very important link between changes in sublingual microcirculatory flow and the development of key injury mechanisms in a vital organ like the kidney, and supports the idea that sublingual microcirculatory flow may be a promising goal of resuscitation.
Introduction
Early resuscitation of the septic patient is currently recommended with the aim of improving survival (30, 31). However, beyond this initial rescue phase, protocolized resuscitation based on macrohemodynamic parameters or based on markers of systemic perfusion such as lactate, mixed venous oxygen saturation (SvO2), or capillary refill, does not prevent organ dysfunction or improve mortality in septic patients (2, 15, 16, 27). This suggests either significant flaws in current biomarkers used to guide therapy, and/or incomplete understanding of how sepsis induces organ dysfunction.
Sepsis induces profound alterations in endothelial function and microvascular blood flow distribution. In animal models of sepsis, microvascular dysfunction has been identified in every vital organ (4, 38), and interventions aimed at reversing microvascular dysfunction have shown to improve organ function and survival (37). In human sepsis, disruption of sublingual microvascular flow is associated with organ injury, multiple organ dysfunction, and increased mortality (4). Based on these data, microvascular dysfunction has been suggested as a mechanism of organ injury during sepsis. Furthermore, because preserved microvascular flow is necessary for adequate delivery of oxygen and nutrients to the tissues, microvascular dysfunction is suggested as a mechanism to explain why targeting macrohemodynamic parameters fails to improve perfusion and prevent organ dysfunction (13).
Ince suggested that sepsis abrogates the natural coupling between the macro- and microcirculation, termed hemodynamic coherence, and that this may explain why increasing cardiac output (CO) fails to improve tissue perfusion and organ dysfunction (12). van Genderen et al. demonstrated this experimentally by showing that endotoxemic, but not cardiogenic shock, resulted in the loss of hemodynamic coherence (35).
However, even if this were the case in human sepsis, there is still controversy on whether microcirculatory dysfunction is in the causal pathway to organ dysfunction, whether changes in sublingual microcirculatory flow relate to the status of remote vital organ perfusion and metabolic stress (i.e., altered concentrations of tissue metabolic substrates and products, including pyruvate, lactate, and/or lactate/pyruvate [L/P] ratio in the kidney, gut, liver, when compared with baseline), and whether the sublingual microcirculation would be the right target to guide resuscitation (34).
Therefore, the aims of this study were to test the hypotheses that (i) maintenance of macrohemodynamic parameters does not prevent the development of organ injury during endotoxemia; (ii) endotoxemia disrupts coupling of microvascular flow with tissue metabolic demand; (iii) sublingual microcirculatory flow is associated with vital organ metabolic stress (defined as an increase in tissue lactate or L/P ratio) and injury; and (iv) changes in microvascular dysfunction in response to endotoxemia or resuscitated endotoxemia can be used to predict the development of acute kidney injury (AKI).
To test these hypotheses, we used a porcine model of endotoxemia coupled to a dynamic parameter-guided hemodynamic resuscitation protocol, while monitoring macrohemodynamics, sublingual microvascular flow, and markers of metabolic stress in multiple organs using microdialysis catheters.
Results
Systemic hemodynamics and oxygenation
Of the 18 randomized animals, 4 pigs (2 from each group) were excluded from the final analysis. These four animals all went into ventricular fibrillation and subsequent cardiac arrest during the priming lipopolysaccharide (LPS) infusion. Clinical and hemodynamic data including whole-body hives, tachypnea, persistent elevation of the pulmonary pressures, and central venous pressure (CVP) suggested that these animals went into refractory anaphylactic shock, with massive histamine release, acute pulmonary hypertension, and right ventricular failure. Therefore, a total of 14 animals, 6 in the late and 8 in the early resuscitation group, were included in the final analysis.
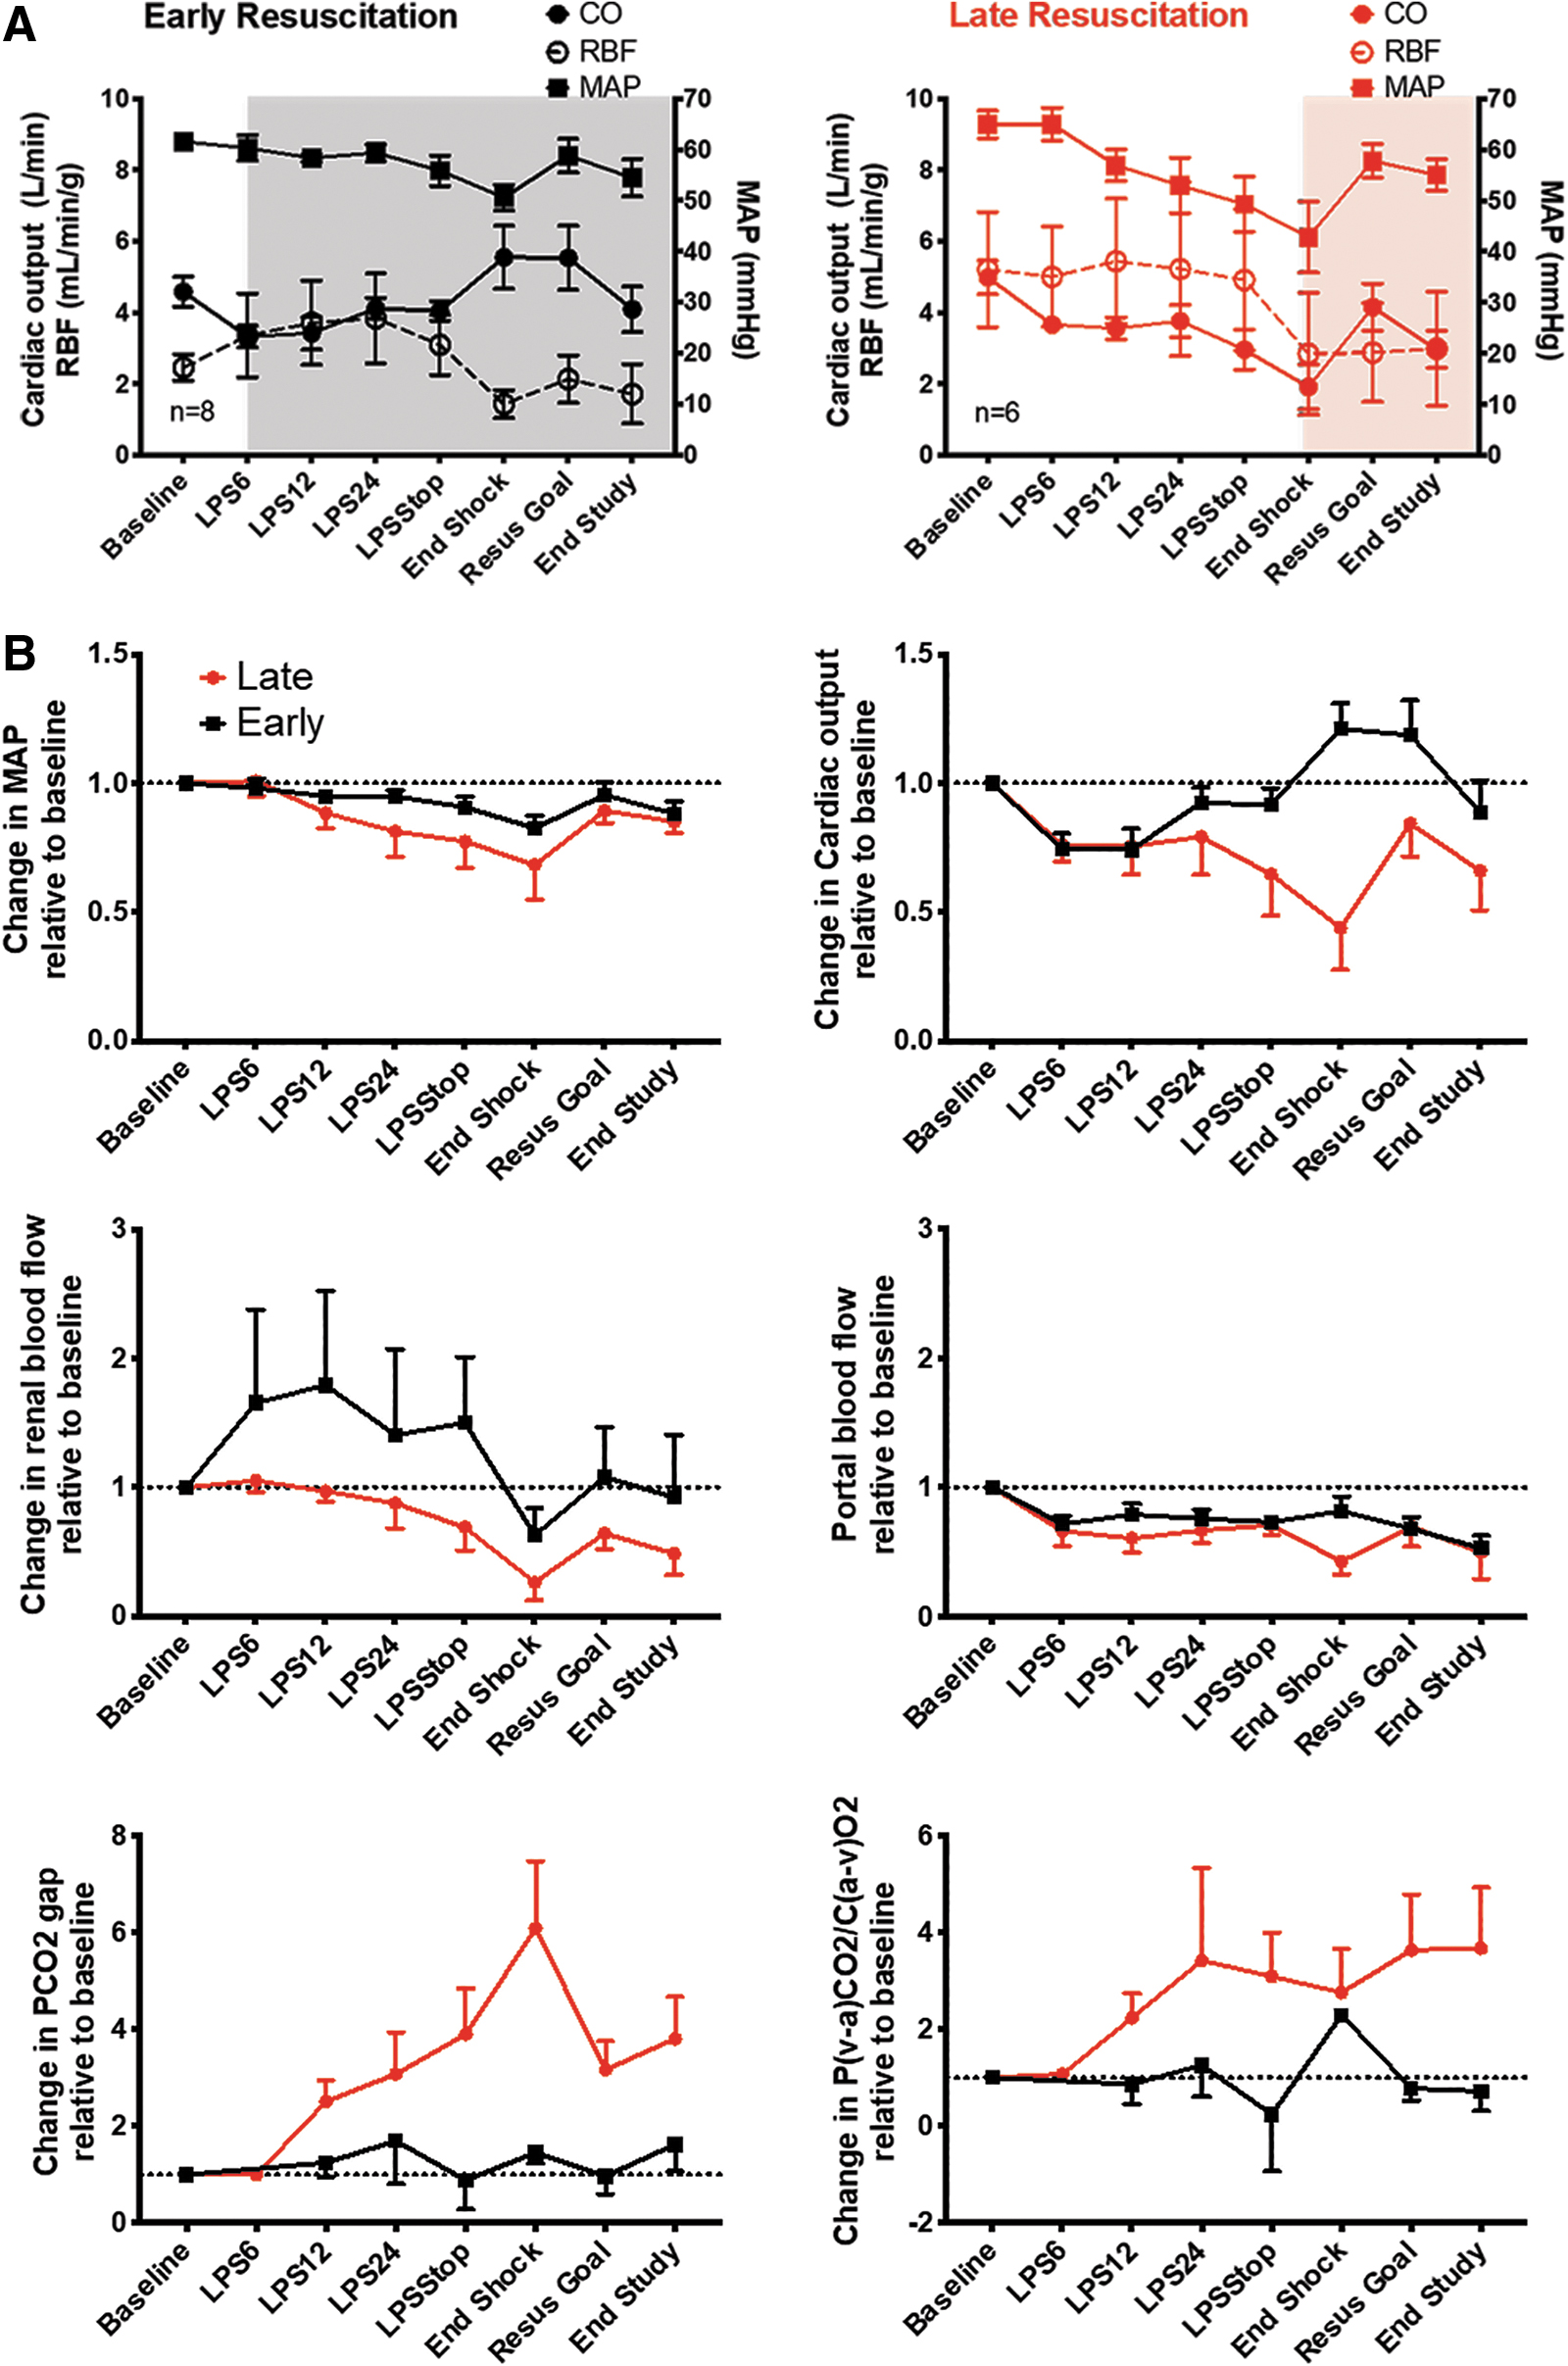
The analysis was focused on the period between baseline and the end of shock time point, which is the period including LPS infusion and prolonged hypotensive state (Fig. 1). During this period, only animals exposed to early resuscitation received fluids and vasopressors according to our resuscitation protocol (Supplementary Fig. S1), while animals in the late resuscitation group received no resuscitation.

Early resuscitation was successful at maintaining mean arterial pressure (MAP), CO and renal blood flow (RBF), but not portal blood flow (PBF) as compared with animals subjected to late resuscitation (Fig. 2A, B). Despite the use of vasopressors (i.e., norepinephrine, vasopressin, and epinephrine), early resuscitation failed to limit the increase in arterial compliance induced by endotoxemia as measured by the pulse pressure to stroke volume (PP/SV) ratio (Supplementary Fig. S2) (24), suggesting that maintenance of MAP in the early resuscitation group had to be due to an increase in CO (Fig. 2). In addition, early resuscitation maintained DO2, VO2, and SvO2 at or above baseline during the shock period, as compared with late resuscitation animals (Supplementary Fig. S2). The partial pressure of carbon dioxide (PCO2) gap was maintained at baseline levels in animals exposed to early resuscitation, whereas there was a sixfold increase in animals exposed to late resuscitation (Fig. 2B). The ratio between PCO2 gap and the arteriovenous difference of O2 (P(a-v)CO2/C(v-a)O2) followed a similar pattern increasing 2.7-fold in the late resuscitation group (Fig. 2B).
Resuscitation to macrohemodynamic goals did not prevent the development of AKI
Plasma creatinine increased progressively regardless of group allocation, reaching significance at the goal of resuscitation time point. Importantly, there were no differences between groups at any time point (Fig. 3A). Furthermore, urinary neutrophil gelatinase-associated lipocalin (NGAL), a marker of renal tubular injury, increased significantly in both groups with a trend toward higher levels in the late resuscitation group (Fig. 3B). In support of this, when we used the Kidney Disease Improving Global Outcomes (KDIGO) criteria (1) to define the presence of AKI, we found that 100% of the animals had either creatinine or urine output criteria of at least Stage I AKI (Supplementary Table S1). In addition, early resuscitation did not alter the plasma interleukin 6 (IL-6) increase between groups at any time point (Fig. 3C).

Early resuscitation improved renal cortical lactate/pyruvate ratio and limited tubular injury, but did not affect any other end organ metabolic stress parameter
Glucose decreased in the renal cortex and liver, while pyruvate levels increased during the shock period (Fig. 4, Supplementary Figs. S3 and S4). In parallel, lactate increased in the renal cortex and in the liver, independent of the treatment group allocation (Fig. 4).
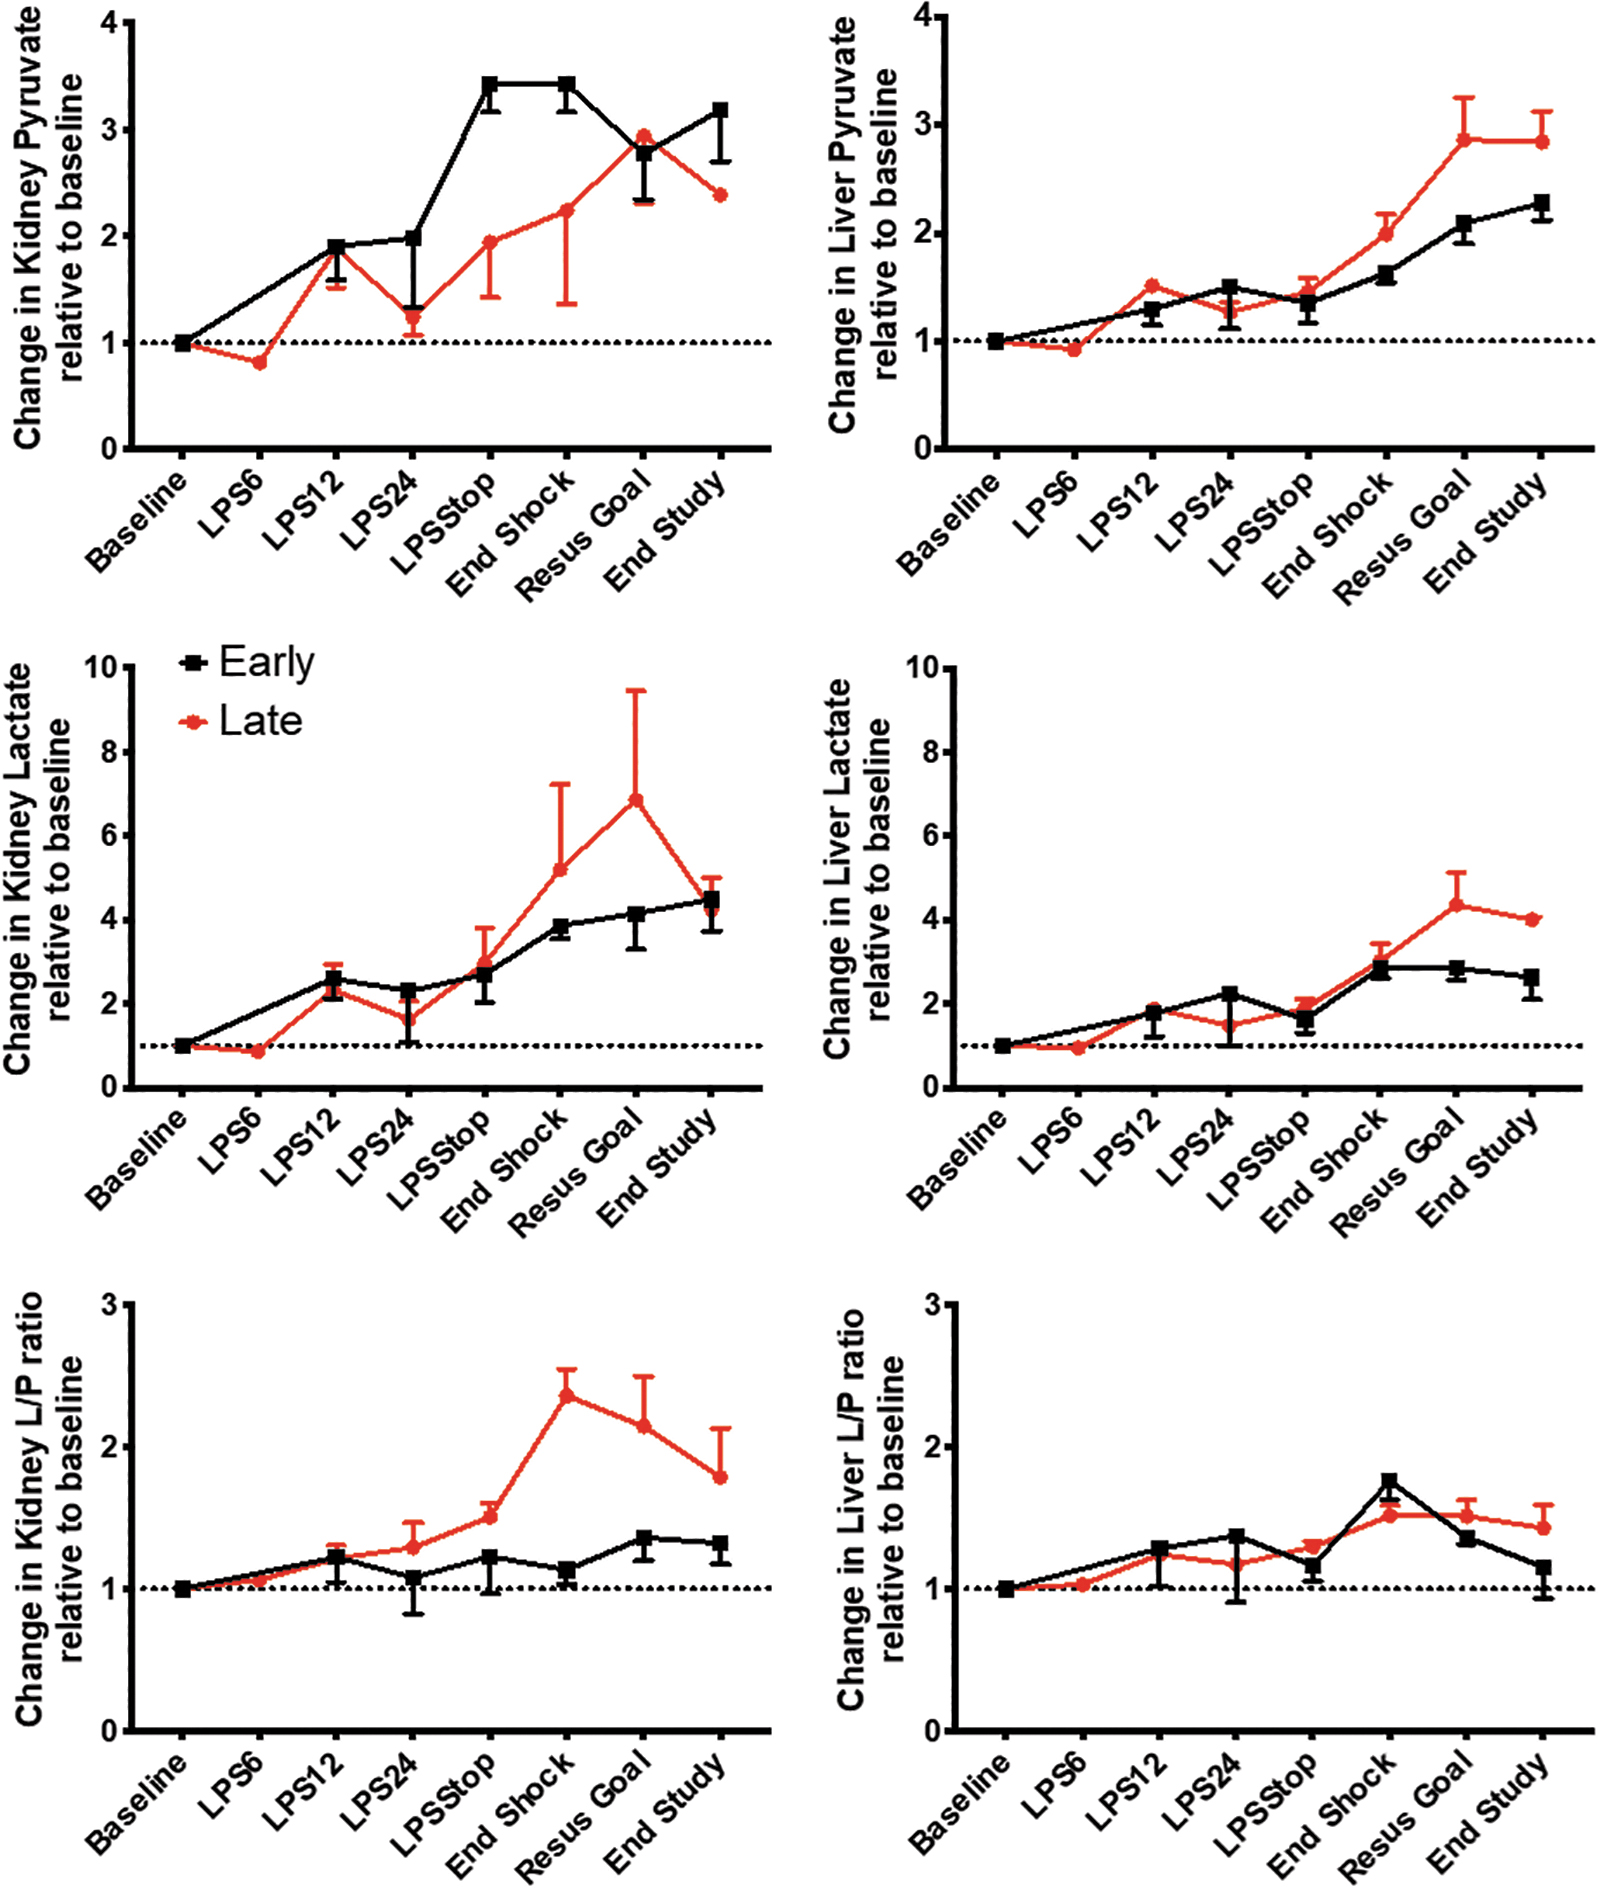
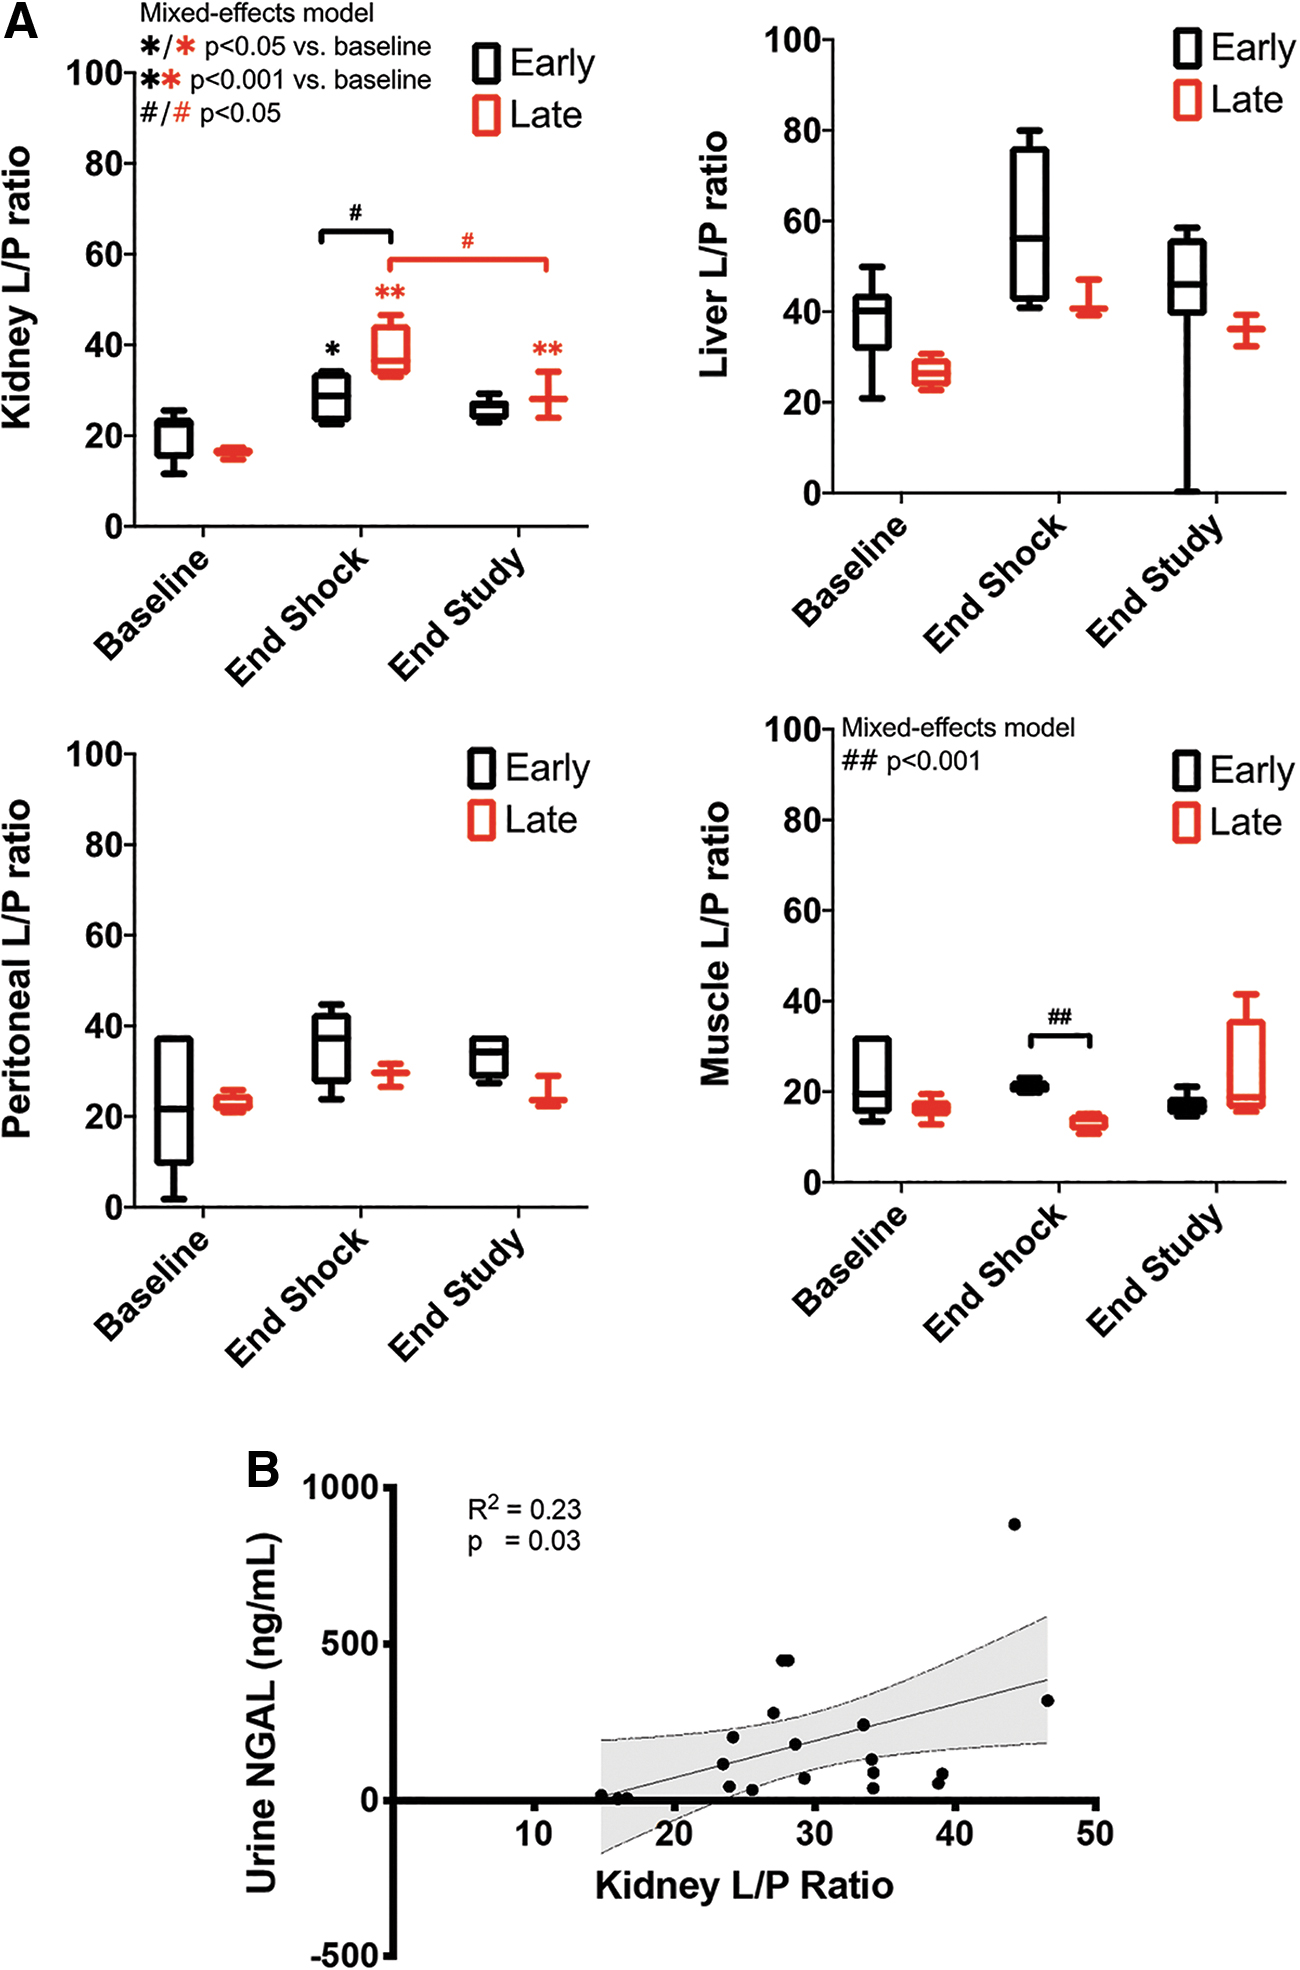
The L/P ratio increased more in the late versus early resuscitation group at the end of the shock period in the renal cortex (absolute values: 38.2 ± 6.2 vs. 28.5 ± 6.1, p = 0.07; fold increase from baseline: 2.4 ± 0.4 vs. 1.1 ± 01.1, p = 0.003), but not in the liver, peritoneum, or skeletal muscle (Fig. 5A, Supplementary Figs. S4–S6). While changes in pyruvate were homogeneous, changes in lactate and L/P ratios were variable between different organs. The highest changes in lactate occurred in the kidney, followed by the gut, liver, and muscle. The kidney had the highest changes in L/P ratio followed by the liver and the gut. This change in cortical renal L/P ratio is relevant to tubular injury because cortical renal L/P ratio had a direct correlation with urine NGAL (Fig. 5B). The difference in cortical renal L/P ratio between treatment groups was mirrored by the difference in urinary NGAL, where early resuscitation animals had a trend toward a lower increase (5- to 8-fold from baseline) than late resuscitation animals (30- to 40-fold; Fig. 3B). These results suggest that metabolic stress parameters such as L/P ratio can serve as a proxy for tissue injury.
Resuscitation to macrohemodynamic goals limited but did not prevent microcirculatory dysfunction during endotoxemia
Despite early resuscitation sustaining macrocirculatory values at baseline levels, microcirculatory function was only partially sustained. All microcirculatory parameters decreased during the shock period in both groups (Fig. 6A–D). Early resuscitation limited but did not prevent the decline in microvascular flow index (MFI) (Fig. 6D). At the end of shock time point only MFI absolute values were higher in the early as compared with the late resuscitation group (2.4 ± 0.1 vs. 1.5 ± 0.7, p = 0.03; Fig. 6D).
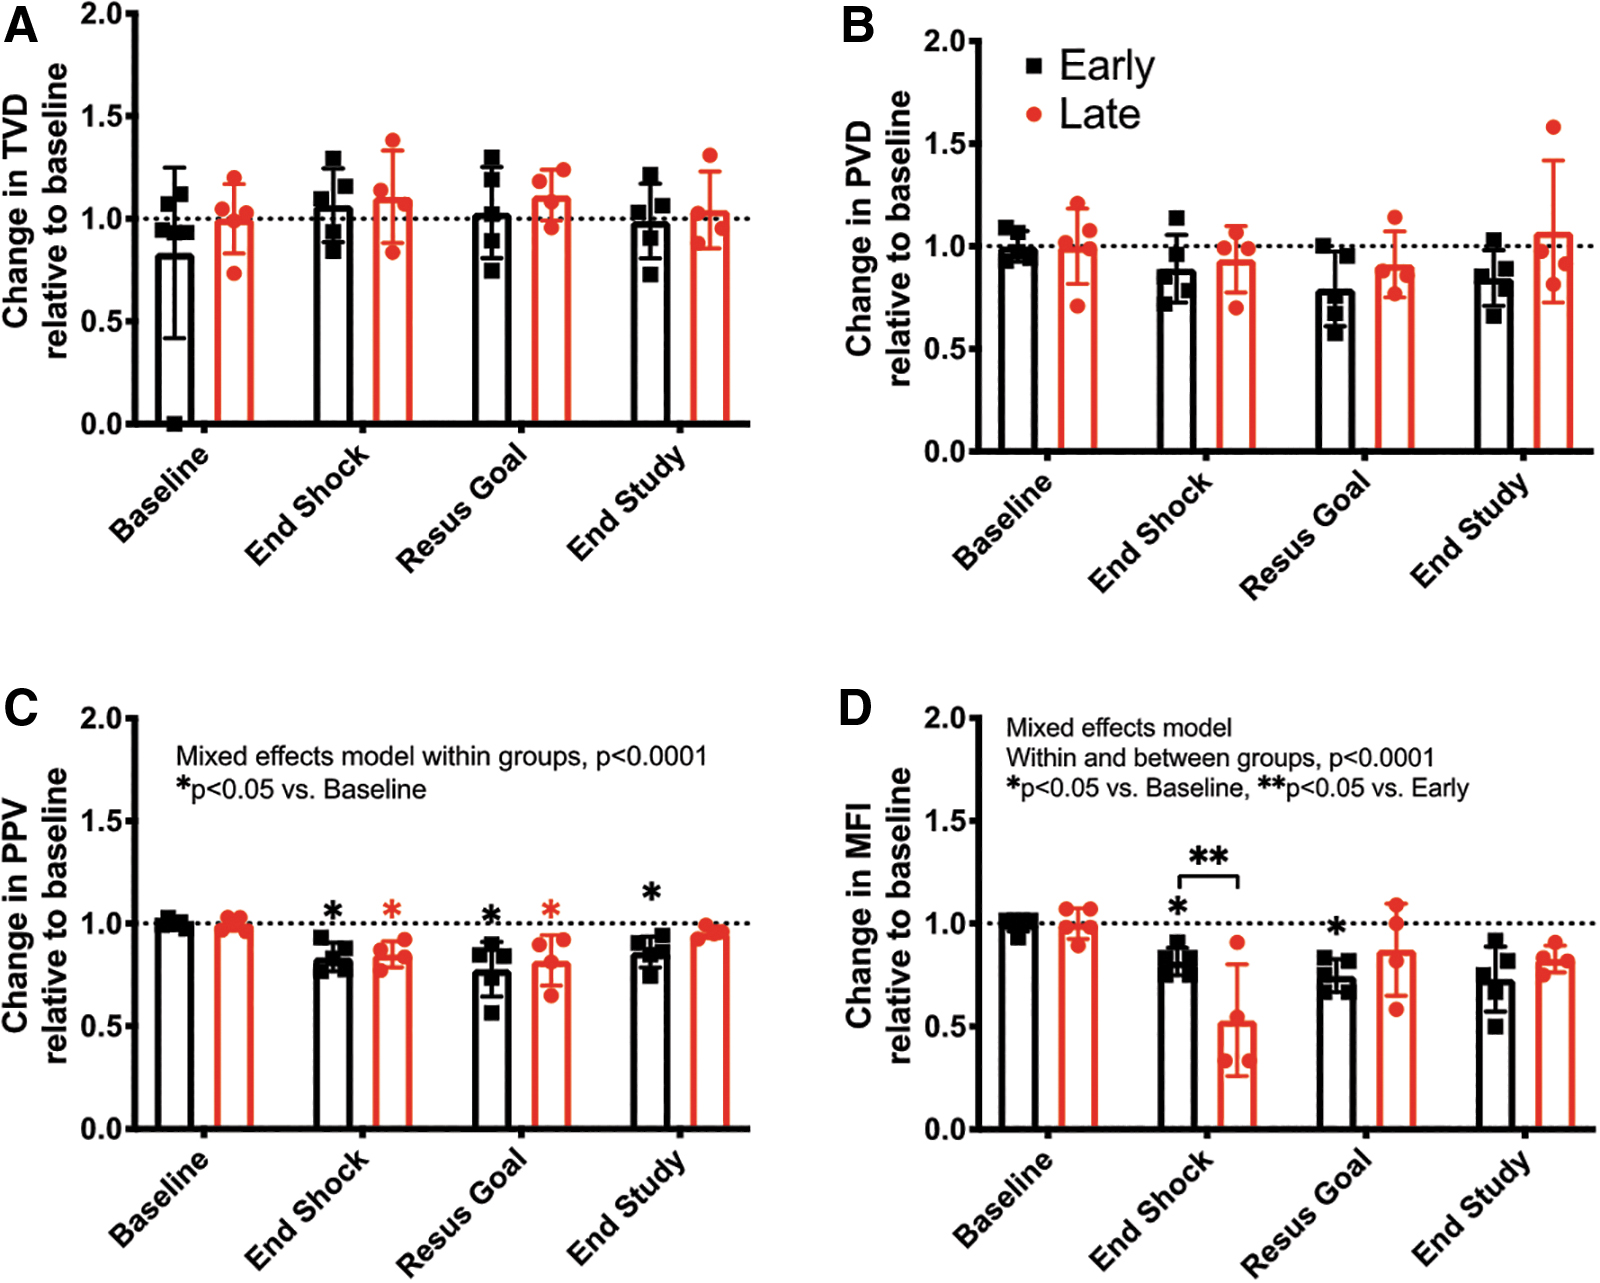
We then addressed which aspects of microcirculatory function were altered by endotoxemia. To assess if diffusion was altered during endotoxemia, we monitored total vessel density (TVD) and perfused vessel density (PVD). We found that TVD increased ∼10% in response to endotoxemia, while PVD decreased (Early 6.3% ± 1.6% vs. Late 11% ± 1.6%, p = nonsignificant [NS]) regardless of the resuscitation group allocation (Fig. 6A, B). In contrast, both convection parameters proportion of perfused vessels (PPV) and MFI decreased but were not different between resuscitation groups (PPV Early 15.0% ± 6.3% vs. Late 16.3% ± 7%, p = NS; and MFI Early 18.5% ± 6.7% vs. Late 46.9% ± 27.1%, p = 0.06) (Fig. 6C, D).
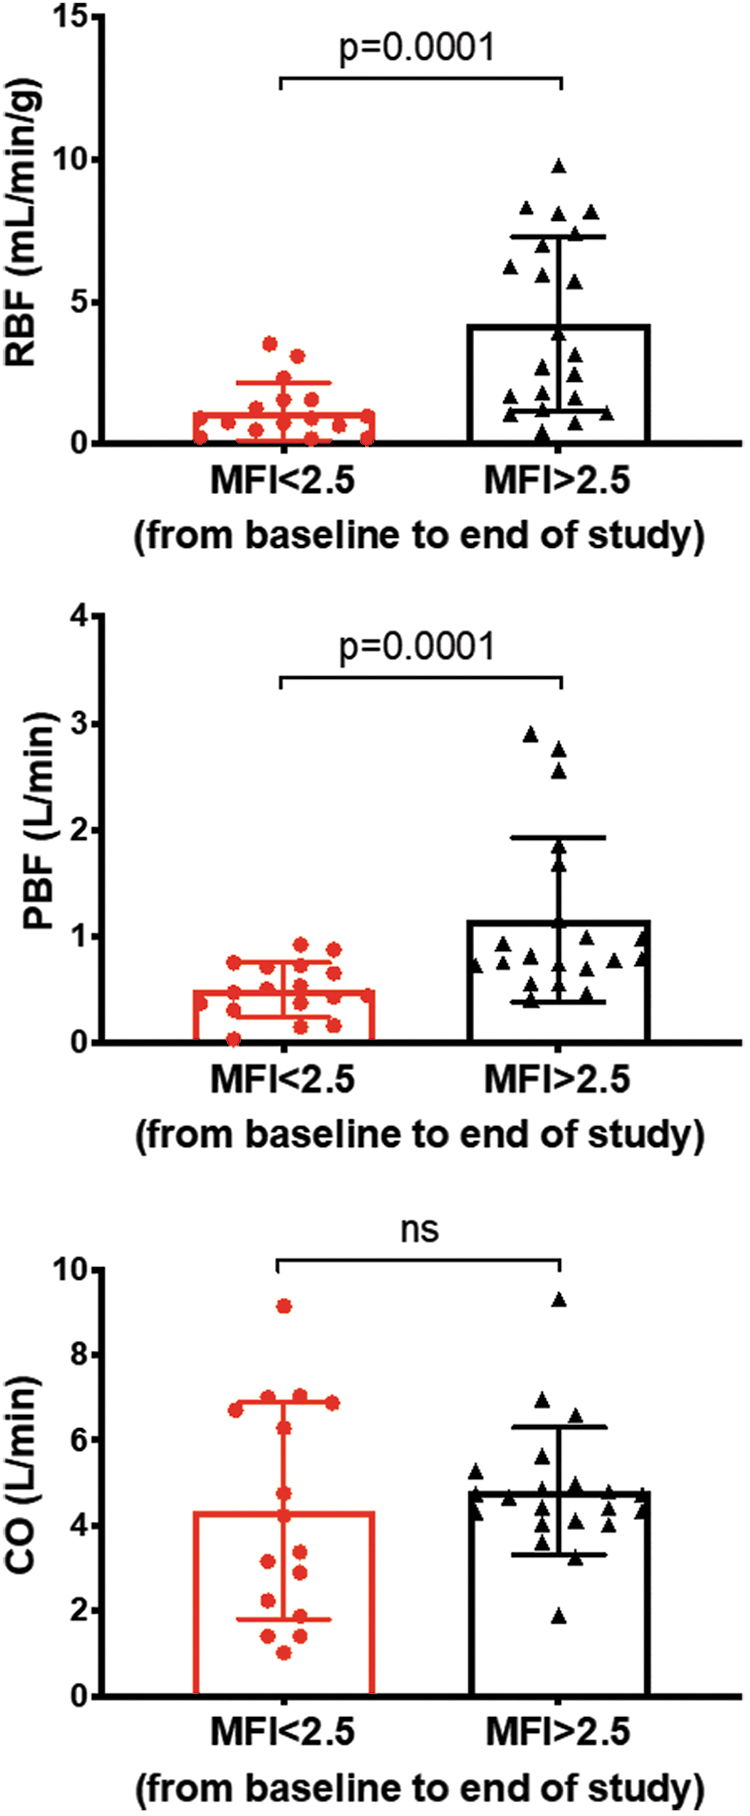
Interestingly, flow-based (CO, RBF, and PBF; Supplementary Fig. S7A) but not pressure-based macrohemodynamic parameters (MAP, CVP, and mean pulmonary arterial pressure [MPAP]; Supplementary Fig. S7B) correlated with MFI. CO had a direct correlation with MFI only in late resuscitation animals (Supplementary Fig. S7A). However, RBF and PBF correlated with microcirculatory flow parameters (Supplementary Fig. S7A). We then assessed whether the microvascular response to endotoxemia and resuscitation could predict CO, RBF and PBF. We found that regardless of treatment group allocation, an MFI <2.5 was associated with lower RBF and PBF, but not with CO (Fig. 7).
We then assessed if macrovascular parameters or group membership (i.e., Early vs. Late Resuscitation) could predict the development of microvascular dysfunction during the shock period. Exact logistic regression analysis revealed that none of the measured macrovascular parameters including MAP, CO, SvO2, or CVP, PP/SV, fluid, or vasopressor administration, or group membership predicted microvascular dysfunction at the end of the shock period (i.e., Resus time point; Supplementary Table S2). The closest macrovascular predictor was PBF with an OR of 0.013 and p = 0.06.
To further assess hemodynamic coherence between the macro- and microcirculation, we compared the CO increase with resuscitation during shock with the resultant changes in microcirculatory measures. We defined systemic volume responsiveness to resuscitation as an increase in CO ≥15% from baseline to end of shock. Responders had a 40.6% ± 0.8% increase in CO, compared with 6.6% ± 25.8% in nonresponders. Systemic volume responsiveness (i.e., >15% increase in CO with resuscitation) did not result in similar changes in MFI or PPV at the end of shock (Supplementary Fig. S8A, B). Furthermore, systemic volume responsiveness did not minimize the MFI decrease from baseline to end of shock (Supplementary Fig. S8C), nor was there concordance between changes in CO and changes in MFI (Supplementary Fig. S8D).
Altered sublingual microvascular flow, rather than resuscitation group allocation, predicts local microvascular decoupling from tissue metabolism induced by endotoxemia
We then examined how microvascular flow changes in response to endotoxemia and resuscitation relate to local tissue metabolism. To do so, we analyzed tissue glucose, pyruvate, lactate, L/P ratio, and glycerol levels using a microdialysis catheter inserted into the sublingual area, contralateral to the area being used to monitor the microcirculation.
As microcirculatory flow decreased during the shock period (from baseline to end of shock time point; Fig. 6), sublingual glucose levels decreased (fold decrease from baseline at the end of shock, late 0.54 ± 0.25 vs. early 0.89 ± 0.25, p = NS) and pyruvate levels increased to similar levels in both groups (fold increase from baseline late 1.66 ± 0.25 vs. early 1.70 ± 0.04, respectively, p = 0.81; Supplementary Fig. S9).
Lactate increased in both groups, slightly faster in the late resuscitation group, but there was no difference in the fold increase from baseline at the end of shock time point (1.6 ± 0.5 vs. 2.2 ± 0.7-fold, respectively, p = 0.5). The L/P ratio changed minimally in both groups from 22 to 27 in the early versus 19 to 26 in the late resuscitation group (Supplementary Fig. S9). Changes in glycerol [a surrogate for cell membrane damage (10)] from baseline to end of shock were not different between groups (Supplementary Fig. S9).
Because neither MAP nor CO changes were associated with endotoxemia-induced changes in sublingual tissue metabolism (Supplementary Fig. S10), we investigated if sublingual microvascular flow correlated with changes in markers of sublingual tissue metabolic stress. Convection (MFI and PPV), but not diffusion (PVD), indices had significant correlations with several sublingual metabolic parameters. The MFI correlated with lactate, pyruvate, and L/P ratio, but only in early resuscitation animals (Supplementary Fig. S11). However, PPV correlated with sublingual lactate concentrations in both groups (Supplementary Fig. S12), but had no correlation with other metabolic markers.
Next, we investigated if low or high microcirculatory convective flow defined as an MFI <2.5 or >2.5, respectively, resulted in a difference in markers of sublingual tissue metabolic stress. Animals that had MFI >2.5 throughout the experiment had lower sublingual lactate levels and a trend toward reduced L/P ratios (Fig. 8A, B), whereas resuscitation group allocation had no impact on sublingual tissue metabolic stress (Fig. 8C, D).

Renal cortical metabolic stress markers correlated with sublingual microcirculatory flow status only in animals exposed to early resuscitation
We investigated if microcirculatory flow indices correlated with markers of tissue metabolic stress in the kidney and liver. MFI had an inverse correlation with renal L/P ratio, which was only significant in late resuscitation animals, and a similar inverse correlation with lactate and pyruvate, which was only significant in early resuscitation animals (Supplementary Fig. S13). The MFI only correlated with liver L/P ratio in late resuscitation animals and with liver pyruvate levels in early resuscitation animals (Supplementary Fig. S14).
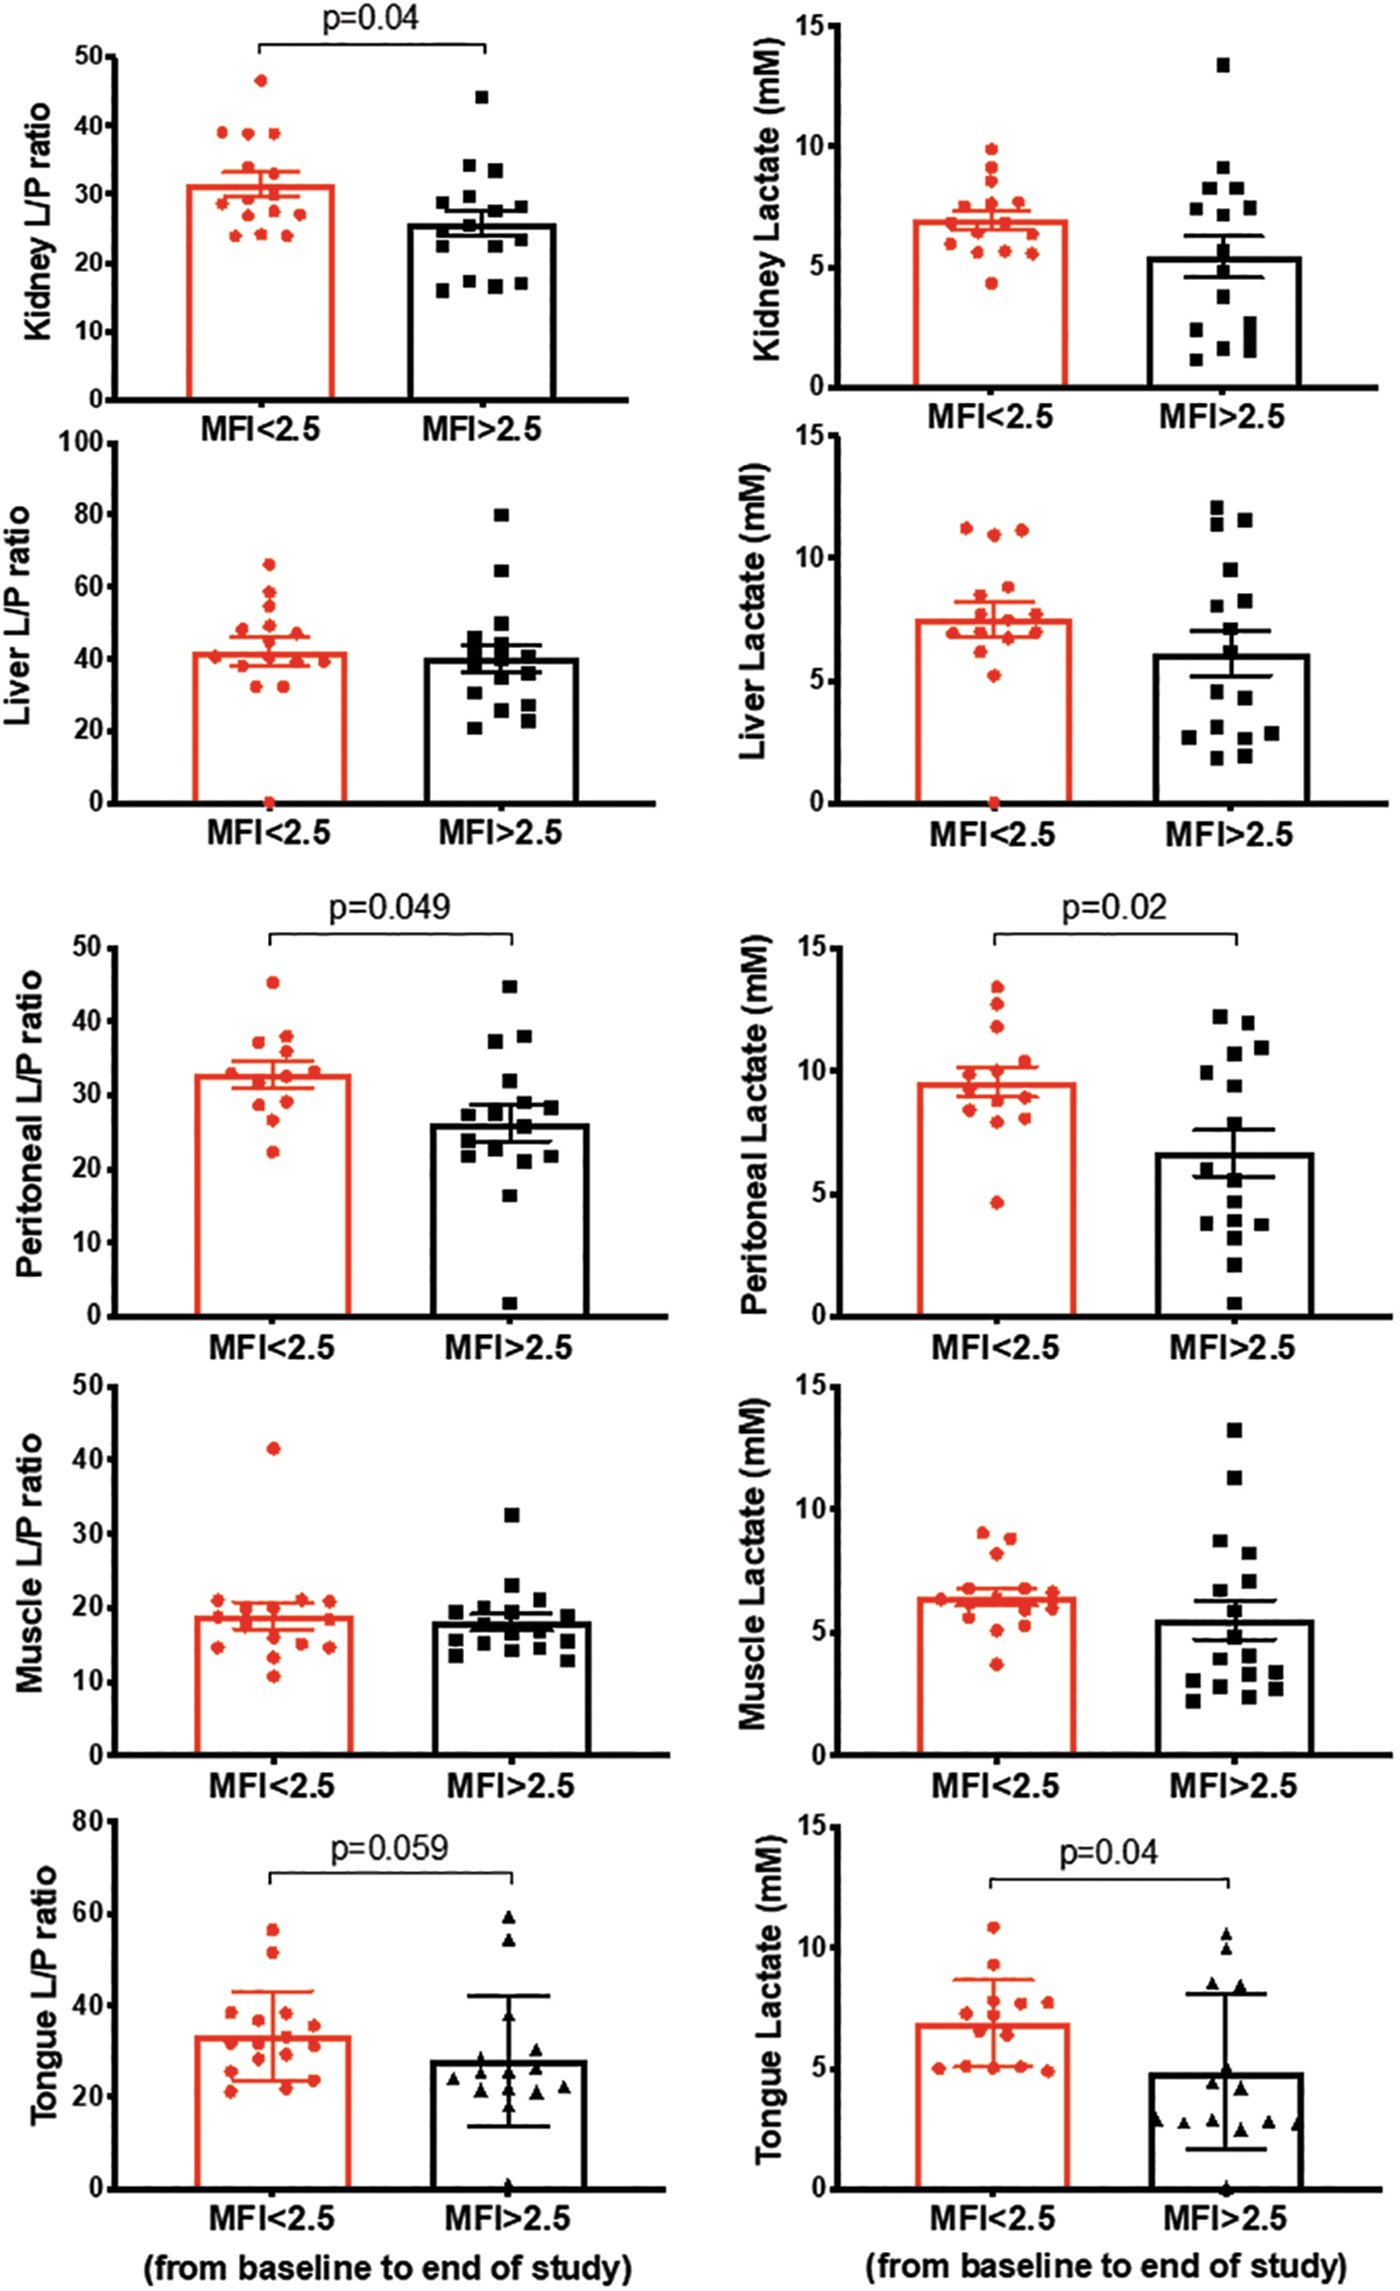
We then asked if tissue markers of metabolic stress would be different between animals that had altered versus preserved microcirculatory function, independent of resuscitation group allocation. We dichotomized microcirculatory function at the end of the shock period as being altered or preserved based on MFI (<2.5 vs. >2.5, respectively) (29), PPV (<90% vs. >90%), and PVD (<13 vs. >13 mm2/mm2) (26). Higher MFI was associated with a lower L/P ratio and lactate when compared with lower MFI in the renal cortex, peritoneum, and tongue, but not in the liver or skeletal muscle across all time points (Fig. 9). While an MFI >2.5 showed a nonsignificant trend toward lower urinary NGAL levels (MFI <2.5 155 ± 103 vs. MFI >2.5, 131 ± 170 ng/mL, p = 0.051), group allocation showed no association with urinary NGAL levels (Late 119 ± 136 vs. Early 136 ± 137, p = 0.6).
Renal tissue metabolic stress markers correlate with macrohemodynamic flow-based parameters and with systemic indices of hypoperfusion
We asked whether macrohemodynamic pressure-based or flow-based parameters were associated with vital tissue metabolic stress markers. Both MAP and CO had an inverse correlation with kidney L/P ratio in late resuscitation animals (Supplementary Fig. S15). However, in early resuscitation animals, CO had a positive correlation with kidney L/P ratio, suggesting higher risk of ischemia with increasing CO. Neither CO nor MAP correlated with liver L/P ratio (Supplementary Fig. S16).
Next, we investigated if the renal L/P ratio or lactate would be different between animals that had a > 15% CO increase from baseline to end of shock (i.e., a resuscitation responsive animal) versus those that would not. Renal cortical L/P ratio and lactate at both the end of shock and the goal of resuscitation were similar in animals with and without an increase in CO (Supplementary Fig. S17), suggesting no relationship with systemic flow parameters.
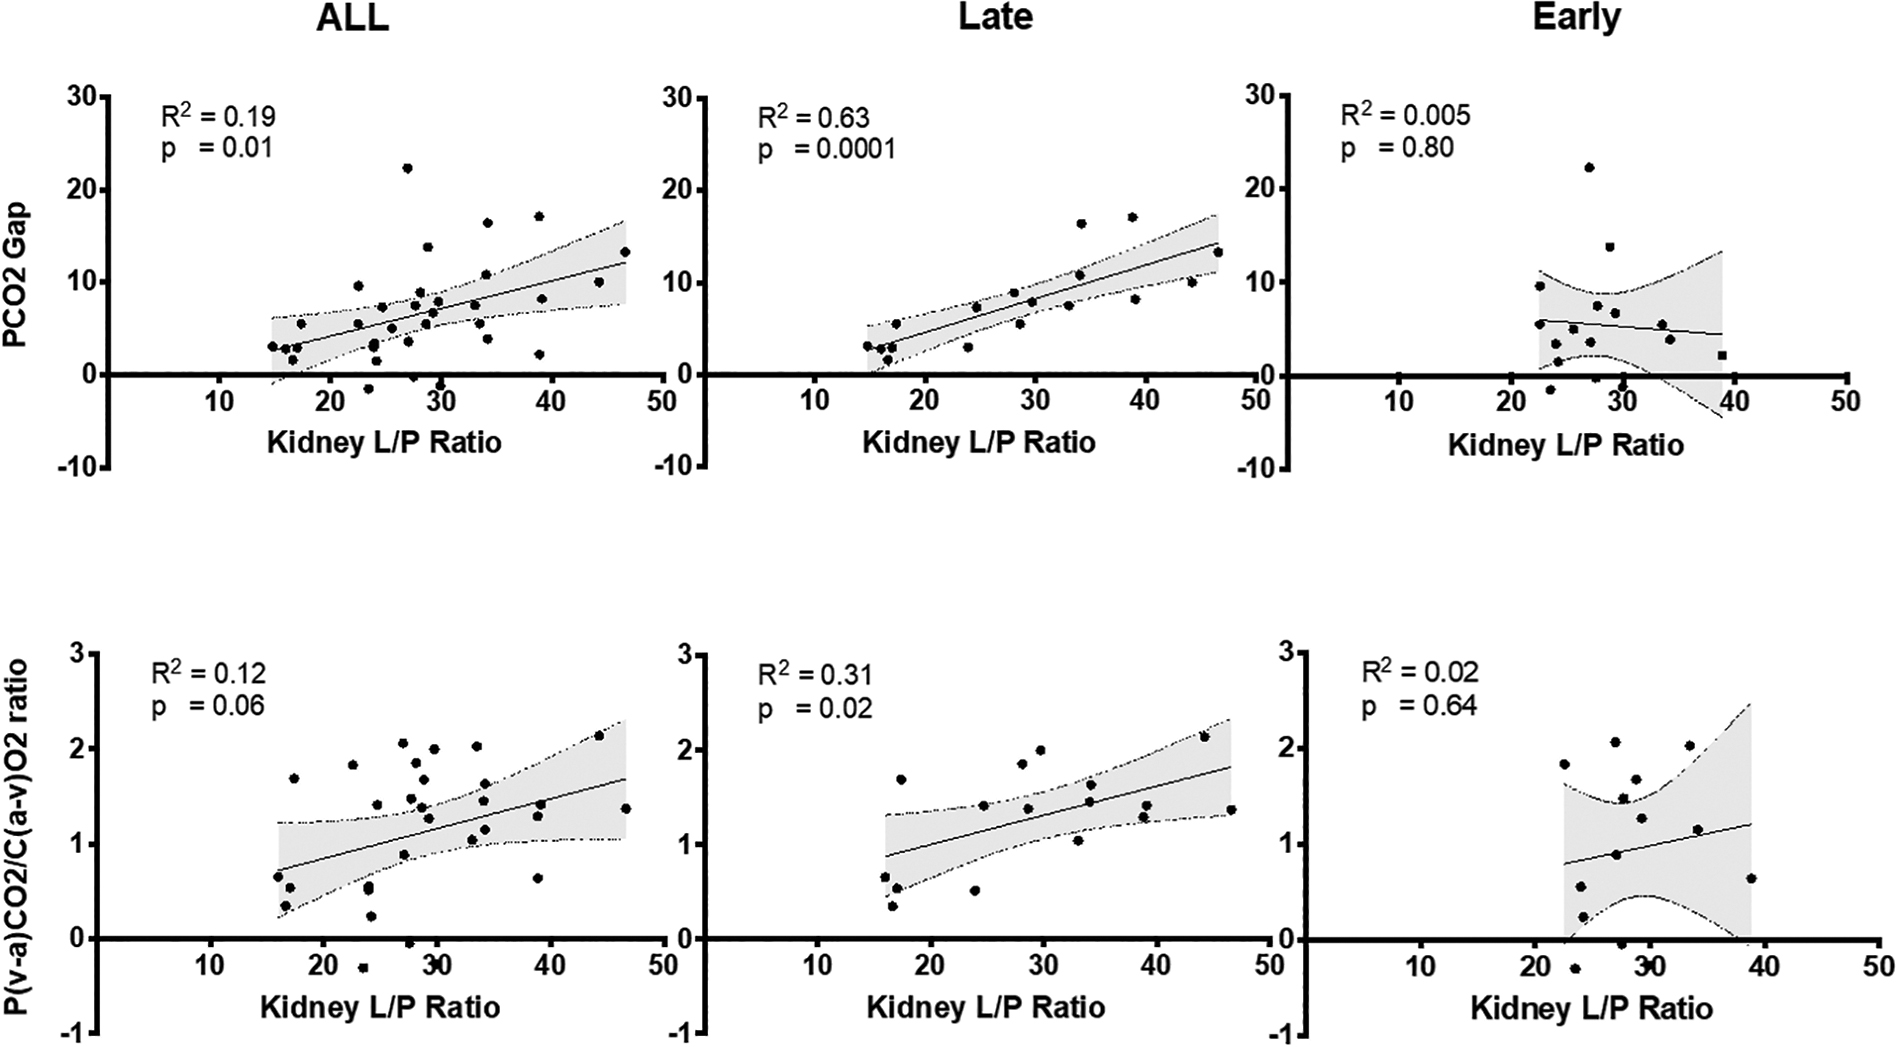
Both the PCO2 gap and P(a-v)CO2/C(v-a)O2 ratio had a direct strong correlation with kidney L/P ratios only in late resuscitation animals (Fig. 10).
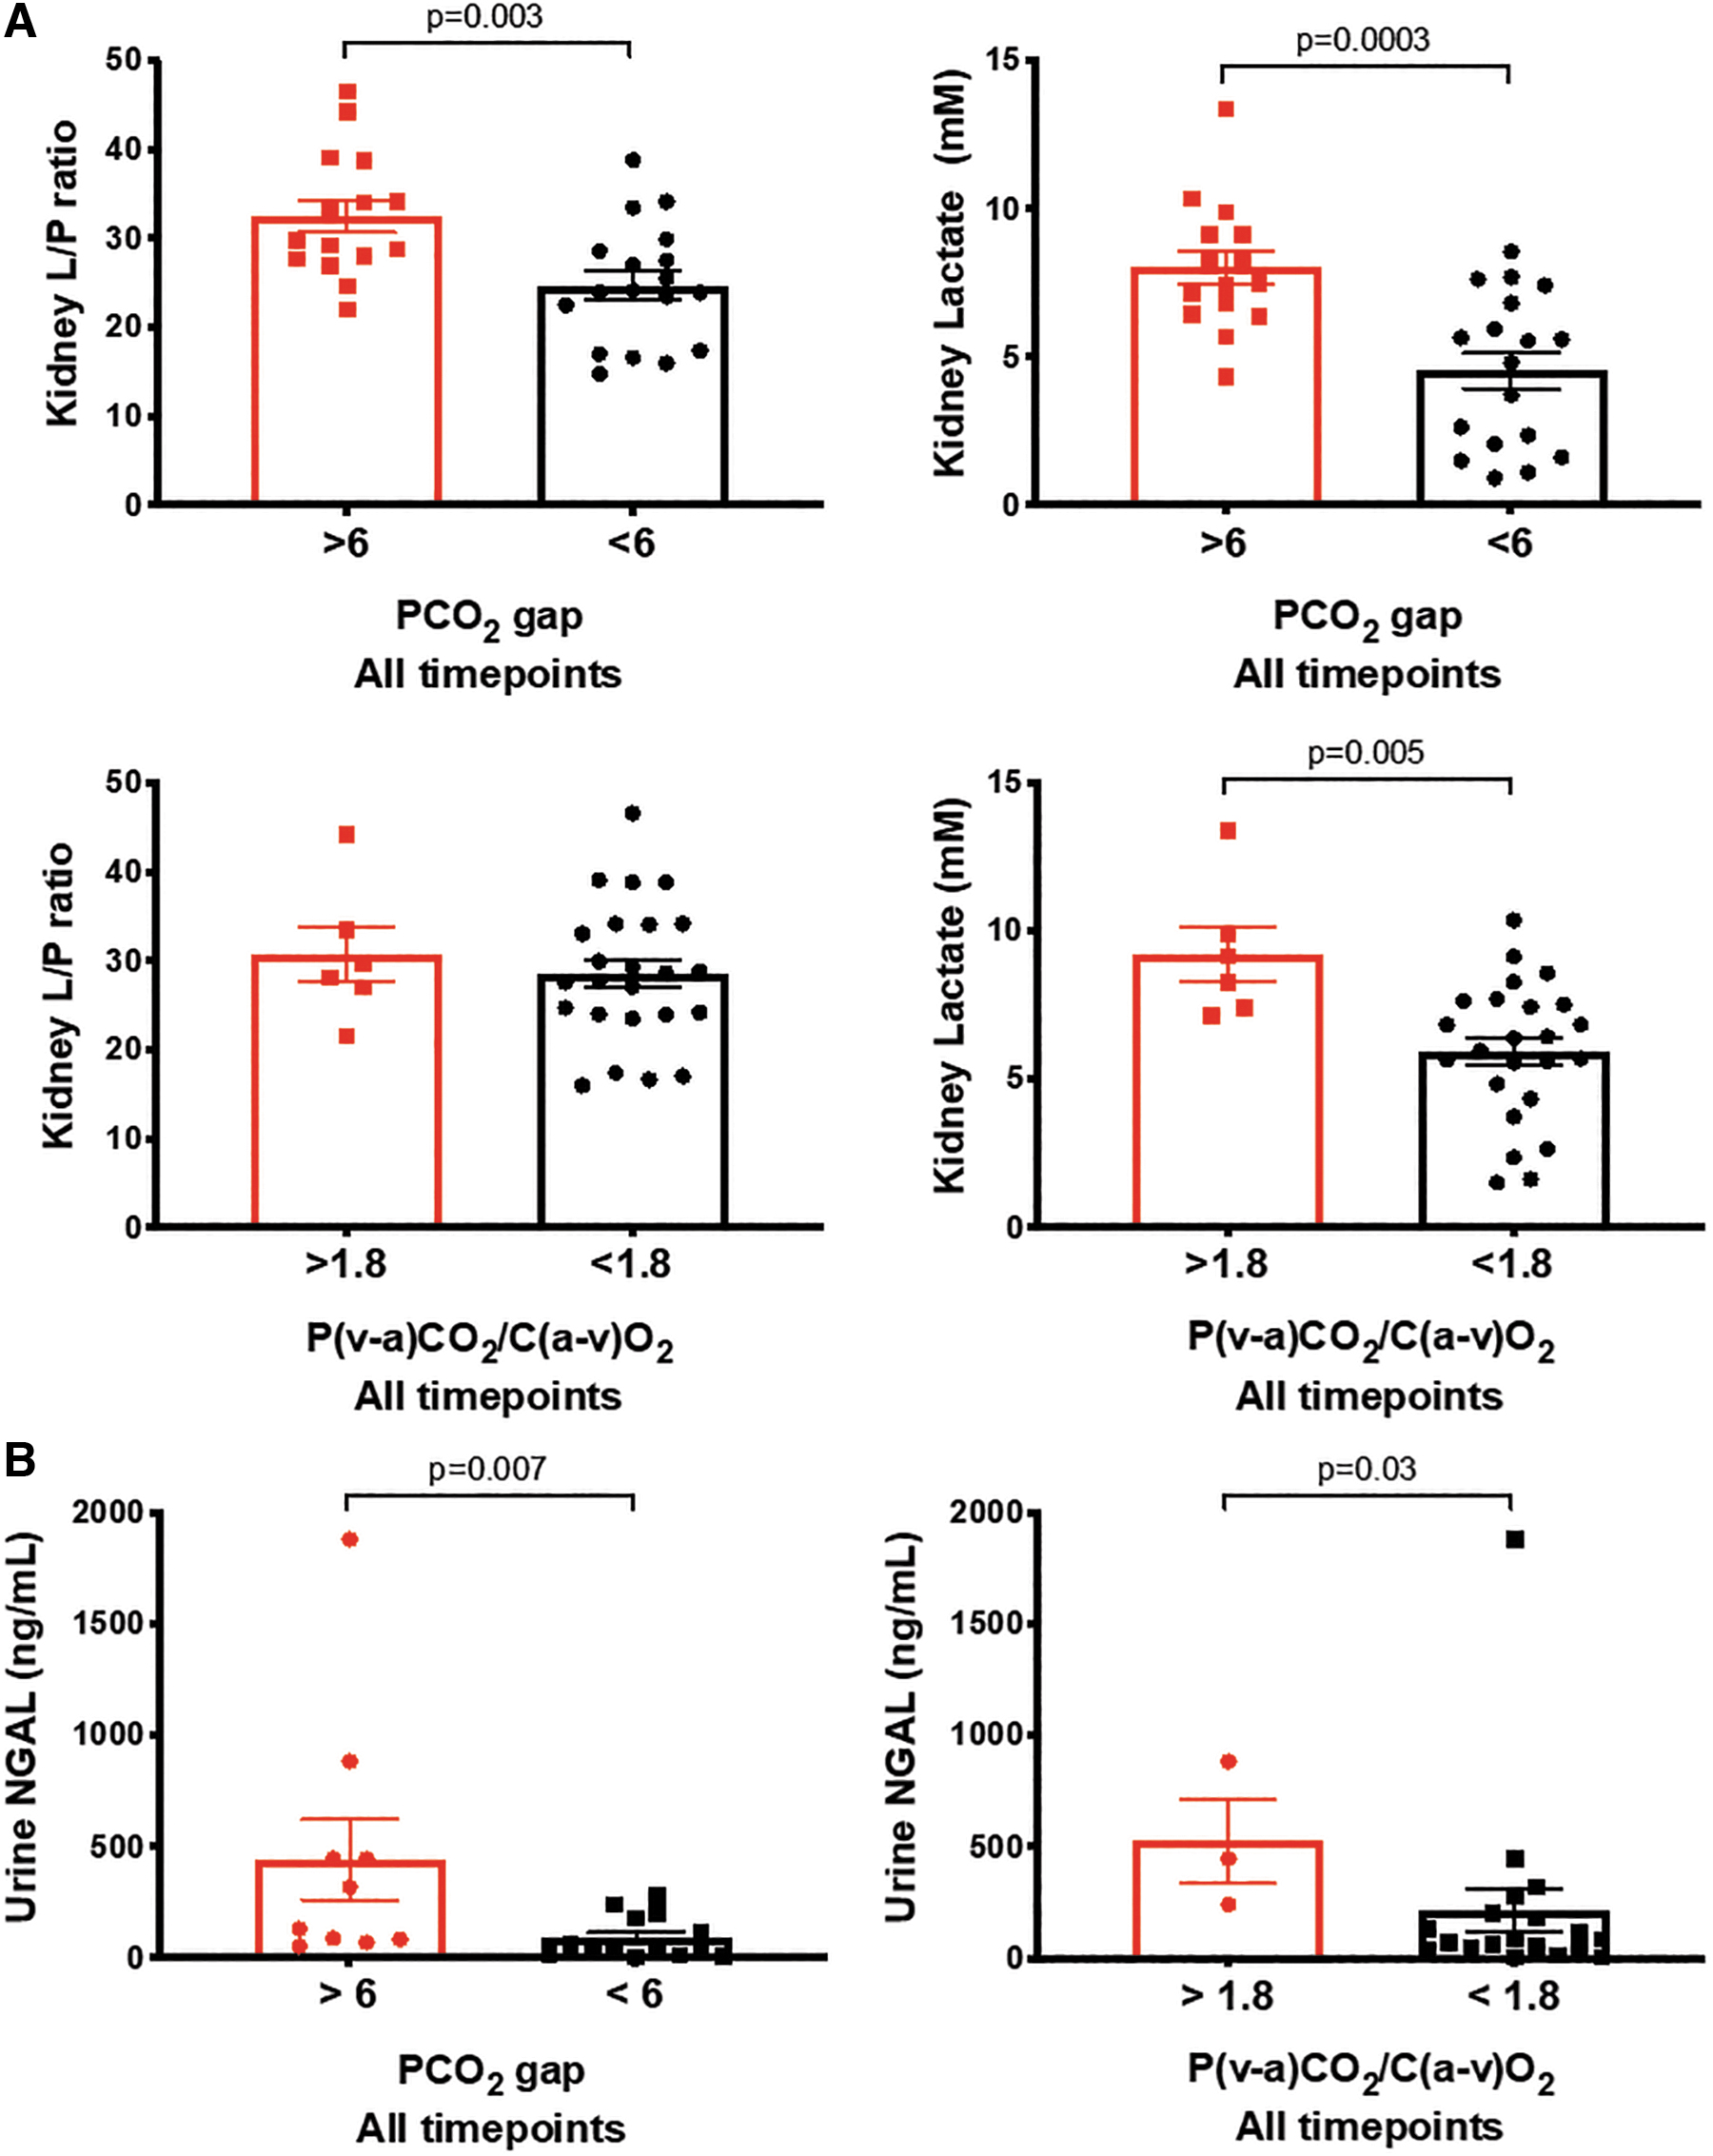
Because the kidney was the organ that showed most propensity to metabolic stress, we dichotomized the animals based on PCO2 gap (< or > than 6) and P(a-v)CO2/C(v-a)O2 (< or > than 1.8) at any time point, and compared the levels of renal cortical L/P ratio or lactate at any time point. We found that PCO2 gap >6 was associated with a significantly higher renal cortical L/P ratio and lactate, and that a P(a-v)CO2/C(v-a)O2 >1.8 was associated with higher renal cortical lactate, but not L/P ratio. In addition, both PCO2 gap >6 and P(a-v)CO2/C(v-a)O2 >1.8 were associated with higher urine NGAL levels (Fig. 11).
Discussion
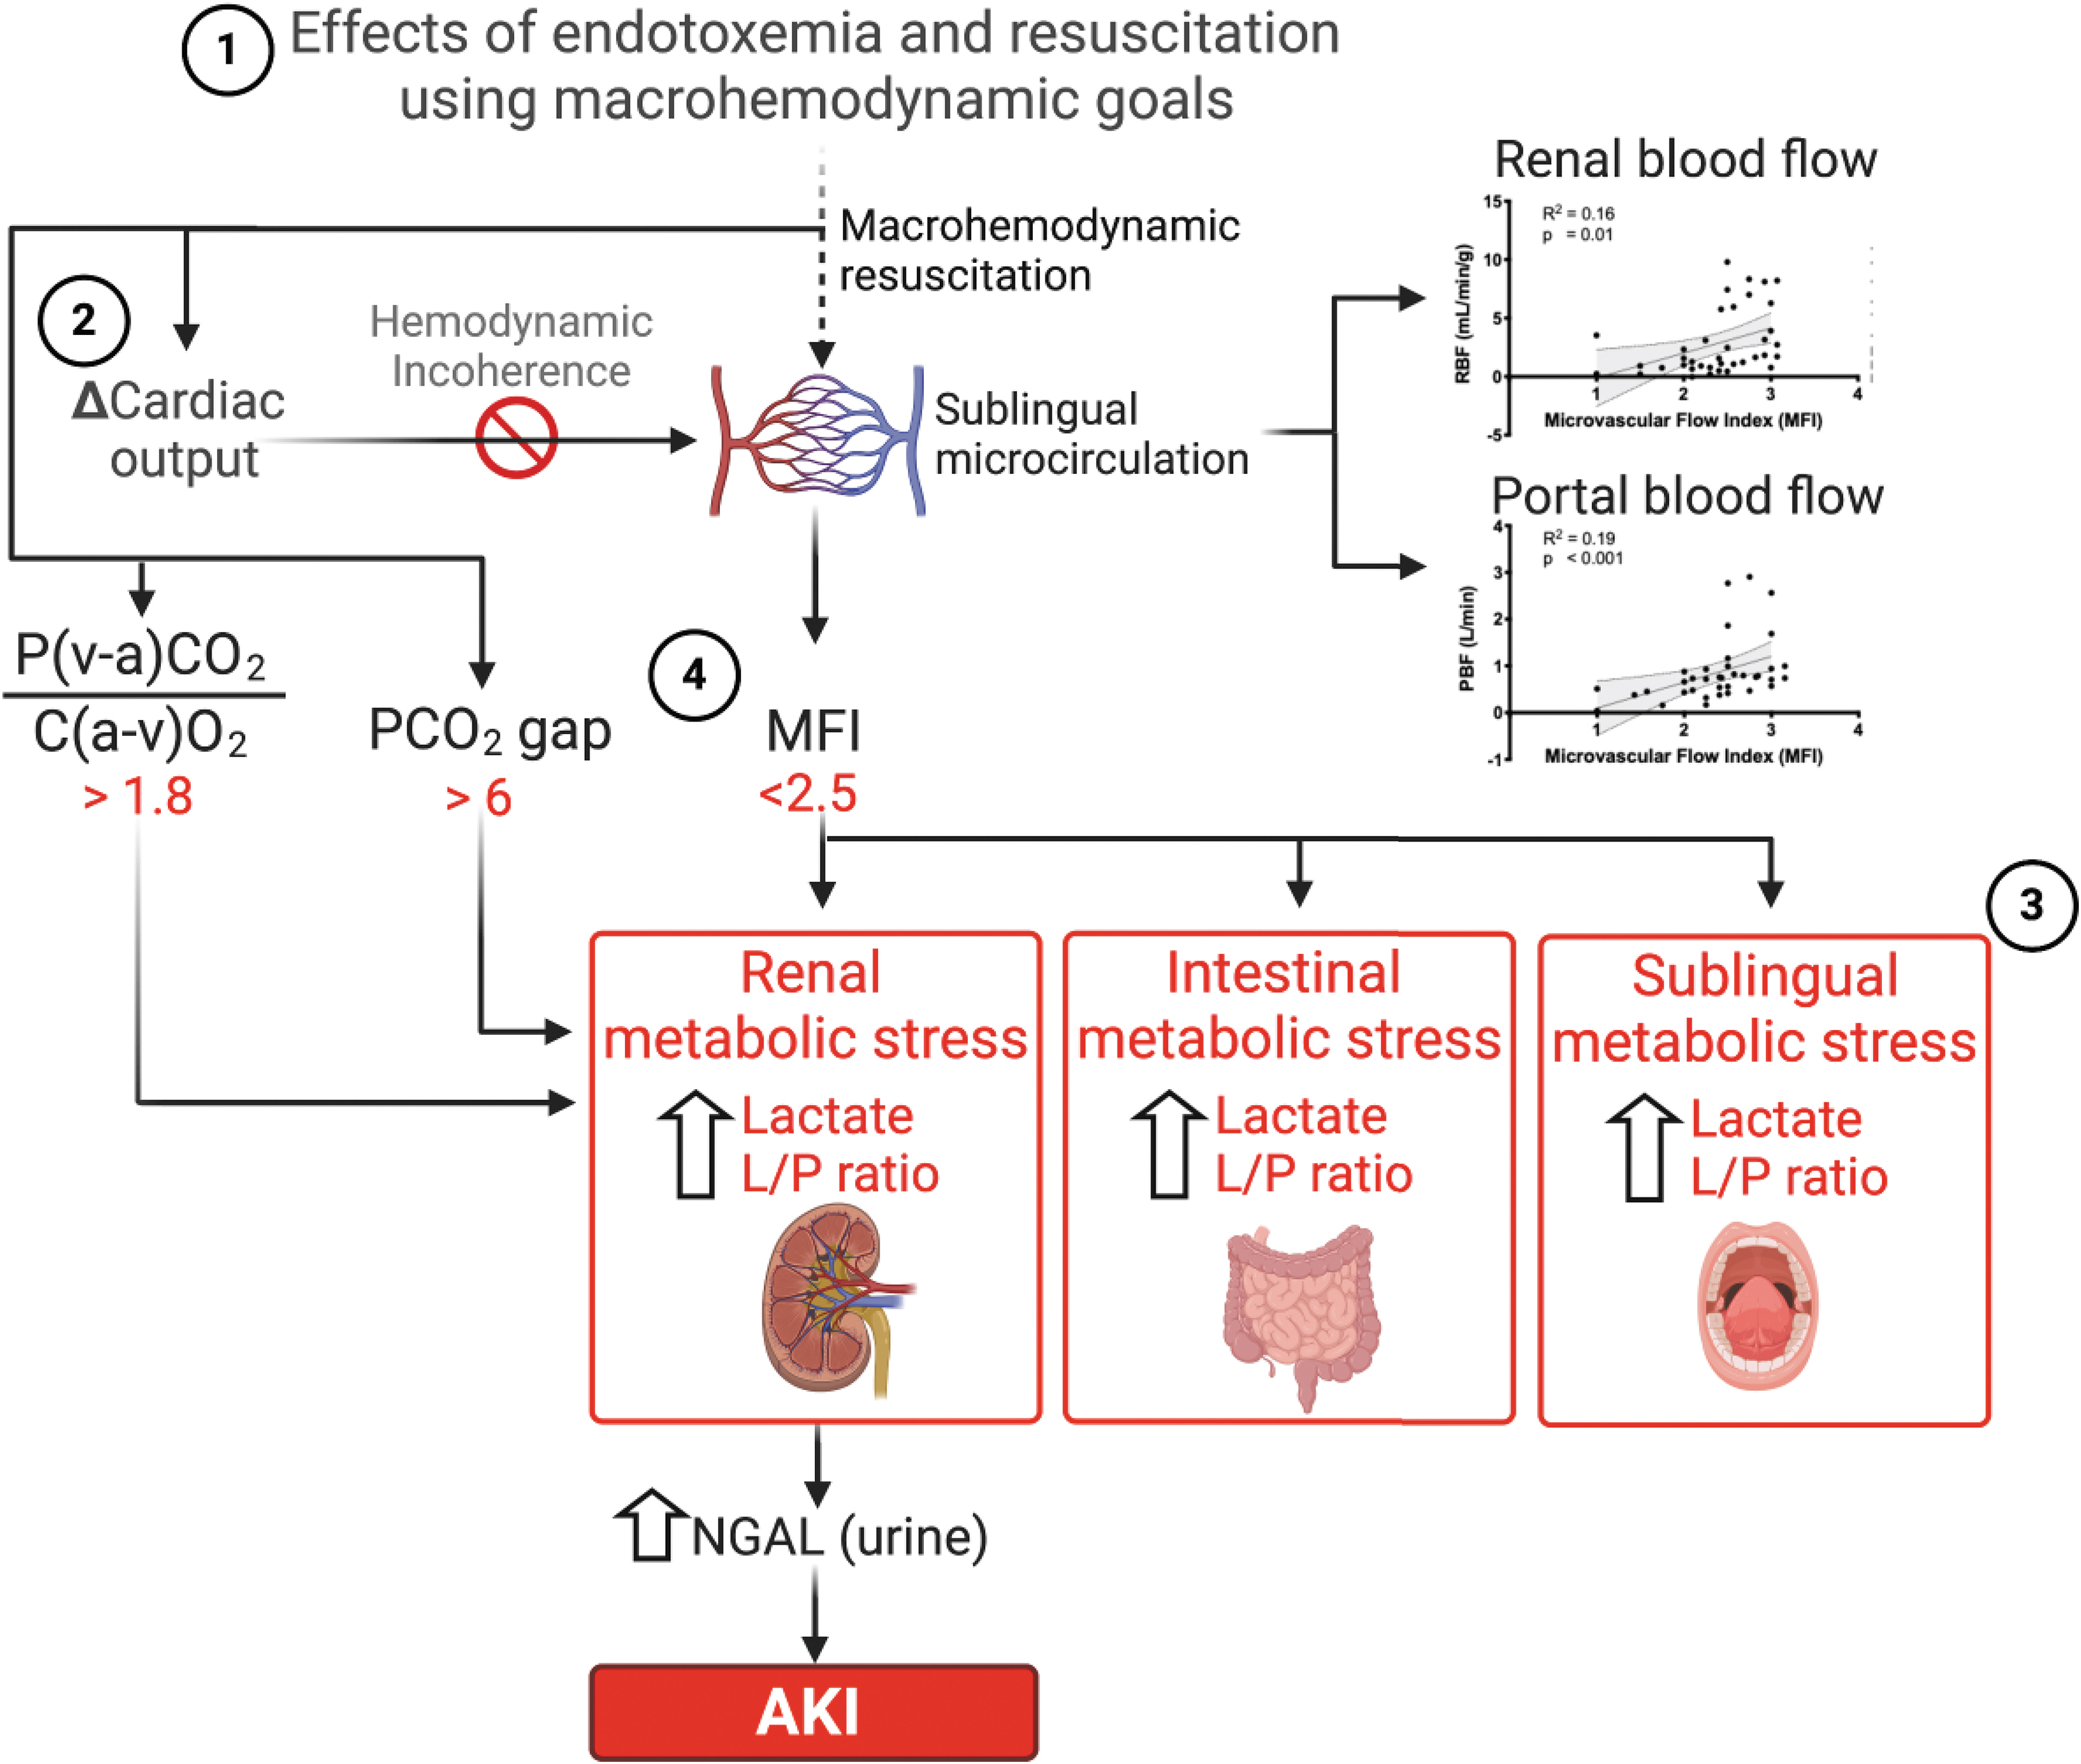
There are four main results of this study summarized in Figure 12. First, the early (immediate) initiation and successful resuscitation with fluids and vasopressors guided by macrohemodynamic goals ameliorated renal tubular injury, but did not prevent the development of AKI in an acute model of endotoxemic shock. Second, monitoring the response to resuscitation with macrohemodynamic parameters such as CO and MAP does not predict adequate response at the microcirculatory or tissue metabolic levels. Third, sublingual microcirculatory flow is associated with its local tissue metabolism and metabolic stress markers. Fourth, only MFI, PCO2gap, and PCO2/C(a-v)O2 are associated with, and can predict the development of renal metabolic stress and renal tubular cell injury.
Restoration of tissue perfusion to prevent organ injury remains the cornerstone of resuscitation of the septic patient (5). However, our study suggests that, beyond the initial salvage phase of acute resuscitation from endotoxemic shock, maintaining macrohemodynamic parameters was not sufficient to prevent tubular injury and renal dysfunction (Fig. 3A, B). Our results agree with previous animal studies, showing that AKI can occur in the absence of decreased RBF during (19), and with human observational (8) and randomized clinical studies (2, 17), showing that beyond the initial rescue phase, the use of macrohemodynamic goals to guide resuscitation is ineffective at best to improve outcomes.
Our study provides insights into the mechanisms that may explain the lack of association between the restoration of macrohemodynamic goals and prevention of tissue injury. First, we found that resuscitation to macrohemodynamic goals limited but did not prevent microcirculatory dysfunction during endotoxemia (Fig. 6). Second, endotoxemia induced a loss of hemodynamic coherence, whereby an increase in CO in response to resuscitation failed to translate into an increase in microvascular blood flow (Supplementary Fig. S8).
Our results are reminiscent of the data by van Genderen et al., who showed that fluid resuscitation failed to re-establish microcirculatory flow in animals exposed to endotoxic shock (35), and by Harrois et al., who demonstrated that restoration of macrohemodynamic parameters resulted in increased, no change, or decreased renal cortical renal perfusion in patients with sepsis (8). In addition, Legrand et al. showed that the macrohemodynamic response to fluid administration did not translate into a “renal response” in 54 critically ill patients with underlying oliguria (21). Absence of hemodynamic coherence is critical because current resuscitation strategies assume that microcirculatory flow will increase in response to the optimization of MAP and CO. Therefore, altered microcirculatory blood flow distribution could result in regional hypoperfusion and tissue injury independent of systemic macrohemodynamics (20).
Our data strongly suggest that restoration of microcirculatory blood flow (i.e., MFI >2.5), and not group allocation or systemic fluid responsiveness (Supplementary Fig. S8), is associated with lower renal cortical metabolic stress (i.e., higher renal L/P ratio; Fig. 9) and injury. Importantly, these findings do not necessarily mean that fluid and vasopressor resuscitation is not beneficial to organ perfusion. After all, every animal in our study and every patient in the clinical studies cited hereby were resuscitated with fluids and vasopressors. Rather, these data suggest that microvascular dysfunction leading to the dissociation between macro- and microcirculatory blood flow distribution during endotoxemia and sepsis represents an important mechanism of renal injury and AKI, and explains why macrohemodynamic parameters fail to predict tissue wellness.
Our data indicate that microvascular dysfunction is a marker of tissue metabolic stress and renal tubular injury, and that the effects of resuscitative maneuvers on tissue wellness depend on the restoration of microvascular flow. Our study confirms the assumption that sublingual tissue metabolism is associated with sublingual microcirculatory flow, and that microvascular dysfunction predicts sublingual tissue metabolic stress (Fig. 8). However, we found a lack of correlation between microcirculatory flow and markers of tissue metabolic stress in animals subjected to late but not early resuscitation (Supplementary Figs. S10 and S11). We interpret this finding as loss of autoregulation during nonresuscitated endotoxemic shock, and submit that endotoxemia not only induces loss of hemodynamic coherence but also profound decoupling of microvascular flow from tissue metabolism.
More importantly, our data demonstrate that the response of the sublingual microcirculation to endotoxemia and resuscitation can predict the development of tissue metabolic stress in the kidney, peritoneum, and liver, and the development of tubular injury as measured by NGAL (Fig. 5B). This is supported by the study of Lima et al. who showed that sublingual microcirculatory dysfunction during sepsis closely tracks renal microvascular abnormalities (22). However, Boerma et al. found that the sublingual MFI had no correlation with intestinal MFI early in the course of abdominal sepsis in 23 patients with a newly constructed intestinal stoma (3). Studies to better understand the relationship between sublingual and renal microcirculatory flow in humans are underway (36), which will determine the clinical utility of sublingual microvascular flow as a marker of organ perfusion.
Microcirculatory flow may serve as a marker of regional blood flow distribution to the liver and the kidney, rather than a measure of adequacy of global CO during endotoxemia. As regional blood flow distribution is determined by local tissue/organ metabolic demand, it is challenging to predict single organ perfusion based on CO monitoring. Our study shows that regional flow parameters such as renal and PBF correlated with sublingual microcirculatory flow, and therefore suggests that sublingual microcirculatory blood flow may be a better monitor of regional blood flow than of systemic CO.
Our study demonstrates that MFI <2.5, PCO2 gap >6, or the P(v-a)CO2/C(a-v)O2 ratio >1.8 define clinically relevant thresholds to predict microvascular-metabolic decoupling, lack of response to resuscitation, and development of tissue metabolic stress and injury. Our data closely resemble the results of clinical studies, showing that an increase in microvascular blood flow in response to fluid resuscitation only occurs in patients who have an MFI <2.6 (28, 29), that a PCO2 gap >6 in patients with SvO2 > 70% is associated with persistent hypoperfusion (32), and that a P(v-a)CO2/C(a-v)O2 ratio >1.8 predicts an increase in O2 consumption after a fluid challenge (25). Importantly, an MFI <2.5, a PCO2 gap >6, or a P(v-a)CO2/C(a-v)O2 ratio >1.8 were all associated with an increase in NGAL, suggesting that these parameters may inform on the status of organ function during resuscitation from septic shock.
Limitations
The most significant limitation of our study is the use of LPS to recapitulate the effects of distributive shock. Endotoxemia, though similar to sepsis, portrays significant differences that may limit the translation of our findings to the bedside. Nevertheless, LPS causes significant inflammation, similar to many conditions in septic patients. In addition, we used standard-of-care resuscitation, and therefore a strength is that we focused on understanding the biology behind the response to inflammation and resuscitation, and the effects on tissue metabolism. An additional strength is the use of a porcine model, which provides anatomic and physiologic proximity to human disease, allows for the use of organ support and monitoring strategies used in human patients, and permits repetitive blood and tissue sampling (7). Although swine present an increased pulmonary vasoconstrictive response to LPS challenge not seen in humans (7), our model accounts for this by using a priming dose of LPS before the actual challenge, which limits pulmonary pressure surges and avoids the confounding factor of acute right ventricular failure leading to the death of the animal.
We did not measure specific organ microcirculatory flow, and thus we cannot make conclusions about the adequacy of sublingual microcirculation in predicting organ microcirculatory dysfunction. Others have demonstrated, however, that the sublingual microcirculation tracks renal microcirculatory abnormalities (22). Our data align with these previous observations, as surprisingly, sublingual microvascular dysfunction was associated with markers of renal stress and tubular injury.
Conclusion
Early resuscitation from endotoxemic shock with the goal of maintaining preshock macrohemodynamic parameters ameliorated but did not prevent the development of renal tubular injury or AKI. Endotoxemia induces a loss of hemodynamic coherence and decoupling of microvascular flow from metabolic demand, potentially explaining an important injury mechanism. Disruption of sublingual MFI, PCO2 gap, and P(v-a)CO2/C(a-v)O2 ratio is associated with increased renal metabolic stress and tubular injury.
Materials and Methods
Animal preparation and surgical procedures
All experiments were performed in accordance with the National Institutes of Health Guidelines, the Animal Research: Reporting of In Vivo Experiments (ARRIVE) guidelines (18), and under protocols approved by the Institutional Animal Care and Use Committee of the University of Pittsburgh (IACUC protocol No. 13061614). Eighteen, Yorkshire-duroc female pigs, with average weight 30.6 kg (range 27.2–36.4 kg), were acclimatized for ∼7 days before the study. The animals were fasted overnight before the experiment but had free access to water. Animals were anesthetized with an intramuscular injection of 0.05 mL/kg body weight mixture of ketamine, xylazine, telazol (at a concentration of 100 mg/mL each), followed by endotracheal intubation and maintenance anesthesia with isoflurane 1.0% to 2.0% during the remainder of the experiment (10). Swine were ventilated with a mixture of air and oxygen, with an approximate fraction of inspired oxygen of 0.6 throughout the experiment. Body temperature was controlled using a warming pad underneath the animal, and central body temperature was monitored at all times through the pulmonary artery catheter. A 21-gauge catheter was inserted into an ear vein and 0.9% sodium chloride (NaCl) infusion at 30 mL/h plus 1 mL/kg/h for every kg >30 kg. Animals were instrumented with monitoring catheters as follows: under aseptic conditions, a pulmonary artery catheter (Vigilance catheter; Edwards LifeSciences, Irvine, CA) was inserted surgically via the internal jugular vein and into the pulmonary artery as determined by pressure waveform analysis. Subsequently, an 8 Fr femoral venous introducer and an 18-gauge triple lumen catheter were inserted into the femoral vein and artery, respectively, after cut-down, dissection, identification of the vascular structures, vascular control, and direct cut-down of the vessel. The catheters were secured using suture to adjacent tissues, and hemostasis was achieved by securing the lines to the vessel using suture. A suprapubic urinary catheter was surgically inserted.
A laparotomy was performed through a 10 cm incision starting at the xyphoid process. Five microdialysis catheters (30 mm long, 100 kDa molecular weight cutoff membranes, CMA 71; M Dialysis AB, Stockholm, Sweden) were inserted into skeletal muscle at the right inner thigh (Gracilis muscle), between loops of small bowel (peritoneum), in the right lobe of the liver (right anterior medial segment V), in the left renal cortex, and in the sublingual area, contralateral to the site of microcirculatory monitoring. The microdialysis catheters in the liver, kidney, skeletal muscle, and sublingual area were placed using a splitable needle (M Dialysis AB) as previously described (10). Two ultrasonic flow probes (Transonic Flowprobe S933, S928; Transonic Systems, Inc., Ithaca, NY) were then placed around the left renal artery and the portal vein.
Once all surgical procedures were finalized and hemostasis was achieved, the abdomen was partially closed to avoid insensitive fluid losses, and the animals were allowed to recover and stabilize for 1 h. All experiments were performed by the same group of investigators, the same surgical team, and in the same laboratory to avoid confounders.
Endotoxemic shock protocol and group allocation
The experimental model was a modification from Hatib et al. (9), and is shown in Figure 1. Baseline values were obtained 60 min after finishing all surgical procedures, at the end of the stabilization phase. Then, animals were treated with a priming dose of LPS starting at 2 mcg/kg/h for 10 min, and then increased to 4 mcg/kg/h until mean pulmonary pressure was doubled from baseline. This priming dose was instituted because administration of LPS at higher doses without priming resulted in massive mastocyte degranulation, hives, pulmonary hypertension, right ventricular dysfunction, and death. After 30 min of recovery from the priming dose, the protocol of LPS administration was started to induce the endotoxemic shock. LPS was started at a dose of 6 mcg/kg/h, and increased every 10 min to 12 mcg/kg/h and 24 mcg/kg/h. Infusion 24 mcg/kg/h was maintained for 25 min to complete a total of 45 min of LPS infusion in all animals. The LPS infusion was stopped in case the MAP would drop <30 mmHg. After LPS administration, a 90 min shock period was initiated. We randomized 18 animals into two groups. Eight pigs received late resuscitation starting at the end of the 90 min shock period. Ten animals received early resuscitation starting at the same time as the LPS infusion with the goal of maintaining MAP, CO, and RBF at baseline levels. The choice of group participation was decided by random card selection at the time of LPS exposure. Concealing group allocation was not possible given the experimental design.
Resuscitation protocol and time point definitions
Resuscitation was protocolized and guided by macrohemodynamic parameters. MAP, pulmonary pressure, CO, and SvO2 were monitored and were used to guide therapy as described previously (6). A stroke volume variation (SVV) >10% was used to define volume responsiveness. Goals of resuscitation were a MAP and SvO2 at or above baseline for each animal. The resuscitation protocol was based on the administration of intravenous fluids consisting of Lactate Ringer's (LR), vasopressors including norepinephrine and vasopressin, and inotropes including epinephrine. The resuscitation algorithm is shown in Supplementary Figure S1. In brief, if MAP or SvO2 were less than baseline, and SVV was >10%, fluid boluses of 500 mL of LR was administered. If by the second bolus, macrohemodynamic goals were not achieved and SVV was >10%, an additional bolus of 250 mL was administered, and norepinephrine infusion was started. The algorithm was cycled every 5 min providing fluids if SVV >10%, increasing the dose of norepinephrine if SVV <10% or fluids were not effective at increasing MAP and SvO2. Epinephrine was added as a second agent when norepinephrine at 0.3 mcg/kg/min was insufficient to achieve goals of resuscitation. Dobutamine would be started if the CO would decline below baseline. Resuscitation was stopped when MAP and SvO2 returned to the baseline measurement or >65 mmHg and ≥70%, respectively, whatever occurred first, at which time the goal of resuscitation time point was marked. Then, animals continued to be resuscitated to maintain these goals for 60 min. At 60 min after achieving goals of resuscitation, the study was ended, marking the end of study time point. At this point, anesthesia was increased, final blood and tissue microdialysis samples were taken, and the animals were euthanized.
Macrohemodynamic, microvascular flow, blood samples, and microdialysis samples were obtained during the following time points: baseline (60 min after finishing surgical instrumentation), LPS6 (beginning of LPS infusion at 6 mcg/kg/h), LPS12 (increase dose to 12 mcg/kg/h), LPS 24 (increase to 24 mcg/kg/h), LPS stop (when LPS infusion was stopped, and which marked the beginning of the “Shock period”), end of shock (at 90 min after stopping LPS infusion), goals of resuscitation (when MAP and SvO2 goals were achieved), and end study (60 min after the goals of resuscitation time point; Fig. 1).
Monitoring the microcirculation
The sublingual microcirculation was monitored using incident dark field spectroscopy using the CytoCam handheld camera (Braedius Medical, Huizen, Netherlands) using current recommendations (14). Twenty second videos were recorded at baseline, end of shock, goal of resuscitation, and end study time points, and at the same field of view throughout the entire experiment. Therefore, only one video per time point was collected. Analysis was performed using CCTools™ software version 1.7.12. TVD (mm2/mm2) was calculated as the total length of vessels divided by the total surface area analyzed. MFI was calculated as the average of the grid-based flow score per quadrant assigning the following flow scoring scale: stop [0], intermittent [1], sluggish [2], and normal flow [3]. PPV was calculated as the percentage of perfused vessels per total number of vessel crossings (100 × (total number of vessels − [no flow + intermittent flow])/total number of vessels). PVD (mm2/mm2) was calculated by multiplying vessel density (number of vessels crossing the lines divided by the total length of the lines) by PPV. Provided that hemoglobin level and oxygen saturation remain stable, oxygen transport depends on two key functions of the microvascular network: (i) convection, or the flow velocity with which the capillary transports O2 to the vicinity of metabolically active tissues; and (ii) diffusion, or the distance O2 has to travel from the vessel to the metabolically active cell, which depends on the number of capillaries per area of tissue or capillary density (13). Convection can be assessed by quantifying MFI and PPV, while diffusion can be assessed by quantifying TVD. The PVD is a composite parameter that reflects changes in the density of capillaries that carry nurturing flow (only capillaries with normal flow velocity).
Blood and microdialysis samples
Mixed venous and arterial blood samples were taken from the distal port of the pulmonary artery catheter and the femoral arterial line, respectively, at each time point. Samples were analyzed in the ABL-90™ blood gas analyzer (Radiometer, Copenhagen, Denmark), and the following outputs were obtained: pH, pCO2, pO2, SO2, hemoglobin, hematocrit, carboxyhemoglobin, methemoglobin, potassium, sodium, calcium, chloride, glucose, lactate, base excess/deficit, and bicarbonate.
Dextran 60 plus electrolyte (Plasmodex™; Meda AB, Stockholm, Sweden) was injected synchronously using microinjection pumps (CMA 107; M Dialysis AB) at 1 μL/min to perfuse microdialysis catheters, as previously described by us (10, 11). Samples were collected at each of the eight time points previously described, and analyzed for glucose, lactate, pyruvate, and glycerol using a microdialysis analyzer (Iscus; M Dialysis AB), and the L/P ratio was calculated.
Measurement of renal function and inflammation
Plasma creatinine (MAK080; Sigma-Aldrich, San Luis, MO), urine creatinine (ADI907030A; Enzo Life Sciences, Farmingdale, NY), urine NGAL (Ab207924; Abcam, Cambridge, United Kingdom), and plasma IL-6 (P6000B; R&D Systems, Minneapolis, MN) were measured at the eight time points using commercially available kits.
Monitoring of hemodynamic parameters and hemodynamic and oxygenation index calculations
Hemodynamic monitoring was done continuously during the experiment, using the following parameters and monitors. Systolic blood pressure (SBP), diastolic blood pressure (DBP) and MAP, and SVV using a right femoral arterial catheter; systolic pulmonary artery pressure, diastolic pulmonary artery pressure, MPAP, CVP, CO, SvO2, and SV, using a right internal jugular venous introducer and a pulmonary artery catheter; arterial oxygen saturation (SpO2) using a tail pulse oximeter; RBF and PBF were measured using ultrasonic flow probes (Transonic Flow probe S933, S928; Transonic Systems, Inc., Ithaca, NY) inserted around the left renal artery and the portal vein, respectively.
Calculation of hemodynamic and systemic oxygenation indices and surrogates of regional perfusion
The following standard formulae were used to calculate various indices:
The PCO2 gap and the P(a-v)CO2/C(v-a)O2 ratio have been suggested to be predictors of residual inadequacy of systemic blood flow and residual ischemia, respectively (23, 25, 33). A PCO2 gap >6 and a P(a-v)CO2/C(v-a)O2 ratio >1.8 have been previously shown to predict poor forward flow and systemic anaerobic metabolism (25), and therefore these thresholds will be used to assess regional responsiveness in comparison with macrohemodynamic, microcirculatory, or tissue metabolic parameters.
Statistical analysis
Analysis of microdialysis, microcirculatory and renal biomarker data was performed by an investigator blinded to group allocation. Student's t-test, analysis of variance (ANOVA), or Mann–Whitney U tests were used to compare macrohemodynamic, systemic oxygenation, microcirculation, and tissue metabolism parameters among groups when appropriate. Changes in time of the previously mentioned parameters were analyzed with repeated-measures ANOVA or fitting a mixed-effects model if there were missing values. Logistic regression was performed to test the utility of microcirculatory parameters to predict sublingual tissue metabolism, and multivariate logistic regression controlling for macrovascular parameters and group membership to predict microcirculatory dysfunction. Simple linear regression was used to establish correlations, and results are presented as determination coefficients (r2) and p-values. Exact logistic regression was used to identify predictors of microvascular dysfunction and tissue metabolic stress. The p-values are two tailed and Bonferroni-adjusted for multiple group comparison. Statistical significance was defined as p-value <0.05 (PRISM 8.4.1, GraphPad, San Diego, CA and STATA 14.0, StataCorp LP, College Station, TX).
Footnotes
Authors' Contributions
H.G., M.R.P., and B.S.Z. contributed to conception and design of the study. H.G., H.H., D.E., A.M.B., R.P., G.D.R-P., C.L.M-C., L.G., A.F., J-L.T., B.S.Z., and M.R.P. performed acquisition, analysis, and interpretation of data. H.G., H.H., D.E., A.M.B., R.P., G.D.R-P., C.L.M-C., L.G., A.F., J-L.T., B.S.Z., and MRP contributed to drafting or critical revision of the intellectual content, final approval of the article, and agreement to be accountable for all aspects of the work.
Acknowledgments
The authors thank Ms. Karen Nieri and the Center for Critical Care Nephrology for their support during the conduction of this study. In addition, H.G. thanks Dr. John Kellum for his invaluable discussions that contributed to clarifying the concepts hereby conveyed, and Dr. Can Ince for guiding and initiating him in the field of microcirculatory research.
Author Disclosure Statement
No competing financial interests exist.
Funding Information
This work was supported, in part, by National Institutes of Health grants 1K12HL109068-02 (H.G.), 1K08GM117310-01A1 (H.G.), and Edwards LifeSciences Unrestricted Research Award (M.R.P.).
Supplementary Material
Supplementary Figure S1
Supplementary Figure S2
Supplementary Figure S3
Supplementary Figure S4
Supplementary Figure S5
Supplementary Figure S6
Supplementary Figure S7
Supplementary Figure S8
Supplementary Figure S9
Supplementary Figure S10
Supplementary Figure S11
Supplementary Figure S12
Supplementary Figure S13
Supplementary Figure S14
Supplementary Figure S15
Supplementary Figure S16
Supplementary Figure S17
Supplementary Table S1
Supplementary Table S2
Abbreviations Used
References
Supplementary Material
Please find the following supplemental material available below.
For Open Access articles published under a Creative Commons License, all supplemental material carries the same license as the article it is associated with.
For non-Open Access articles published, all supplemental material carries a non-exclusive license, and permission requests for re-use of supplemental material or any part of supplemental material shall be sent directly to the copyright owner as specified in the copyright notice associated with the article.