
Abstract
Aims:
The pathophysiological mechanism(s) underlying non-alcoholic fatty liver disease (NAFLD) have yet to be fully delineated and only a single drug, peroxisome proliferator-activated receptor (PPAR) α/γ agonist saroglitazar, has been approved. Here, we sought to investigate the role of Regulator of G Protein Signaling 7 (RGS7) in hyperlipidemia-dependent hepatic dysfunction.
Results:
RGS7 is elevated in the livers of NAFLD patients, particularly those with severe hepatic damage, pronounced insulin resistance, and high inflammation. In the liver, RGS7 forms a unique complex with transcription factor ATF3 and histone acetyltransferase Tip60, which is implicated in NAFLD. The removal of domains is necessary for ATF3/Tip60 binding compromises RGS7-dependent reactive oxygen species generation and cell death. Hepatic RGS7 knockdown (KD) prevented ATF3/Tip60 induction, and it provided protection against fibrotic remodeling and inflammation in high-fat diet-fed mice translating to improvements in liver function. Hyperlipidemia-dependent oxidative stress and metabolic dysfunction were largely reversed in RGS7 KD mice. Interestingly, saroglitazar failed to prevent RGS7/ATF3 upregulation but it did partially restore Tip60 levels. RGS7 drives the release of particularly tumor necrosis factor α (TNFα) from isolated hepatocytes, stellate cells and its depletion reverses steatosis, oxidative stress by direct TNFα exposure. Conversely, RGS7 overexpression in the liver is sufficient to trigger oxidative stress in hepatocytes that can be mitigated via TNFα inhibition.
Innovation:
We discovered a novel non-canonical function for an R7RGS protein, which usually functions to regulate G protein coupled receptor (GPCR) signaling. This is the first demonstration for a functional role of RGS7 outside the retina and central nervous system.
Conclusion:
RGS7 represents a potential novel target for the amelioration of NAFLD. Antioxid. Redox Signal. 38, 137–159.
Innovation
G protein coupled receptor (GPCR) signaling pathways regulated by Regulator of G Protein Signaling 7 (RGS7) have been previously described in tissues such as the brain and retina where RGS7 protein levels are the highest. Our work demonstrates that, though expressed at low levels in tissues such as the liver, RGS7 can be induced by cytotoxic stimuli in multiple hepatic cell types. Importantly, RGS7 possesses key G protein-independent actions in hepatocytes where RGS7 forms a complex with Tip60 and ATF3 and drives oxidative stress, release of inflammatory and profibrotic cytokines, and cell death. This is the first demonstration of a functional role for RGS7 in the liver and it represents the first indication that RGS7 has signaling actions away from the cell membrane, where a neuron-specific membrane anchor (R7 family binding protein [R7BP]) tethers the protein in the brain.
Introduction
A quarter of the world's population suffers from non-alcoholic fatty liver disease (NAFLD) (26). Though NAFLD is relatively benign, over time it can progress to non-alcoholic steatohepatitis (NASH), cirrhosis, or hepatocellular carcinoma (HCC), contributing to NAFLD-dependent morbidity and mortality. Oxidative stress, insulin resistance, hyperlipidemia, and chronic inflammation associated with obesity and type II diabetes mellitus (T2DM) contribute to NASH development by exacerbating metabolic stress, triggering hepatocyte death, and prompting immune cell infiltration and hepatic stellate cell (HSC)-dependent fibrosis (16).
Globally, only a single drug, the peroxisome proliferator-activated receptor (PPAR) agonist saroglitazar, has been approved for use in NAFLD. In addition, the highly diverse rate of disease progression and lack of clear biomarkers for those at the highest risk for NASH have stymied efforts to expand therapeutic options beyond lifestyle interventions, whose success relies on patient compliance (1).
Though the breakdown of hepatic fatty acid (FA) metabolism and the accumulation of toxic lipid species is critical to the pathogenesis of NAFLD, mortality in NAFLD and NASH patients correlate best with the fibrosis stage (13). Deposition of extracellular matrix components (e.g., collagen) in the liver is driven by a transition of resident HSCs, which usually contain vitamin A and lipid stores, into proliferative, inflammatory, and chemotactic myofibroblasts. This process is often secondary to hepatocyte injury or death and macrophage activation and requires the secretion of key cytokines and adipocytokines into the liver microenvironment (73).
Among these factors, tumor necrosis factor α (TNFα), released from hepatic macrophages, drives hepatic fibrosis by promoting the survival of activated HSCs (62). TNFα signaling further exacerbates fibrosis by promoting apoptosis in neighboring hepatocytes (59). In humans, high TNFα is associated with an increased risk of NAFLD development (61, 65), and polymorphisms in the TNFα gene are enriched in NAFLD patients (74). Notably, liver fibrosis in advanced NAFLD positively correlates with serum TNFα levels (44). In murine models of NAFLD, genetic deletion of TNFα or use of TNF-receptor-1 (TNFR1) inhibitors decreased hepatic fibrosis (32, 76). Though reversible in initial stages, left unchecked chronic fibrotic remodeling can eventually lead to distortion of the hepatic architecture, portal hypertension, and cirrhosis, thus increasing the risk of HCC and mortality.
The atypical G protein β5 (Gβ5) forms a co-stabilizing complex with members of the R7 family of regulators of G protein signaling (RGS) proteins, which includes RGS6, RGS7, RGS9, and RGS11 (5). Global knockout (KO) of Gβ5 results in hepatic hypertrophy and altered lipid deposition in mice (78). Gβ5 is expressed in the liver and has also been shown to drive acetaminophen-dependent hepatic fibrosis, cell loss, oxidative stress, and inflammation via novel G protein-independent actions (63). However, the R7 family member(s) present in the liver and acting with Gβ5 to carry out these functions have yet to be elucidated.
Though RGS9 expression is restricted to the striatum and retina, the remaining members of the R7 family are more ubiquitously expressed. RGS6, for example, is expressed at low levels in the liver but can be induced by alcohol, and RGS6−/− mice display decreased alcohol-dependent liver damage (68), a phenotype attributed to the ability of RGS6 to increase oxidative stress, mitochondrial dysfunction, and apoptosis across multiple cell types (28, 51, 80). It remains unclear whether other members of the R7 family are expressed in the liver and, if so, whether these proteins display unique or redundant hepatic functions.
In this work, we demonstrate that RGS7, upregulated in hepatic tissue from NAFLD patients and in response to both hyperlipidemia and hyperglycemia, drives hepatocyte death, inflammation, HSC activation, and fibrosis by facilitating TNFα production and signaling in multiple hepatic cell types.
Results
RGS7 forms a complex with ATF3 and Tip60 required for palmitic acid-dependent oxidative stress and cell death
Though expressed at high levels in the brain, R7 family RGS proteins and their requisite binding partner Gβ5 are detectable in the liver (68, 78). Hepatic messenger RNA (mRNA) levels of RGS7 are ∼30% seen in the brain but increase twofold in response to either hyperlipidemia or hyperglycemia (Supplementary Fig. S1A). Indeed, utilizing an antibody specific for RGS7 (Supplementary Fig. S1B), we were able to detect RGS7 protein in human and murine liver tissue and hepatic cell lines (Supplementary Fig. S1C).
Subcellular localization of RGS7-Gβ5 complexes is controlled by reversible palmitoylation and binding to a membrane anchor, R7 family binding protein (R7BP) (11, 64). However, R7BP expression is confined to the central nervous system (53) and, in its absence, R7 family RGS proteins remain in the cytoplasm or shuttle to the cell nucleus (45, 60, 81). Indeed, in hepatocytes, RGS7 is detectable at the membrane as well as in the cytosolic and nuclear fractions (Supplementary Fig. S1D). These data suggest that RGS7 might possess unique nuclear functions in non-neuronal cell types, as has been shown for R7 family member RGS6, which interacts with multiple nuclear proteins, including DNMT1, Tip60, and ATM (27, 48, 50).
We noted that RGS7 expression across hepatic cells and tissues correlated with the expression of histone acetyltransferase Tip60 and the stress-responsive transcription factor ATF3 (Supplementary Fig. S1C, E) were previously shown to form a stabilizing complex in cancer cells (8, 9). Indeed, RGS7 forms a co-immunoprecipitable complex with Tip60 and ATF3 in hepatocytes (Fig. 1A). Deletion of the RGS7's RGS domain compromised the interaction between RGS7 and either Tip60 or ATF3 (Fig. 1B and Supplementary Fig. S2).
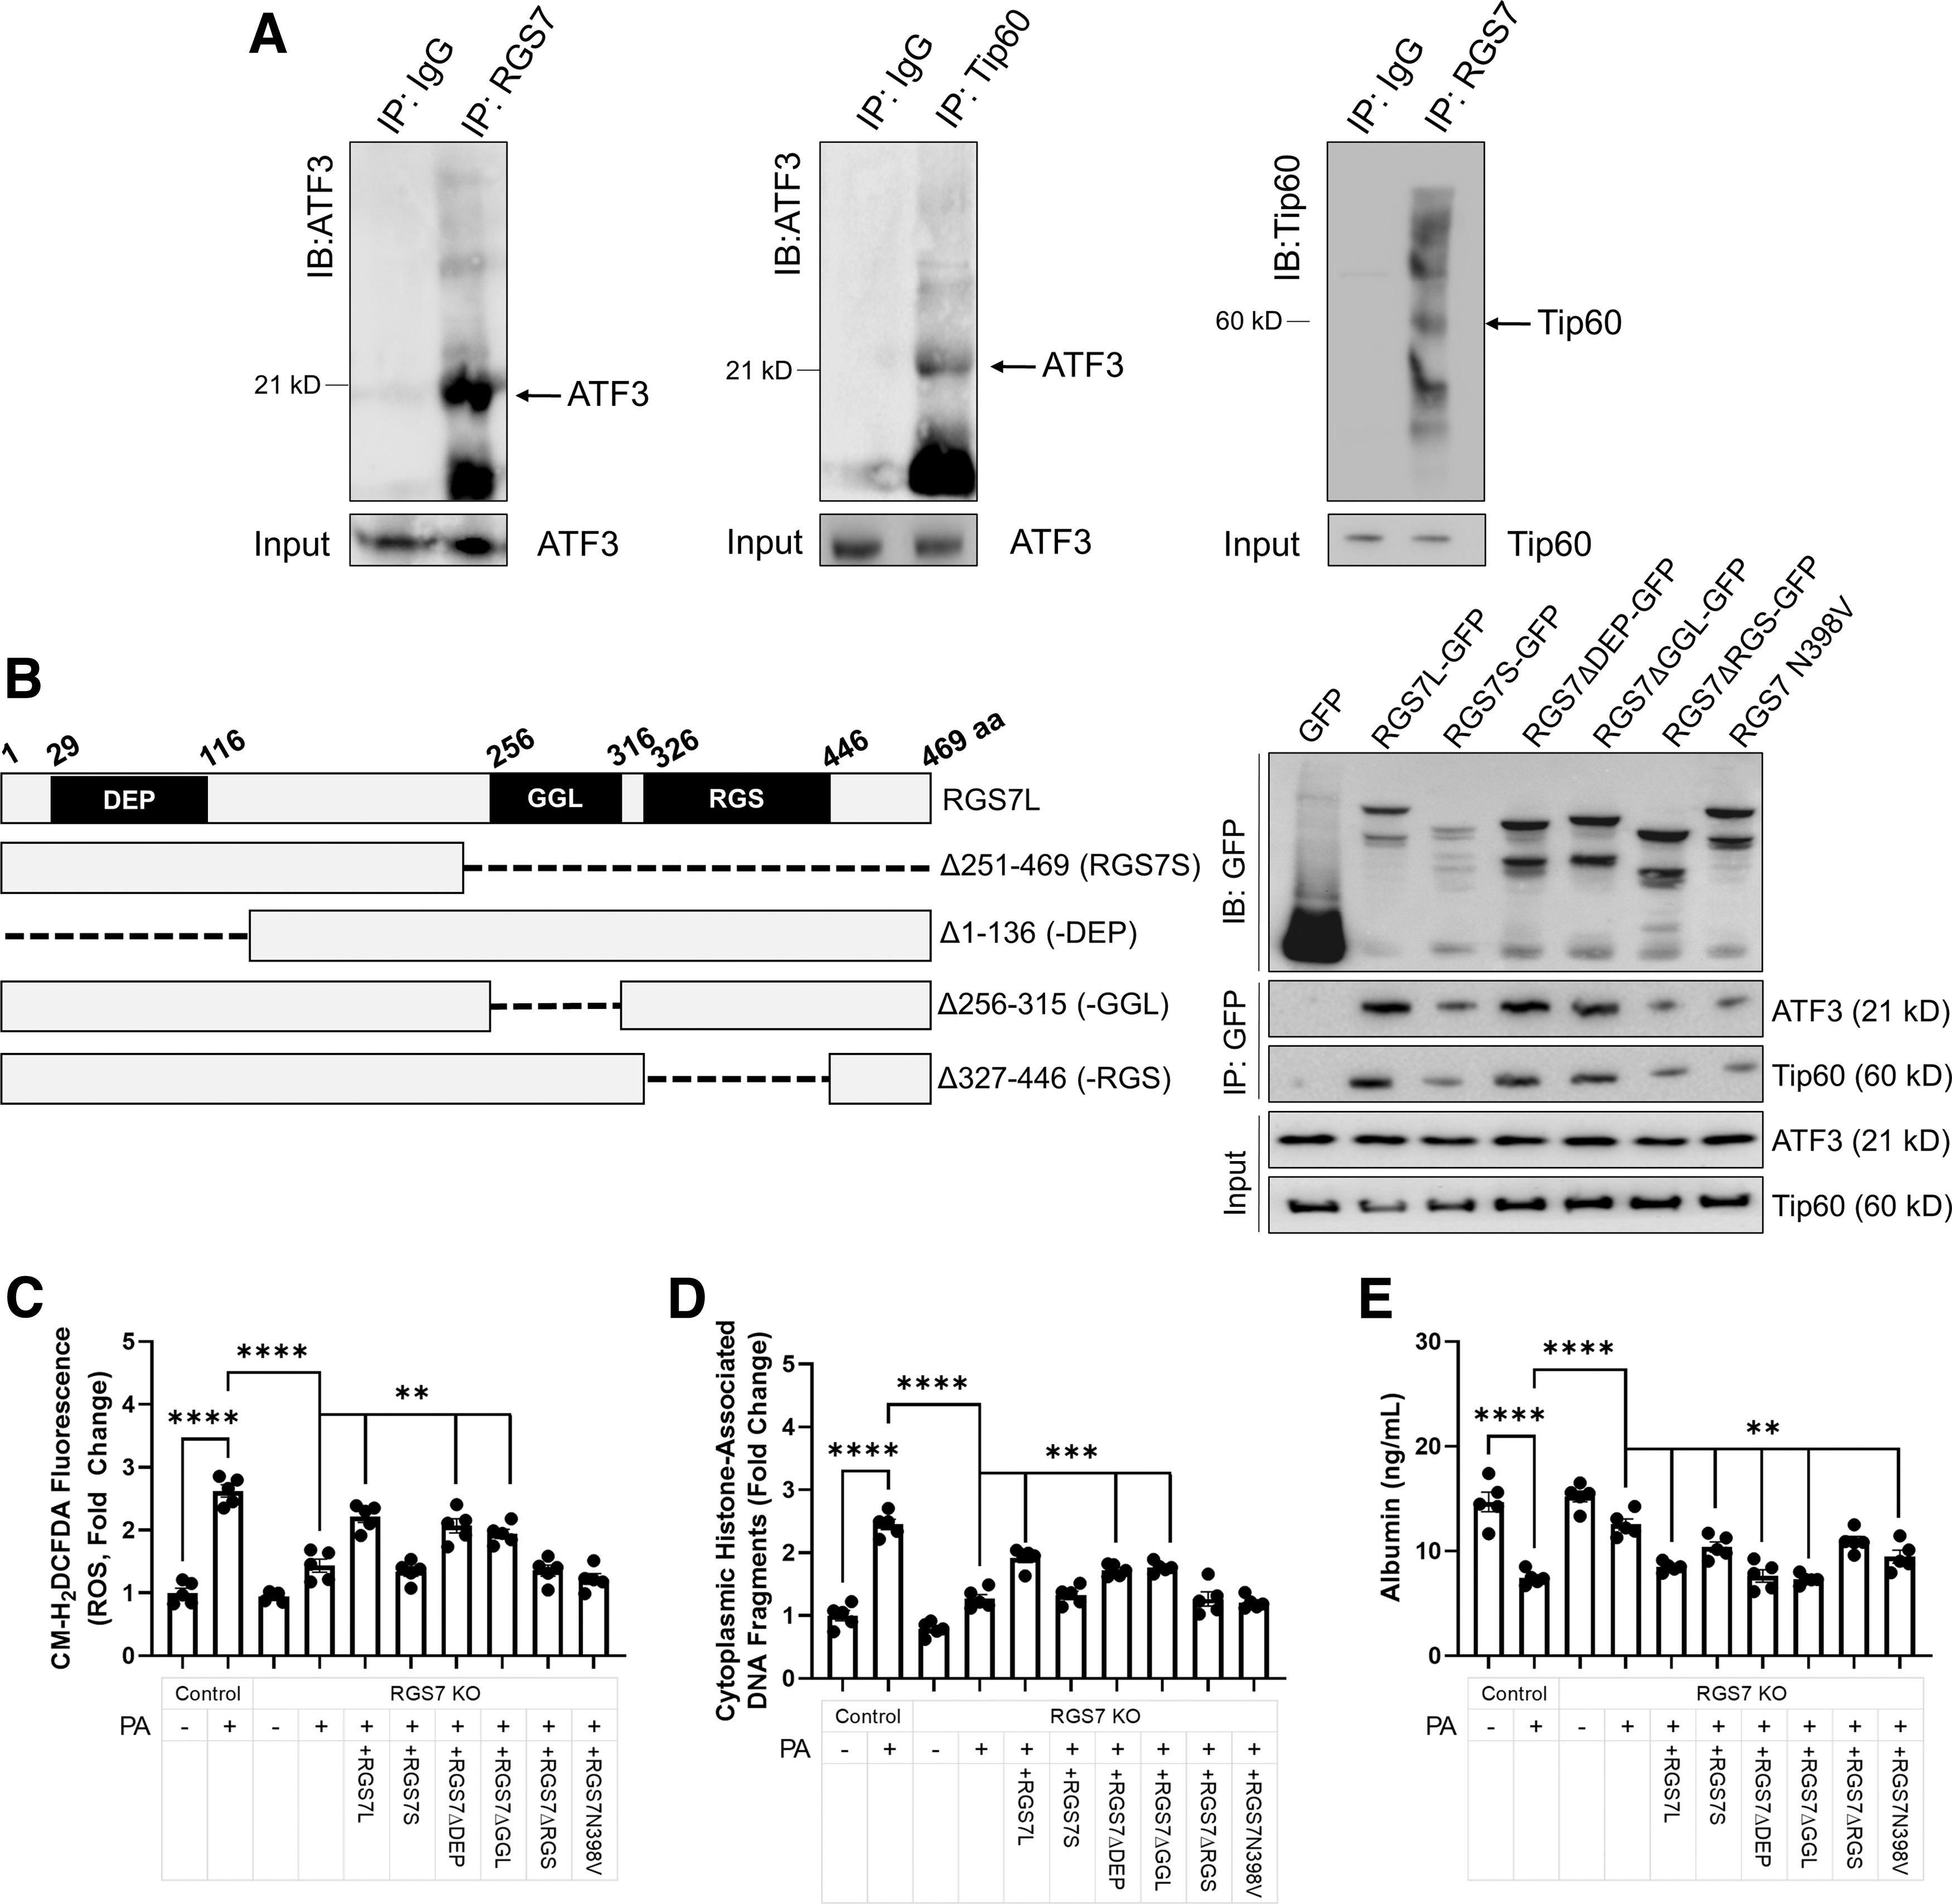
As RGS7 protein content in HepaRG cells most closely resembled what we observed in vivo, we utilized this cell line for many studies seeking to dissect the functional relevance of RGS7 in the liver. We hypothesized, based on the demonstrated role for the Tip60/ATF3 in cell fate determination after exposure to cytotoxic stimuli (9, 15), that RGS7 might function to promote cell death in response to lipotoxic stress in hepatocytes. To test this hypothesis, we generated and validated an RGS7 KO human hepatocyte cell line (HepaRG) via CRISPR/Cas9-dependent targeted DNA excision (Supplementary Fig. S3).
The deletion of RGS7 decreased palmitic acid (PA)-dependent reactive oxygen species (ROS) generation (Fig. 1C) and cell death (Fig. 1D) by ∼60%–70% and allowed for the maintenance of albumin production (Fig. 1E). Only RGS7 constructs fully capable of ATF3/Tip60 binding restored PA-driven cytotoxicity to levels observed in cells with intact RGS7 expression (Fig. 1C–E). These data provide preliminary evidence that RGS7 plays a critical role in hepatic cellular stress responses and indicate that the RGS domain is required for these actions.
RGS7, Tip60, and ATF3 are upregulated in NAFLD, particularly in patients with severe disease, pronounced insulin resistance, and marked inflammation
Next, to investigate the potential importance of RGS7 in liver disease, we acquired human liver biopsy samples from patients with NAFLD or healthy controls (Supplementary Table S1). Serum alanine aminotransferase (ALT), aspartate aminotransferase (AST), and triglycerides were significantly elevated in individuals with NAFLD as were measures of insulin resistance (fasting blood glucose, insulin, hemoglobin A1c [HbA1c], homeostatic model assessment for insulin resistance [HOMA-IR]) (Supplementary Table S1) consistent with the known comorbidity between NAFLD and T2DM (16). These clinical measures were associated with disrupted liver architecture, fibrosis, cell loss, and inflammation (Fig. 2A and Supplementary Fig. S4A, B).
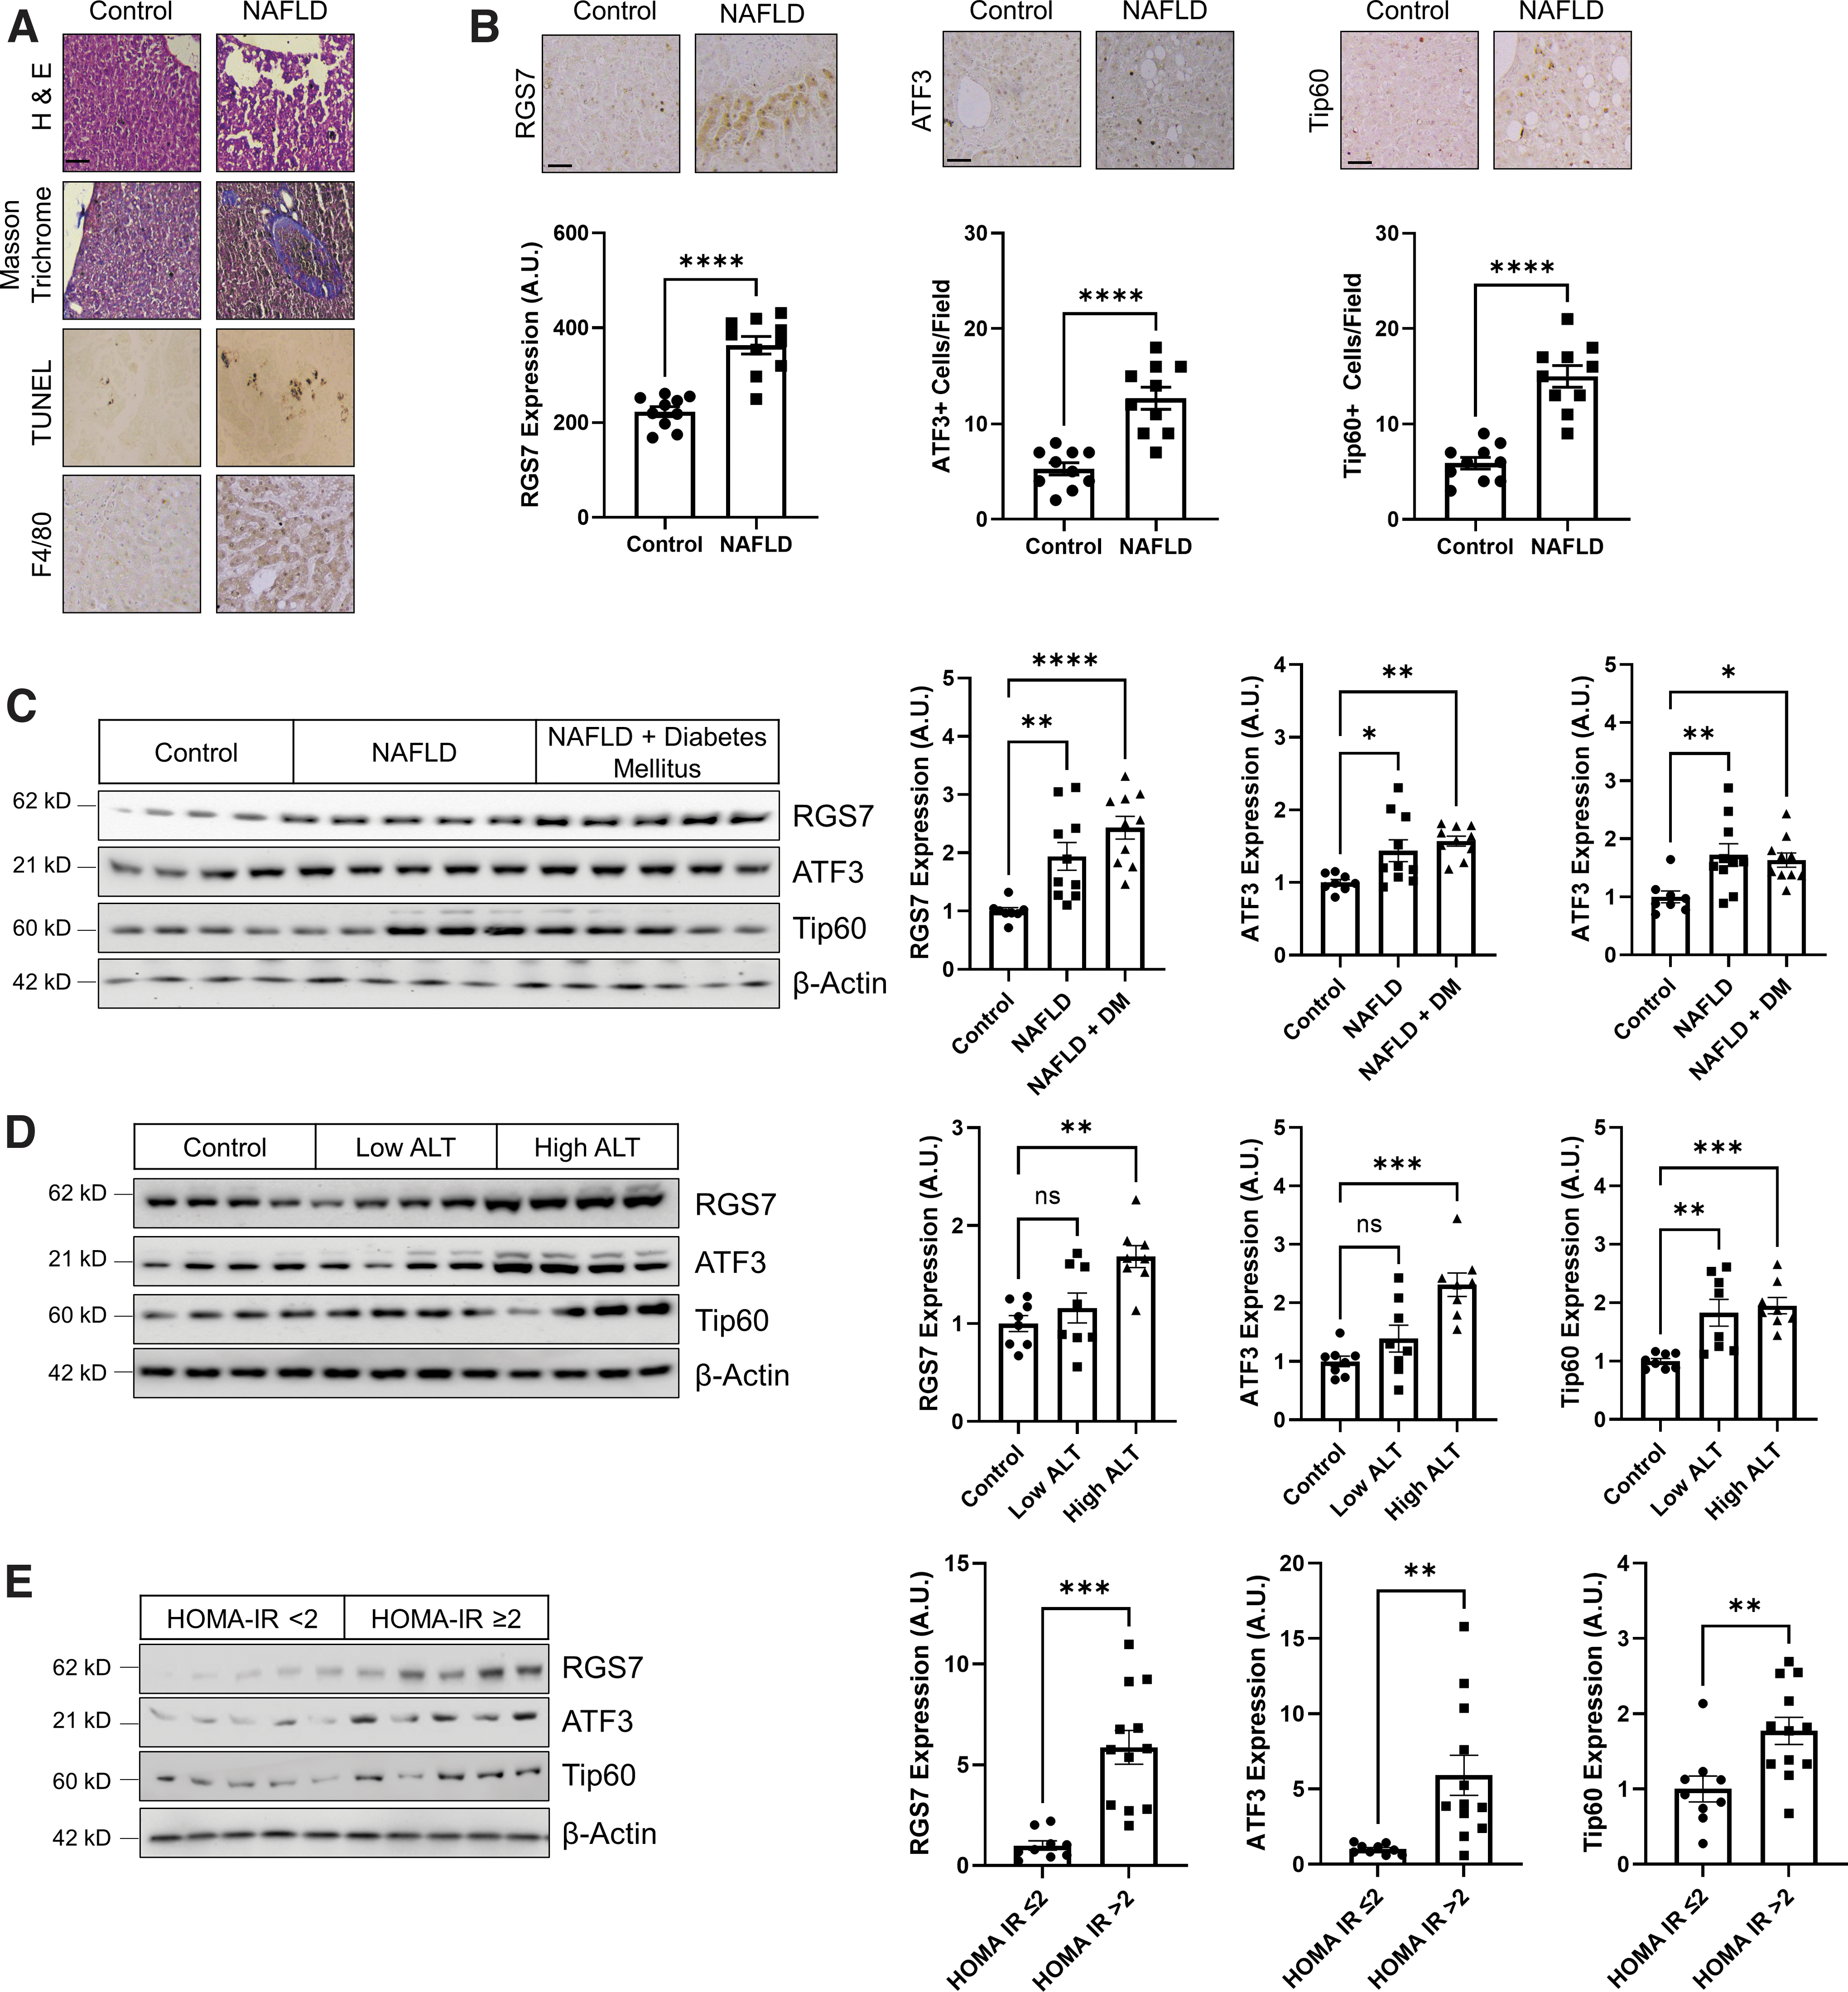
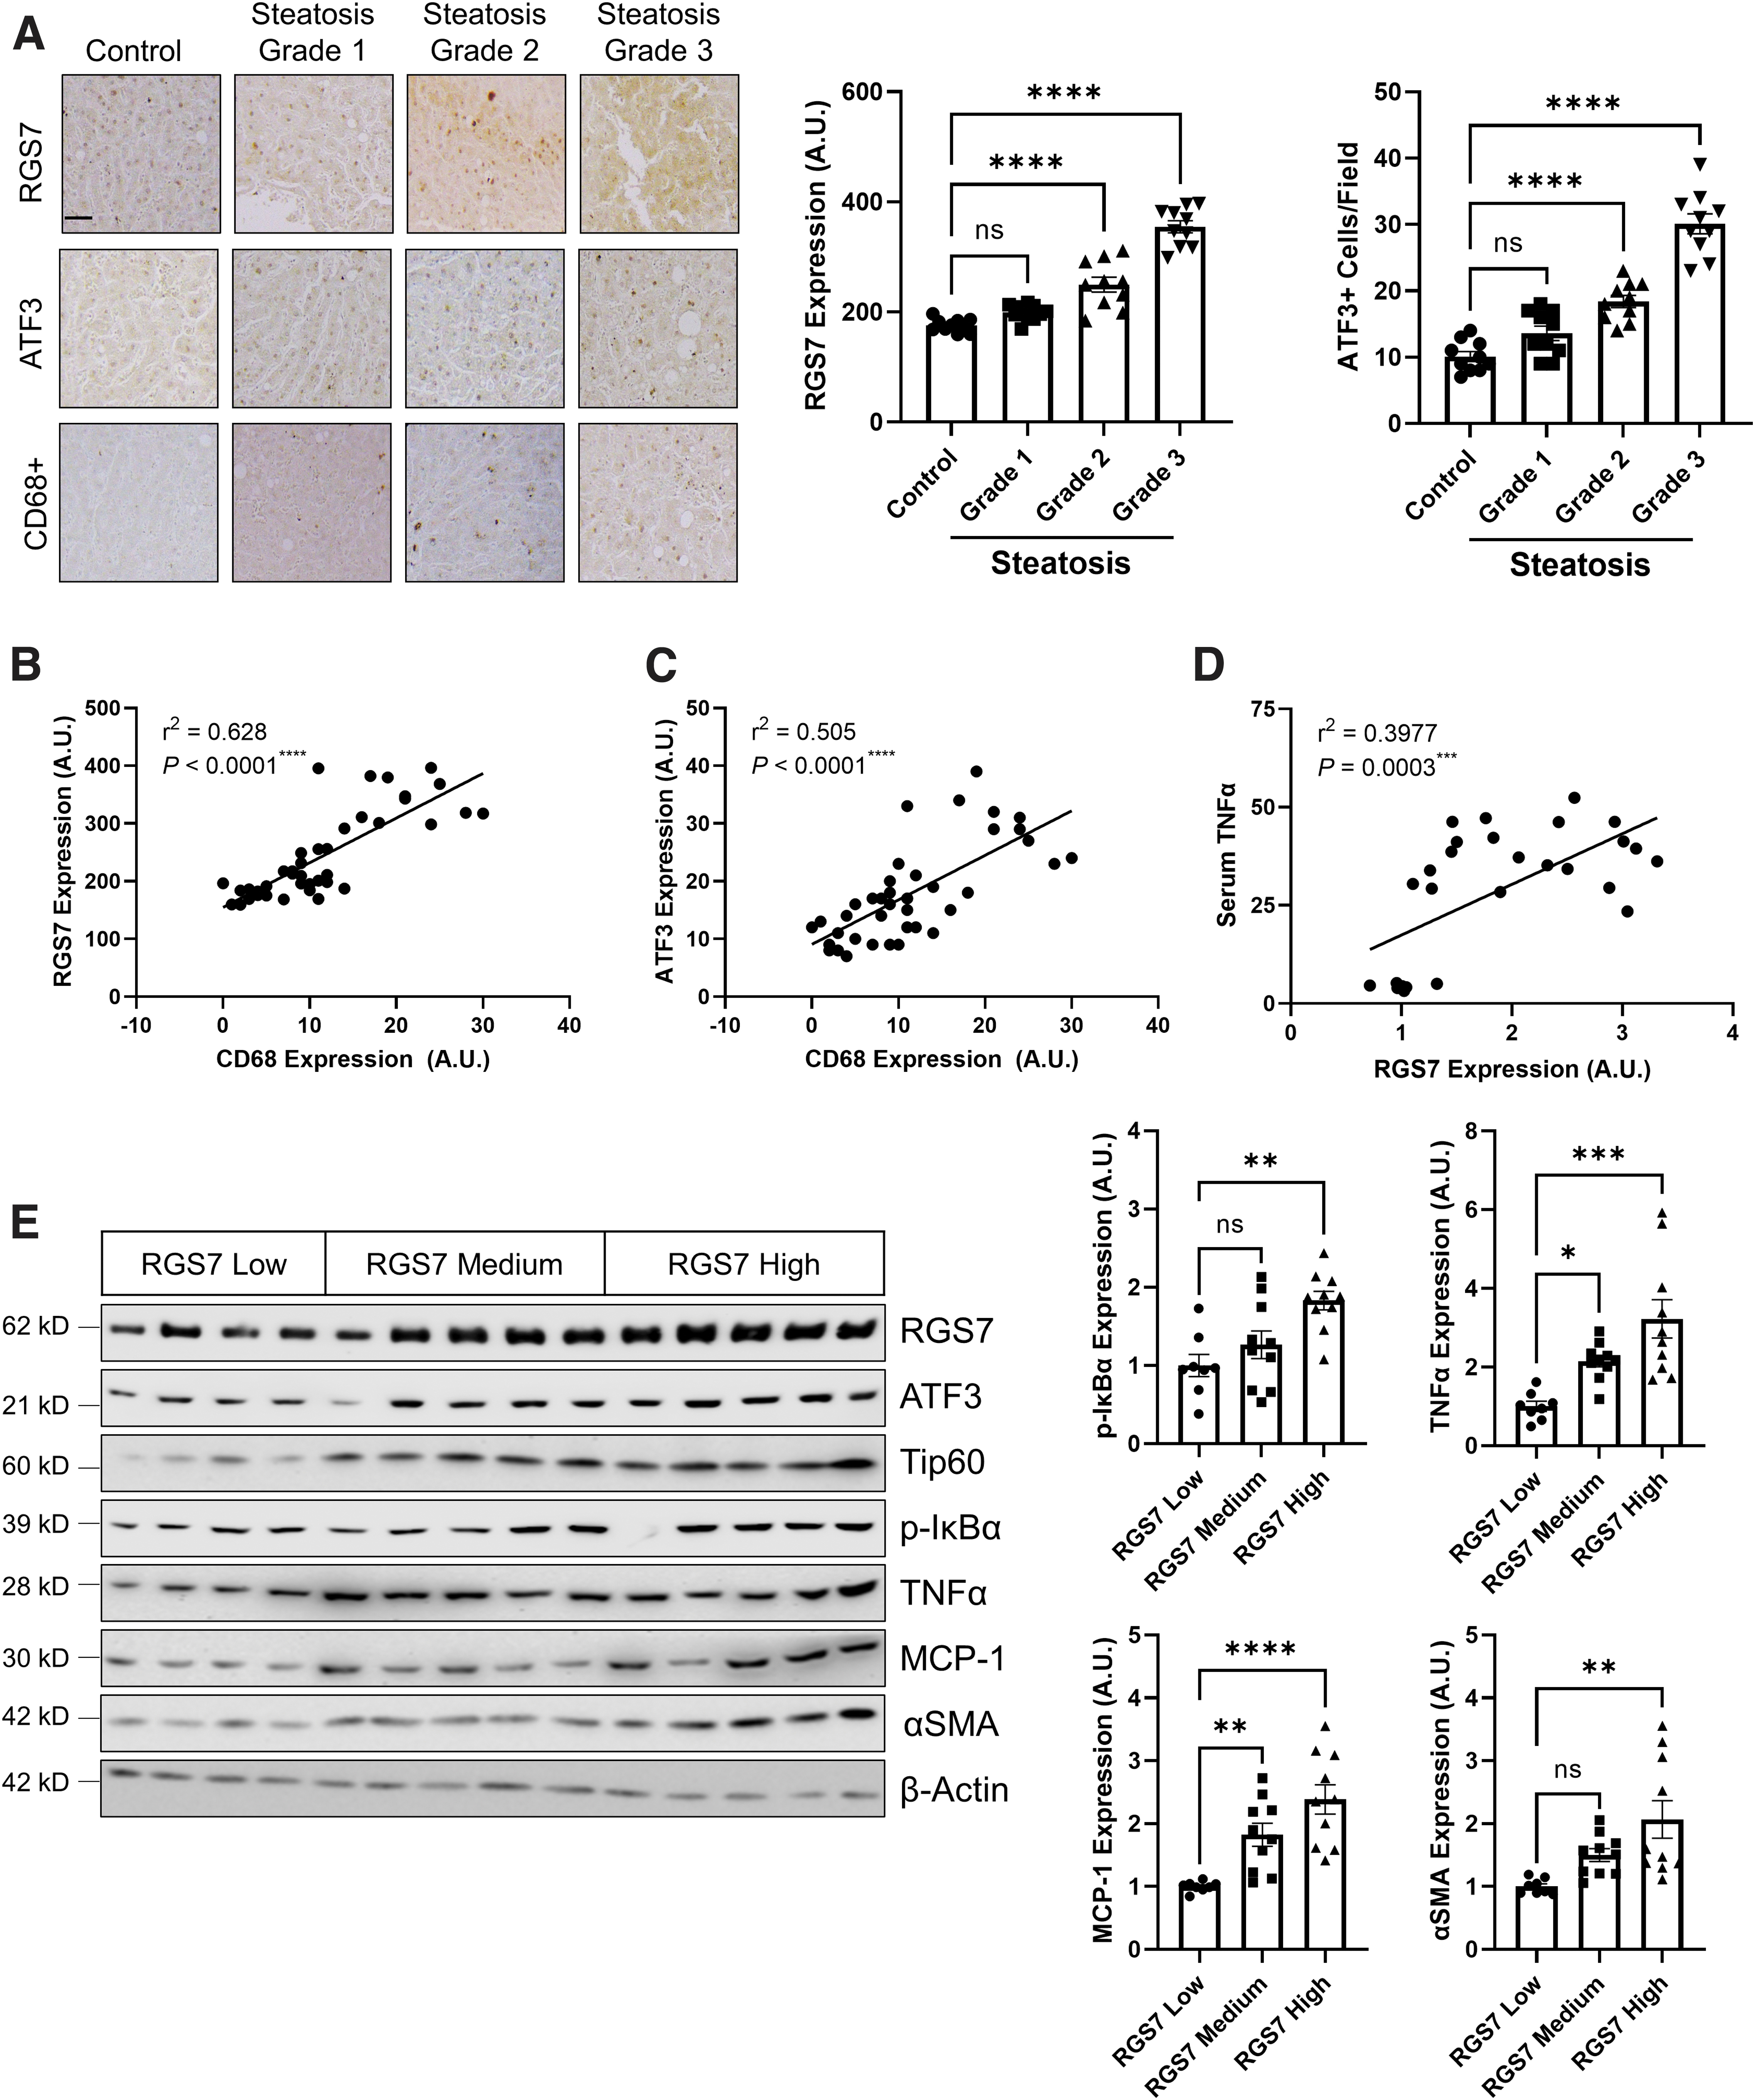
Notably, protein levels of RGS7, ATF3, and Tip60 were elevated in NAFLD patients by approximately twofold compared with healthy controls as measured by immunohistochemistry (Fig. 2B) or immunoblotting (Fig. 2C). RGS7, ATF3, and Tip60 expression was particularly high in patients with severely compromised liver function (Fig. 2D), comorbid diabetes mellitus (Fig. 2C), or high insulin resistance (Fig. 2E). Similarly, RGS7, ATF3, and Tip60 expression increased linearly with steatosis grade (Fig. 3A and Supplementary Fig. S6A).
Elevations in RGS7/ATF3/Tip60 were accompanied by aberrations in markers for FA metabolism (e.g., fatty acid synthase, FAS; sterol regulatory element-binding protein 1, SREBP1; stearoyl-CoA desaturase, SCD1), cellular stress (e.g., C/EBP homologous protein, CHOP), inflammation (e.g., phospho-nuclear factor of κ light polypeptide gene enhancer in B-cells inhibitor α, p-IκBα; TNFα; interleukin 1β, IL-1β; monocyte chemoattractant protein-1, MCP-1; vascular cell adhesion protein 1, VCAM-1; L-selectin), and energy balance (e.g., leptin) (Supplementary Figs. S4C, S5, and S6A).
We noted that, across steatosis grades, both RGS7 and ATF3 were highly correlated with CD68, a marker for macrophage infiltration (Fig. 3B, C), and RGS7 correlated with serum TNFα levels in NAFLD patients (Fig. 3D). When we stratified our NAFLD samples based on RGS7 protein level (low, medium, or high), we were unsurprised to detect particularly high levels of ATF3 and Tip60 in samples with the highest RGS7 immunoreactivity (Supplementary Fig. S6B). In addition, high RGS7 was associated with elevated inflammatory (p-IκBα, TNFα, and MCP-1) and fibrotic (α smooth muscle actin, αSMA) markers (approximately two- to threefold) (Fig. 3E).
These data served as an impetus for our investigations into the functional role of RGS7 in hyperlipidemia-dependent liver damage, with a particular focus on the importance of RGS7 in the inflammation- and fibrosis-dependent transition from NAFLD to NASH.
Hepatic RGS7 knockdown protects against high-fat diet-induced liver steatosis
We were able to recapitulate key clinical features of NAFLD in mice through chronic high-fat diet (HFD) feeding, including the twofold increase in RGS7/ATF3/Tip60 expression (Fig. 4A), which correlated with both steatosis grade (Supplementary Fig. S7A) and CD68 staining (Supplementary Fig. S7B). Indeed, RGS7 levels in HFD-fed mice were virtually identical to what we observed in livers of NAFLD patients. The introduction of RGS7-targeted small hairpin RNA (shRNA) in the liver decreased RGS7 protein by >50% and was sufficient to prevent the induction of both ATF3 and Tip60 (Fig. 4A).
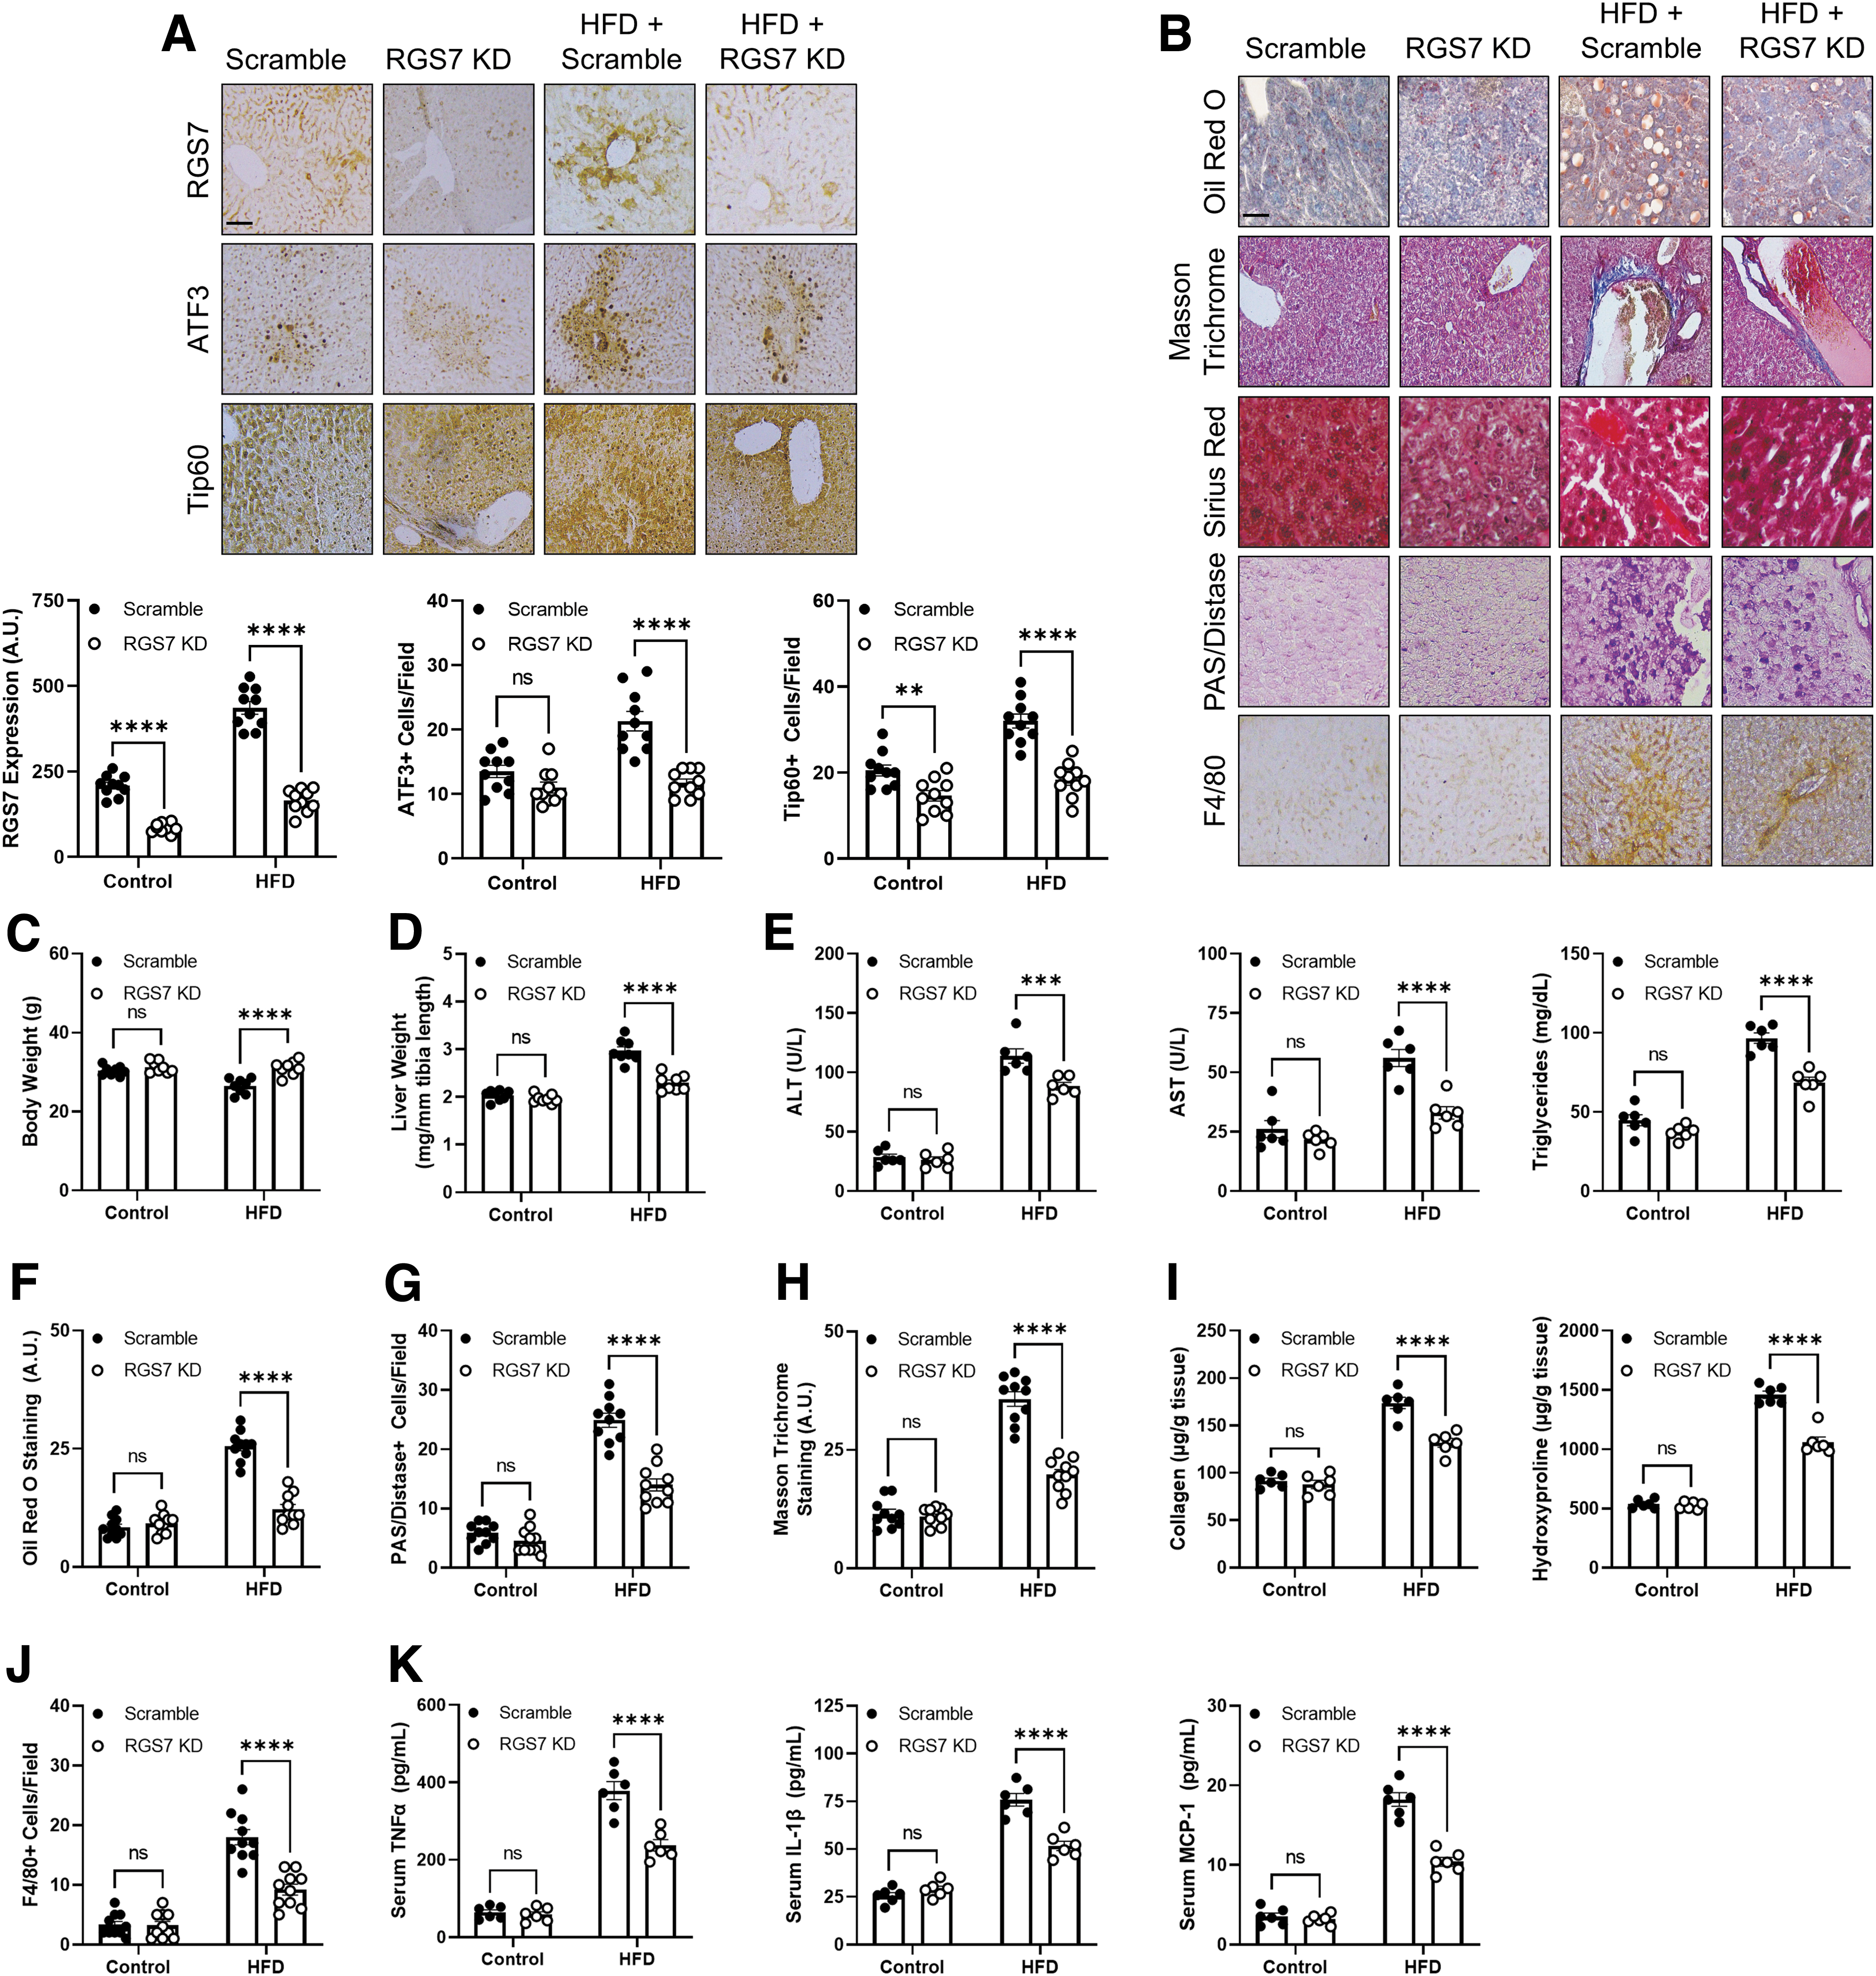
RGS7 knockdown (RGS7 KD) also improved key pathological endpoints, preventing weight loss (Fig. 4C), liver hypertrophy (Fig. 4D), compromised liver function (Fig. 4E), lipid deposition (Fig. 4B, F), glycogen accumulation (Fig. 4G), fibrosis (Fig. 4B, H, I), and inflammation (Fig. 4B, J). The impact of RGS7 depletion ranged from ∼50% improvement to a near-complete mitigation of the impacts of HFD feeding depending on the specific measure. In addition, RGS7 KD prevented HFD-dependent production of inflammatory cytokines (e.g., TNFα, IL-1β, and MCP-1) in hepatic tissue (Supplementary Fig. S8A) and decreased serum levels by ∼50%–60% (Fig. 4K). Although body weight initially increased in HFD-fed mice, at the end of the experiment body weight dropped below baseline in scramble shRNA-treated controls, which was likely due to the animals' overall declining health.
The FAs serve as substrates for the generation of lipotoxic species in the liver, which, in turn, trigger hepatocyte dysregulation. The HFD feeding resulted in perturbations in the expression of several proteins involved in FA synthesis (FAS, SCD1), oxidation (PPARγ; peroxisomal acyl-coenzyme A oxidase 1, ACOX-1; carnitine palmitoyltransferase 1, CPT-1; long-chain Acyl-CoA dehydrogenase, LCAD), and uptake (fatty acid transport protein 2, FATP2; long-chain fatty acid CoA ligase 1, ACLS1) as well as lipogenesis (SREBP1) and insulin sensitivity (insulin receptor substrate, IRS pY941, and pS307).
Importantly, hepatic RGS7 KD largely reversed these changes (Fig. 5A). This translated to an overall protective impact of RGS7 depletion on redox balance and metabolic flux in livers from HFD-fed mice. First, RGS7 KD decreased global oxidative stress by ∼50% (Fig. 5B) and almost completely prevented mitochondrial ROS generation (Fig. 5C) in HFD-fed mice. Liver FAs are primarily metabolized via β-oxidation in the mitochondria or peroxisomes. Hepatic RGS7 depletion partially ameliorated the hyperlipidemia-driven impairment in total (Fig. 5D) and mitochondrial (Fig. 5E) fatty acid oxidation (FAO). Liver lactate and pyruvate levels (Fig. 5F), as well as the ratio of NADH/NAD+ (Fig. 5G) were also partially restored after RGS7 KD in the livers of HFD-fed mice.

Finally, in addition to protecting the liver from hyperlipidemia-dependent damage, RGS7 KD had a modest, but significant, impact on insulin sensitivity in HFD-fed mice (Fig. 5H). Notably, we could largely recapitulate the impacts of lipotoxic stimuli (PA) on RGS7/ATF3/Tip60 expression as well as the induction of markers of inflammation, cellular stress, fibrosis, and FA dysregulation in human hepatocytes (Supplementary Fig. S9A) or the human hepatocyte cell line HepaRG (Supplementary Fig. S9B), indicating that the impacts of RGS7 KD proceed, at least in part, via hepatocyte-intrinsic mechanism(s).
Liver-specific RGS7 KD protects against hyperglycemia-dependent liver damage
Given our observation linking high RGS7 expression to clinical metrics for insulin resistance (Fig. 2E), we next assessed the impact of RGS7 KD on hepatotoxicity resulting from the pancreatic β-islet cell toxin streptozotocin (STZ), which results in a diabetic state that is characterized by hypoinsulinemia and hyperglycemia (21). STZ triggered liver steatosis, fibrosis, and glycogen accumulation in mice similar to results obtained in the HFD model (Supplementary Fig. S10A). In addition, protein levels of RGS7, ATF3, and Tip60 increased by twofold in the livers of STZ-exposed mice as measured by histochemical (Supplementary Fig. S10B) or biochemical (Supplementary Fig. S8B) means.
Although body weight decreased by 10%–15% in mice administered STZ, this effect was largely absent in hepatic RGS7 KD mice (Supplementary Fig. S10C). Similarly, RGS7 KD reversed STZ-dependent liver hypertrophy (Supplementary Fig. S10D), lipid accumulation (Supplementary Fig. S10E), fibrosis (Supplementary Fig. S10F), and excess glycogen (Supplementary Fig. S10G). RGS7 KD in the liver also improved glucose tolerance in STZ-treated mice (Supplementary Fig. S10E). Finally, the impacts of STZ on inflammatory markers were ameliorated in animals lacking STZ-dependent RGS7 upregulation (Supplementary Fig. S7B).
Together, these data indicate that RGS7 is a critical mediator of liver damage resulting from either hyperlipidemia-driven obesity or diabetic insulin resistance, two risk factors contributing to the global rise in NAFLD.
RGS7 KD replicates and extends the therapeutic effects of saroglitazar in livers of HFD-fed mice
The year 2020 saw the release of the world's first drug for NASH, with the approval of the PPAR agonist saroglitazar in India. We were curious to evaluate the impact of saroglitazar on RGS7 expression and RGS7-dependent mechanism(s) after HFD feeding. Saroglitazar failed to prevent RGS7 or ATF3 upregulation in HFD-fed mice but did partially restore Tip60 levels (Fig. 6A). Both saroglitazar and RGS7 KD decreased TNFα and PPARγ expression, but only RGS7 KD impacted the fibrosis marker αSMA (Fig. 6A).
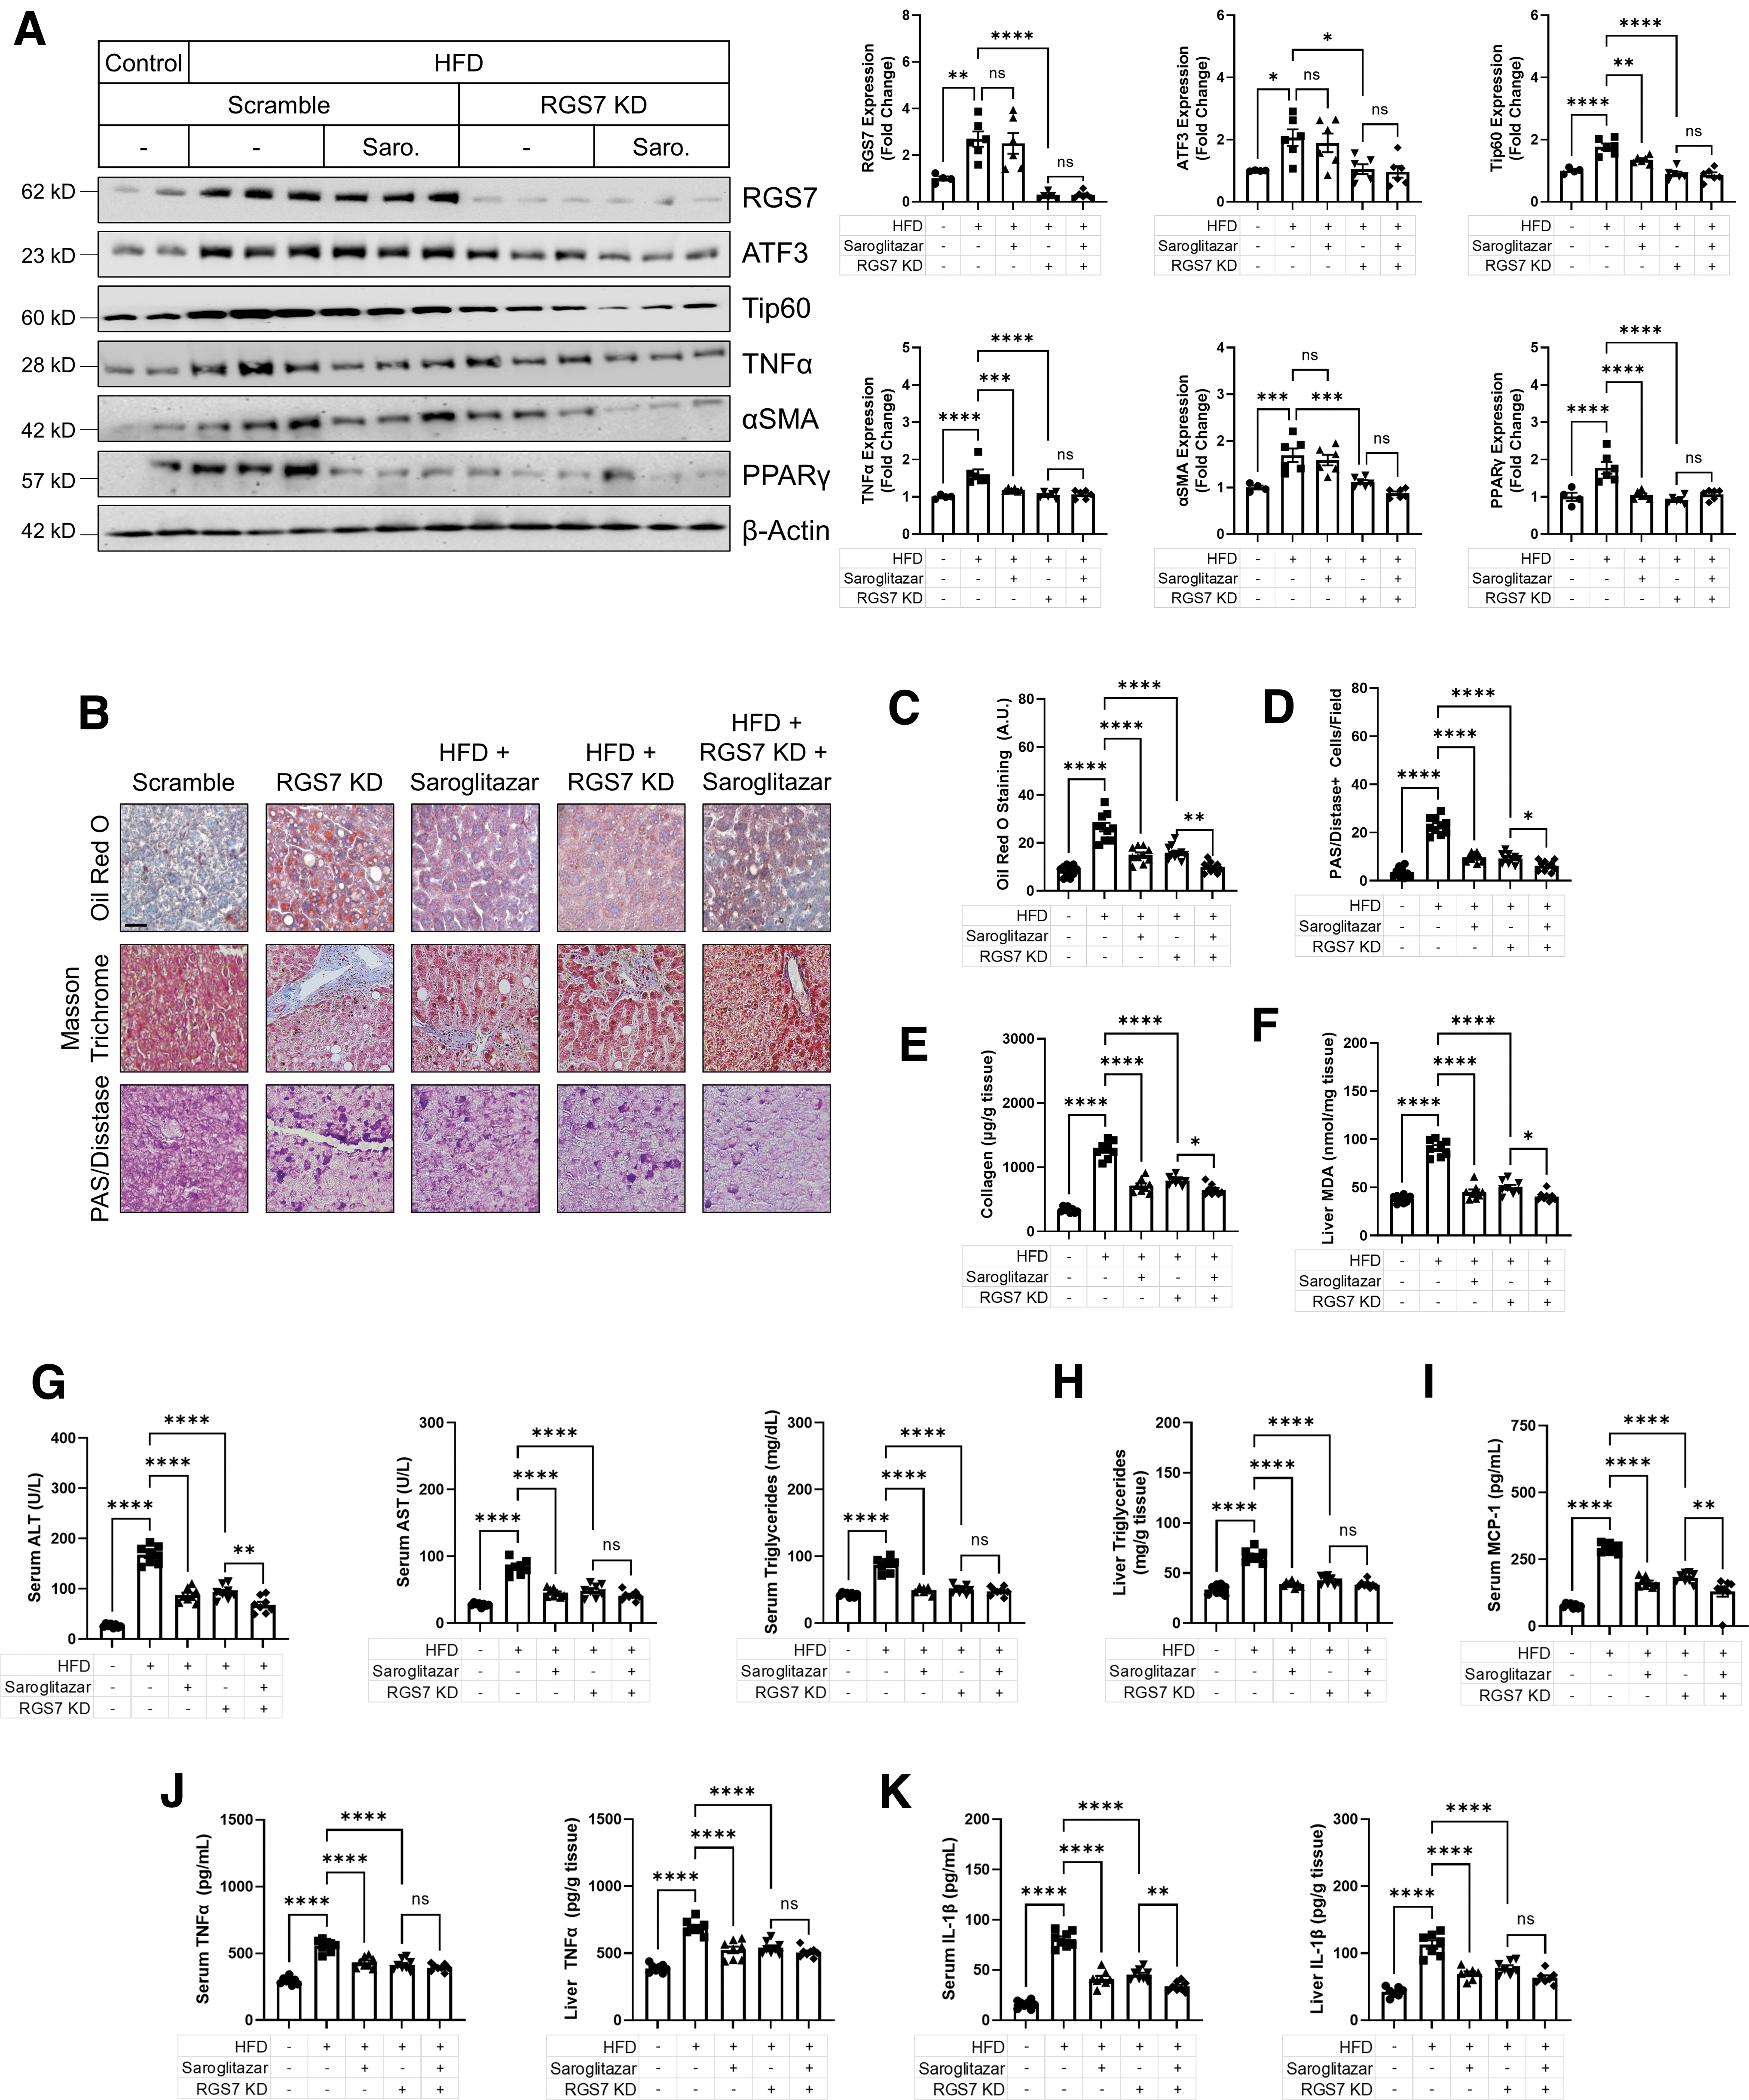
The impacts of saroglitazar on steatosis (Fig. 6C), glycogen (Fig. 6D), collagen (Fig. 6E), and oxidative stress (Fig. 6F) were comparable to the results obtained after hepatic RGS7 KD, with the combination of interventions often providing additive protection. Similarly, RGS7 KD and saroglitazar improved serum markers of liver function (Fig. 6G), liver triglycerides (Fig. 6H), serum MCP-1 (Fig. 6I), and both liver and serum levels of the inflammatory cytokines TNFα (Fig. 6J) and IL-1β (Fig. 6K) in HFD-fed mice. Thus, RGS7 KD proved as or more effective than the only drug approved for the treatment of NASH.
RGS7 participates in a feed-forward mechanism contributing to oxidative stress, mitochondrial dysfunction, and cell death in murine hepatocytes
The PA stimulates a twofold upregulation of RGS7 in HepaRG cells (Supplementary Fig. S11A) and isolated murine hepatocytes (Supplementary Fig. S12A), an impact we could also achieve by exposing HepaRG cells directly to hydrogen peroxide (H2O2) (Supplementary Fig. S11A). These data led us to hypothesize that RGS7 upregulation is triggered by oxidative stress. Indeed, we could successfully prevent PA-dependent RGS7 accumulation by scavenging either H2O2 (Supplementary Fig. S11B) or superoxide (Supplementary Fig. S11C).
RGS7 also contributes to PA-dependent ROS generation, as RGS7 depletion decreased total (Supplementary Fig. S12B) and mitochondrial (Supplementary Fig. S12C) ROS in PA-treated murine hepatocytes by ∼50%, effects that could be overcome by the restoration of RGS7 expression. RGS7 KD also partially prevented PA-dependent loss of mitochondrial membrane potential (ΔΨM) (Supplementary Fig. S12D), mitochondrial Ca2+ accumulation (Supplementary Fig. S12E), and cell death (Supplementary Fig. S12F), translating to decreased ALT and AST production in PA-treated murine hepatocytes (Supplementary Fig. S12G). Thus, RGS7 upregulation represents a feedback amplification signal induced by ROS, functioning to propagate the impacts of ROS accumulation on mitochondrial function, and ultimately driving the cell toward a catastrophic fate.
RGS7 is upregulated in PA-treated murine and human HSCs and drives oxidative stress, cell loss, and collagen production
RGS7 is expressed in murine HSCs, and the human HSC cell line LX2 and RGS7 is upregulated in these cells in response to PA (Supplementary Fig. S13A, B). Similar to the results obtained in hepatocytes, we noted that RGS7 KD prevented PA-dependent induction of ATF3 and Tip60 in both murine (Supplementary Fig. S13A) and human (Supplementary Fig. S13B) HSCs. RGS7 depletion also prevented TNFα production from PA-treated HSCs in both species (Supplementary Fig. S13A, B).
The ability of PA to promote ROS generation (Supplementary Fig. S13C) and cell death (Supplementary Fig. S13D) as well as fibrotic collagen production (Supplementary Fig. S13E) were also decreased by ∼50% after RGS7 KD in LX2 cells. Thus, across species, RGS7 expression in multiple hepatic cell types influences hyperlipidemia-dependent liver dysfunction.
RGS7 depletion prevents TNFα-dependent liver damage
We acquired serum from patients diagnosed with NAFLD and noted that the exposure of human hepatocytes to these serum samples was sufficient to induce the upregulation of RGS7 and the production of pro-inflammatory cytokines such as TNFα (Supplementary Fig. S14). These data suggested that an endocrine factor, present in the circulation of NAFLD patients, is sufficient to cause RGS7 induction in hepatocytes. Indeed, across species and systems, we consistently detected a significant impact of RGS7 KD on inflammatory mediators.
Thus, we next directly tested the impact of RGS7 on liver damage after TNFα exposure by using mice as a model system. TNFα treatment was sufficient to cause hepatic steatosis (Fig. 7A, B), fibrosis (Fig. 7A), glycogen accumulation (Fig. 7A, C), and oxidative stress (Fig. 7D) and these endpoints were improved by ∼50% in RGS7-depleted livers. In addition, TNFα triggered elevations in serum liver enzymes and triglycerides via RGS7-dependent mechanisms (Fig. 7E). Our prior data proved that RGS7 upregulation in PA-treated hepatocytes requires ROS, and TNFα signaling is known to drive ROS generation predominantly via impacts on the mitochondria (35). Indeed, the inhibition of TNFα was sufficient to prevent PA-dependent RGS7/ATF3/Tip60 upregulation as well as production of the fibrotic factor αSMA in HepaRG cells (Fig. 7F).
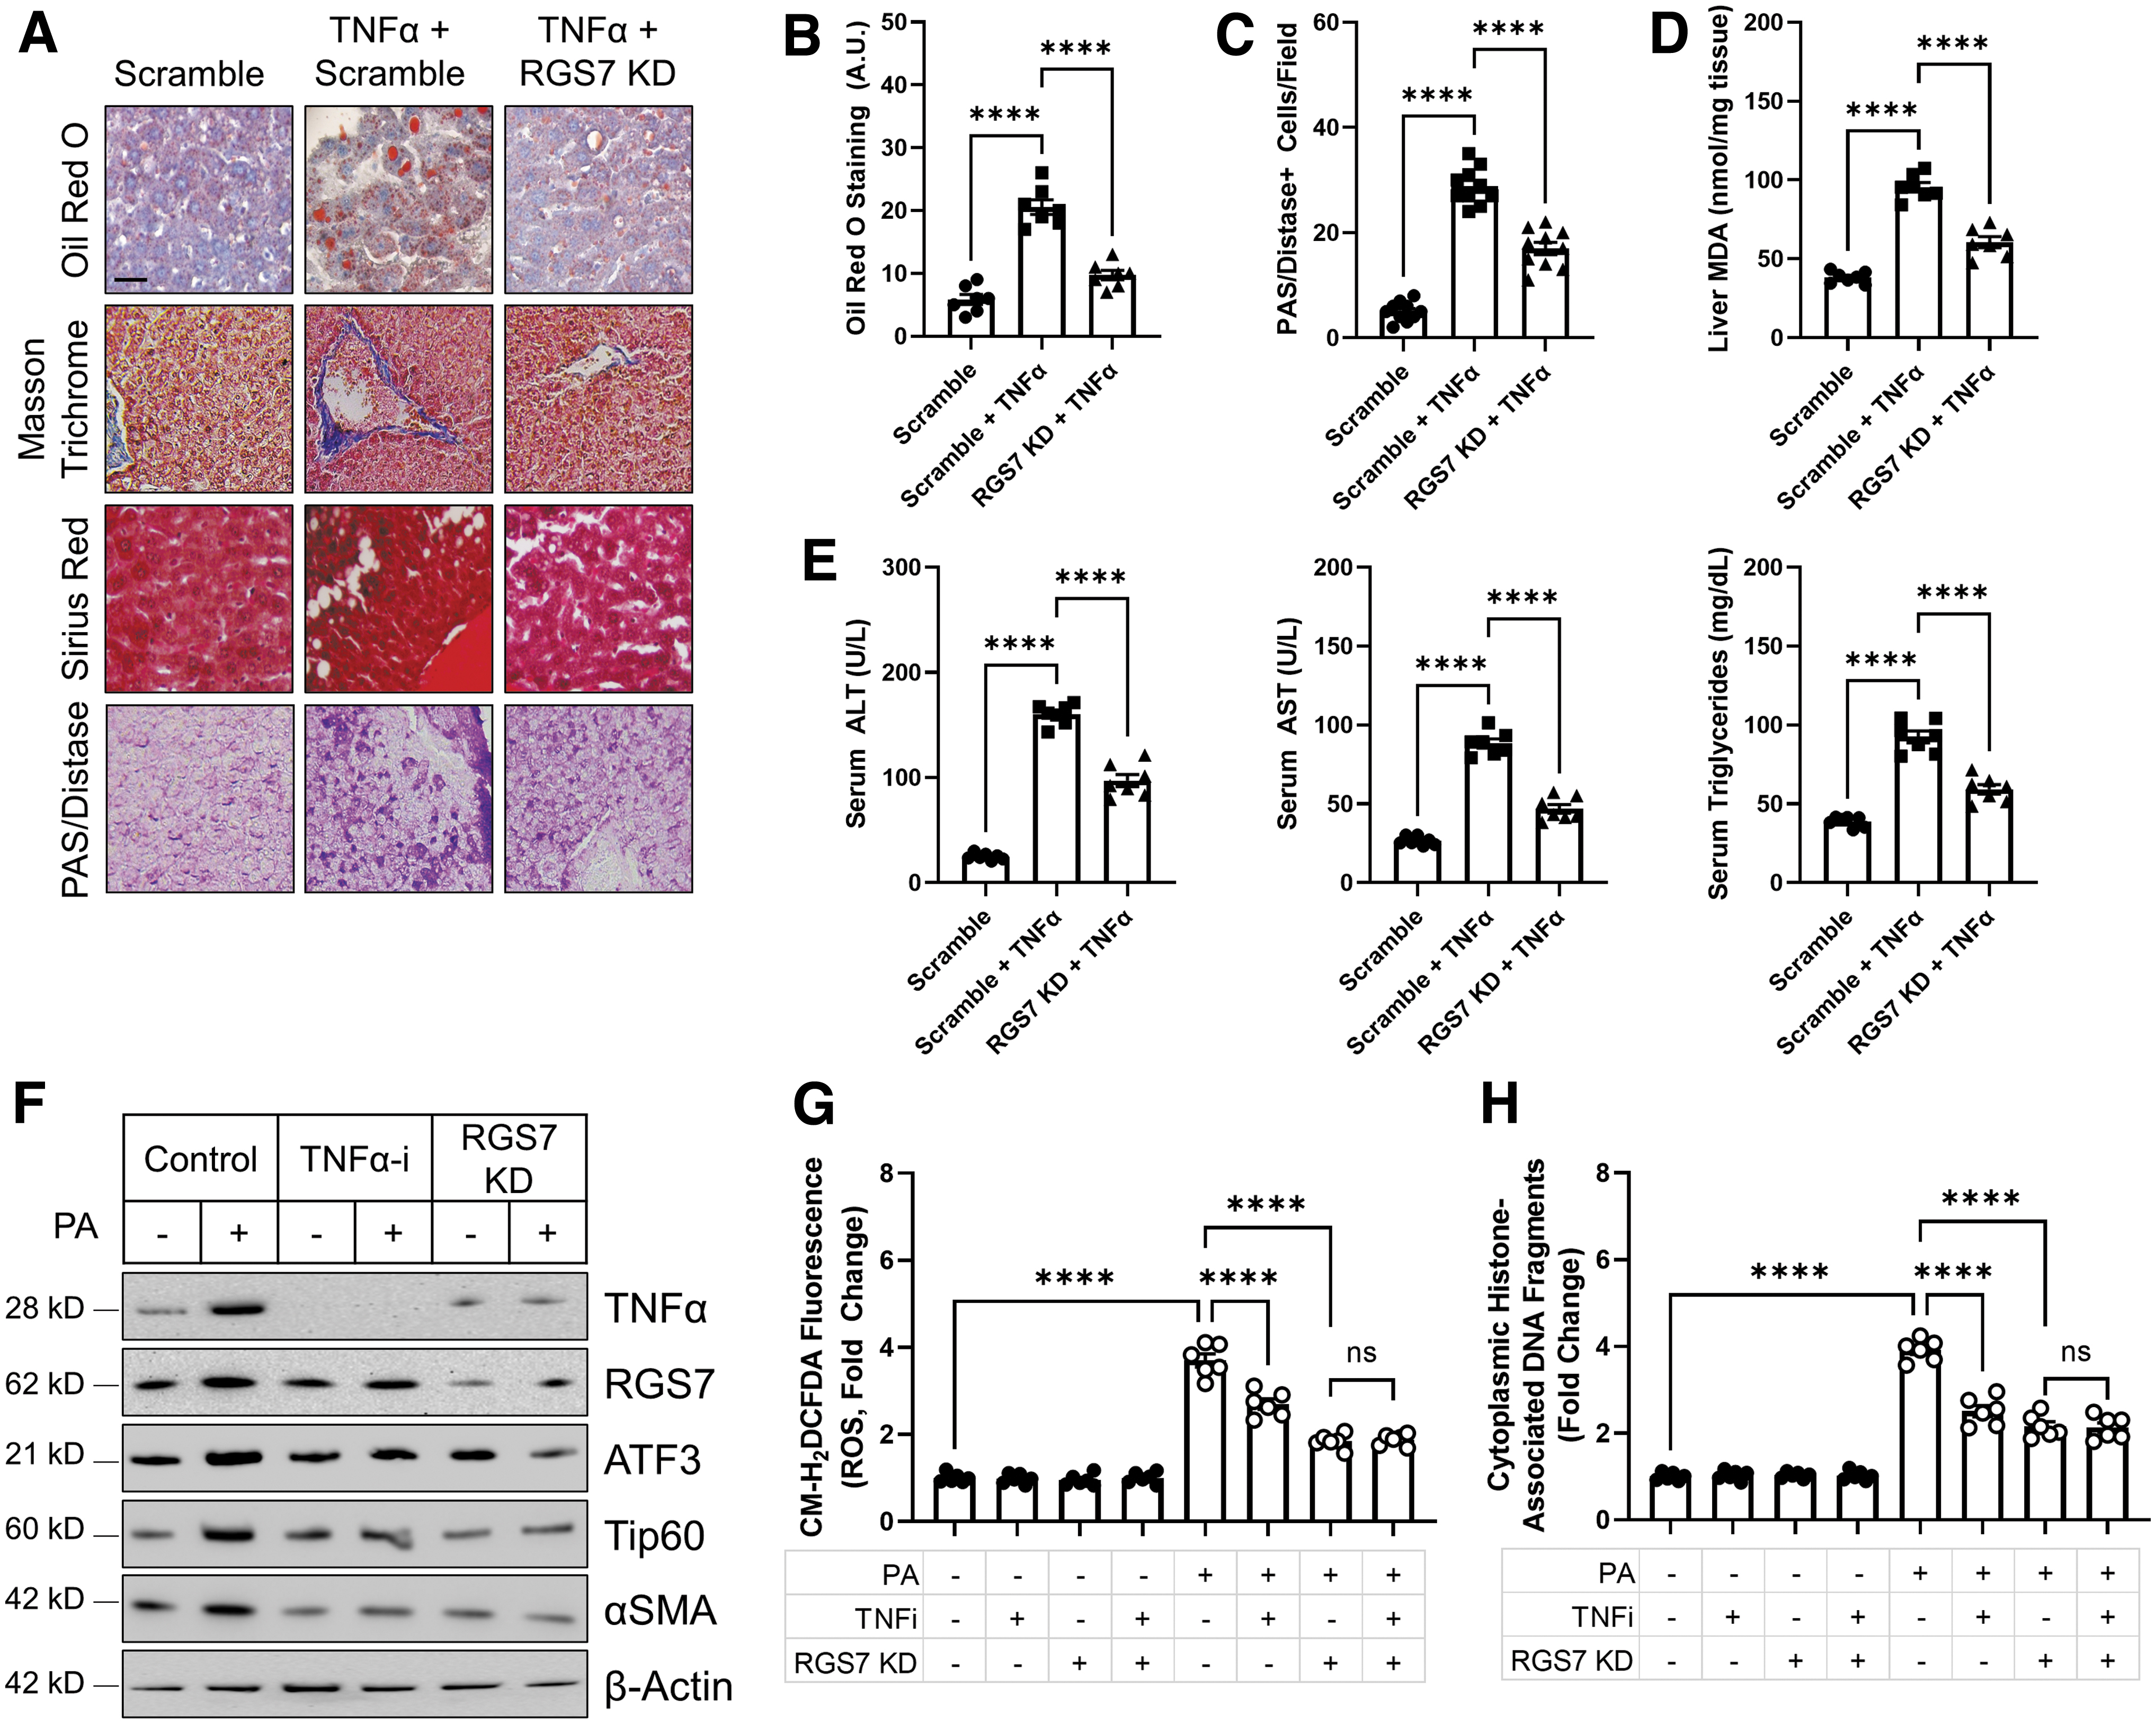
Further, both RGS7 KD and TNFα inhibition partially prevented ROS generation (Fig. 7G) and cell death (Fig. 7H) in PA-treated cells. However, the combined treatment provided no additive benefit, placing TNFα and RGS7 in the same pathway. Thus, TNFα-dependent ROS production likely represents an essential watershed event driving RGS7 upregulation and the subsequent propagation of pro-death signals throughout the liver microenvironment and into the peripheral circulation.
RGS7 overexpression is sufficient to drive ATF3/Tip60 induction and TNFα-dependent hepatotoxicity
To prove that RGS7 represents a critical step in the pathogenesis of NAFLD, we next sought to evaluate whether RGS7 overexpression was sufficient to drive key disease endpoints in the liver. In mice, hepatic RGS7 overexpression led to a twofold upregulation in ATF3/Tip60 levels comparable to that observed in HFD-fed mice (Fig. 8A). Similarly, we could detect robust induction of the fibrotic marker αSMA after RGS7 overexpression in the mouse liver (Fig. 8A). We were able to recapitulate several of these key findings in human hepatocytes noting that, in HepaRG cells, RGS7 expression was sufficient to drive the production of TNFα (Supplementary Fig. S15A), ROS generation (Supplementary Fig. S15B), and cell death (Supplementary Fig. S15C, D).
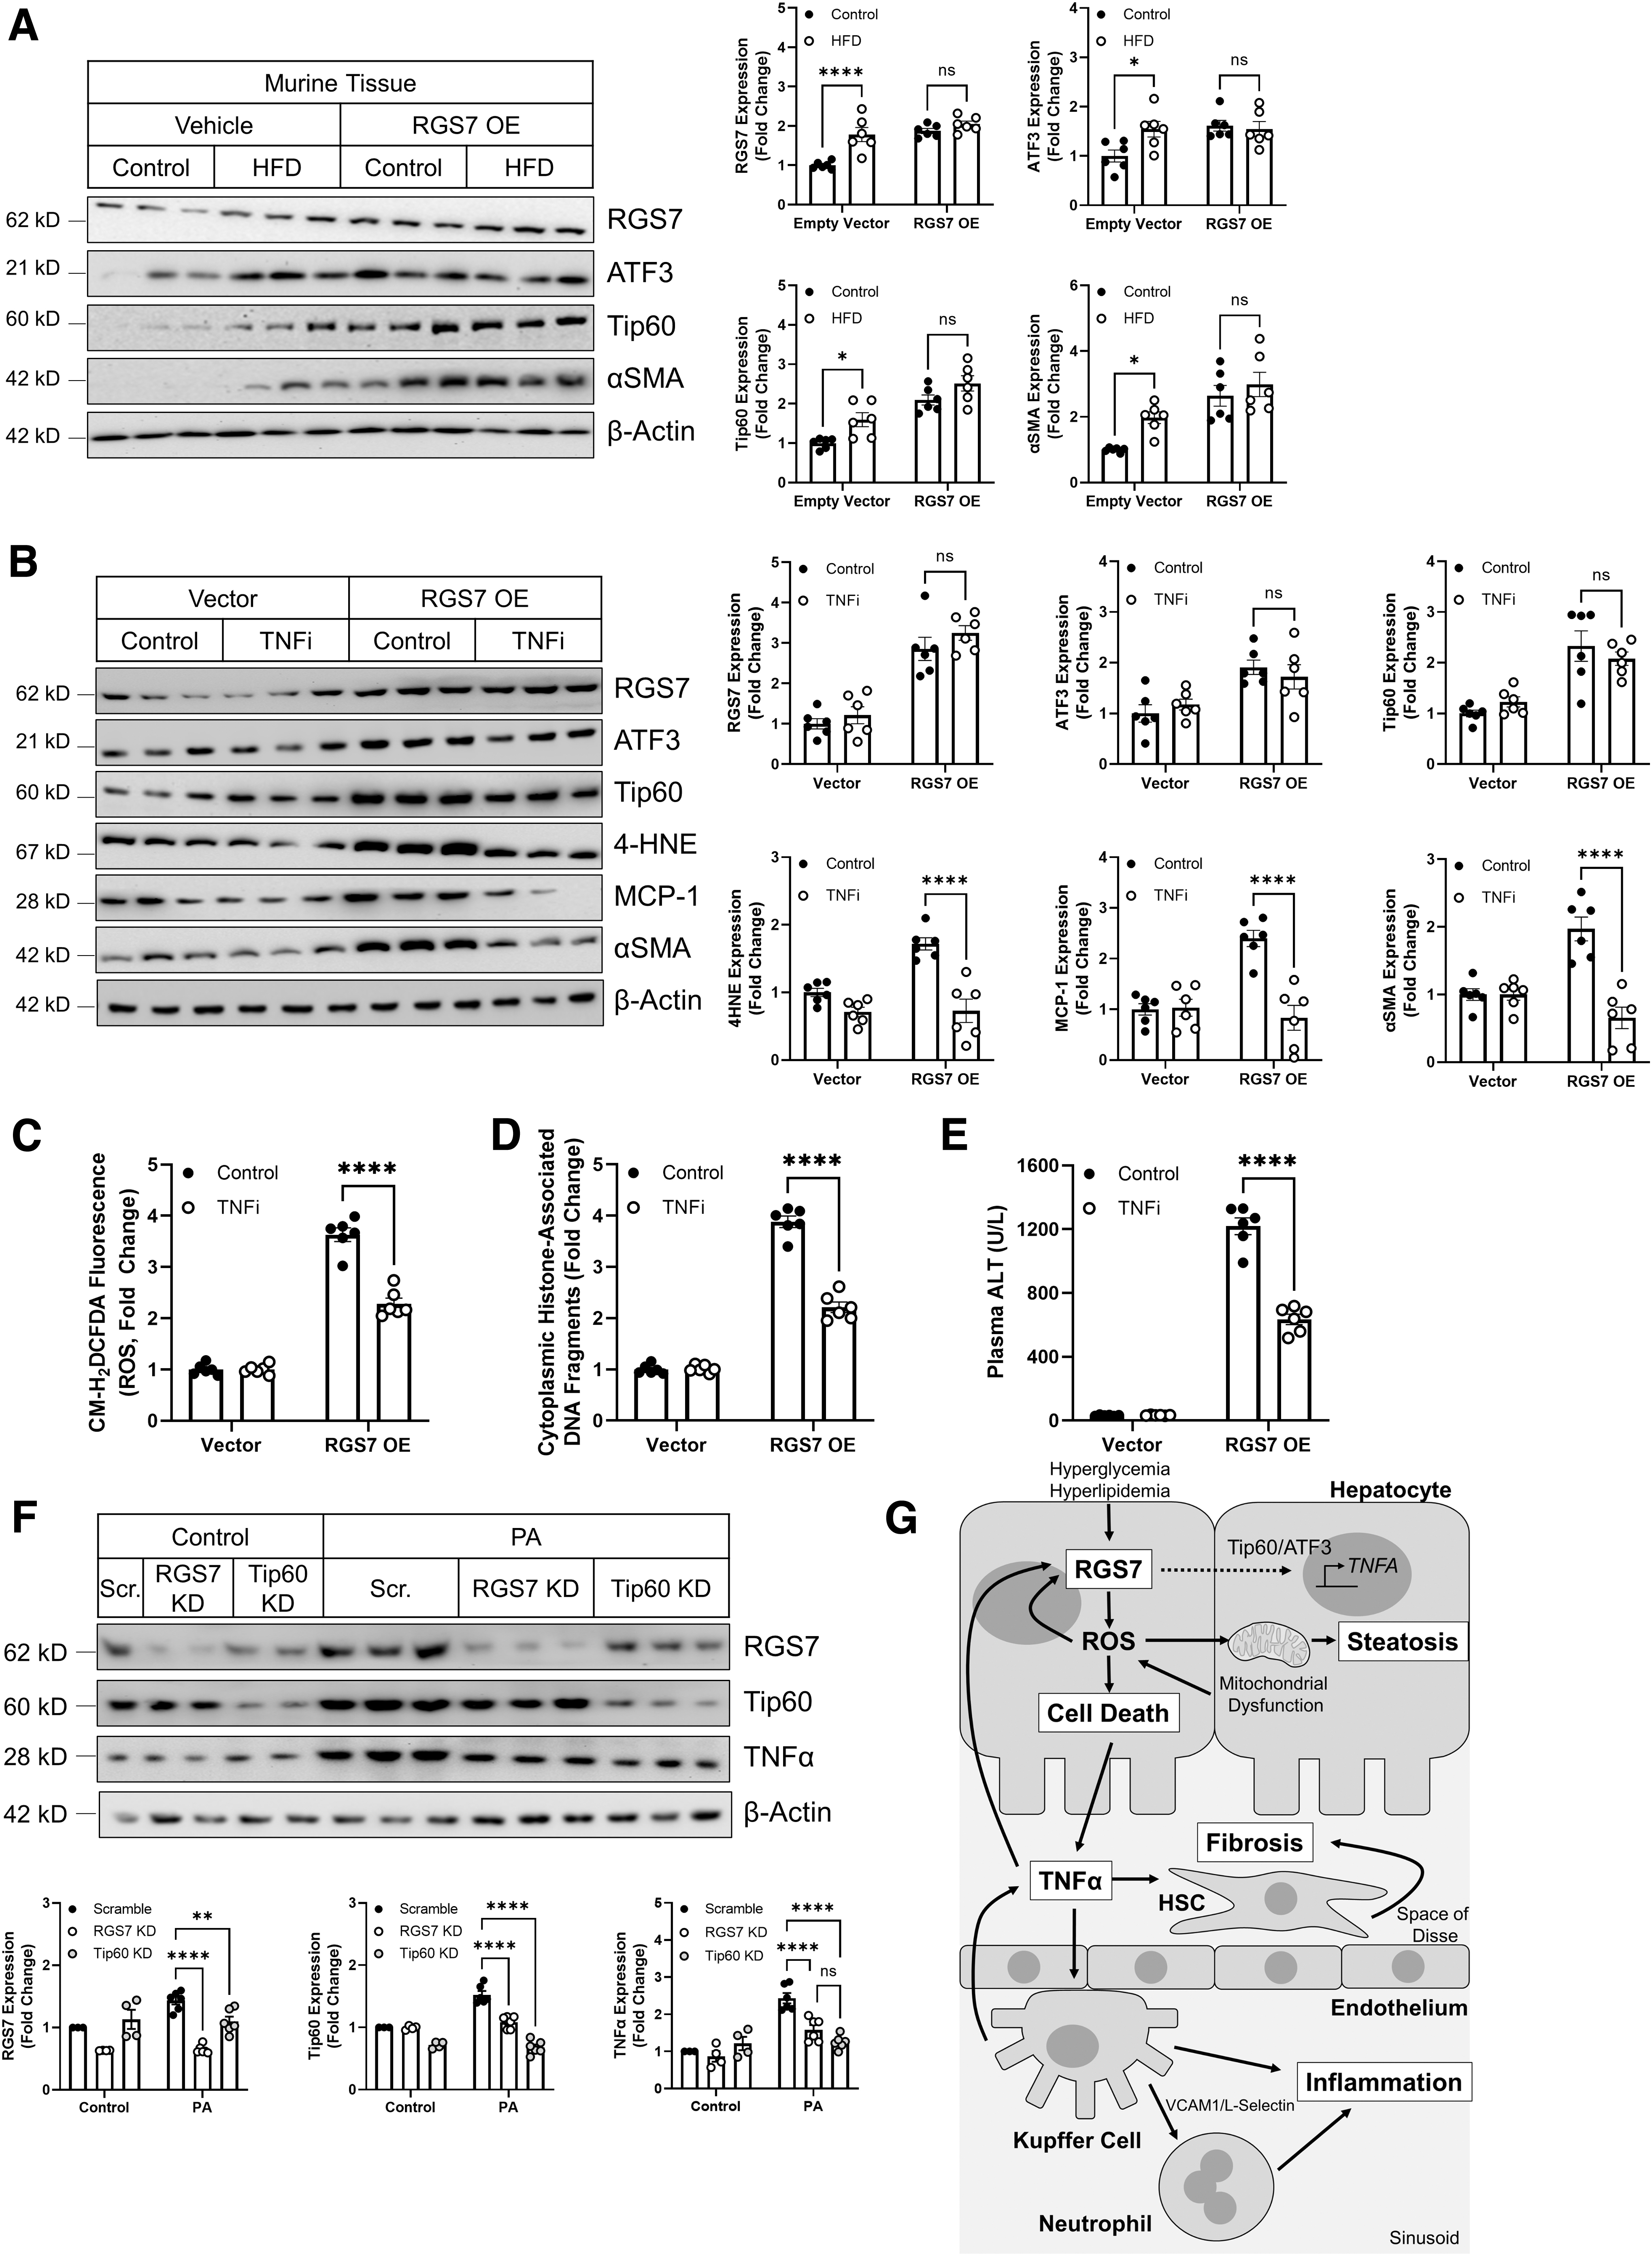
RGS7 overexpression failed to stimulate Tip60 accumulation in HepaRG cells (Supplementary Fig. S15A), suggesting that this event requires an RGS7-dependent extracellular signal absent in the monoculture system that can be engaged by exposure to PA or that Tip60 upregulation in vivo is derived from non-hepatocyte cell types.
Finally, we assessed the participation of TNFα in RGS7-dependent hepatotoxicity in vivo in mice. The inhibition of TNFα signaling ameliorated RGS7-driven upregulation of markers of lipid peroxidation (4-hydroxynonenal, 4HNE), inflammation (MCP-1), and fibrosis (αSMA) in the liver (Fig. 8B). The expression of RGS7, ATF3, or Tip60 was not impacted by TNFα inhibition in this model, likely because RGS7 levels were artificially driven under a non-native promoter. Nevertheless, the ability of RGS7 to promote oxidative stress (Fig. 8C), cell death (Fig. 8D), and elevated liver enzymes (Fig. 8E) was also dependent, at least in part, on TNFα. Similarly, KD of Tip60 was sufficient to prevent PA-dependent TNFα production from HepaRG cells (Fig. 8F). Given that Tip60 depletion also prevented RGS7 upregulation in HepaRG cells (Fig. 8F), these data suggest that RGS7-driven TNFα induction likely requires concerted action by both RGS7 and Tip60.
Discussion
Canonically, RGS proteins function at the cell membrane to facilitate GTP hydrolysis by the Gα subunit of the heterotrimeric G protein complex, critical for signal transduction downstream of G protein coupled receptors (GPCRs). However, emerging evidence suggests that many RGS proteins possess G protein-independent functions. Of note, members of the R7 family of RGS proteins, which includes RGS6, RGS7, RGS9, and RGS11, are highly expressed in the brain and retina where binding partners R7BP and RGS9 associated protein (R9AP) anchor R7 family members to the cell membrane (11, 45, 53).
These anchors are absent in non-neuronal cell types (53), permitting the shuttling of R7 family members and their binding partner Gβ5 to the nucleus (11, 60, 64, 81). However, it remains unclear as to whether this nuclear/membrane shuttling is simply a means to sequester R7 family members away from GPCRs or whether R7 RGS proteins possess functions that are dependent on a functional interaction with nuclear proteins. Though hepatic levels of RGS7 are a fraction (∼1/3) that is observed in the brain, our data demonstrate a dynamic regulation of RGS7 levels in response to cytotoxic stimuli and, interestingly, RGS7 levels in hepatocytes are highest in the nucleus.
These data led us to hypothesize that RGS7 might possess unique nuclear functions in non-neuronal cell types as has been shown for R7 family member RGS6, which interacts with multiple nuclear proteins, including DNMT1, Tip60, and ATM (27, 48, 50).
Here, we show that RGS7accumulates in livers of NAFLD patients, particularly in individuals with high-grade steatosis, severely compromised liver function, and pronounced insulin resistance. Human hepatic tissue with high RGS7 protein content displayed a molecular signature characterized by elevations in inflammatory and fibrotic biomarkers. RGS7 is upregulated in the liver in response to both hyperlipidemia and hyperglycemia and forms a complex with stress-inducible transcription factor ATF3 and the histone acetyltransferase Tip60, facilitating the induction of both proteins in HFD-fed or STZ-treated mice.
Liver-specific RGS7 depletion ameliorated HFD-dependent hepatic steatosis, cell loss, inflammation, and fibrosis, translating to improvements in key physiological endpoints, including body and liver weight and liver enzymes. In hepatocytes, RGS7 drives ROS generation, which compromises FA metabolism, strains mitochondrial respiration, and initiates cell death signaling cascades. These actions trigger the concomitant release of inflammatory cytokines (e.g., TNFα, IL-1β, and MCP-1), the recruitment of Kupffer cells (resident hepatic macrophages), and the transdifferentiation of HSCs from a quiescent state to a myofibroblast-like phenotype characterized by excessive proliferation and production of extracellular matrix components (Fig. 8G).
RGS7 KD in the liver also decreased TNFα-dependent liver damage, indicating that RGS7 facilitates both cytokine production and the hepatotoxic actions of circulating TNFα. Indeed, TNFα represents a key target of RGS7 as, though RGS7 overexpression in the liver was sufficient to drive ROS generation, cell death, and the induction of markers for lipid peroxidation and fibrosis, these actions were mitigated after the inhibition of TNFα. Our work combines multiple systems, including human tissue, murine and human primary cells, human cell lines, and the intact mouse as a model organism.
Though mechanisms of hepatic metabolism (20, 79), apoptosis (58), inflammation/fibrosis (4), and intracellular signaling (24) display interspecies variation and some elements of hepatocyte function are altered in culture (23), the hyperlipidemia-dependent induction of RGS7/ATF3/Tip60 across experimental paradigms highlights the essential role of this complex in pathological oxidative stress, cell death, inflammation, and fibrosis.
Oxidative stress represents a critical first stage in the pathogenesis of NAFLD that precedes the development of key pathological endpoints (54). Improving the hepatic antioxidant buffering capacity with N-acetyl cysteine (NAC) decreases HFD-dependent steatosis, inflammation, and cell death (49). However, this intervention is only effective when administered during an early intervention window (66). One consequence of initial ROS accumulation is the upregulation of RGS7, which can be directly stimulated by H2O2 or reversed via the scavenging of either H2O2 or superoxide in PA-treated hepatocytes. RGS7, in turn, drives further ROS generation by triggering TNFα production and mitochondrial dysfunction.
TNFα acts as a mild mitochondrial uncoupler increasing ROS via actions on complex I and complex III (34) and can also facilitate superoxide production via NADPH oxidases (Noxs) (38), which have been implicated in hepatic fibrosis (3, 31). This RGS7-mediated feed-forward loop facilitates continual, and likely cytotoxic, oxidative stress in response to hyperlipidemia and hyperglycemia. In this way, RGS7 sensitizes hepatocytes to further pathogenic insult by decreasing the threshold of cellular stress necessary to push cells toward a catastrophic fate.
Though our data indicate that the ability of RGS7 to promote cell death is partially TNFα-independent, the ability of TNFR1 to promote the activation of pro-apoptotic caspase cascades likely contributes (55).
Death of hepatocytes can be further exacerbated by the activation of classic inflammatory (M1) Kupffer cells in the liver, resident macrophages recruited to the site of liver injury, often as a secondary consequence of hepatocyte loss, and responsible for further release of inflammatory cytokines (e.g., IL-1β and TNFα). Although our data indicate that RGS7 is both necessary and sufficient to drive hepatocyte TNFα production, the ability of RGS7 to promote cell death in hepatocytes likely also contributes to TNFα accumulation via the activation of hepatic inflammation.
Further, RGS7 has direct impacts on cell adhesion molecules (e.g., L-selectin and VCAM-1) that are necessary for immune cell recruitment and known to contribute to lipid-driven hepatic inflammation and fibrosis (12, 18). Though NAFLD therapeutics aimed at mitigating hepatic inflammation have been proposed, the crippling of host defense against bacterial and viral infections can be counterproductive or even deleterious to liver function (19). Indeed, a recent retrospective analysis investigating the relative risk of acquiring cirrhosis, NAFLD, or NASH found no beneficial effect of anti-TNFα agents in patients with immune-related diseases (71).
Targeting hepatocyte- or stellate cell-intrinsic mechanisms such as RGS7-dependent oxidative stress, conversely, could mitigate the negative consequences of inflammatory mediators on liver cells without crippling immune function, preventing the removal of dead cells, or compromising liver regeneration.
Our data indicate that RGS7 drives TNFα production in murine HSCs and the human HSC cell line LX2 in response to PA. Thus, all three cell types (hepatocytes, Kupffer cells, and HSCs) contribute to a pool of locally circulating TNFα, which acts in a paracrine manner to impact liver function. TNFα exposure drives cytotoxicity in hepatocytes; however, inflammatory cytokines, instead of directly influencing HSC transdifferentiation, promote the survival of activated HSCs (62). In vitro, PA triggers RGS7 upregulation in HSCs, resulting in PA-dependent oxidative stress and cell death.
The seemingly paradoxical actions of RGS7 in isolated HSCs where RGS7 elevations can directly facilitate cell loss while also promoting the release of a pro-survival signal are, in fact, consistent with a model wherein the primary driver of TNFα production stems not from hepatocytes or HSCs, but from the production by resident immune cells, which produce up to 20-fold more inflammatory cytokines on activation (47). Thus, although RGS7 may contribute to HSC death in vitro, these actions would likely be swamped by RGS7-dependent, TNFα-mediated anti-apoptotic/necrotic stimuli, resulting in a net drive toward a fibrotic phenotype in vivo.
ATF3 has been proposed as a link between inflammation and NAFLD (14, 37). Hepatic ATF3 overexpression is sufficient to trigger elevations in liver enzymes (2). Conversely, ATF3 KD in the liver impairs the hepatic inflammatory response in Zucker diabetic fatty rats, decreasing TNFα production, activation of NF-κB (nuclear factor κ-light-chain-enhancer of activated B cells) signaling, and TNFα-dependent macrophage infiltration (37). In addition, ATF3 is a key driver transforming growth factor β1 (TGF-β1)-dependent HSC activation (67).
In non-hepatic cell types, ATF3 has been shown to activate the transcription of inflammatory cytokines, including TNFα (56, 82), though conflicting reports regarding the directionality of ATF3 impacts have been published (41). For example, Kwon et al. demonstrated that ATF3 suppresses NF-κB signaling and the transcription of inflammatory response genes by facilitating histone deacetylase 1 (HDAC1)-dependent deacetylation of p65. Thus, cell type-specific impacts of ATF3 may depend on the composition of the ATF3 macromolecular complex. Indeed, RGS7 promotes complex formation between ATF3 and Tip60, whose stabilization has been shown to promote p65 transcription and the release of pro-inflammatory cytokines (36, 77).
TNFα transcription is controlled by histone methylation and acetylation (6, 43, 69), though the protein(s) responsible for dynamic control of TNFα production in immune and non-immune cell types have yet to be fully delineated. Thus, RGS7 may mediate TNFα production in hepatocytes and HSCs by directing Tip60/ATF3 to the TNFA gene. Indeed, we could phenocopy the impacts of RGS7 KD on TNFα release from hepatocytes by depleting Tip60. However, given that immune cell-mediated TNFα production is the primary source of TNFα in vivo, additional targets of ATF3/Tip60 likely also contribute. Though the targets of ATF3 have not been characterized extensively in hepatic cell types, in cancer cells the pathways impacted include apoptotic cascades, cell cycle regulators, immune mediators, and insulin signaling (70). Tip60, similarly, has been shown to control the actions of proteins involved in lipid metabolism (7).
Though RGS7 upregulation was not unique to patients with comorbid T2DM, we did note a particularly high RGS7, ATF3, and Tip60 in individuals with high HOMA-IR scores indicative of pronounced insulin resistance. Indeed, both hyperlipidemia and hyperglycemia triggered RGS7 upregulation in the liver, identifying RGS7 as a possible link between common risk factors for NAFLD and liver damage. Together, our data indicate that targeting RGS7 in the liver might represent a viable means to mitigate the long-term impacts of T2DM and obesity on hepatic function. Indeed, we provide evidence that RGS7 KD phenocopies many of the beneficial effects of saroglitazar, PPARα/γ agonist, and the only drug approved to specifically treat NAFLD.
Although RGS7 targets some overlapping pathways with saroglitazar, possibly due to the direct actions of Tip60 on PPARγ (30, 75), for several pathological endpoints (e.g., lipid deposition, fibrosis, and liver enzymes) the two interventions functioned additively. The possibility that RGS7 lies upstream of mechanism(s) targeted by saroglitazar is further emphasized by our observation that saroglitazar fails to impact HFD-dependent RGS7 induction. Our data are consistent with prior observations that saroglitazar preferentially affects steatosis, with lesser impacts on the measures of hepatic fibrosis (e.g., liver weight) (29, 39), which are completely reversed after RGS7 KD in HFD-fed and STZ-treated mice.
Conclusions
Here, we identify RGS7, upregulated in response to hyperlipidemia and hyperglycemia, as a critical regulator of multiple pro-inflammatory pathways contributing to pathological hepatic lipid deposition and fibrotic remodeling in the liver. Further, we identify two new RGS7-interacting proteins: the stress-inducible transcription factor ATF3 and histone acetyltransferase Tip60, both of which are required for the profibrotic actions of RGS7 across hepatic cell types. Our data suggest that targeting RGS7 actions in the liver might represent a novel means to slow or halt the pathogenesis of NAFLD.
Materials and Methods
Antibodies and reagents
The source/catalog information for all reagents (Supplementary Table S2), antibodies (Supplementary Table S3), assay kits (Supplementary Table S4), and cell lines (Supplementary Table S5) can be found in Supplementary Tables S2–S5. Supplementary Table S3 provides information on antibody dilutions (immunoblotting, immunohistochemistry, and immunoprecipitation). Commercially available kits were used to measure albumin, collagen, hydroxyproline, NAD+/NADH, Ca2+ flux, lipid peroxidation (malondialdehyde, MDA), FAO, cell death (cytoplasmic histone-associated DNA fragments), terminal deoxynucleotidyl transferase dUTP nick-end labeling (TUNEL), ALT, AST, triglycerides, TNFα, IL-1β, and MCP-1.
All samples were processed, and analyses were performed according to the manufacturer's protocol. All samples yielded values above the lower detection limit for these assays and, if samples were above the detection limits, they were diluted to ensure that the measurements were well within the linear range of the assay.
Animals
Mouse experiments were performed at the Department of Pharmaceutical Sciences, Babasaheb Bhimrao Ambedkar University, Lucknow in association with S.D. College of Pharmacy & Vocational Studies (Ref No. SDCOP&VS/AH/CPCSEA/34/1). Male Swiss albino mice were procured from the Indian Veterinary Research Institute (ICAR-IVRI, Bareilly, India; Registration No. 196/GO/ReBiBtS/ReBiL/2000/CPCSEA) after obtaining clearance from the Animal Ethics Committee and were handled following the International Animal Ethics Committee Guidelines.
Mice (24–30 g, 8–12 weeks of age) were maintained on a balanced laboratory diet as per NIN (Hyderabad, India) and provided with tap water ad libitum. Animal housing facilities were maintained at 20°C ± 2°C, 65%–70% humidity, and on a 12 h/12 h day/night cycle. Animals were group-housed with 3–5 mice/cage.
HFD treatment regimens
All experimental groups were fed with normal chow (NC; 4.4% fat) for the first 7–8 weeks of life. Subsequently, the mice were either left on the NC diet (control) or switched to HFD (60% fat; Harlan, Inc., Indianapolis, IN) for an additional 12 weeks. Unless otherwise noted, animals were sacrificed, and samples were isolated for downstream histological and biochemical analyses after 12 weeks. The shRNA delivery was performed before the initiation of HFD feeding. Separate groups of mice given scramble and RGS7 shRNA (n = 8/group) were treated with saroglitazar (4 mg/kg, p.o. by oral gavage) or vehicle (Tween 80 and 0.5% sodium salt of carboxymethylcellulose at the ratio of 0.5:99.5) after 8 weeks of HFD feeding.
Saroglitazar was administered once daily for 4 additional weeks. After each animal experiment, the mice were weighed before sacrifice. The animals were sacrificed via cervical dislocation, livers were weighed, tibias were extracted, blood was collected, and tissues were dissected and subdivided for histological and biochemical analyses.
STZ-dependent induction of diabetes in mice
Ten-week-old male mice were administered STZ (cumulative dose: 40 mg/kg, i.p.) diluted to 10 mg/mL with 25 mM sodium citrate buffer (pH 4.5), as previously described with some modifications (17, 72). Mice were given four injections (10 mg/kg STZ/day) every 3 days. Blood glucose levels were measured 1 × week after the initial dose by using a blood glucose monitor (OneTouch® Basic glucometer) after drawing blood from the tail vein. Animals were considered diabetic if their blood glucose levels were >200 mg/dL.
Control animals received an equal amount of citrate-citric acid buffer under similar conditions. Mice were then sacrificed 3 days after the final injection, and tissues were collected. Scramble or RGS7-targeted shRNA was introduced via tail vein injection 7 days before the STZ treatment began.
TNFα treatment in mice
Eight- to ten-week-old mice were given a single intraperitoneal injection of recombinant mouse TNFα (250 μg/kg); mice were sacrificed after 10 days; and tissues were collected for downstream analyses. Control mice received the vehicle only. Scramble or RGS7-targeted shRNA was introduced via tail vein injection 7 days before the TNFα treatment began.
Oral glucose tolerance test
Mice were administered scramble or RGS7-targeted shRNA via tail vein injection before initiation of the HFD. The oral glucose tolerance test was performed after 10 weeks of HFD or control diet feeding. After a 12 h fast, the animals were given a bolus of glucose (2 g/kg) directly delivered into the stomach by oral gavage. Blood was sampled from the tail vein at 0, 30, 60, and 120 min after bolus administration and blood glucose levels were assessed by using a glucometer.
RGS7 cloning and construct generation
The full-length RGS7 coding sequence was amplified by polymerase chain reaction (PCR) from human blood complementary DNA (cDNA) according to our published method (63). RGS7 deletion and point mutation sequences were generated by overlapping primer-based PCR amplification and cloned into the pEGFP-N1 vector. Information regarding the sequence of primers has been included in Supplementary Table S5.
The full-length mouse RGS7 sequence was isolated from the mouse brain and cloned into the PMD20 vector as described earlier. The lentiviral vector for mRGS7 was generated via subcloning into the pLenti CMV Puro DEST cloning vector (Addgene, Watertown, MA) and packaged by using the pMD2.G VSV-G envelope expressing plasmid (Addgene) and psPAX2 (Addgene). Lentiviral particles were generated in HEK293 cells as per a standard protocol. Seventy microliters of lentivirus containing 2 × 10⁸ particles of either mRGS7-Lenti or a control empty vector virus and the invivofectamine reagent was injected into the tail vein of mice.
Two weeks after lentiviral injection, the mice were subjected to HFD treatment as described earlier. After 12 weeks, the mice were euthanized by cervical dislocation and blood/multiple tissues were collected for downstream analysis. In a separate experiment, the animals were given the anti-TNFα antibody adalimumab (TNFi; 10 mg/kg, i.p.) (46) 7 days after viral injection without HFD feeding.
RGS7 gene silencing via shRNA delivery in vivo
The shRNA against RGS7 and control scramble shRNA were purchased from Santa Cruz Biotechnology (Dallas, TX). Invivofectamine 3.0, a lipid-based nucleic acid delivery agent (Thermo Fisher Scientific, Waltham, MA), was used to deliver shRNA by tail vein injection according to our previously published protocol (63). After shRNA administration, body weight (1 × /week) and food intake (1–2 × /week) were monitored. No notable alterations in animal weight, food intake, or general well-being were noted (data not shown).
Histology and immunohistochemistry
Paraffin-embedded, formalin-fixed mouse and human liver tissue sections were stained with hematoxylin and eosin (H&E), Oil Red O (Sigma), Masson Trichrome (Sigma)/Sirius Red, and TUNEL (Biovision, Milpitas, CA) to detect liver architecture, neutral triglycerides and lipids, collagen deposition, and cell death, respectively. Reagents were utilized as per the manufacturer's protocols. Immunohistochemical (IHC) staining of both mouse and human liver tissue sections was performed as per a standard protocol (63). For F4/80, CD68, RGS7, ATF3, Tip60, and TUNEL staining, 7–10 sections were stained from each animal with 5 pictures randomly selected from each slide.
Each image was scored for positive stained (brown color) nuclei and averaged (all except RGS7). For RGS7 staining in mouse and human liver sections, the histoscore was determined from the average stain intensity by using Image J (U.S. NIH) for 7–10 slides/animal, 5 images per slide. The blue-stained collagen in an image of tissue section stained with Masson's Trichrome was processed using the “Threshold” tool of ImageJ software (U.S. NIH) and the area fraction was quantified.
Formalin-fixed, paraffin-embedded tissue sections were treated with Periodic acid–Schiff (PAS) stain to detect glycogen in tissue. First, sections were deparaffinized in xylene (two times, 15 min each) and hydrated to water with a graded series of alcohol solutions (100%, 90%, 70%, 50%, and 30%) for 10 min each. Then, the slides were immersed in 0.5% Periodic Acid Solution for 5 min to oxidize. Next, the slides were rinsed in running filtered tap water for 10 min and dipped into Schiff's reagent for 30 min. Thereafter, the slides were washed in running tap water for 5 min and counterstained in Mayer's hematoxylin for 1 min. Again, the sections were placed in running tap water for 15 min.
Lastly, the slides were dehydrated with an upgraded series of alcohol for 10 min each grade (30%, 50%, 70%, 90%, and 100%) and mounted by using xylene-based mounting media with DPX to observe under a microscope.
Immunoblotting
Tissues were promptly dissected and flash-frozen by using liquid nitrogen. Tissue homogenates and cell lysates were prepared in 1 × RIPA buffer with protease (p8340) and phosphatase (#3) inhibitors (Sigma), and protein content was quantified by BCA assay. Sodium dodecyl sulfate-polyacrylamide gel electrophoresis (SDS-PAGE) was performed (20 μg of protein/sample), and gels were transferred onto nitrocellulose membranes. After a brief rinse (1 × in TBST), membranes were blocked for 1 h in TBST with 5% bovine serum albumin (BSA) and incubated overnight at 4°C with primary antibodies (diluted according to Supplementary Table S2 in TBST with 3% BSA).
Membranes were washed 3 × in TBST (5 min) at room temperature and probed with respective horseradish peroxidase-labeled secondary antibodies dissolved in 3% BSA in TBST. Membranes were washed again 3 × in TBST (5 min) at room temperature. Immunoblots were developed (UVP ChemStudio Analytik Jena) by using the chemiluminescence method, and densitometric quantification of immunoblots was performed by using Image J software (U.S. NIH). Wherever possible, multiple proteins were probed on the same membrane.
All blots were stripped and re-probed to ensure the quantification data presented are normalized to an internal control from the same gel, and each β-Actin blot is representative of those obtained for each set of samples. Details regarding the proteins detected on each immunoblot membrane and additional β-Actin controls can be found in the Supplementary Data.
Culture of HepaRG and LX2 cell lines
The human hepatocyte cell line HepaRG was cultured in William's E Medium with the GlutaMAX™ Supplement (Thermo Fisher Scientific) and 10% fetal bovine serum (FBS; Gibco, Waltham, MA) in a 37°C incubator at 5% CO2. Cells were treated with PA (400 μM, 24 h), H2O2 (200 mM; 24 h), polyethylene glycol catalase (Peg-cat; up to 200 U/mL, 1 h pre-treatment), polyethylene glycol superoxide dismutase (Peg-SOD; up to 1000 U/mL, 1 h pre-treatment), or the TNFi (2 μg/mL) (40) where indicated. The human HSC line LX2 was cultured in Dulbecco's modified Eagle's medium (DMEM) with 3% FBS in a 37°C incubator at 5% CO2.
LX2 cells were treated with PA (400 μM, 24 h), where indicated. HepaRG and LX2 cells were also transfected with RGS7-targeted, Tip60-targeted, or scramble shRNA (Santa Cruz Biotechnology), and HepaRG cells were transfected with full-length RGS7 or RGS7 deletion constructs where noted. Cells were plated at a low density (∼1 × 10⁵ cells/60 mm dish) before transfection and allowed to grow to 60%–70% confluence. Cells were transfected after 24–26 h with lipofectamine 3000 (Thermo Fisher Scientific) or via electroporation (Neon Electroporator; Thermo Fisher Scientific).
Isolation and culture of murine hepatocytes
Primary hepatocytes were isolated from 2-month-old mice according to a standard collagenase perfusion protocol. The liver was perfused with an EGTA solution (5.4 mM KCl, 0.44 mM KH2PO4, 140 mM NaCl, 0.34 mM Na2HPO4, 0.5 mM EGTA, and 25 mM Tricine, pH 7.2) and then with DMEM (Gibco) containing 0.075% type I collagenase (Sigma). This was followed by an additional digestion step (0.009% collagenase at 37°C with agitation for 15 min) and centrifugation as previously described (57).
The isolated hepatocytes were then cultured in hepato-ZYME-SFM media (Thermo Fisher Scientific) on collagen-coated plates and maintained at 37°C in a humidified cell culture incubator (5% CO2). Cells were not disturbed for at least 16–24 h before drug treatment. Post-isolation, the cells were transfected via electroporation with RGS7-targeted or scramble shRNA (Santa Cruz Biotechnology) ± transfection of full-length RGS7 and treated with PA (50, 100, 200, or 400 μM; 24 h), cyclosporin A (0.2 μM, 1 h pre-treatment), and/or Ru360 (50 μM, 1 h pre-treatment), where indicated.
Immunoprecipitation
HepaRG cells (3 × 10⁶) were lysed, and protein concentration was measured via BCA protein assay. Six hundred micrograms of protein was equilibrated in IP lysis buffer (50 mM Tris, 5 mM EDTA, 250 mM NaCl, and 0.1% Triton X-100) and bait antibodies (RGS7, Tip60, or control mouse IgG) for 12 h on a rotor at 4°C. Next, 30 μL of Protein G sepharose beads (Abcam, Cambridge, MA) was pre-cleared, equilibrated, and finally added to lysate. After a 2-h incubation, bead slurries were centrifuged and washed 3 × with IP buffer. Immunocomplexes were eluted in non-reducing Laemmli buffer at 95°C and subjected to immunoblotting with prey antibodies (ATF3, Tip60).
Isolation and culture of primary human hepatocytes
Liver tissue samples were collected on ice in MEME solution with 0.5% FA free BSA by a clinician of the Forensic Medicine Department, Sagore Dutta Medical College & Hospital (Kolkata, India) 1–4 h after cessation of cardiac function. A lack of complicating medical conditions (hepatic or cardiac pathology, diabetes, or kidney disorders) was verified by relatives of the deceased through a questionnaire. Relatives were briefed about the goal and design of the study and written consent was obtained. The condition of organs was further confirmed by studying gross architectural changes by H&E during autopsy.
Primary human hepatocytes were isolated from human liver tissue essentially as previously described (22, 25). Tissue was diced, washed in cold HBSS, and finally minced thoroughly in MEME. EGTA (0.5 mM) was added to the cell slurry, and it was placed in a shaking water bath for 10–15 min at 37°C. After centrifugation, the cell slurry was washed twice in MEME. Pre-warmed digestion buffer (HBSS, 0.05% collagenase IV, 0.5% FA free BSA, 10 mM CaCl2) was added, and the slurry was placed in a shaking water bath again for 30 min at 37°C.
BSA was included in the digestion process to minimize cell damage and prevent hemolysis of red blood cells (RBCs). The solution was gently vortexed by repeated pipetting and passed through a metal strainer to remove lumps. The resultant supernatant was filtered again through a 100 μm cell strainer and then placed on ice. Resulting cell suspensions were centrifuged (1000 rcf for 5 min, 4°C), and the supernatant was discarded. The hepatocyte pellet was gently resuspended in a minimal amount of MEME, and RBC lysis buffer was added to completely remove RBCs.
After 3 min, cells were centrifuged again (1000 rcf for 5 min, 4°C), washed with MEME twice, and finally resuspended in William's E medium. Cells were counted for viability and diluted to 1 × 10⁶ cells/mL in medium containing 1% non-essential amino acids, 1% GlutaMAX, 2% human serum, 100 nM dexamethasone, 100 nM insulin, and 0.375% FA free BSA. Isolated hepatocytes were plated on type 1 collagen-coated plates, at a density of 250,000/cm2. After adherence (overnight undisturbed), cells were transfected with RGS7 targeted or scramble shRNA by using a Neon electroporator. Cells were then treated with PA (400 μM, 24 h) or exposed to media containing 10% serum collected from patients with reported NAFLD (or control serum).
Human samples
Post-mortem human tissue samples (control, NAFLD, and NAFLD+co-morbid T2DM) were acquired after obtaining the ethical clearance from the Centre of Biomedical Research (CBMR) Ethics Committee (Ref.: IEC/CBMR/Corr/2020/16/8). The samples were collected from the Department of Surgery and the Department of Forensic Medicine, Sagore Dutta Medical College & Hospital. Control liver biopsy samples were collected from subjects who underwent liver biopsy in a pre-evaluation for liver transplantation or characterization of solid liver masses suspected to be adenoma or focal nodular hyperplasia based on radiological results without any evidence of hepatic steatosis.
The inclusion criteria for subjects with NAFLD were as follows: (i) >18 years old, (ii) fat infiltration in liver on examination, and (iii) high ALT levels within the 5–6 months before biopsy. Subjects with the following were excluded: (i) hepatitis B and C virus infection, (ii) hepatitis, (iii) drug-induced liver injury, (iv) Wilson disease or hemochromatosis, (v) excessive alcohol consumption (male >30 g/day, female >20 g/day), and (vi) diagnosis of malignancy within the past year.
In the exploratory analysis, among these biopsy-proven tissues, liver tissues from 54 subjects with or without NAFLD were randomly selected and used for IHC and immunoblotting analyses. Steatosis was graded by a pathologist according to the percentage of hepatocytes containing fat droplets as follows: grade 0, none, <5%; grade 1, mild, 5%–33%; grade 2, moderate, 34%–66%; and grade 3, severe, >66%. For analyses, selected subjects were divided into three groups: no steatosis group (steatosis grade 0), NAFLD group (steatosis grade 1–3), or NAFLD plus T2DM group. Summarized clinical data can be found in Supplementary Table S6. Samples were subsequently divided based on (i) patient ALT level (high, low), (ii) RGS7 histoscore (low, medium, high), or (iii) patient HOMA-IR score (<2, ≥2).
Measurement of FAO
The FAO assay was performed with 20 mg mice liver tissue as a whole or in the isolated mitochondria by using the assay kit from Biomedical Research & Clinical Application (BMR). For this colorimetric assay, oxidation of the substrate octanoyl-coA generates NADH that is coupled to the reduction of the tetrazolium salt INT to formazan (42).
Determination of liver NADH/NAD+ ratios
The ratio of NADH to NAD+ was determined by using an assay kit according to the manufacturer's instructions (Abcam). Briefly, 20 mg of liver tissue was washed with cold phosphate buffered saline (PBS) and homogenized in 400 μL of NAD+/NADH extraction buffer. The supernatant was collected after centrifugation at 22,500 rcf for 5 min at 4°C. The collected supernatant was filtered through a 10 kD Spin Column (Abcam) to remove NADH-consuming enzymes. For the determination of total NAD+ and NADH, 50 μL of supernatant was transferred onto a 96-well plate in triplicate.
For measuring NADH levels, 200 μL of the supernatant was heated at 60°C for 30 min to decompose NAD+, and 50 μL of the resultant sample was added to the plate in triplicate. An NADH cycling enzyme/buffer mix (100 μL) was added to each sample and the standards, mixed, and incubated at room temperature for 5 min to convert NAD+ to NADH. The NADH developer (10 μL) was added to each reaction and incubated at room temperature for 5 h before reading the plate at optical density (OD) 450 nm. The standard was prepared according to the manufacturer's protocol. The NAD+ level was calculated as the total NADH/NAD+ minus NADH.
Determination of liver pyruvate and lactate levels
The concentrations of lactate and pyruvate in the liver were determined by a colorimetric method using pyruvate and lactate assay kits, respectively, according to the manufacturer's instructions (Abcam). Briefly, 10 mg of liver tissues were washed with cold PBS and homogenized in 500 μL of pyruvate or lactate assay buffer. The supernatant was collected after centrifugation at 22,500 rcf for 5 min at 4°C to remove any insoluble material. Since endogenous lactate dehydrogenase may degrade lactate, the collected supernatant was deproteinized as described in the manufacturer's protocol. For the measurement of pyruvate and lactate, 50 μL of supernatant was transferred onto 96-well plates in triplicate. The assay buffer/probe or substrate/enzyme mix (50 μL) was added to each sample and standard, mixed, and incubated at room temperature for 30 min protected from light. The mixed samples were measured at OD 570 nm (for pyruvate) and OD 450 nm (for lactate).
Lipid peroxidation assays
As a reflection of the hepatic levels of lipid peroxidation, MDA levels were determined by colorimetric assay (Abcam). Thirty milligrams of liver tissue was homogenized and processed according to the manufacturer's protocol.
Isolation/culture of murine HSCs
The HSCs were isolated from Swiss albino mice by using a standard perfusion protocol (10). Mice were perfused with an EGTA solution for 2 min, pronase E (5 min; Merck, Darmstadt, Germany), and, finally, collagenase D (0.038% for 5–7 min; Sigma) under anesthesia. Next, we excised the liver and diced the tissue into small pieces to further digest with an HBSS solution containing pronase E and collagenase D supplemented with 1% DNase I (Sisco Research Laboratories, Mumbai, India) for 15 min under sterile conditions. The digested solution was then filtered through a 70-μm cell strainer and subjected to low-speed centrifugation (50 g for 3–5 min) to discard pelleted hepatocytes.
The single-cell suspension was then mixed with Nycodenz solution (9.6%) and centrifuged again at 1400 g for 25 min. The HSCs were collected from the white layer. The number of isolated cells and viability was determined by Trypan Blue staining, and cells were plated onto dishes coated with fibronectin. Cells were maintained in DMEM containing 10% FBS, Vitamin A (100 mM), insulin (50 ng/mL), and glutamine (0.5 mM) at 37°C in a humidified cell culture incubator (5% CO2). Before experimental initiation, the cells were cultured for 2–3 days with daily media changes to ensure the appearance of a suitable morphology. The cells were transfected with RGS7-targeted or scramble shRNA (Santa Cruz Biotechnology) and treated with PA (400 μM, 24 h) where indicated.
MitoSox staining
Staining for mitochondrial ROS was performed in PA-treated murine hepatocytes (±scramble shRNA, RGS7 shRNA, or RGS7 overexpression) or murine hepatocytes isolated from control and HFD-fed animals given scramble or RGS7 targeted shRNA. Cells were washed thoroughly, loaded with 5 μM of MitoSox solution (1–2 mL to cover the whole dish), incubated for 15 min at 37°C, washed 3 × with PBS in the dark, mounted by using vectashield with DAPI, and visualized by fluorescence microscopy. The number of MitoSox+ cells (red stained) were counted on each coverslip.
Measurement of total ROS
The ROS generation was estimated in cells by using the cell-permeable oxidation-sensitive probe, CM-H2DCFDA (DCFDA; Sigma). Cells were harvested by centrifugation, washed three times with ice-cold PBS, resuspended in PBS, and incubated with 5 μM CM-H2DCFDA for 20 min at 37°C. After incubation, the cells were again washed and lysed in PBS with 1% Tween 20. The ROS level in cell lysates was determined as the ratio of dichlorofluorescein excitation at 480 nm to emission at 530 nm. We should note here that the CM-H2DCFDA assay is utilized as a general oxidative stress indicator and not as a detector of a specific oxidant due to known limitations of the probe (33).
In vitro collagen formation assay
The collagen-specific dye Sirius red was utilized to quantitate collagen from cell lysates essentially as previously described (52). Briefly, a solution of 5 μg/mL Sirius red was prepared by dissolving Sirius red in saturated picric acid. After 1 h, cells were washed with PBS twice and lysed in 0.1 M sodium hydroxide at room temperature. The supernatant was collected, and colorimetric measurement was done at 530 nm.
Mitochondrial Ca2+ and mitochondrial membrane potential measurements
Murine hepatocytes transfected with scramble or RGS7-targeted shRNA were pretreated with Ru360 (50 mmol/L) or cyclosporin A (0.2 mmol/L) for 1 h to selectively block mitochondrial Ca2+ uptake or opening of the mitochondrial permeability transition pore, respectively. Cells were then challenged with PA (24 h, 400 μM). Mitochondrial membrane potential was measured by using a commercially available kit (Abcam). Mitochondria were isolated from cells by using a mitochondria isolation kit (Abcam) and then used to measure the levels of Ca2+ by using a standard enzyme-linked immunosorbent assay (ELISA; Abcam) according to the manufacturer's instructions.
Generation of RGS7 KO HepaRG cells using CRISPR/Cas9
Guide RNA (gRNA) targeting human RGS7 gene exon 17 were designed by using tools available from Integrated DNA Technologies (IDT, Newark, NJ). High on-target and low off-target gRNAs were chosen without a PAM sequence, cloned into the PX459 CRISPR system plasmid (Addgene) by using standard methods as previously described (63), and confirmed via sequencing. The resulting construct was transfected into HepaRG cells by using lipofectamine 3000 (Thermo Fisher Scientific).
Cells were re-plated 48 h post-transfection and subjected to puromycin selection. After 14 days, puromycin-selected colonies were plated at 1 cell/well. Twenty-one colonies were picked, and each colony was pelleted down separately for subsequent genomic DNA isolation by phenol/chloroform/isoamyl alcohol extraction for sequencing and protein detection by Western blotting. We successfully knocked out RGS7 in one colony (colony 18). The T7 endonuclease 1 (T7E1) mismatch detection assay was used for validation (Supplementary Fig. S2).
Albumin detection
Control or RGS7 KO cells were treated with PA (24 h, 400 μM), and cell culture supernatants were used to measure albumin concentration with a commercially available kit (Abcam). RGS7-deletion constructs were used to restore RGS7 expression in a subset of samples.
Human serum for cell culture experiments
Human hepatocytes were transfected with scramble or RGS7 shRNA and then incubated with the media containing sera of control and NAFLD subjects (10%). The blood was collected from individuals without (control) or with (NAFLD) a confirmed diagnosis of NAFLD. The serum was isolated from the blood via standard methods. The cell lysates were processed for Western blotting as described earlier.
Data acquisition and statistical analyses
Our murine physiology dataset was generated from two independent animal cohorts. Cell culture experiments were performed with a minimal experimental N of 3. All immunoblots are representative of at least three independent experiments. Electronic laboratory notebooks were not used for data collection. Data were analyzed by student's t-test, one- or two-way analysis of variance (ANOVA) with the post hoc adjustments as appropriate. Datasets were checked for equal variance and normality by utilizing the Brown-Forsythe test and the Shapiro-Wilk test, respectively.
If the data were non-normal, a nonparametric test was substituted (Kruskal-Wallis with Dunn's multiple-comparisons test or Mann–Whitney for one-way ANOVA or t-test, respectively). Statistical analyses were performed by using GraphPad Prism Software (La Jolla, CA). Results were considered significantly different at p < 0.05. Values are expressed as means ± standard error of the mean.
Footnotes
Acknowledgments
The authors acknowledge CBMR and the Department of Biotechnology (DBT), India for the funding. They also thank Dr. Santosh Chauhan, Institute of Life Science, Bhubaneswar, India for the kind gift of LC3-GFP plasmid and Dr. Sudipta Saha (Late), Assistant Professor, Babasaheb Bhimrao Ambedkar University, Lucknow and his laboratory members for helping in all the mice experiments. They also acknowledge the support of the Department of Zoology, University of Kalyani.
Authors' Contributions
Conception and design: M.B., K.D., K.B., A.S., and B.M. Acquisition of data: M.B., K.D., T.M., A.S.S., S.B., and B.M. Analysis and interpretation of data (e.g., statistical analysis, biostatistics, computational analysis): M.B., K.D., T.M., A.S.S., S.K.V., S.B., K.B., A.S., and B.M. Writing, review, and/or revision of the article: M.B., K.D., A.S., and B.M. Study supervision: B.M.
Author Disclosure Statement
The authors declare no conflicts of interest.
Funding Information
This work was supported by the CBMR, Department of Medical Education, Uttar Pradesh, DBT, India (BT/PR28635/MED/30/2145/2019) and the Indian Council of Medical Research (5/4/1–26/2020-NCD-I) to B.M. M.B. acknowledges UGC for the PhD research support (MAY2018-354592).
Supplementary Material
Supplementary Data
Supplementary Figure S1
Supplementary Figure S2
Supplementary Figure S3
Supplementary Figure S4
Supplementary Figure S5
Supplementary Figure S6
Supplementary Figure S7
Supplementary Figure S8
Supplementary Figure S9
Supplementary Figure S10
Supplementary Figure S11
Supplementary Figure S12
Supplementary Figure S13
Supplementary Figure S14
Supplementary Figure S15
Supplementary Table S1
Supplementary Table S2
Supplementary Table S3
Supplementary Table S4
Supplementary Table S5
Supplementary Table S6
Blots
Abbreviations Used
References
Supplementary Material
Please find the following supplemental material available below.
For Open Access articles published under a Creative Commons License, all supplemental material carries the same license as the article it is associated with.
For non-Open Access articles published, all supplemental material carries a non-exclusive license, and permission requests for re-use of supplemental material or any part of supplemental material shall be sent directly to the copyright owner as specified in the copyright notice associated with the article.