
Abstract
Aims:
The anticancer function of superoxide dismutases (SODs) is still controversial. SOD3 is an extracellular superoxide dismutase and contains a single N-glycan chain. The role played by the N-glycosylation of SOD3, as it relates to lung cancer, is poorly understood. For this, we performed the structural and functional analyses of the N-glycan of SOD3 in lung cancer.
Results:
We report herein that the fucose structure of the N-glycan in SOD3 was increased in the sera of patients with lung cancer. In cell lines of non-small lung cancer cell (NSCLC), we also found a high level of the core fucose structure in the N-glycan of SOD3, as determined by lectin blotting and mass spectrometry analysis. To address the roles of the core fucose structure of SOD3, we generated FUT8 (α1,6-fucosyltransferase) gene knockout A549 cells. Using these cells, we found that the core fucose structure of SOD3 was required for its secretion and enzymatic activity, which contributes to the suppression of cell growth of NSCLC cells.
Innovation:
The core fucosylation is required for the secretion and enzymatic activity of SOD3, which contributes to anti-tumor functions such as the suppression of cell growth of NSCLC.
Conclusion:
The N-glycans, especially those with core fucose structures, regulate the anti-tumor functions of SOD3 against NSCLC. Antioxid. Redox Signal. 38, 1201–1211.

Introduction
Superoxide dismutases (SODs) are a class of enzymes that catalyze the conversion of superoxide into oxygen and hydrogen peroxide (Halliwell et al, 1992; McCord and Fridovich, 1969; Wang et al, 2018). Following the discovery of the first SOD (SOD1) in 1969, other two types of SODs (SOD2 and SOD3) have been identified to date (Marklund, 1982; McCord and Fridovich, 1969; Wang et al, 2018). Among them, SOD3 (other names include extracellular SOD, EC-SOD) is secreted from cells and functions in the extracellular space. As a result, it can be found in the body fluids such as sera and urine in humans (Kuo et al, 2019). Although the results of numerous studies indicate that SODs are associated with diseases, the detailed mechanisms of how SOD3 modulates the state of these diseases are poorly understood.
In the lung, SOD3 is primarily expressed in type-II alveolar epithelial cells and vascular endothelial cells (Folz et al, 1997). It has been reported that SOD3 is involved in several types of lung diseases and biological events, for example, pulmonary emphysema (Yao et al, 2010), pulmonary hypertension (Xu et al, 2011), and lung tissue remodeling (Tseng et al, 2020). Importantly, the expression of SOD3 is significantly decreased in many types of cancers, including lung cancer (Griess et al, 2017), indicating that removing extracellular superoxide by SOD3 protects against cancer development. Notably, the activation of SOD3 suppresses the invasiveness of lung cancer cells and the re-expression of SOD3 in tumor-associated endothelial cells improves sensitivity to chemotherapy in a mouse model of lung cancer (Mira et al, 2018; Teoh-Fitzgerald et al, 2012). Because of these reports, SOD3 is now considered to be a target for cancer treatment.
Innovation
The function of N-glycan of SOD3 has not been understood well in nonsmall-cell lung cancer (NSCLC). We performed structural analysis of N-glycans of SOD3 and found that core fucosylation was required for the secretion and enzymatic activity of SOD3, which contributed to antitumor functions such as the suppression of cell growth of NSCLC.
On the contrary, glycosylation is one of the most important posttranslational modifications of proteins (Varki, 2017). Glycosylation is tightly controlled by the expression of glycosyltransferases, nucleotide sugars, acceptors, and so on. Disrupting the glycosylation processes results in the expression of abnormal glycan structures, which is often involved in the onset and progression of disease. Importantly, Strömqvist et al (1991) for the first time reported that SOD3 carries a single N-glycan chain at the Asn89 residue. The in vitro turnover of SOD3 is regulated by its glycosylation, however, the recombinant SOD3 and a nonglycosylated SOD3 mutant in which Asn89 was mutated to Gln89 were found to essentially retain the original properties of SOD3 (Edlund et al, 1992). SOD1 (Cu/Zn-SOD) and SOD2 (Mn-SOD) are intracellular SOD and do not carry any glycans.
On the contrary, our group previously reported that the N-glycosylation of SOD3, especially terminal sialylation, was essential for its secretion (Ota et al, 2017; Ota et al, 2016). While these studies strongly suggest that a relationship exists between the glycan modification of SOD3 and the development of the disease, however, this relationship has not been clearly demonstrated yet. Concerning this, in this study, we performed a structural analysis of the N-glycan of SOD3 in lung cancer and found that the core fucose structure of SOD3, a key glycan modification, suppresses the growth of nonsmall-cell lung cancer (NSCLC) cells.
Results
The fucose structure of N-glycan in SOD3 is increased in the sera of lung cancer patients
To examine the issue of whether SOD3 expression is associated with lung diseases, we measured the amount of SOD3 in the sera of the patients with chronic obstructive pulmonary disease (COPD), interstitial pneumonia (IP), and lung cancer and control healthy donors by an enzyme-linked immunosorbent assay (ELISA). As shown in Figure 1A, the total amount of SOD3 protein in the sera of IP patients was increased slightly compared with control healthy donors. While the total amounts of SOD3 in the sera of COPD and lung cancer patients were not changed much.

This result indicates that the amount of SOD3 protein in the sera, as measured by ELISA, was not associated with the status of these lung diseases. Since SOD3 contains only a single N-glycan chain, we then analyzed the N-glycan structure of SOD3 in the sera with an AAL (Aleuria aurantia lectin). AAL can specifically detect the fucose structure of an N-glycan including core fucose (Fukumori et al, 1989; Nagata et al, 1991). Interestingly, the fucose structure of the N-glycan in SOD3 in the several patients with lung cancer was increased strongly compared with control healthy donors and other diseases (Fig. 1B). These data suggest that the fucose structure of the N-glycan in SOD3 has a specific meaning in lung cancer.
N-glycosylation is required for the secretion of SOD3 in NSCLC cells
Our group recently reported that the N-glycosylation of SOD3 was required for its secretion in COS7, HeLa, and HEK293T cells (Ota et al, 2017; Ota et al, 2016). To examine the function of N-glycosylation of SOD3 in lung cancer cells in this study, we analyzed A549 and PC-9 cells, human NSCLC cell lines. Because the endogenous expression level of SOD3 was very low in these cells, we performed the analysis by overexpression. As shown in Figure 2A–C, we assessed the level of expression of SOD3 (SOD3/wild-type [WT]) and a non-N-glycosylated mutant of SOD3 (SOD3/N89Q, in which asparagine 89 is replaced with glutamine) in cell lysates and culture media by Western blotting. Sodium dodecyl sulfate–polyacrylamide gel electrophoresis (SDS-PAGE) and Coomassie Brilliant Blue staining for the samples of culture media were also performed as loading controls (Supplementary Fig. S1).
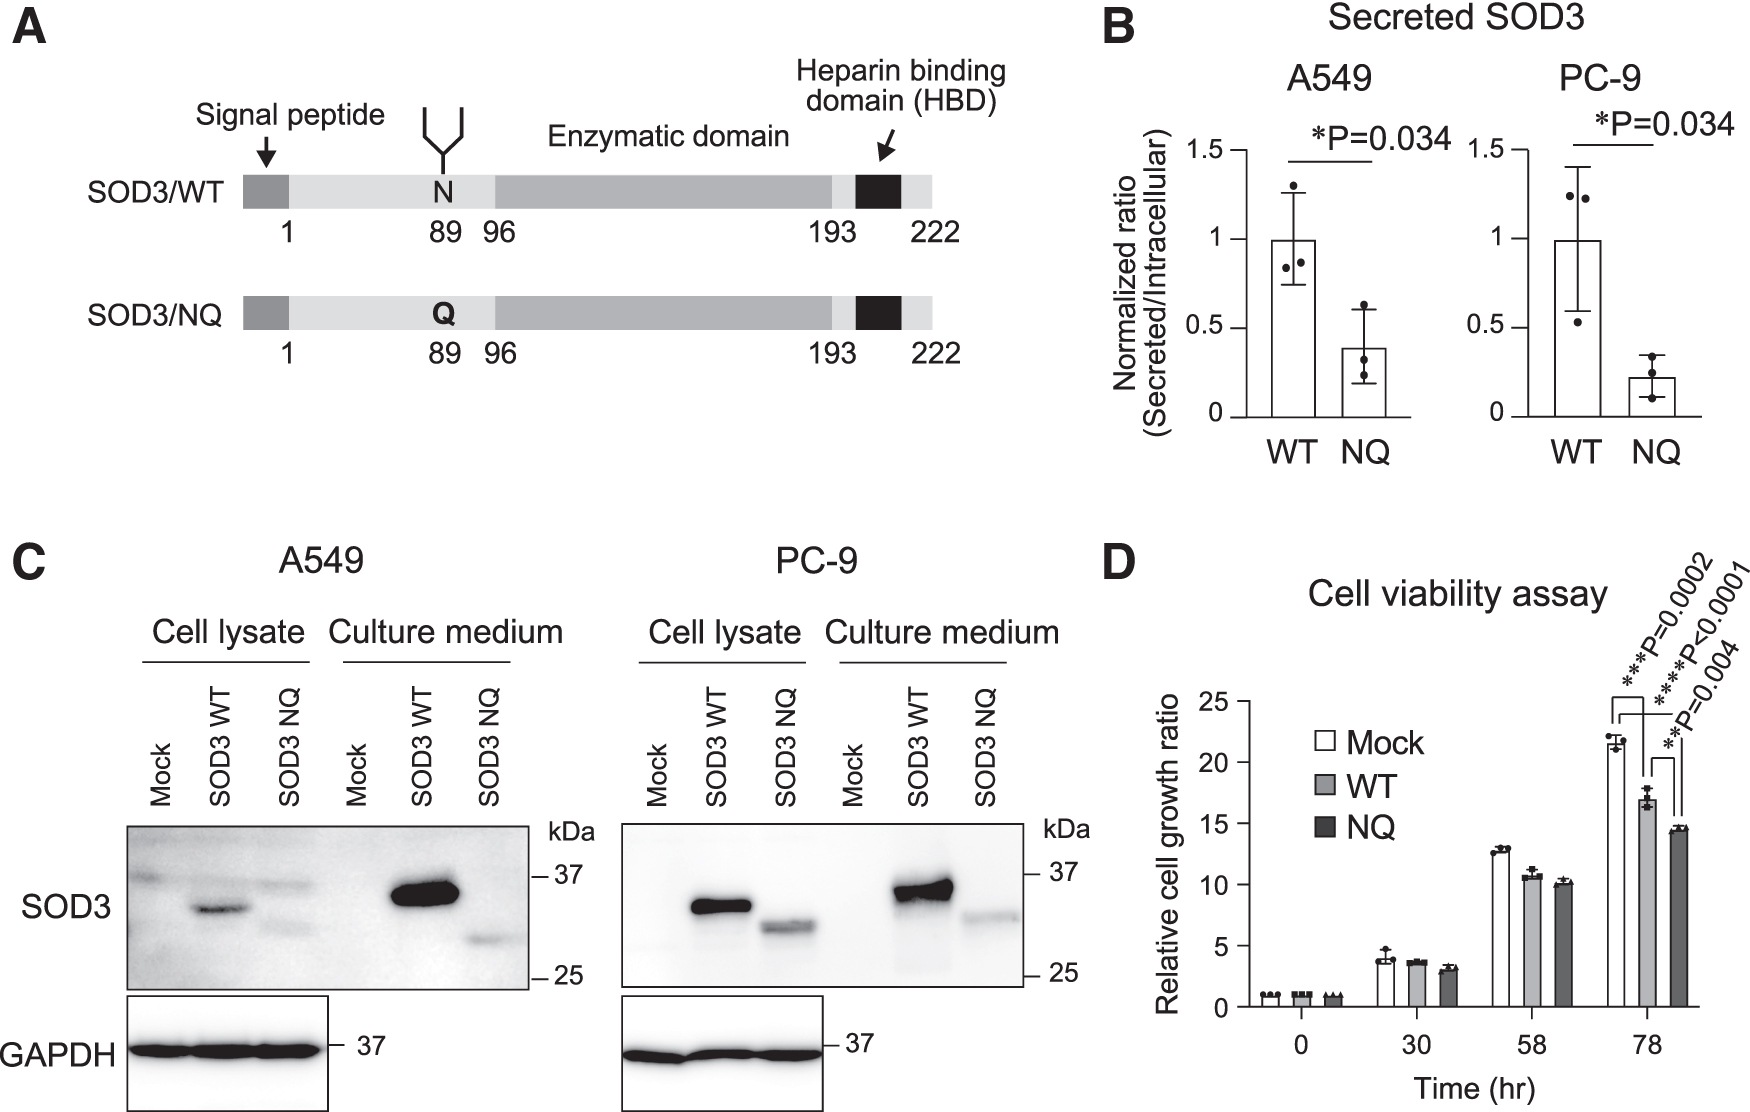
We found that the ratio for the secreted SOD3 against intracellular SOD3 was significantly decreased when SOD3/N89Q was overexpressed in both the cell lines. These data indicate that N-glycosylation is required for the secretion of SOD3 in NSCLC cells. In addition, we examined the function of N-glycosylation of SOD3 for a cancer phenotype and the results are shown in Figure 2D and Supplementary Figure S1. After the overexpression of SOD3/WT or SOD3/N89Q, we performed cell viability assays (Fig. 2D) and stained the cells with crystal violet in A549 cells (Supplementary Fig. S2). Interestingly, the overexpression of SOD3/N89Q suppressed cell growth more strongly than that of SOD3/WT. The cell growth inhibition by SOD3/WT was also observed when a recombinant protein was used (Supplementary Fig. S3).
In addition, we performed cell growth assay again after overexpression in the HepG2: human hepatoma cell line, U251-MG: human glioma cell line, DLD-1: human colon cancer cell line, HeLa: human cervical cancer cell line, and HEK293: human embryonic kidney cell line. As shown in Supplementary Figure S4, SOD3/WT suppressed cell growth in U251-MG cells and SOD3/N89Q suppressed cell growth in U251-MG and HepG2 cells. In other cell lines, we did not see any cell growth inhibition, which indicates that cell growth inhibition by SOD3 depends on the kind of cell type. These results suggest that the overexpression of SOD3 decreases cell growth in NSCLC cells and that N-glycosylation of SOD3 regulates its function.
High level of the core fucose structure of N-glycan in SOD3 is significant in NSCLC cells
We next analyzed the N-glycan structure of SOD3 in NSCLC cells by Western blotting and lectin blotting. The endoglycosidase H (Endo H) digests oligomannose-type and hybrid-type N-glycans, but not the complex type of N-glycans, while the peptide N-glycosidase F (PNGase F) digests all types of N-glycans. After treating the cell lysates and culture media with these enzymes, we performed Western blotting for SOD3. As shown in Figure 3A, the bands corresponding to SOD3 were shifted to the same molecular weight of SOD3/N89Q after the treatment with PNGase F, confirming that a single N-glycan chain is attached at Asn 89 on SOD3. We also observed that a part of the band of the SOD3 in the culture media was shifted by treatment with Endo H. The bands in the cell lysates were shifted to the same molecular weight of SOD3/N89Q by treatment with Endo H.
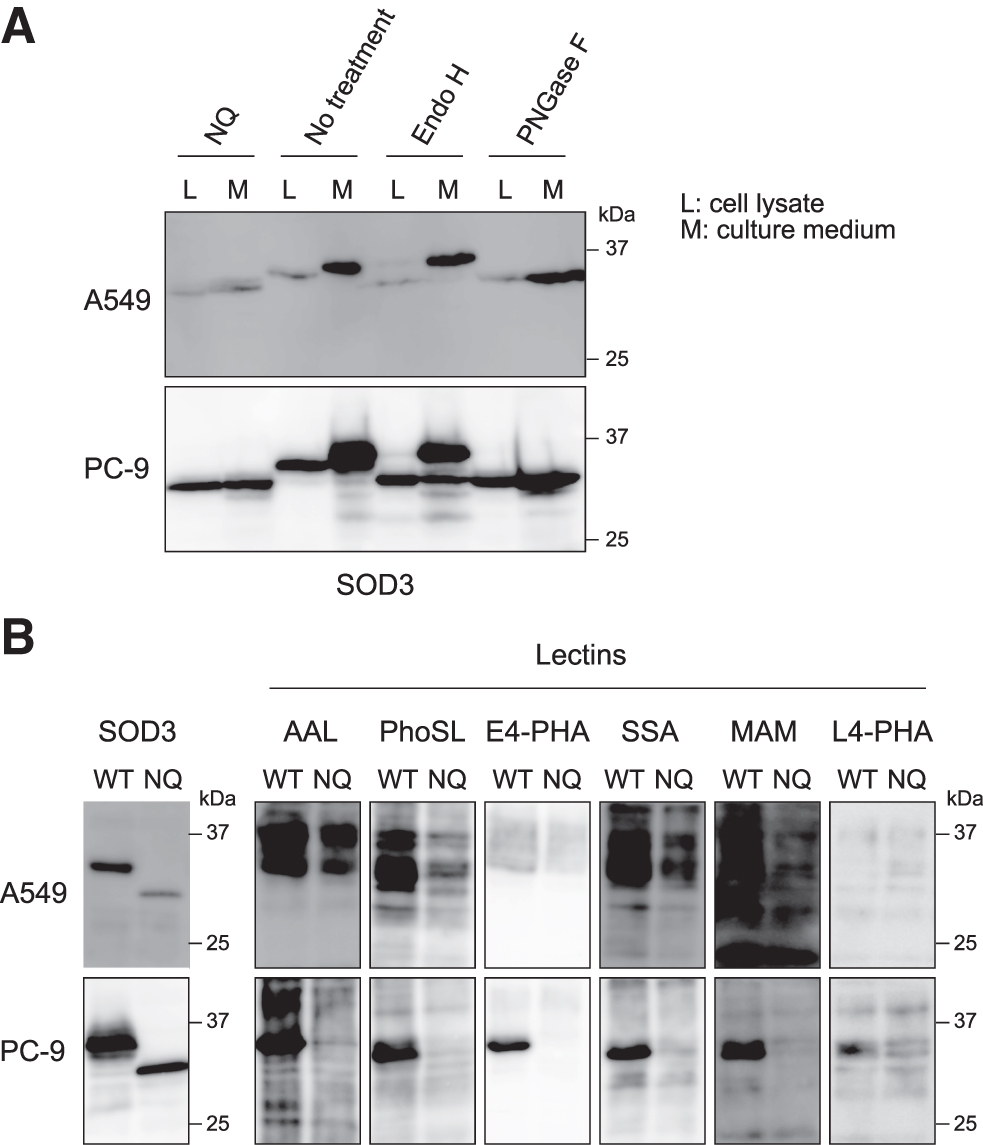
These data suggest that the greater part of the intracellular SOD3 contains an oligomannose type of N-glycan, while the secreted form of SOD3 contains a complex type of N-glycan. Moreover, in the lectin blotting, as shown in Figure 3B, we observed that AAL and PhoSL (Pholiota squarrosa lectin) reacted strongly against the secreted SOD3, which was immunopurified from the media of both cell lines. We also observed the strong reactivity of E4-PHA (Phaseolus vulgaris lectin), SSA (Sambucus sieboldiana lectin), and MAM (Maackia amurensis lectin) only in PC-9 cells. PhoSL specifically detects the core fucose structure of an N-glycan (Kobayashi et al, 2012). These data additionally indicate that a complex type of N-glycan in secreted SOD3 contains numerous fucose structures in addition to a core fucose in NSCLC.
We also analyzed the N-glycan structures of SOD3 by liquid chromatography-mass spectrometry (LC-MS). For this, SOD3 that was overexpressed in A549 cells was collected from the cell culture media and purified by immunoprecipitation. To unequivocally identify the core fucose structure, the terminal sialic acids were removed by an acetic acid treatment, and the resulting desialylated N-glycans were labeled with TMT6 before LC-MS analysis. As shown in the base peak chromatogram (BPC) in Figure 4A, the strongest peak was observed at a retention time of 52.04 min. The extracted ion chromatogram (EIC) of m/z 1044.949 indicated a glycan structure consisting of (Hex)2(HexNAc)2(Deoxyhexose)1+(Man)3(GlcNAc)2 (Fig. 4B). The tandem mass spectrometry analysis of an ion peak at m/z 1044.949 defined the core fucose structure of N-glycan (Fig. 4C). The additional analysis of all the ion peaks elucidated several proposed glycan structures and their occupancy rate (Fig. 4D).
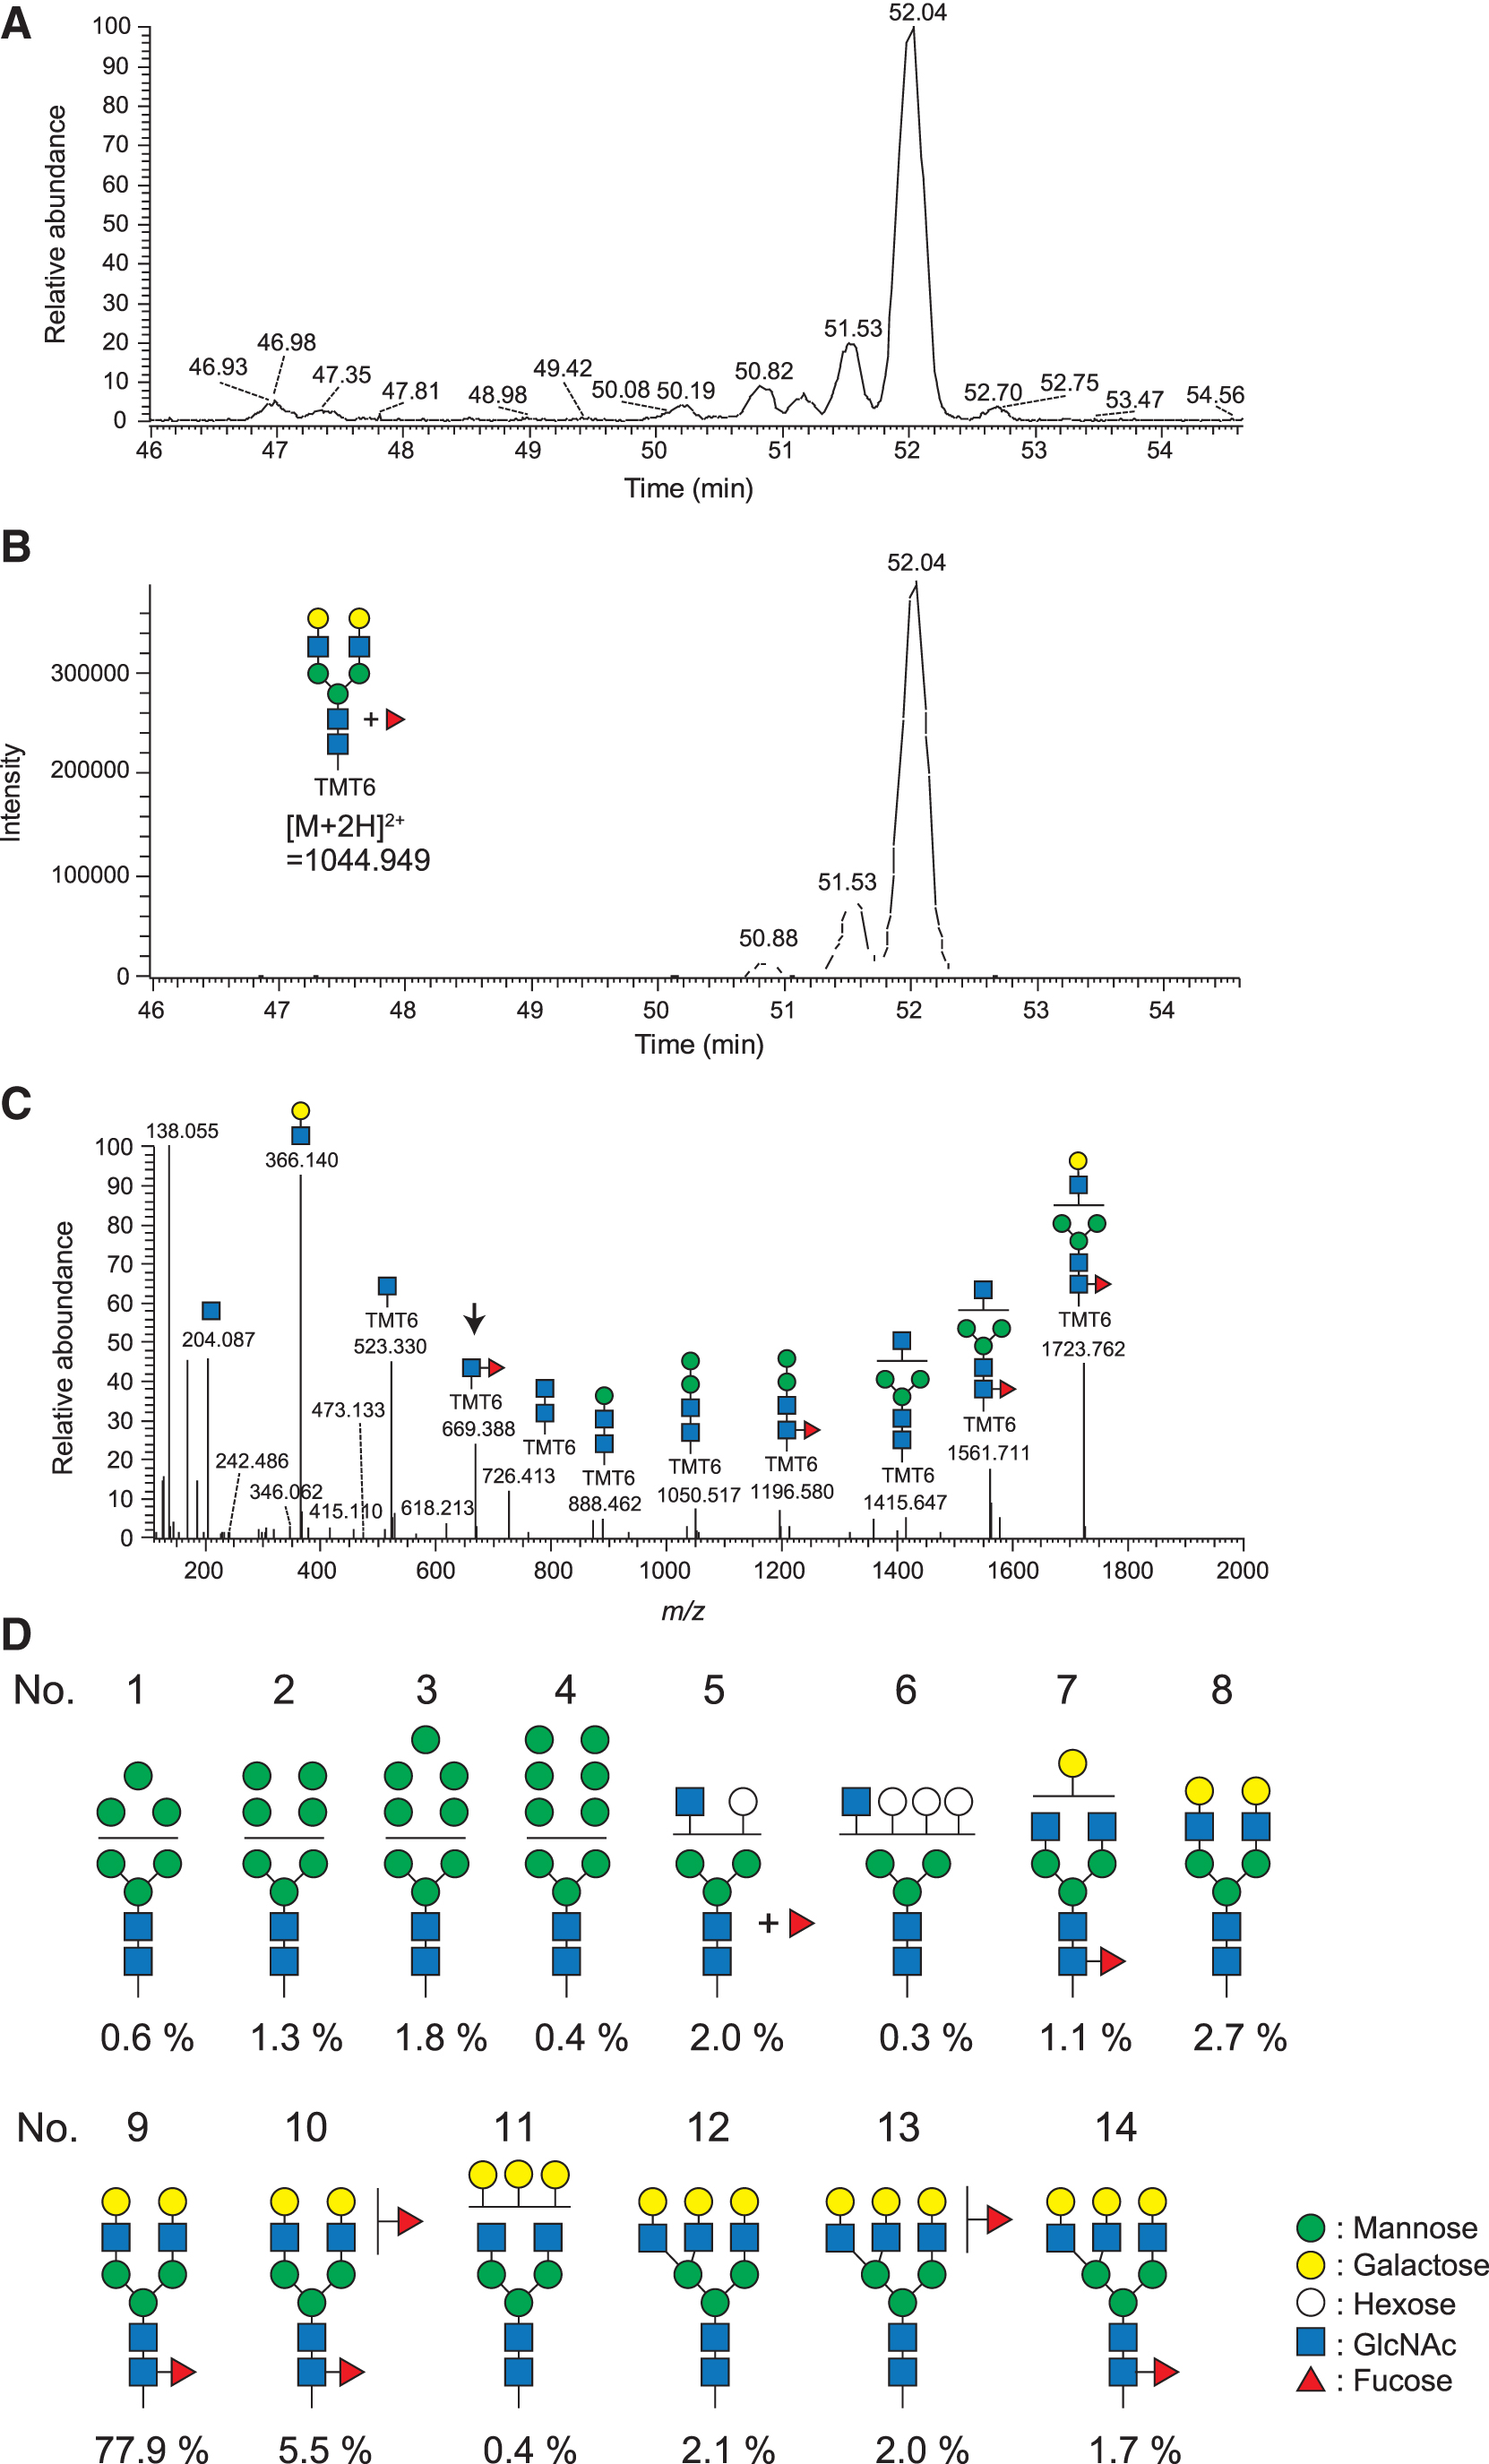
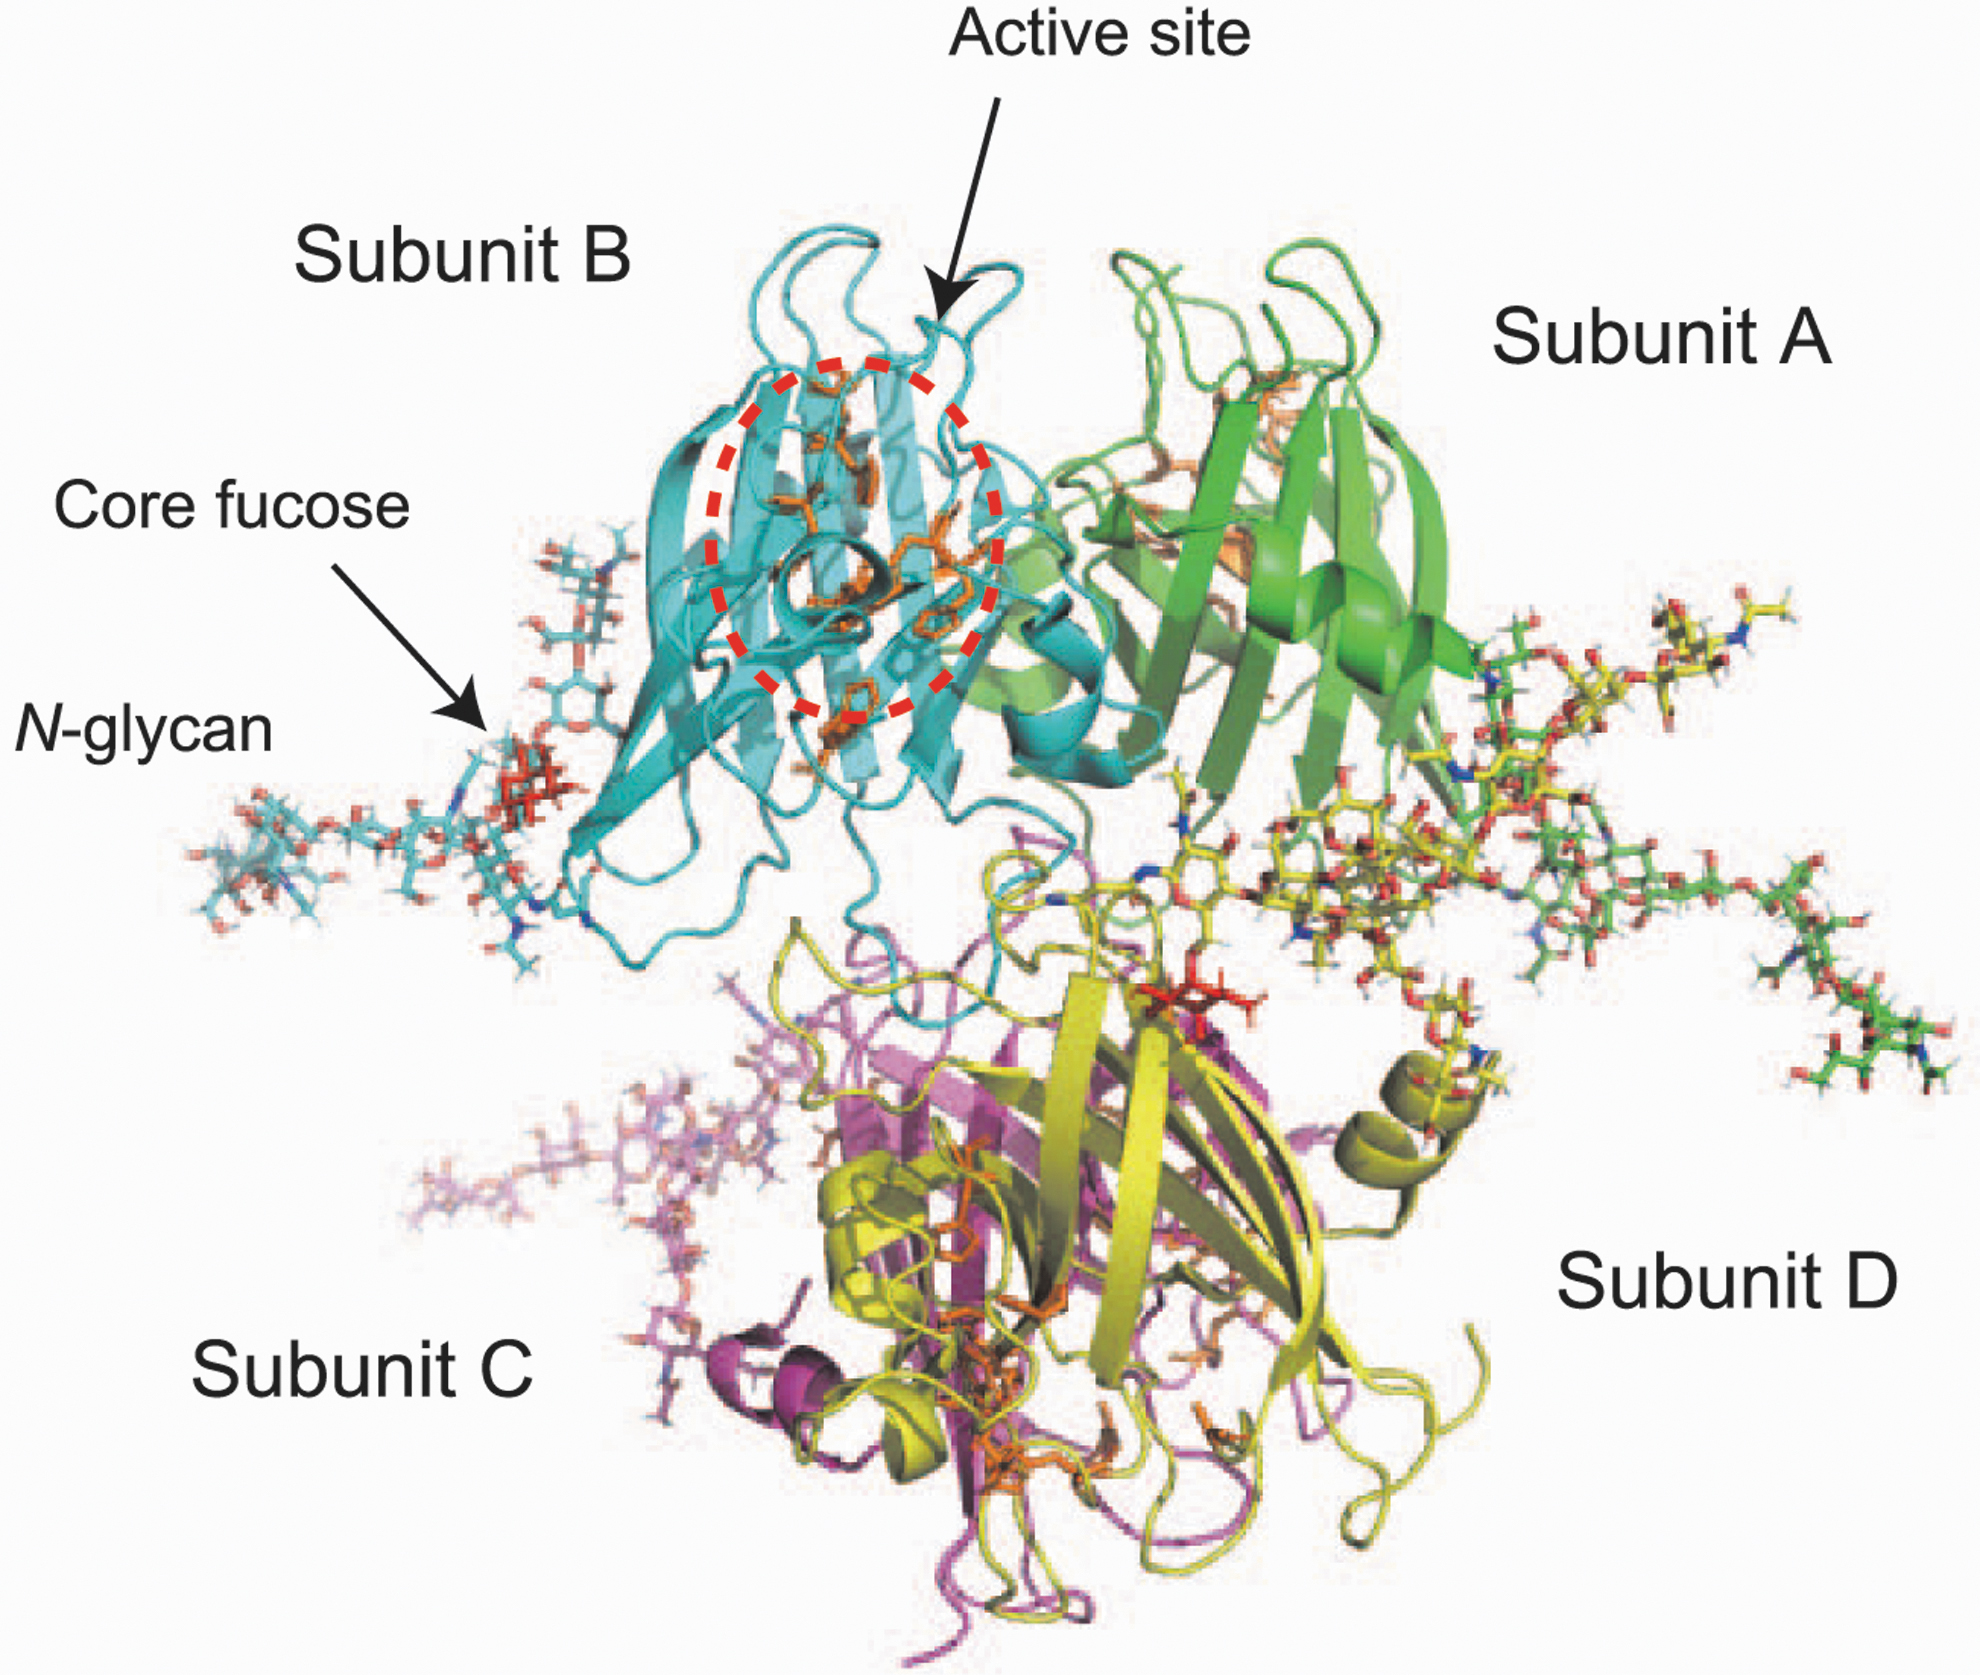
Interestingly, ∼90% of the glycan carries a core fucose structure, especially (Gal)2(GlcNAc)2(core fucose)1+(Man)3(GlcNAc)2, which accounts for 77.9% of the glycans (No. 9 as shown in Fig. 4D). Regarding these results, we constructed a three-dimensional structural model of N-glycosylated SOD3 by using the GlyProt web tool (Bohne-Lang and von der Lieth, 2005). As shown in Figure 5, core fucose is not associated with the active site of SOD3 but, rather, is localized near the polypeptide. This indicates that a core fucose is involved in the stabilization of SOD3 tertiary structure.
The core fucose structure is involved in the secretion and enzymatic activity of SOD3
The core fucosylation of N-glycans is exclusively generated by the action of the α1,6-fucosyltransferase (FUT8) (Supplementary Fig. S5). To examine the roles of the core fucose structure of SOD3, we produced and analyzed FUT8 gene knockout A549 cells (FUT8-KO). FUT8-KO cells do not express the FUT8 protein and the overall activity for the generation of core fucose structure is shown in Figure 6A. Lectin blotting with SSA, ConA, L4-PHA, and E4-PHA in FUT8-KO cells and control cells (in which the FUT8 gene is intact) showed similar band patterns, which indicated that KO of FUT8 gene did not affect the N-glycan structure, except the core fucose structure (Supplementary Fig. S6). Using these cells, we measured the amount of SOD3 that is secreted into the culture media.

At the same time, we also analyzed FUT8-KO cells (KO-rescue) in which the FUT8 gene had been reintroduced. As shown in Figure 6B, the ratio for the secreted SOD3 against intracellular SOD3 was significantly decreased in FUT8-KO cells. As expected, the amount of secreted SOD3 from the FUT8-KO cells in which the FUT8 gene had been reintroduced was similar to that for the control cells. Interestingly, after the overexpression of SOD3 in the FUT8-KO and control cells, the cell growth was suppressed significantly in control cells but not in the FUT8-KO cells (Fig. 6C). We also assessed the activity of SOD3 generated in FUT8-KO and control cells and the findings indicated that the activity in control cells was higher than that in FUT8-KO cells (Fig. 6D, E). These data collectively suggest that the core fucosylation of N-glycan in SOD3 is required for its secretion and enzymatic activity, thereby regulating lung cancer cell growth.
Discussion
The findings in this study demonstrate that the core fucosylation of N-glycan in SOD3 is required for both its secretion and its enzymatic activity. Notably, the fucosylation of SOD3 was significantly increased in the sera of patients with lung cancer (4 out of 10 patients) (Fig. 1B). An anticancer drug treatment and/or irradiation might be involved in the incremental change in the fucosylation level of SOD3, but we were not able to confirm this in this study. The FUT8 enzyme is solely responsible for the generation of the core fucose structure of N-glycan (Uozumi et al, 1996; Yanagidani et al, 1997). It is particularly noteworthy that an increased expression of FUT8 was observed in NSCLC cells, which was correlated with tumor metastasis, disease recurrence, and poor survival in patients (Chen et al, 2013).
The cancer-associated fibroblasts (CAFs) in NSCLC also express FUT8 strongly, which enhances tumor malignancy via the core fucosylation of EGFR (Li et al, 2020). Moreover, FUT8 is considered to be a key regulator in the epithelial–mesenchymal transition in cancer (Taniguchi et al, 2021). The upregulation of FUT8 indicated in NSCLC in these reports would be one of the reasons for the increased fucosylation level of SOD3 in the sera of patients with lung cancer. However, the origin of SOD3 in lung cancer patients has not clearly been understood because it was reported that the expression of SOD3 was downregulated strongly in NSCLC cells in many cases (Teoh-Fitzgerald et al, 2012).
The functions of SOD3 in lung cancer remain controversial, however, removing superoxide from the extracellular space by SOD3 appears to be protective for cancer progression. As shown in Figures 2D and 6C, we observed that the cell growth rate was suppressed by the overexpression of SOD3 in A549 cells. We also revealed that core fucosylation was required for its suppressive function for cell growth, as shown in Figure 6C and D. Notably, it is well known that the glycan structure frequently modulates the tertiary structure of core proteins, which results in the modification of the functions of proteins as well as the protein–protein interactions.
For example, ADCC (antibody-dependent cellular cytotoxicity) is one of the most important examples of regulation by core fucose. Interestingly, the elimination of the core fucose of the N-glycan in immunoglobulin G (IgG) can dramatically enhance the binding affinity to its receptor, FcγRIII (Jez et al, 2012; Shinkawa et al, 2003). This is a favorable technology for molecular targeting therapy for cancer patients because the antitumor function of immune cells can be strengthened via the enhanced recognition of tumor antigens with IgG. Other research groups (including our group) reported on the essential roles of core fucose in T cell receptor signaling (Okada et al, 2017), TGF beta receptor signaling (Wang et al, 2005), cell adhesion and invasion via integrin family (Zhao et al, 2006), and so on.
These functional modifications of proteins are likely caused by changing their tertiary structure to one that lacks a core fucose. In addition, in the case of SOD3, core fucosylation would be required for maintaining its tertiary structure correctly thus permitting it to be secreted and to exhibit substantial enzymatic activity.
Glyco-redox is a keyword that links oxidative stress and changes of glycans (Khoder-Agha and Kietzmann, 2021; Taniguchi et al, 2016). This is the concept used in attempts to investigate reduction–oxidation (redox) responses from the point of view of glycobiology. Notably, several groups including us reported previously that the glycans are regulated in partial by the redox system. For example, reactive oxygen species (ROS) degrade proteoglycan side chains directly (Burkhardt et al, 1986; Roberts et al, 1989). The oxidative stress induced by ROS increases the gene expression of N-acetylglucosaminyltransferase 3 (MGAT3) and decreases N-acetylglucosaminyltransferase 4 (MGAT4) (Ohtsubo et al, 2011; Taniguchi et al, 2016).
These data strongly suggested that the redox system modifies glycan expression patterns. Among the three SODs, SOD3 is a good target for glyco-redox research because other SODs, SOD1 and SOD2 molecules, do not contain any extracellular glycans. The N-glycan structure on SOD3 could be modulated by intra- and extracellular stimuli. Uncovering the mechanisms for the N-glycan modification and how it changes the redox response would be an important next issue. The findings reported herein indicate that SOD3 and its glycosylation represent a potentially important therapeutic target for the treatment of lung cancer.
Materials and Methods
Human serum samples
The serum samples of the patients with COPD, IP, and lung cancer and control healthy donors were prepared at the Nippon Medical School Hospital. Ten milliliters of whole blood was withdrawn and collected into a test tube with a coagulation activator and a gel serum separator. Then, the tube was centrifuged at 2095 g (3000 rpm) for 10 min. The supernatant was collected as a serum sample. The studies using human sera were approved by the Local Ethics Committees at Nippon Medical School Hospital and Osaka International Cancer Institute.
Analyze serum SOD3 by ELISA and pull-down assay
A 96-well plate (Cat. No. MS-8496F; Sumitomo Bakelite Co., Ltd., Tokyo, Japan) was incubated with 50 μL/well of the rabbit anti-human SOD3 polyclonal antibody (5 μg/mL in 50 mM bicarbonate buffer, pH 9.6) at room temperature for 2 h. The rabbit anti-human SOD3 antibody was generated in our laboratory, as described in a previous report (Ota et al, 2017). After washing with TBST (0.1% Tween20 in Tris-buffered saline) three times, the plate was blocked with 2% bovine serum albumin (BSA) in the phosphate buffer (50 mM sodium phosphate, 150 mM sodium chloride). After washing with TBST, 20 times diluted human serum samples in the phosphate buffer were added and incubated at room temperature for 2 h.
Then, the plate was washed with TBST again and incubated with the rabbit anti-human SOD3 antibody labeled with biotin at room temperature for 2 h. In addition, after washing with TBST, the plate was incubated with HRP-labeled streptavidin (Cat. No. RPN4401; GE Healthcare, Chicago, IL) at room temperature for 10 min. After washing with TBST, the plate was incubated with SureBlue™ TMB 1-Component Microwell Peroxidase Substrate (Cat. No. 5120-0075; SeraCare Life Sciences, Inc., Milford, MA) for the color development reaction. The absorbance at 450 nm was measured with a plate reader, Infinite M Plex (TECAN, Männedorf, Switzerland).
To analyze the fucosylation of SOD3 in sera, 400 μL aliquots of human serum samples were incubated with 400 μL of protein G Sepharose™ 4 Fast Flow (Cat. No. 17-0618-02; GE Healthcare) for 1 h under rotation to remove serum immunoglobulins. After centrifugation, 100 μL of AAL-agarose (Cat. No. AL-1393-2; Vector Laboratories, Inc., Burlingame, CA) was added into the resulting supernatants and incubated for 1 h under rotation. After washing twice with TBST, the agarose was boiled in 50 μL of sample buffer (50 mM Tris [pH 6.8], 2% [w/v] SDS, 2.5% [v/v] 2-mercaptoethanol, 9% [v/v] glycerol). Half their samples were analyzed for SOD3 by Western blotting as described below.
Cell and cell culture
Human lung adenocarcinoma cell lines A549 and PC-9 were obtained from ATCC (American Type Culture Collection) and RIKEN BioResource Research Center, respectively. These cells were cultured in Dulbecco's modified Eagle's medium (DMEM; Cat. No. 044-29765; Wako, Osaka, Japan) supplemented with 10% fetal bovine serum and 1% penicillin–streptomycin (Cat. No. 15140-122; Thermo Scientific™) under 5% CO2 at 37°C.
Preparation of culture media samples and cell lysates
The plasmids, pcDNA3.1/myc-tagged SOD3 and pcDNA3.1/myc-tagged SOD3 N89Q mutant (where asparagine 89 is replaced with glutamine), were transfected into the cells by using PEI MAX® (Cat. No. 24765-100; Polysciences, Inc., Warrington, PA) or jetOPTIMUS® DNA Transfection Reagent (Cat. No. 101000025; Polyplus-transfection, Illkirch-Graffenstaden, France) following the manufacturer's protocol. The next day, the culture medium was replaced with Opti-MEM® I (Cat. No. 31985-070; Thermo Scientific). After an additional incubation of 3 days, the proteins in the culture medium were precipitated by using ethanol as described previously (Ota et al, 2016). The pellets were dissolved in 200 μL of the lysis buffer (1% Triton X-100 in phosphate-buffered saline [PBS]) including a protease inhibitor cocktail (Cat. No. 11836170001; Roche, Basel, Switzerland). For preparing of cell lysates, the cells were washed with ice-cold PBS three times and lysed with the lysis buffer including a protease inhibitor cocktail (Roche).
The resulting lysates were sonicated briefly and centrifuged at 12,000 g at 4°C for 5 min to remove insoluble materials. The protein concentration was measured with the DC Protein Assay Kit (Cat. No. 5000116JA; BioRad Laboratories, Hercules, CA).
Glycosidase treatment
Twenty micrograms samples of proteins from cell lysates or cell culture media were diluted to 20 μL with the sample buffer and heated at 95°C for 5 min. One microliter of 20% Triton X-100 was then added and the resulting solution incubated with 1 μL of protease inhibitor cocktail (Roche). The mixtures were incubated with 500 U of PNGase F (Cat. No. P0704S; New England BioLabs, Ipswich, MA) or Endo H (Cat. No. P0702S; New England BioLabs) at 37°C for 3 h. The resulting samples were heated again in sample buffer and subjected to Western blotting.
Structural analysis of N-glycan by LC-MS
After the overexpression of myc-tagged SOD3 in A549 cells, the cells were incubated with Opti-MEM for 3 days and the culture medium was immunoprecipitated with an anti-myc-tag antibody (Cat. No. 05-724; Millipore, Burlington, MA). The immunoprecipitate was separated by SDS-PAGE and transferred onto PVDF membrane (Cat. No. IPVH00010; Millipore). To visualize proteins, the membrane was stained with Direct Blue 71 (800 μL of solution A: 0.1% [w/v] Direct Blue 71 [Cat. No. 212407-50G; Sigma-Aldrich] in 10 mL of solution B: acetic acid:ethanol:water = 1:4:5).
After washing with solution B, the membrane was allowed to dry at room temperature overnight. The band corresponding to SOD3 was excised and the N-glycans were released by treatment with PNGase F as described previously (Ota et al, 2017), and the sialic acids were removed by treatment with 2 M acetic acid (80°C, 2 h), after which, the sample was labeled with TMT6 by using the aminoxyTMTsixplex™ Isobaric Label Reagent (Cat. No. 90401; Thermo Fisher Scientific) following the manufacturer's protocol. After the purifying and enrichment procedures, the structure of N-glycans was analyzed with LTQ Orbitrap XL (Thermo Fisher Scientific) as described previously (Nakano et al, 2019).
Generation of FUT8 gene KO A549 cells
A549 cells were transfected with pSpCas9(BB)-2A-GFP(PX458) (code: 48138; Addgene) harboring guide RNA sequences targeting the human FUT8 gene. Target sequences are 5′-GGCCAAAGATCTGACAGAAC-3′ and 5′-GGCGCTATGCTACTGGTGGA-3′. After transfection, GFP-expressing cells were enriched with an S3™ cell sorter (Bio-Rad Laboratories). Several clones grown from single cells were then established and the KO of the FUT8 gene was confirmed by a sequencing analysis of genomic DNA.
Western blotting and lectin blotting
Cell lysates and culture media were separated by SDS-PAGE (10% or 12% acrylamide gel). After transferring onto the nitrocellulose membrane (Cat. No. 1620115; Bio-Rad Laboratories), the membrane was blocked with 2% BSA in TBST (0.1% Tween20 in TBS) and incubated with biotin-labeled lectins (AAL, E4-PHA, SSA, MAM, and L4-PHA; Cat. No. J201-R, J211, J218, J210, and J212; J-Chemicals, Tokyo, Japan), an anti-SOD3 antibody, an anti-FUT8 antibody (clone 15C6, a kind gift from FUJIREBIO, Inc., Tokyo, Japan), and an anti-GAPDH antibody (Cat. No. MAB374; Millipore). PhoSL was a kind gift from J-Chemicals. For lectin blotting, the membrane was detected by using the VECTASTAIN® ABC Standard Kit (Cat. No. PK-4000; Vector Laboratories, Inc.).
For Western blotting, the membrane was detected by using an anti-mouse IgG antibody labeled with HRP or an anti-rabbit IgG antibody labeled with HRP (Cat. Nos. NA931 and NA934; GE Healthcare). To visualize the bands, we used Amersham™ ECL™ Prime Western Blotting Detection Reagents (Cat. No. NFL104001EA; GE Healthcare) and ImageQuant LAS-4000mini (Cytiva, Marlborough, MA).
Cell viability assay by measuring cellular ATP levels
After the overexpression of myc-tagged SOD3 in WT or FUT8 gene KO (FUT8-KO) A549 cells, cells (2 × 10³ cells) were replated onto a 96-well plate and incubated for 30, 58, or 78 h. Cell viability was then measured by using the CellTiter-Glo® Luminescent Cell Viability Assay Kit (Cat. No. G7572; Promega, Madison, WI) following the manufacturer's protocol. The luminescent values were measured with a plate reader, Infinite M Plex.
Measurement of enzymatic activity of SOD3
After overexpression of myc-tagged SOD3, cells (7.2 × 10⁶ cells totally) were cultured with Opti-MEM for 3 days. Then, the culture media were collected and concentrated by using Amicon Ultra®-15 (10K device; Cat. No. UFC901008; Millipore). A part of the concentrated sample was analyzed with an SOD assay kit-WST (Cat. No. S311; Dojindo, Kumamoto, Japan) following the manufacturer's protocol. This kit detects SOD activity following WST-1 (tetrazolium salt)-based SOD inhibition assay. The SOD activity was normalized with the expression levels of SOD3 in the culture media determined by Western blotting. For the measurement by cytochrome C reduction, the following reaction mixture was prepared: 1 mL of 75 mM potassium phosphate (pH 7.8), 0.1 mL of 1.5 mM EDTA, 0.1 mL of 0.75 mM xanthine in 0.004 N NaOH (Cat. No. 245-00011; Wako), and 0.1 mL of 0.15 mM cytochrome C (Cat. No. C2506; Sigma).
The resulting solution was then mixed with 0.1 mL of the concentrated sample. After warming at 25°C for 5 min, 0.1 mL of 0.04 U/mL of xanthine oxidase (Cat. No. X1875; Sigma) was added and the absorbance at 550 nm was measured over time (at 1-min intervals) with a plate reader, Infinite M Plex. The activity of SOD was calculated by using the following formula: volume activity (U/mL) = (ΔOD blank ÷ ΔOD sample −1) × 1 ÷ sample volume × dilution factor.
Statistical analysis
All data are presented as mean ± standard deviation. For comparison between multiple groups, one-way analysis of variance test was performed. For comparison between two groups, the Student's t-test analysis was performed.
Footnotes
Acknowledgments
We wish to thank Ms. Fumi Ota, Ms. Ritsuko Oka, and Ms. Hiroko Murakami for their technical help. We also wish to thank Dr. Milton S. Feather for the English language editing.
Authors' Contributions
M.K., Y.O., Y.K., and N.T. designed this study. M.K., K.M., Y.O., N.K., and T.O. performed the experiments. M.N. performed mass spectrometry analysis. M.S. and A.A. collected human samples. Y.Y. analyzed the structural model. M.K. and Y.O. drafted the article. E.M. and N.T. revised the article. All the authors were in agreement with the submission of this article.
Author Disclosure Statement
The authors declare no conflicts of interest associated with this study.
Funding Information
This study was supported by Grants-in-Aid for Scientific Research (C) (18K06914 to N.T. and 20K07629 to Y.O.) and the Takeda Science Foundation. M.K. was a recipient of a grant from the Tokyo Biochemical Research Foundation for graduate students.
Supplementary Material
Supplementary Figure S1
Supplementary Figure S2
Supplementary Figure S3
Supplementary Figure S4
Supplementary Figure S5
Supplementary Figure S6
Abbreviations Used
References
Supplementary Material
Please find the following supplemental material available below.
For Open Access articles published under a Creative Commons License, all supplemental material carries the same license as the article it is associated with.
For non-Open Access articles published, all supplemental material carries a non-exclusive license, and permission requests for re-use of supplemental material or any part of supplemental material shall be sent directly to the copyright owner as specified in the copyright notice associated with the article.