




Abstract
Aims:
Hypopharyngeal cancer (HPC) is associated with the worst prognosis of all head and neck cancers and is typically identified in an advanced stage at the time of diagnosis. While oxidative stress might contribute to the onset of HPC in patients using tobacco or alcohol, the extent of this influence and the characteristics of HPC cells in advanced stage remain to be investigated. In this study, we explored whether HPC cells survived from necrotic xenograft tumors at late stage would display increased tumor resistance along with altered tolerance to oxidative stress.
Results:
The remnant living HPC cells isolated from a late-stage xenograft tumor, named FaDu ex vivo cells, showed stronger chemo- and radioresistance, tumorigenesis, and invasiveness compared with parental FaDu cells. FaDu ex vivo cells also displayed increased angiogenic ability after re-transplantation in mice visualized by in vivo near infrared-II fluorescence imaging modality. Moreover, FaDu ex vivo cells exhibited significant tumor-initiating cell (TIC)-related properties accompanied by a reduction of the level of reactive oxygen species, which was associated with the upregulation of transcription factor nuclear factor erythroid 2-related factor 2 (Nrf2). Interestingly, inhibition of Nrf2 by the RNA interference and the chemical inhibitor could reduce the TIC-related properties of FaDu ex vivo cells.
Innovation:
Oxidative stress potentially initiates HPC, but elevation of Nrf2-associated antioxidant mechanisms would be essential to mitigate this effect for promoting and sustaining the stemness of HPC at the advanced stage.
Conclusion:
Present data suggest that the antioxidant potency of advanced HPC would be a therapeutic target for the design of adjuvant treatment. Antioxid. Redox Signal. 41, 505–521.
Introduction
Hypopharyngeal cancer (HPC) accounts for 17.3% of all head and neck squamous cell carcinomas (HNSCCs) in the South Central Asian region. HPC is commonly diagnosed at late stage with approximately 70% of cases involving lymphatic spread and local invasion, and recurrence contributes to poor prognosis and a high mortality rate in patients with advanced HPC following chemoradiotherapy (Chu and Chang, 2009; Hall et al., 2008; Sanders and Pathak, 2022). Heavy use of both tobacco and alcohol has the highest risk for HPC (Sanders and Pathak, 2023). These risk factors would raise physiological oxidative stress that contributes to the initiation of HPC (Garneau et al., 2018; Manjunath et al., 2010). However, little is known about the association of oxidative stress and advanced HPC that is mainly diagnosed in clinics.
Innovation
Human hypopharyngeal cancer (HPC) is frequently detected at late stage with chemo-radioresistance. Although oxidative stress is considered an initiator of HPC, we first demonstrated that its level was significantly decreased in advanced HPC cells using the xenograft HPC tumor model. In this model, tumor growth was accompanied by numerous cell deaths till late stage, and the remnant living tumor cells exhibited the char cteristics of TICs with enhanced metastatic and angiogenic capacity. Incapability of sustaining oxidative stress in these cells was associated with increased expression of antioxidant Nrf2 molecules. Inhibition of Nrf2 led to the reduction of TIC-related biomarkers in the remnant living cells, suggesting that targeting the antioxidant capacity may be considered a therapeutic strategy for advanced HPC (Fig. 1).
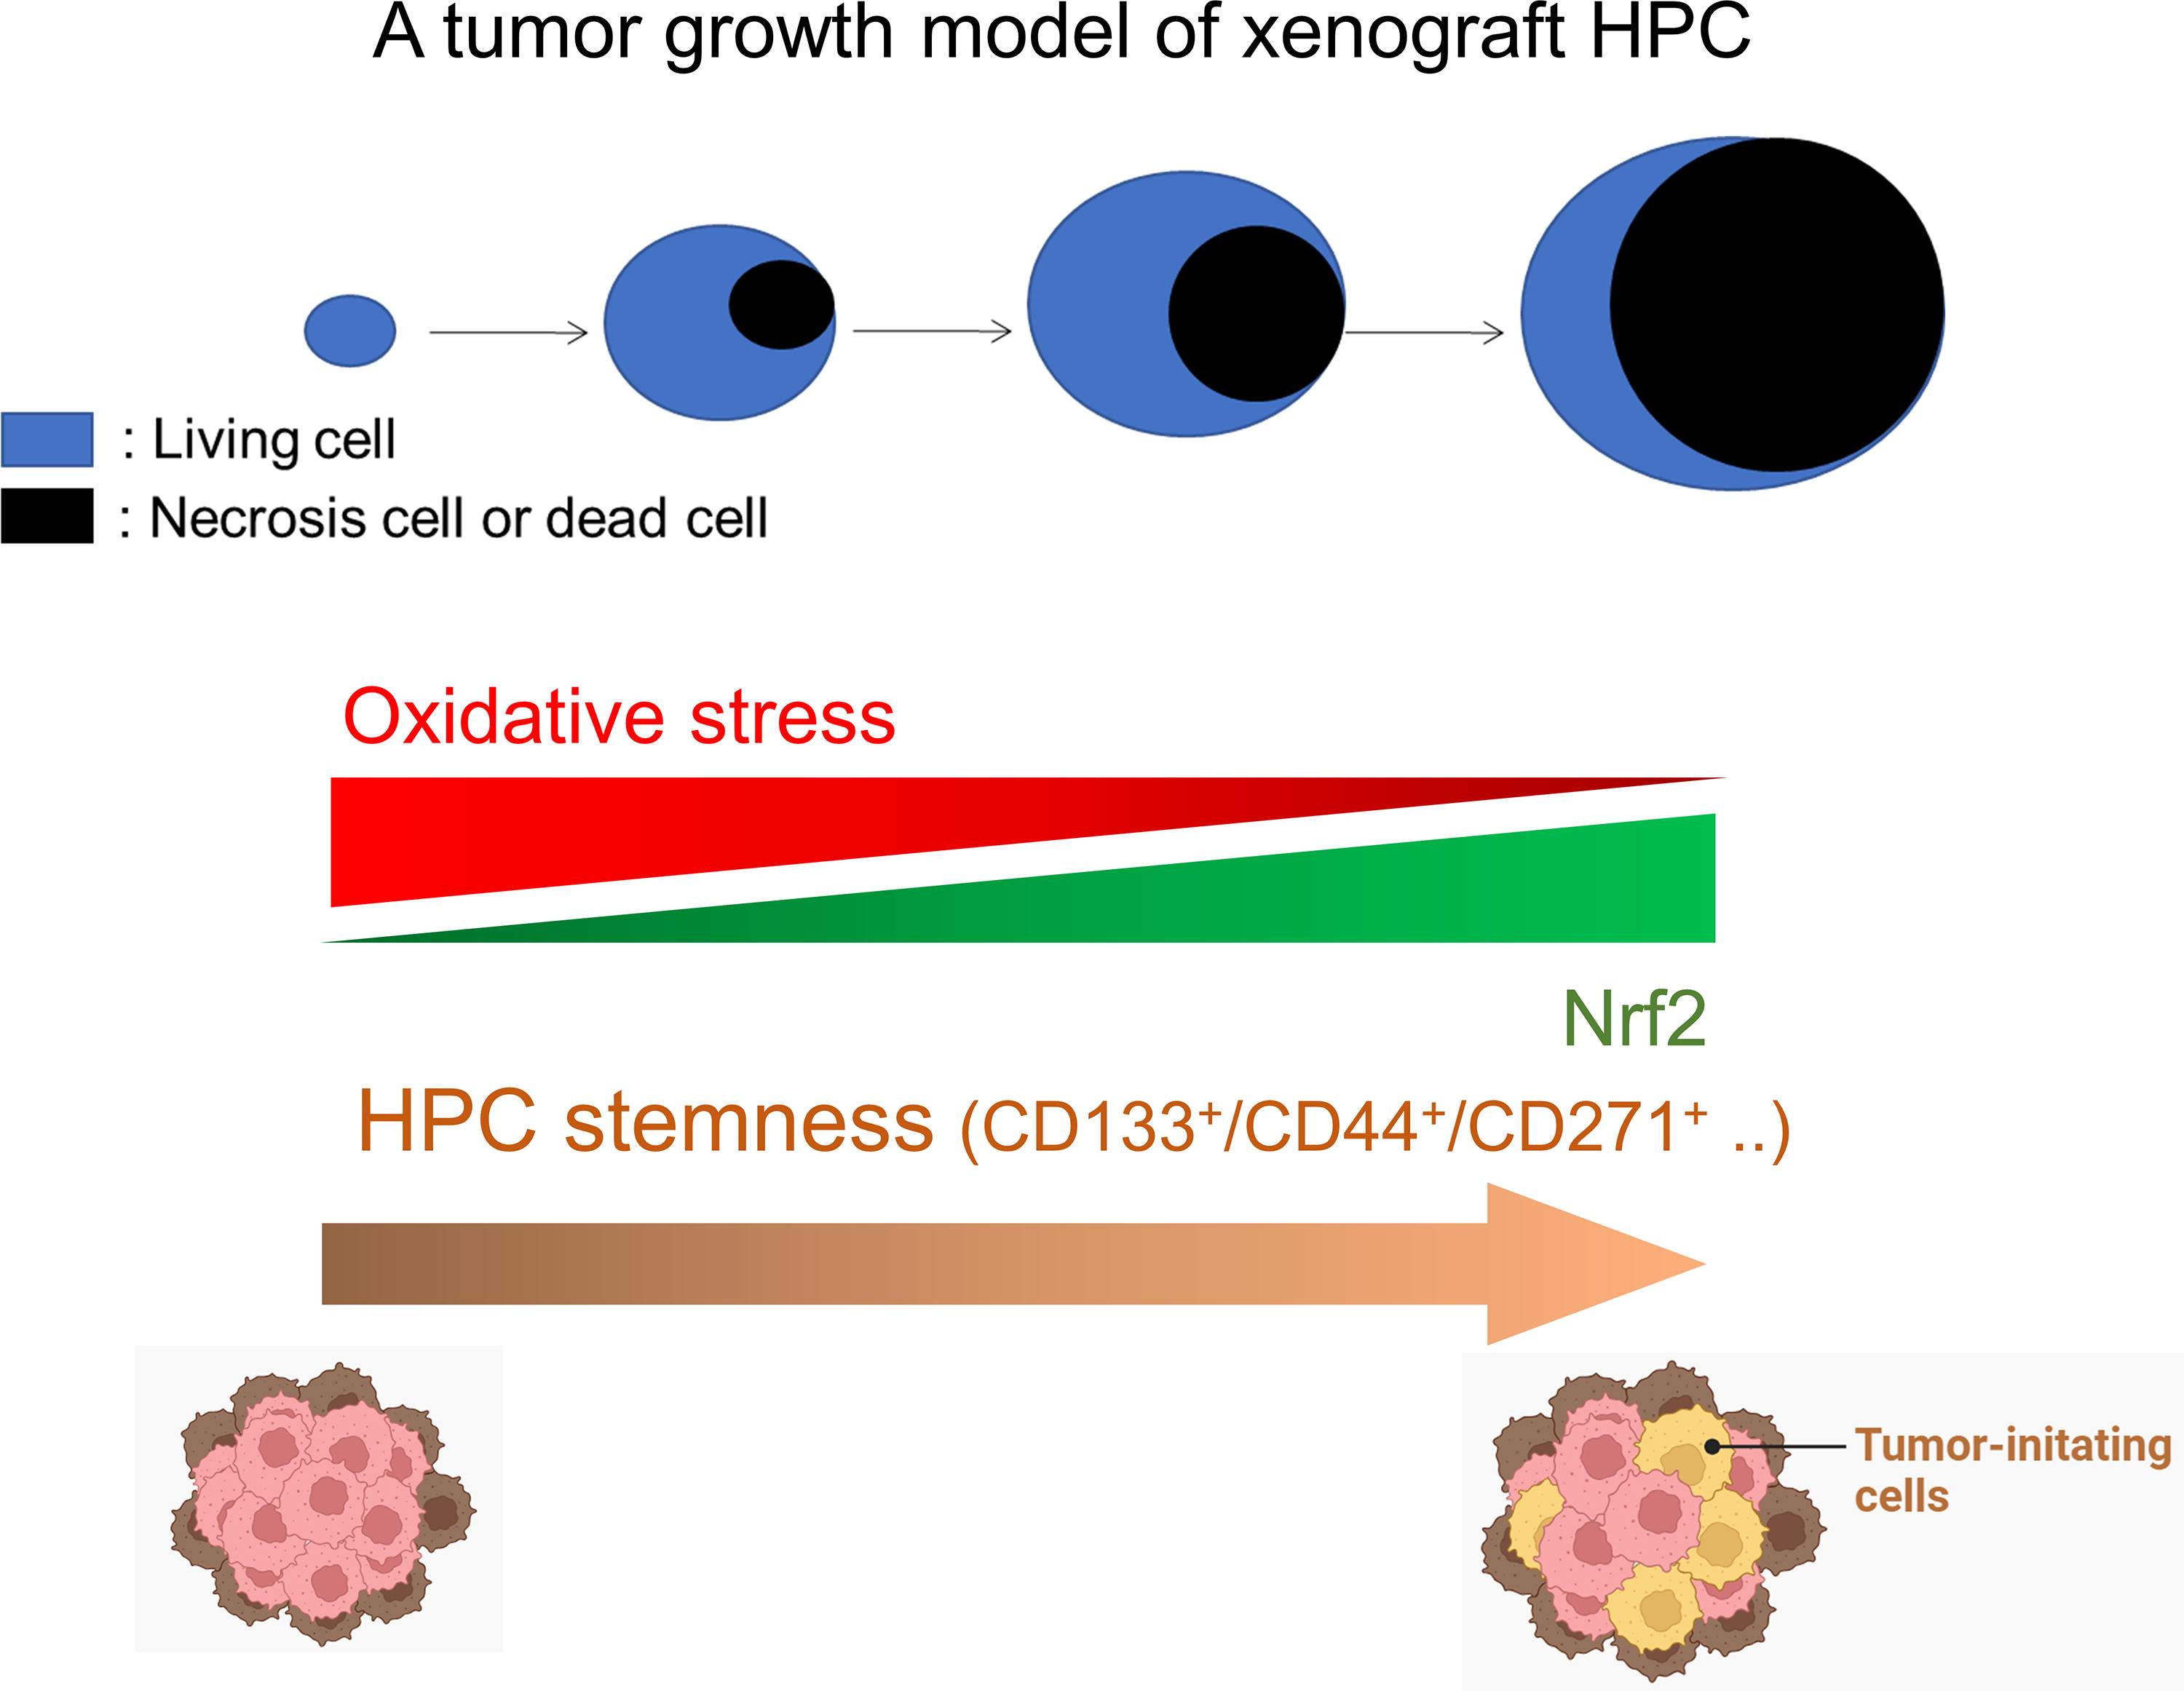
A single modality using chemoradiotherapy or surgery is sufficient for treatment of early-stage HPC without nodal invasion, whereas a multimodality approach is required for the treatment of HPC at advanced stages (Eckel and Bradley, 2019). It suggests that there exists a subset of cell populations within advanced HPC resistant to present therapeutic interventions. Tumor-initiating cells (TICs), also known as cancer stem cells (CSCs) or CSC-like population, are characterized as a subpopulation of aggressively tumorigenic cells in various cancers that can be isolated to induce the formation of tumors in xenotransplantation research using a low cell number (Wu et al., 2023). It has been reported that human HPC contains a CSC-like subpopulation by identifying CD271 (p75 neurotrophin receptor) as a novel biomarker (Imai et al., 2013). Because HPC is frequently diagnosed at an advanced stage, it is speculated that TICs should play an important role for poor prognosis and recurrence. However, the characteristics of TICs isolated from HPC cells remain poorly understood.
Oxidative stress is known as a double-edged sword that could not only inhibit but also promote cancer progression (Azmanova and Pitto-Barry, 2022). Several lines of evidence have demonstrated that oxidative stress is related to the predominance of reactive oxygen species (ROS) over antioxidant states to promote carcinogenesis (Dayem et al., 2010; Iqbal et al., 2024; Rizvi et al., 2021). Chronic oxidative stress has been reported to regulate the metabolic pathways of breast CSCs to induce epithelial–mesenchymal transition (EMT) (Farahzadi et al., 2023). Sustained oxidative stress can also promote differentiation of CSCs into tumor endothelial cells and angiogenesis (Movahed et al., 2021). In glioblastoma CSCs, high oxidative stress is a significant sign partially due to high metabolic demand and hypoxic environment (Krawczynski et al., 2020). On the contrary, CSCs or CSC-like cells may maintain low intracellular oxidative stress levels for their stemness-related properties (Lendeckel and Wolke, 2022). In the case of HPC, oxidative stress is known as an important factor for the onset of this cancer type (Manjunath et al., 2010). However, the oxidative condition of the TIC subpopulation within late-stage HPC remains to be addressed.
The nuclear factor erythroid 2-related factor 2 (Nrf2) was known to bind to the antioxidant response elements and regulate the expression of antioxidant- and detoxification-related genes (Jenkins and Gouge, 2021; Tonelli et al., 2018). Upregulation of Nrf2 is regarded as an important mechanism for the promotion of cancer survival (Zhang et al., 2022). In CSCs and CSC-like cells, Nrf2 has been reported to cooperate with mitochondrial functions to regulate ROS levels and maintain the stemness of CSCs (Payandeh et al., 2020). Whether the expression of Nrf2 is associated with late-stage HPC cells is intriguing and needs to be further studied.
In this study, we established an HPC xenograft tumor model with the fluorescence reporter gene imaging technique to isolate the remnant living cells in late-stage tumors. These remnant living cells showed enhanced metastatic and angiogenic ability. Moreover, these cells displayed TIC-related characteristics, including the increase in tumorigenesis, sphere formation, and expression of CSC-associated biomarkers. The level of ROS was further found to be reduced in these remnant living cells, and Nrf2 was simultaneously upregulated. Furthermore, inhibition of Nrf2 was sufficient to reduce the properties of TICs using siRNA and Nrf2 inhibitor. The association of this cell population with preclinical and clinical treatment of HPC was discussed.
Results
Fluorescence imaging of xenograft tumor progression in vivo and isolation of survival cells at late-stage tumors
To investigate the survival cells at late-stage xenograft tumor, the piggyBac transposon system was used for delivery of monomeric red fluorescent protein (mRFP) and herpes simplex virus type-1 thymidine kinase for fluorescence-based and radionuclide-based imaging of tumor growth in small animals in a previous study (Chen et al., 2012). In this study, the expression of reporter genes was sustained in human HPC FaDu cells (named FaDu-PB2R cells) expressing mRFP compared with parental FaDu cells by fluorescence microscopy (Fig. 2A). Cells were also collected for dose-dependent optical imaging, and the intensity of the fluorescent signal was dependent on the number of FaDu-PB2R cells to ensure that the fluorescent signal can reflect the living cell numbers (Fig. 2B). We then established the xenograft tumor model using these cells, and the in vivo optical imaging showed that the fluorescent signals were detected in the FaDu-PB2R tumor, but were not detected in the FaDu tumor in the right thigh and left thigh, respectively (Fig. 2C). The tumor growth rates of both tumors were not significantly different (Fig. 2D). However, the fluorescent signal increased up to 2 weeks of tumor growth, followed by a decrease in this signal to the end-point of tumor size in each tumor-bearing mouse (Fig. 2E and Supplementary Fig. S1). Excision of xenograft tumor at a late stage (approximately 2000 mm3) showed significant necrotic regions after the tumor was cut (Fig. 2F). We decided to investigate the remnant living cells in the late-stage tumor, and the resected tumor mass was cultured in a medium (see the Materials and Methods section) for crawling of living cells (Fig. 2G). The cells that crawled from late-stage tumors still emitted mRFP fluorescent signals that could only be detected in living cells (Fig. 2H). These cells were named FaDu ex vivo cells and were characterized to be compared with parental FaDu cells in the following studies.

Characterization of proliferative-related capacity in remnant living cells of late-stage tumors
To investigate whether the remnant proliferating cells or non-lost cells influence tumor progression, we assessed the characteristic of remnant living cells of late-stage tumors. The growth rates of FaDu ex vivo cells were significantly faster than the parental FaDu cells (Fig. 3A). The estimated doubling time of FaDu ex vivo cells and parental FaDu cells was 13.1 h and 19.6 h, respectively. The 3-(4,5-dimethylthiazol-2-yl)-2, 5-diphenyltetrazolium bromide (MTT) assay also showed that FaDu ex vivo cells were more resistant to cisplatin treatment than parental FaDu cells (Fig. 3B). In addition, the colony formation assay was performed. By counting the plating efficiency before and after irradiation, FaDu ex vivo cells exhibited higher radioresistance than parental FaDu cells up to 6 Gy of X-rays (Fig. 3C). Furthermore, both cell types could form xenograft tumors in nude mice, and the growth fate of tumors that originated from implantation of FaDu ex vivo cells was significantly faster than that of parental FaDu cells (Fig. 3D). According to the hematoxylin and eosin (H&E) staining, tumor necrosis was mostly found in 4-week xenograft tumors formed by FaDu ex vivo cells than that formed by parental cells implanted in the same mice (Fig. 3E). The necrosis grading of tumors formed from FaDu ex vivo cells was higher than that formed from parental FaDu cells in half of the tumor-bearing mice (Fig. 3F). These results suggest that the remnant living cells of the late-stage tumor exhibit a stronger proliferative capacity in vitro and in vivo, as well as resistance to genotoxicity.

Motility and invasion characteristics of remnant living cells of late-stage tumors
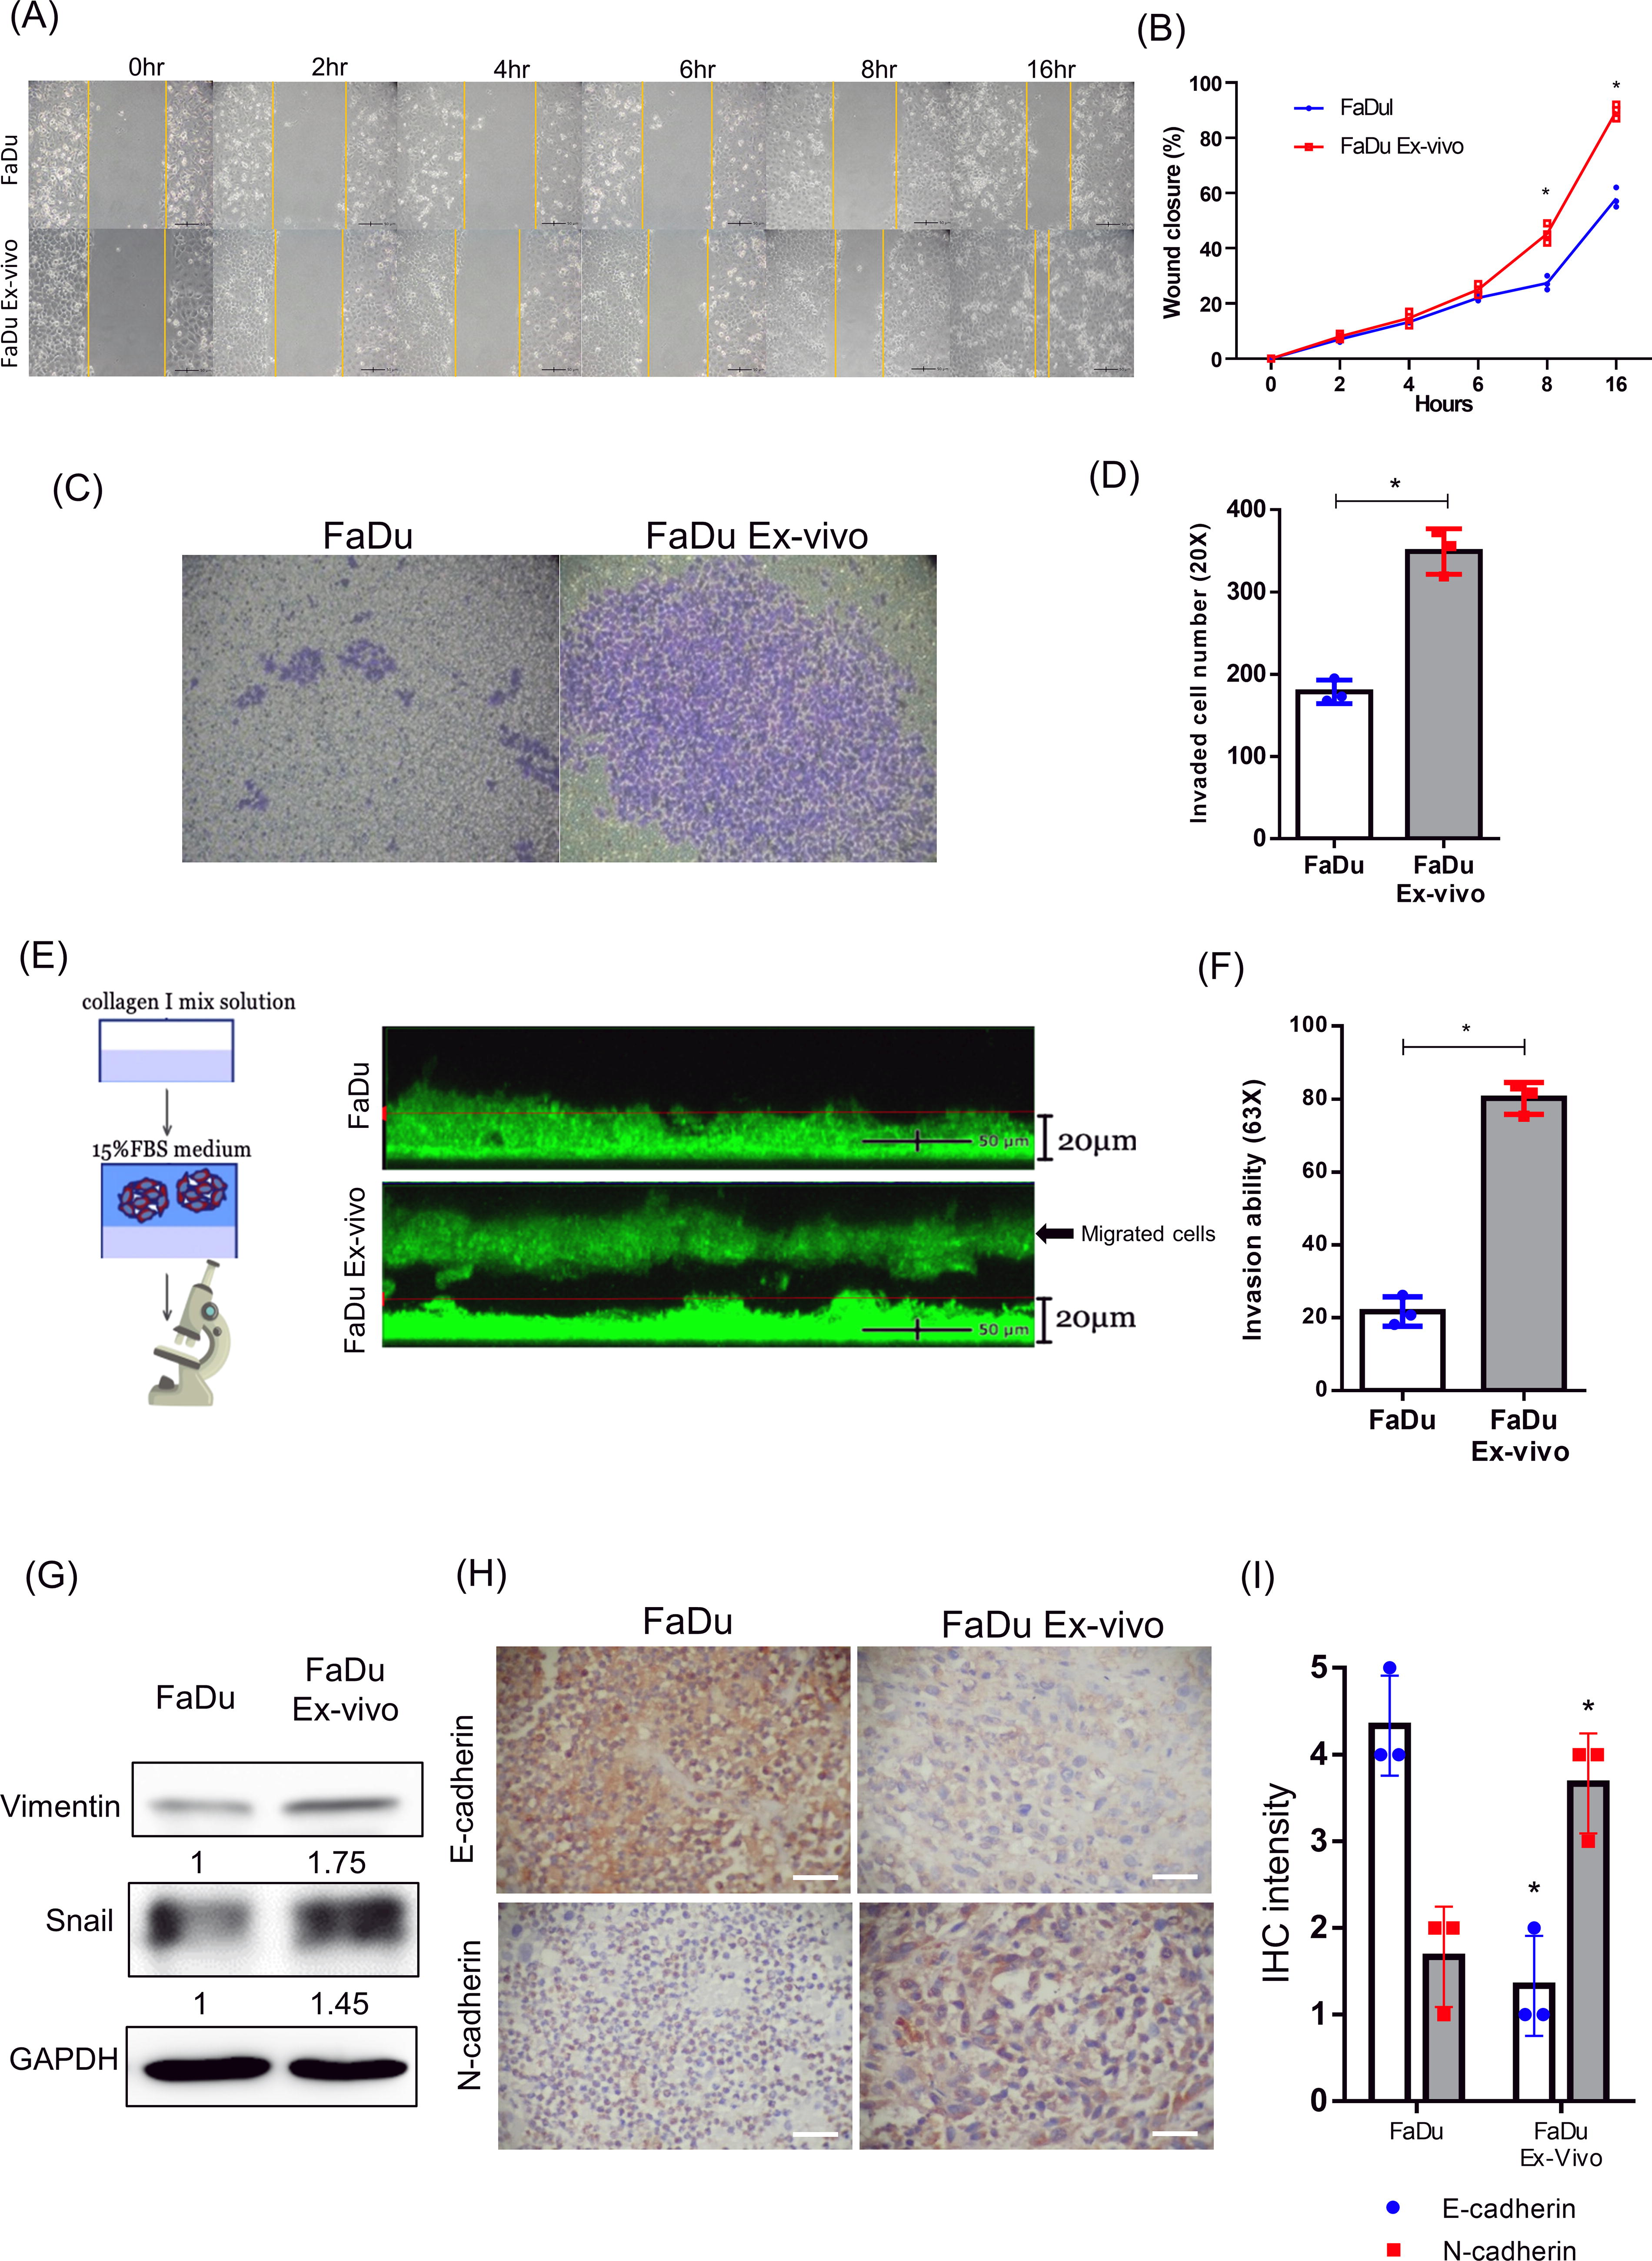
We then compared the cell motility and invasive ability of FaDu ex vivo cells and parental FaDu cells. The wound healing assay showed that the migration rate of FaDu ex vivo cells was faster than that of parental FaDu cells, as expected (Fig. 4A). The significant difference was primarily visualized after 8 h of cell migration (Fig. 4B). The invasion assay also showed that the invasive ability of FaDu ex vivo cell was stronger than that of parental FaDu cells through the matrigel coated on the Transwells (Fig. 4C). The results were quantified by counting the invaded cells (Fig. 4D). We also used the 3D invasion assay to demonstrate the strong invasive capacity of FaDu ex vivo cells, but not the parental FaDu cells, in the collagen I mixture qualitatively and quantitatively (Fig. 4E and 4F). As cell invasion is associated with the EMT (Chen et al., 2021), the EMT-related biomarkers were compared between FaDu ex vivo cells and parental FaDu cells. Western blot analysis showed that the expressions of vimentin and snail proteins were increased in FaDu ex vivo cells compared with parental FaDu cells (Fig. 4G). Concomitantly, reduced expression of E-cadherin accompanied by an increase of N-cadherin was also detected in xenograft tumors formed by FaDu ex vivo cells compared to that formed by parental FaDu cells using the immunohistochemistry (IHC) staining (Fig. 4H and 4I). These results suggest that the enhanced metastatic capacity and EMT of late-stage HPC tumors are associated with the cells escaping from tumor necrosis.
Characterization of tumor blood vessels formed by remnant living cells of late-stage tumors
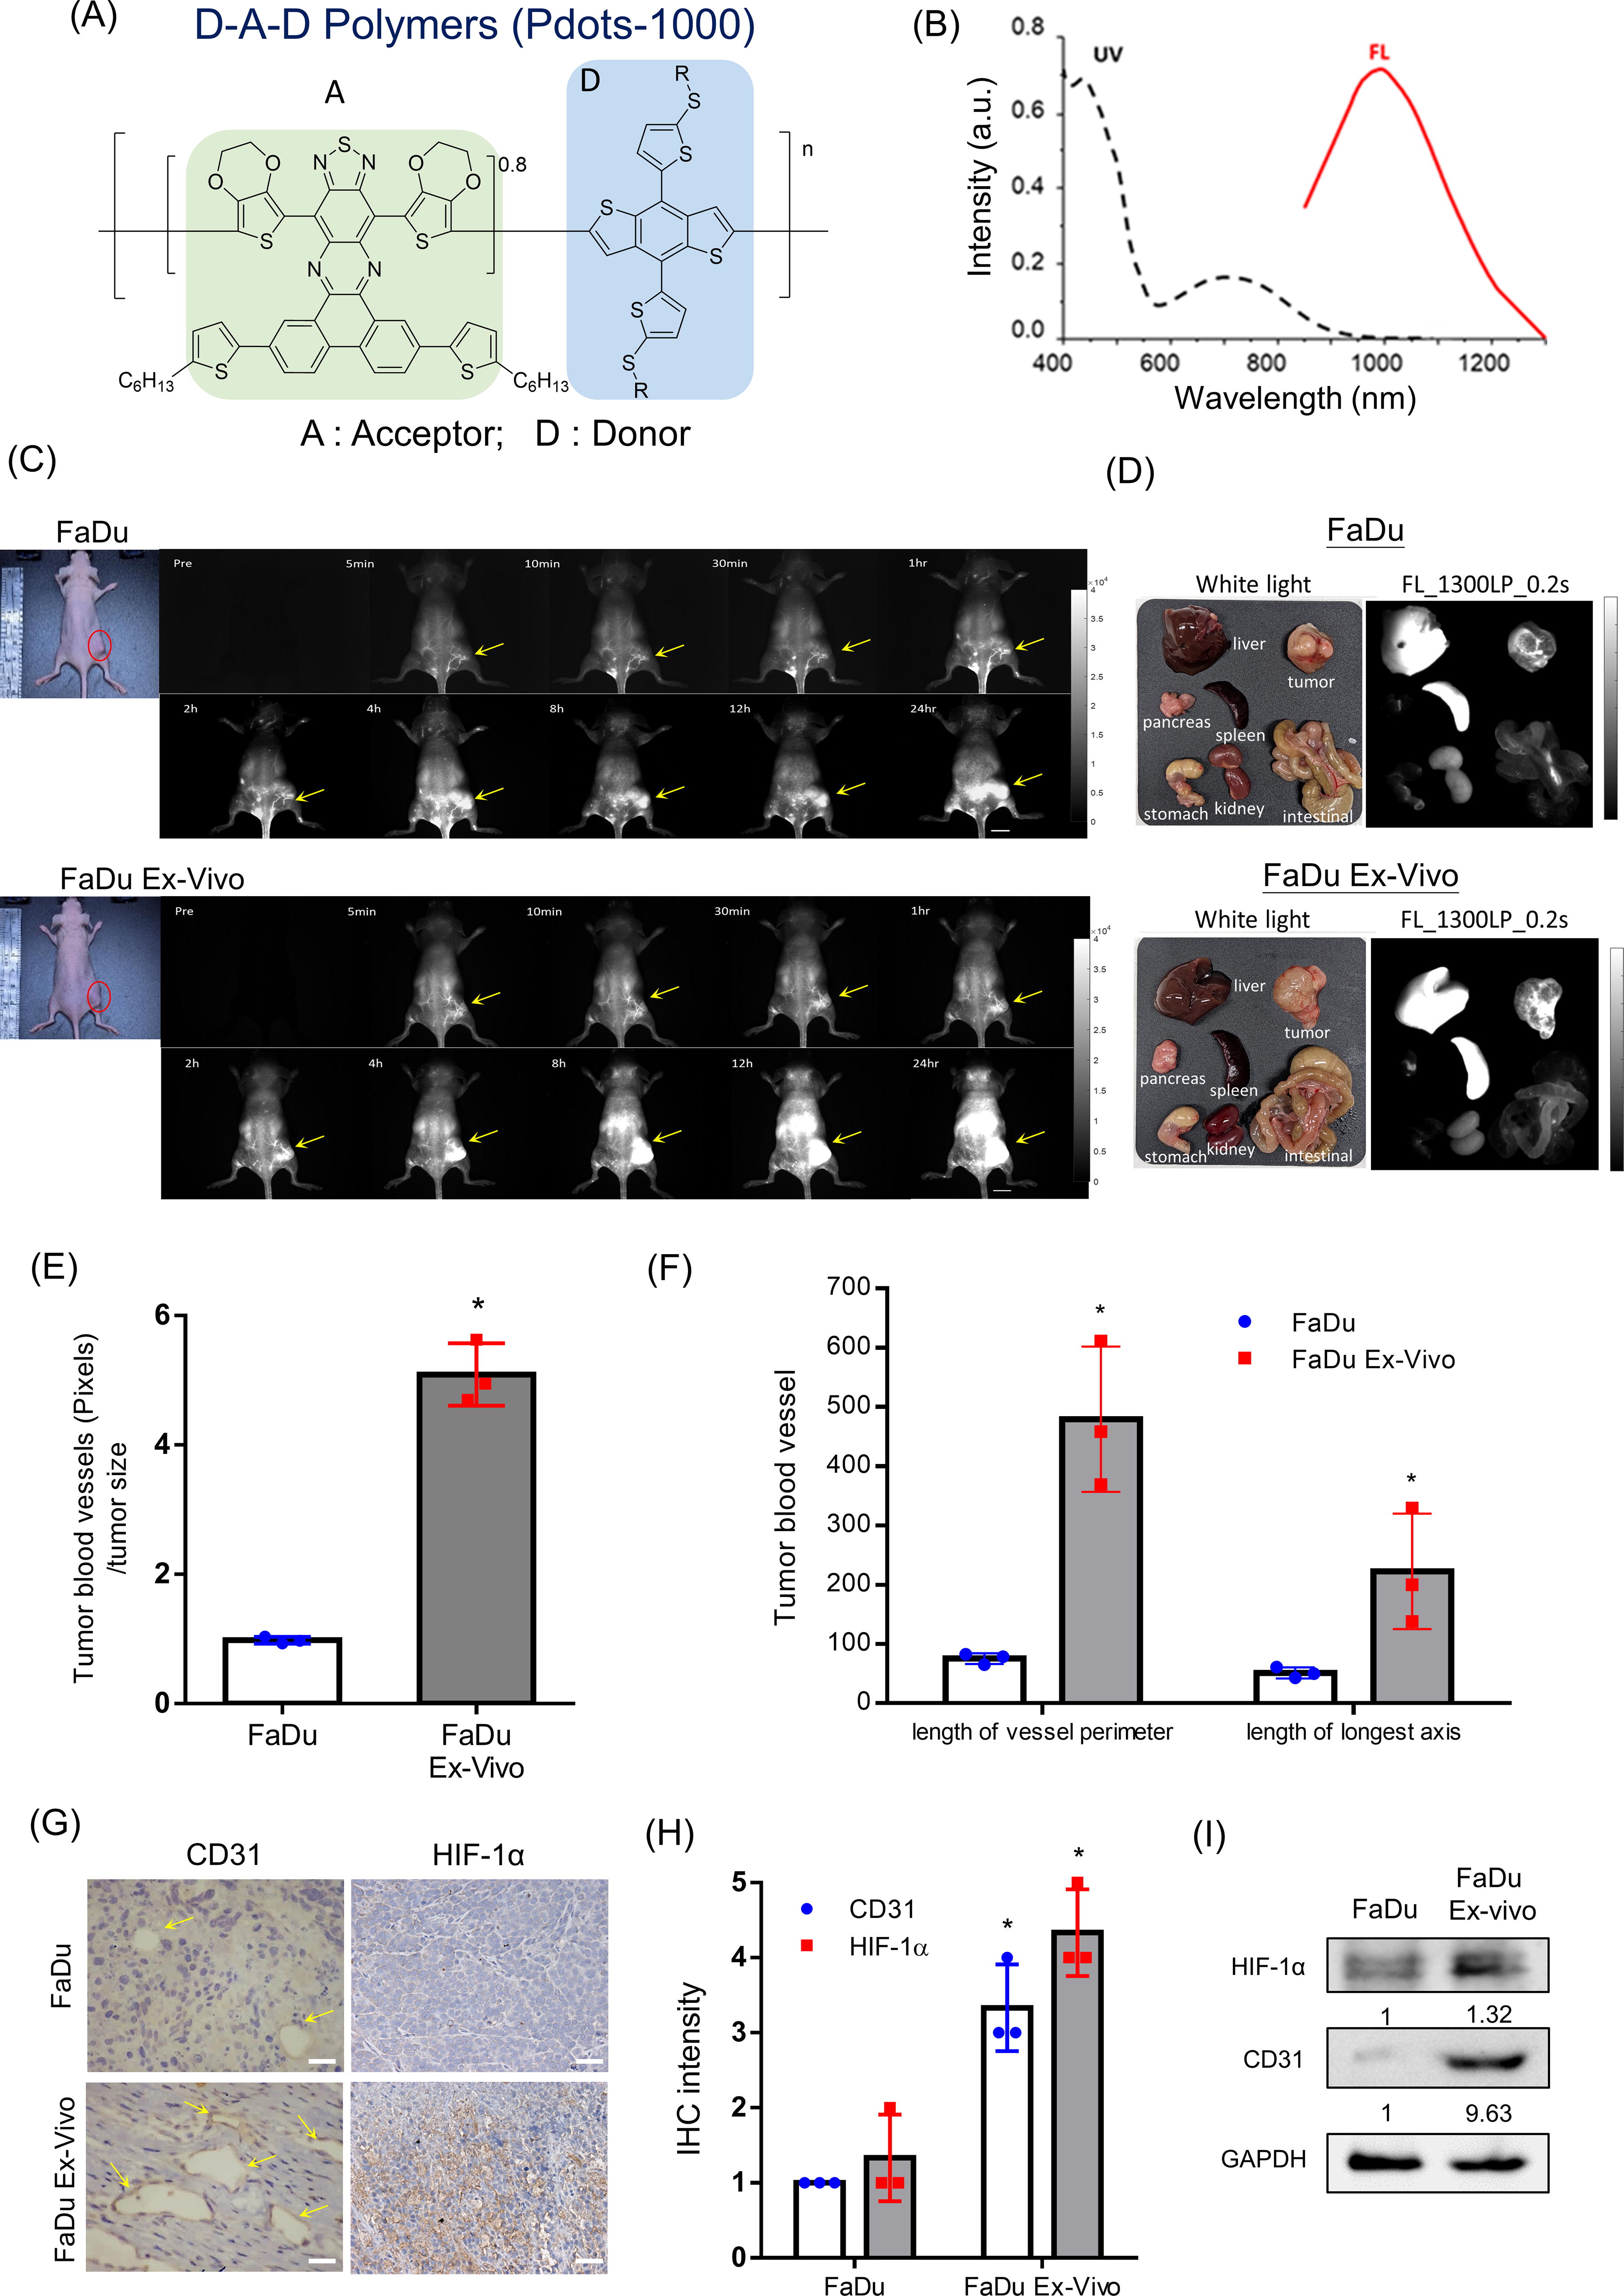
As angiogenesis is also important for tumor metastasis, we next compared the ability of vessel formation in xenograft tumors formed by parental FaDu cells and FaDu ex vivo cells. We have designed an organic biomaterial named polymer dots (pDots) that can emit ultrabright near-infrared (NIR) II fluorescence for in vivo imaging of systemic blood vessels, including tumor angiogenesis (Li et al., 2021). The structure of the pDots-1000 version is illustrated (Fig. 5A). The peak wavelength of emission from pDots-1000 is 1000 nm (Fig. 5B). To visualize the blood vessels encompassing xenograft tumors, pDots were intravenously injected into tumor-bearing mice and imaged by the 3D in vivo imaging system with a 793 nm laser emitter (50 mW cm−2). The data showed that under similar tumor sizes, tumor blood vessels were more abundant in tumors formed by FaDu ex vivo cells than by parental FaDu cells up to 1–2 h after injection of pDots-1000 (Fig. 5C and Supplementary Fig. S2). Tumor accumulation of pDots-1000 was detected in both the xenograft tumor types after a long term of fluorescence imaging. The organs of tumor-bearing mice were then resected and confirmed that pDots could accumulate in vessels surrounding tumors, as well as in the liver and spleen (Fig. 5D). The image pixels of blood vessels were quantified and normalized with tumor size to demonstrate that tumors formed from FaDu ex vivo cells could generate more vessels than parental FaDu cell-formed tumors (Fig. 5E). We also measured the perimeter and the length of the longest axis of vessels to reveal the different angiogenic potencies in tumors formed from parental FaDu cells and FaDu ex vivo cells (Fig. 5F). The histological examination of tumor sections showed that blood vessels of tumors formed from FaDu ex vivo cells were larger and more irregular accompanied by an increased expression of CD31 and hypoxia-induced factor-1α (HIF-1α) compared with parental FaDu xenograft tumors (Fig. 5G). Quantification of IHC staining showed an increased expression of CD31 and HIF-1α intensity formed by FaDu ex vivo cells (Fig. 5H). The results were further validated by Western blot analysis to demonstrate the increase in HIF-1α level and CD31 in FaDu ex vivo xenograft tumors (Fig. 5I). Together, the remnant living cells in late-stage tumors will also exhibit increased ability to promote angiogenesis.
Demonstration of TIC properties in remnant living cells of late-stage tumors
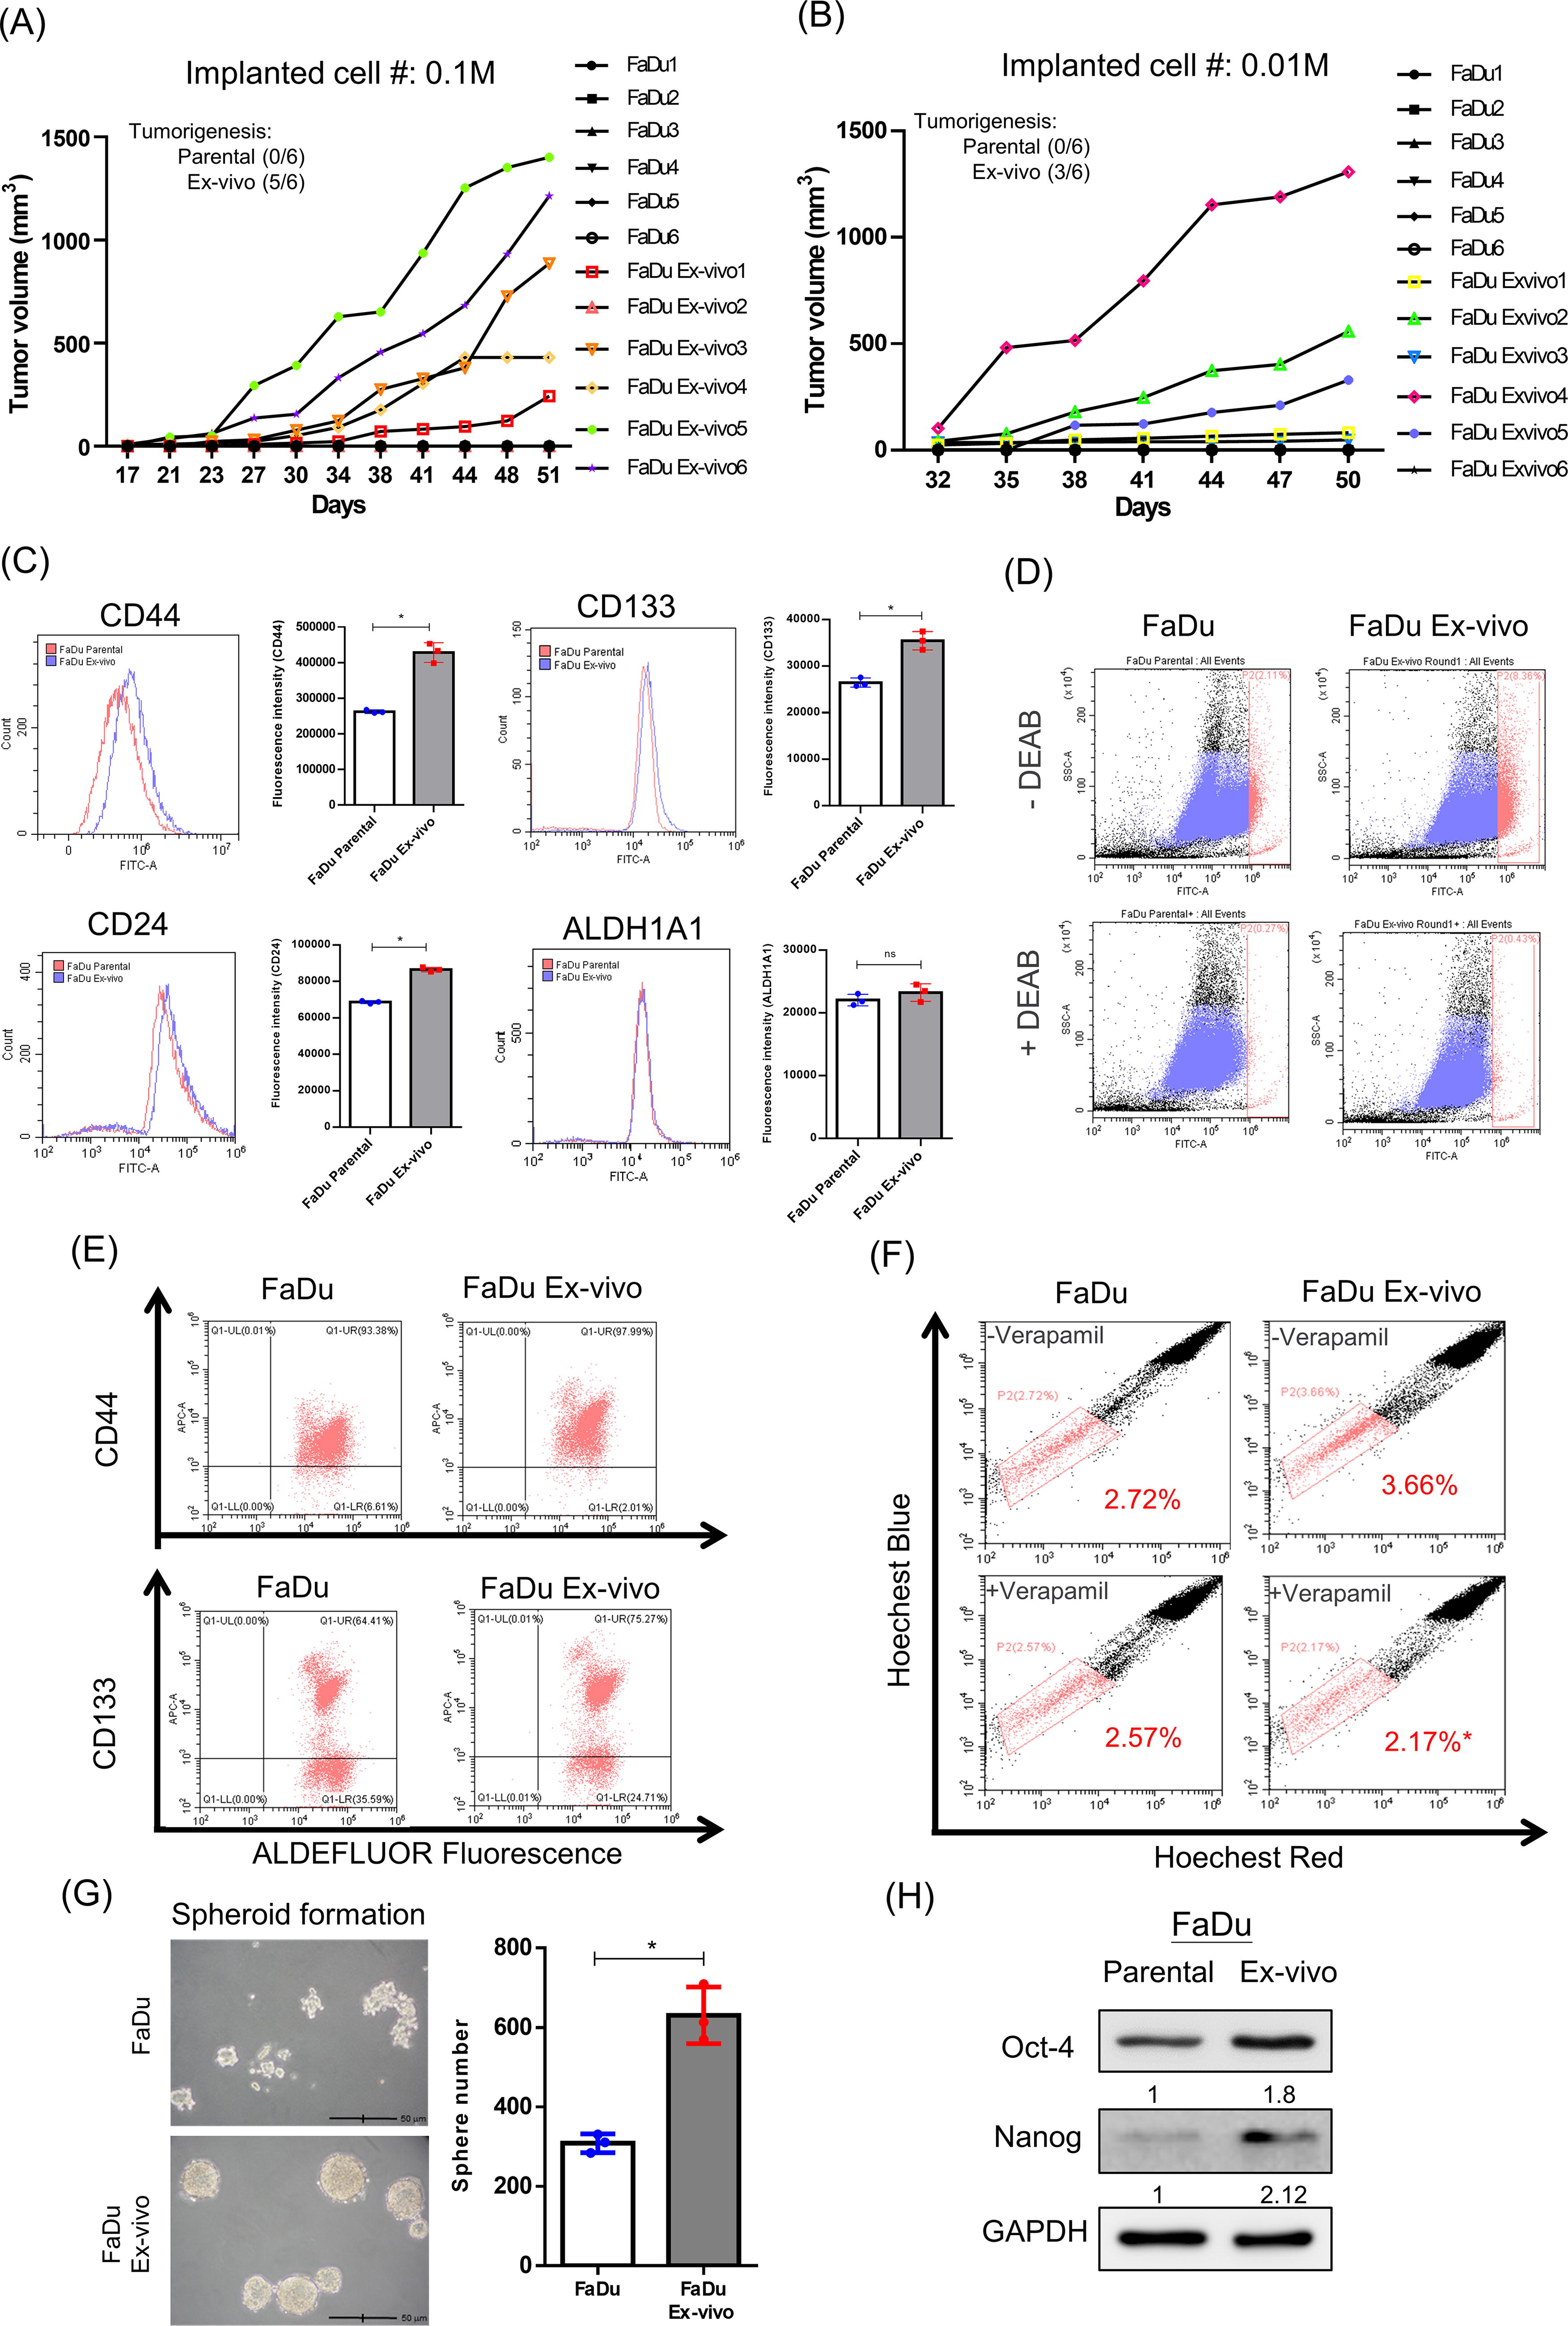
TICs, also named CSCs, belong to a subpopulation of highly tumorigenic cells, which can be characterized by several biological and biochemical definitions (Qureshi-Baig et al., 2017). Because of the enhanced proliferative capacity in FaDu ex vivo cells, we examined if this population would also gain the properties of TICs. We first evaluated the tumorigenesis of FaDu ex vivo cells in nude mice by reduced cell number with 1/10 or 1/100 of the original seeded. FaDu ex vivo cells could form tumors at different rates compared with parental FaDu cells that never formed tumors during the observed period (Fig. 6A and 6B). We also examined the surface biomarkers of HNSCC CSCs reported before (Beck and Blanpain, 2013), and the flow cytometric analysis demonstrated that CSC surface markers CD44, CD24, and CD133 were all significantly upregulated in FaDu ex vivo cells (Fig. 6C). Increased ALDH1A1 expression in FaDu ex vivo cells was substantial as it could be inhibited by the ALDH1A1 inhibitor N, N-diethylaminobenzaldehyde (DEAB), using the ALDEFLUOR assay (Fig. 6D). Besides, CD44 and CD133 biomarkers were co-overexpressed with ALDH1A1 in FaDu ex vivo cells by the antibody-ALDEFLUOR double-staining method (Fig. 6E). Moreover, the side population is also a phenotype of TICs by overexpression of ATP-binding cassette (ABC) transporters that can pump out the hydrophobic compounds (Begicevic and Falasca, 2017). The flow cytometry showed a greater population of Hoechst dye unstainable FaDu ex vivo cells than parental FaDu cells, but it was significantly reduced after cells were treated with verapamil, an ABC transporter inhibitor (Fig. 6F). Moreover, the sphere formation assay showed that FaDu ex vivo cells formed more spheroids than parental FaDu cells (Fig. 6G). Finally, the transcription factors of TICs, including Oct-4 and Nanog, in total cell extracts were also upregulated in FaDu ex vivo cells (Fig. 6H). These data indicate that the remnant living cells in late-stage HPC tumors possess the biological and biochemical properties of TICs.
Association of antioxidant capacity in remnant living cells from advanced HPC tumors
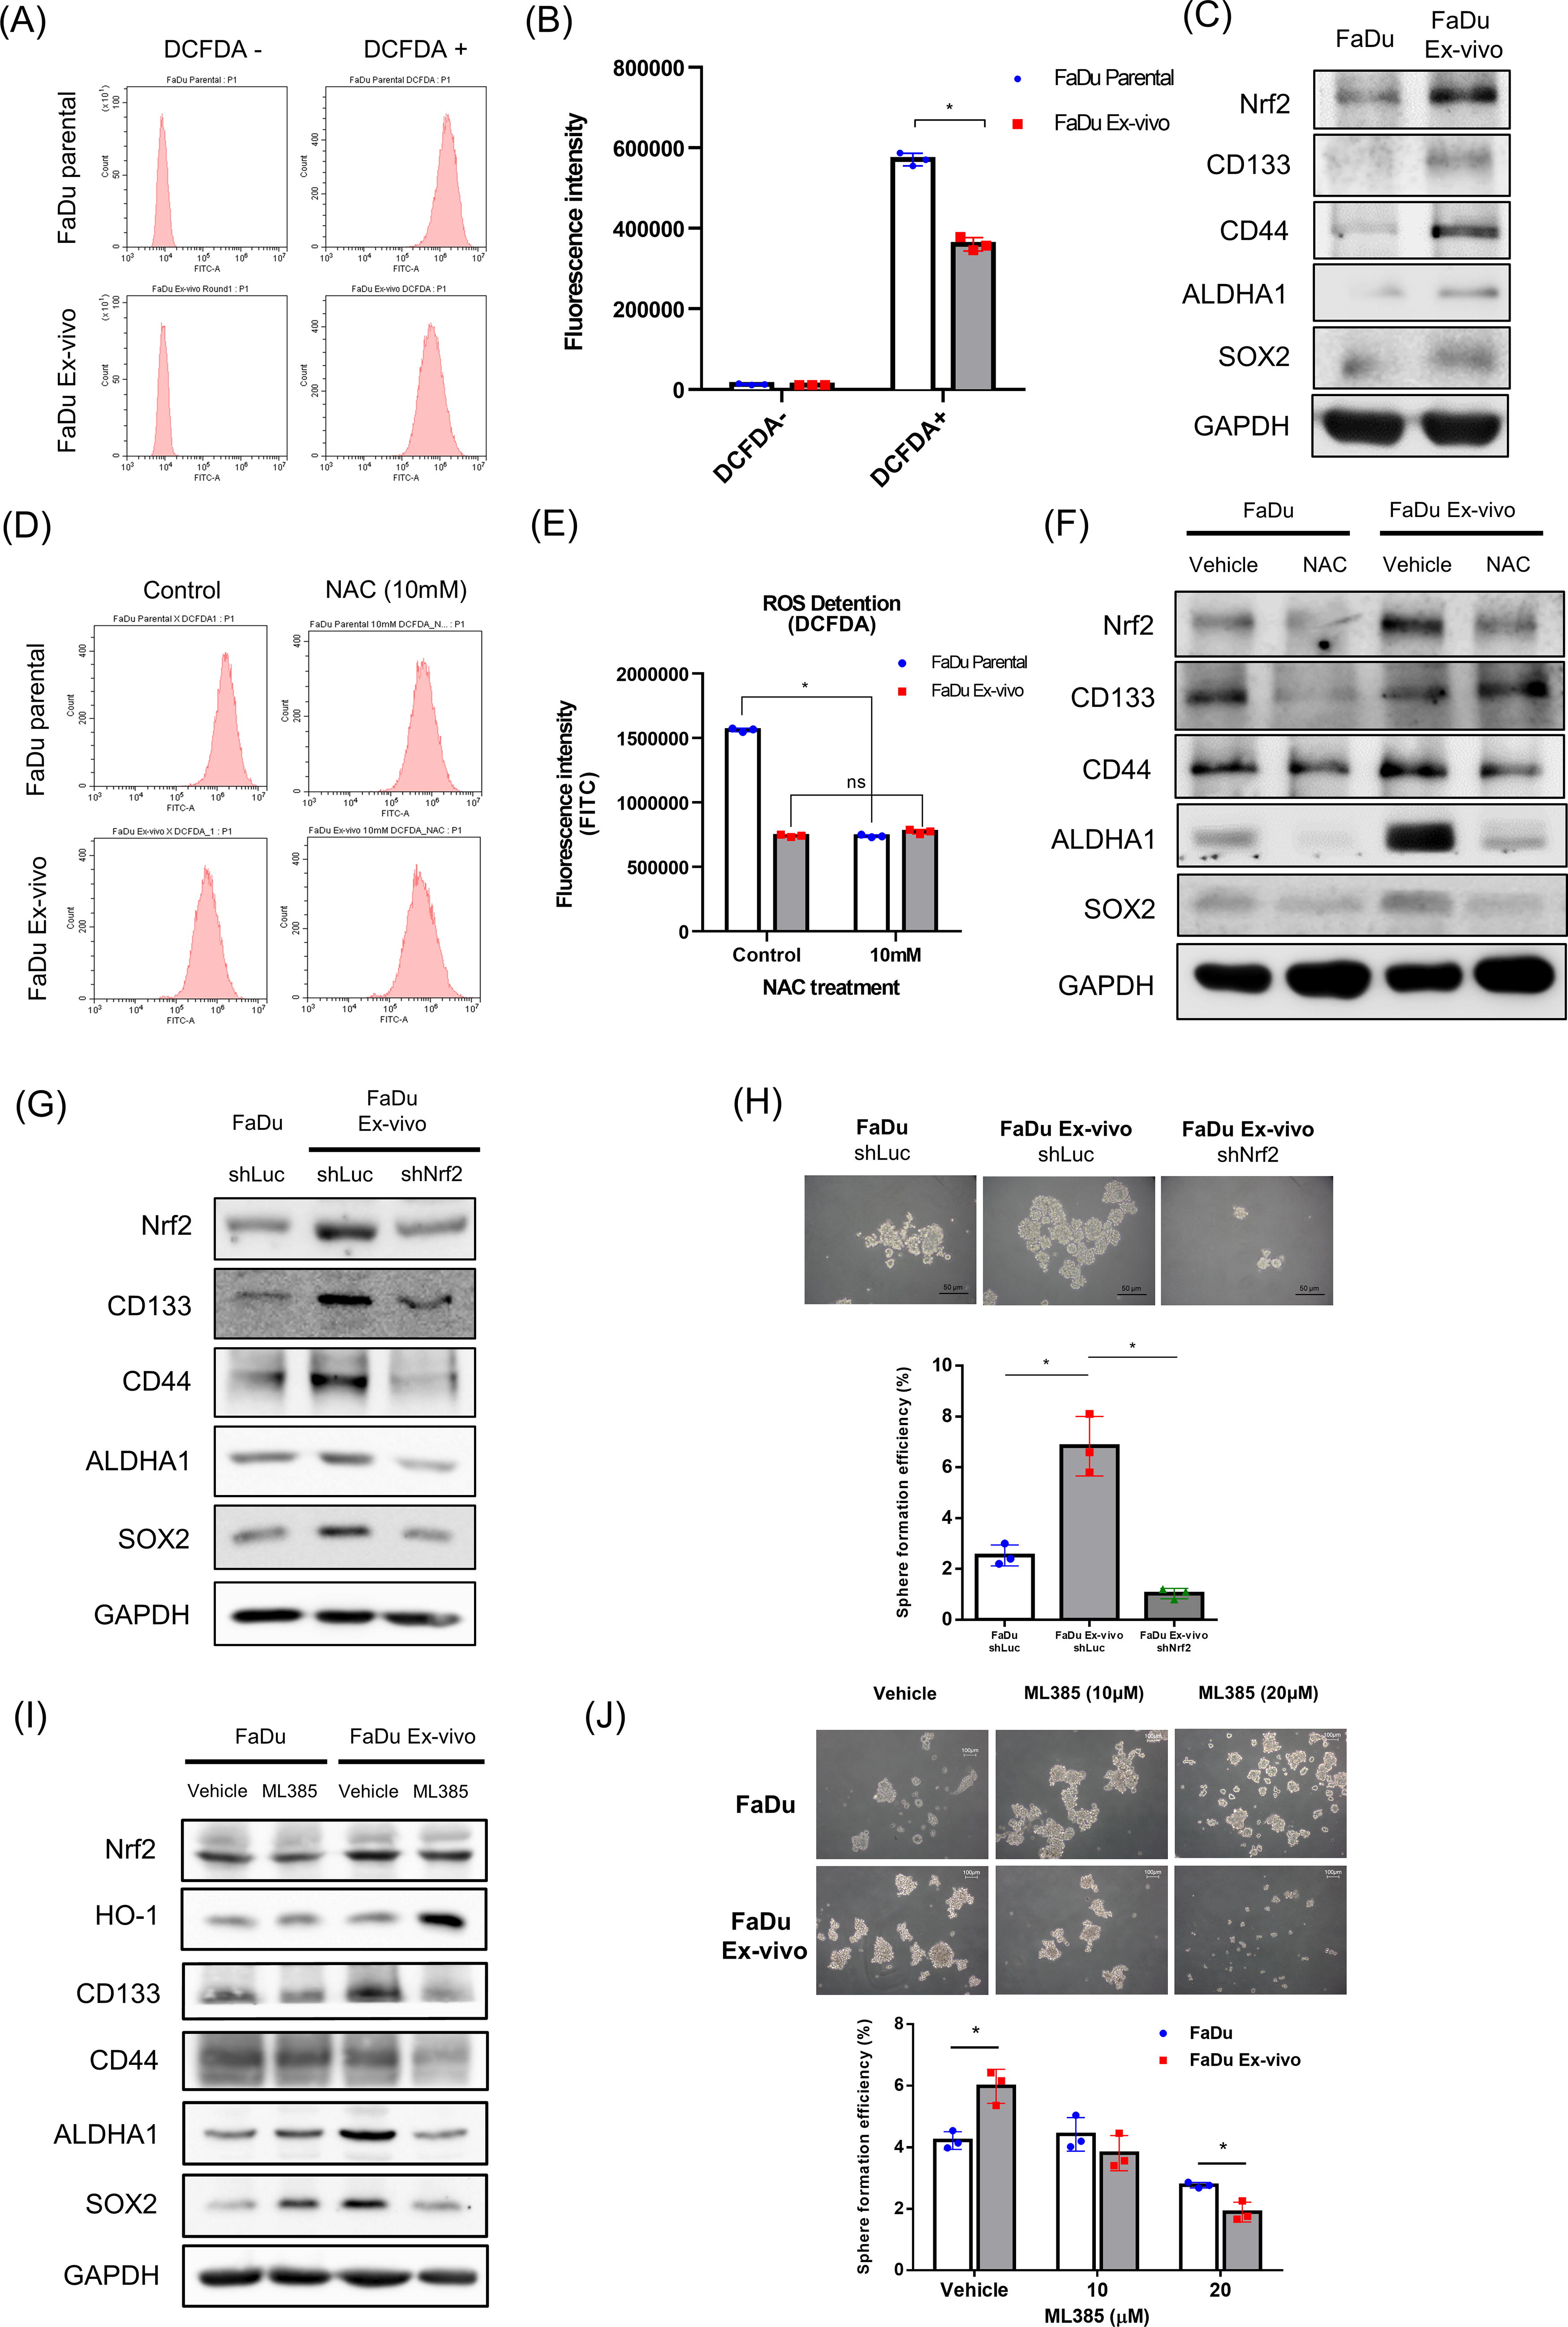
As mentioned above, the remnant living cells isolated from late-stage HPC xenograft tumors exhibited resistance to genotoxicity raised by X-rays and cisplatin. Therefore, we further evaluated the levels of oxidative stress in FaDu ex vivo cells using the 2’,7’-dichlorofluorescein diacetate (DCFDA) fluorescence staining assay (see the Materials and Methods section). The flow cytometric results showed that the DCFDA fluorescence intensity of FaDu ex vivo cells was lower than that of parental FaDu cells (Fig. 7A). It indicated that the level of ROS was significantly reduced in the remnant living cells isolated from the late-stage tumor (Fig. 7B). Interestingly, the antioxidant molecule Nrf2 was found to be increased with TIC-associated biomarkers in FaDu ex vivo cells compared with parental FaDu cells (Fig. 7C). Subsequently, the free radical scavenger N-acetylcysteine (NAC) was found to significantly reduce the ROS level in parental FaDu cells but not in FaDu ex vivo cells using the DCFDA assay (Fig. 7D and 7E). The expression of Nrf2 was suppressed in both cell types by the treatment of NAC, suggesting that this antioxidant molecule was ablated by cellular oxidative stress. Interestingly, NAC treatment also reduced several TIC-associated biomarkers, except that CD133 was not suppressed in FaDu ex vivo cells (Fig. 7F). Furthermore, knockdown of Nrf2 by shRNA in FaDu ex vivo cells could downregulate TIC-associated biomarkers (Fig. 7G). The efficiency of sphere formation was also reduced in Nrf2 knockdown FaDu ex vivo groups (Fig. 7H). We also treated cells with an Nrf2 inhibitor (ML385) that could increase heme oxygenase-1, an oxidative stress biomarker in FaDu ex vivo cells but not in parental FaDu cells (Fig. 7I). The treatment of ML385 also inhibited more sphere formation of FaDu ex vivo cells than that of FaDu cells (Fig. 7J). These results suggest that the antioxidant capacity mediated by Nrf2 was upregulated in remnant living cells of advanced HPC tumors displaying the characteristics of TICs.
Discussion
The study of HPC is of particular interest for their cellular traits in the advanced stage of this tumor type because up to 85% of newly diagnosed HPC patients already reach stage III-IV of this disease (Newman et al., 2015). The cell loss factor is significant as the local invasion of lymphatic vessels is frequent, and the prognosis is commonly poor. A retrospective cohort study has proposed that the primary surgery offers a better prognosis than the concurrent chemoradiotherapy in stage Iva HPC, suggesting that the essence of survived cancerous cells in the late-stage tumor may be altered to resist genotoxicity induced by oxidative stress (Tsai et al., 2020). Present data indicate that necrosis is dramatically found in late-stage xenograft HPC tumors, and survived cells exhibit conspicuous characteristics of TICs. This tumor model would partially explain the clinical observations and therapeutic options.
Tumor growth kinetics is well characterized by various mathematical models that attempt to quantitatively describe the biological behaviors of tumor progression, especially in experimental tumors in vivo (Altrock et al., 2015). The Gompertzian model of tumor growth can be traced back to 1932, and it is still an ideal model nowadays to describe tumor growth kinetics with formula modification (Vaghi et al., 2020). This model may well explain the asymmetrical division, a major attribute of TICs or CSCs at a late stage of tumor progression (Bajaj et al., 2015). Bulk cancer cells in growing tumors retain the proliferative ability, but they are more sensitive to low nutrient and oxygen supplies compared with TICs. Therefore, the tumor growth should depend on the interplay between cellular proliferation and cell loss. Fluorescence imaging of living cells expressing mRFP has been reported using the murine 4T1 syngeneic tumor model with a normal immune system, and these remnant living cells exhibited apparent CSC-like characteristics (Chen et al., 2012). In this study, we showed that the same approach could be used for imaging the ratio change of vital cells and non-vital cells in human HPC-based xenograft tumors. Because the immunodeficient animals were utilized for implanting human tumors, the rate of TIC destruction by the innate immune system should be neglected. It could explain the enrichment of TIC population in advanced HPC tumors with a weaker immune system.
Angiogenesis is known as a prognostic factor of HPC (Guo et al., 2020). Little is known which subpopulation of HPC tumor could induce stronger angiogenesis than others. In this study, we demonstrated that remnant living cells from late-stage HPC xenograft tumors exhibited a more complex vessel formation than parental FaDu cells. Using pDots with ultrabright NIR-II fluorescence (1000–1400 nm), we were able to process 3D tumor mapping, including the observation of tumor vasculatures (Li et al., 2021). The semiconducting pDots-based fluorescence imaging provides high spatial resolution of systemic blood vessel mapping in a short time of injection. That is, a stereo-NIR-II fluorescence imaging system is used in acquiring 3D tumor vascular and blood vessel images with 0.15 mm spatial resolution, 0.6 mm depth resolution, and 5 mm imaging depth (Su et al., 2022). The pDots are also nanoparticles that can be taken up by tumors via the enhanced permeability and retention (EPR) effects (Subhan et al., 2021). To the best of our knowledge, this study is the first time to use the pDots for analyzing vessel organizations in xenograft tumors formed by a low or high percentage of TICs when they grew to similar sizes. This result suggests that the type of tumor cells should be also essential for induction of angiogenesis, although angiogenesis is known to be initiated when tumor size grows beyond 1–2 mm in diameter (Weidner, 1995). A poor prognosis of advanced HPC may be associated with enriched TICs that promote tumor vessel formation. It will be interesting to measure the formation of blood vessels in different sizes of tumors using our 3D in vivo blood vessel imaging system in the future. In addition, pDots is a biocompatible organic nanomaterial with rich carboxyl functional groups, which will be an ideal carrier to conjugate with chemotherapeutic compounds for concomitant tumor imaging and treatment (Yang et al., 2020). We expect to exploit this technological platform for screening effective compounds for targeting chemo-radioresistant TIC populations in late-stage tumors.
The chemo-radioresistant property of advanced cancer is related to the antioxidant capacity. Because malignant cancer cells exhibited higher endogenous oxidative stress than normal cells, they may trigger protective mechanisms to adapt this condition (Oberley and Oberley, 1997; Szatrowski and Nathan, 1991). In the case of breast cancers, lower ROS levels were found in subsets of TICs than in non-TICs (Toyokuni, 2006). In HNSCC, the isolated CSC subpopulations can still show distinct levels of intracellular ROS, although the one with low intracellular ROS displays more stemness properties (Chang et al., 2014). Our data suggest that TICs or CSC-like subpopulations of HPC tumors also exist with low ROS levels, and the simple suppression of Nrf2 antioxidant molecules is sufficient to ablate the stemness-like properties of advanced HPC cells. At present, little is known about the characteristics of TICs in HPC, except the identification of CD271 biomarker in patients with HPC and its upstream regulator RELA transcription factor in CD271-expressing HPC cell lines (Nakazato et al., 2022). Our findings would be important to further define the redox regulation in CD271 expressing HPC cells for clinical diagnosis and treatment.
In summary, we have taken the advantage of the concept of tumor growth kinetics to track and isolate remnant living cells after massive cell loss in late-stage HPC xenograft tumors. After the characterization of these remnant living cells, it was revealed that this population exhibited enrichment of TICs against the killings by chemodrugs and ionizing radiation. Importantly, the remnant living cells showed low ROS levels accompanied by increased expression of the antioxidant molecule Nrf2, which indicated the capacity of regulation of cancer stemness. Present results provide a hint of therapeutic difficulty in advanced HPC with enriched TICs, and targeting on the antioxidant capacity of these cells may be considered a therapeutic strategy.
Materials and Methods
Cell lines, plasmid, and transfection
The human HPC FaDu cell line (American Type Culture Collection, ATCC Cat #: HTB-43TM, Manassas, VA, USA) was cultured in Roswell Park Memorial Institute (RPMI)-1640 medium (Life Technologies Inc., Carlsbad, CA USA) containing 10% fetal bovine serum (FBS) (Thermo Fisher Scientific Inc., Waltham, MA, USA), 1% penicillin/streptomycin (Sigma-Aldrich Co., St. Louis, MO, USA), and 1% L-glutamine (Sigma-Aldrich Co., St. Louis, MO, USA). FaDu-PB2R cells were created by co-transfection of the piggyBac transposon system including the PB-tk-mRFP reporter plasmids and Act-Pbase helper plasmid that can insert exogenous genes into chromosomes as reported before (Chen et al., 2012). The ratio of plasmids was 3:1 of reporter plasmid to helper plasmid for co-transfection of FaDu cells using JetPrime reagent (Polyplus-transfection Inc., New York, NY). The expression of mRFP was visualized by the fluorescence microscope (U-RFL-T 200 power supply, Olympus, Center Valley, PA, USA). Cells were incubated at 37°C in a humidified incubator supplemented with 5% CO2 and passaged every 2 days.
Reagents
NAC (Sigma-Aldrich Co., St. Louis, MO, USA) was dissolved in deionized water to prepare a 1 M stock solution, and the working concentration was 10 mM. ML385 (MedChemExpress LLC, Monmouth Junction, NJ, USA) was dissolved in dimethyl sulfoxide (DMSO) (10 mM) and diluted to 10 μM or 20 μM for cell treatment.
Radiation source
The cabinet RS 2000 Biological Irradiator (Rad Source Technologies, Inc., Suwanee, GA, USA) was used to irradiate cells at different doses. The dose rate of radiation source is 290 cGy/min.
Establishment of HPC xenograft tumor model
A total of 60 male BALB/c nude mice (6-week-old) were purchased from the National Laboratory Animal Center, Taiwan. All mice were housed in an individually ventilated cage facility (with controlled temperature at 24°C, controlled humidity at 50%, and automated light/dark cycle [12 h/12 h]), the animals were also provided with free access to food and water, and the bedding was replaced twice a week. Animal health and behavior were daily monitored. Before tumor implantation, mice were anesthetized by the inhalation of isoflurane (4.0% isoflurane in air during induction and 2.0% isoflurane in air during maintenance). FaDu cells or FaDu-PB2R cells (1 × 10⁶ each) were resuspended in 100 μl of OPTI-MEM (Sigma-Aldrich Inc. St., Louis, MO, USA) and then subcutaneously injected into the thighs of each mouse using a 27G insulin needle. The tumor volume was caliper measured and calculated by the following formula: volume = (width2 × length)/2 every 3 days after tumor growth was palpable. The tumor growth curves were plotted by measuring the tumor volumes at different time points. The maximum allowed tumor dimension was 2000 mm3. All mice were euthanized by CO2 fill rate of 30–70% of the chamber volume per min and sacrifice was confirmed when the mice had stopped breathing and did not respond to stimulation. For monitoring of xenograft tumor growth in alive nude mice, the duration of the experiment was approximately 40 days for tumor isolation and caliper measurement. No mouse was found to be deceased unexpectedly during the experiment. The animal study was approved by the Institutional Animal Care and Utilization Committee (IACUC) of National Yang Ming Chiao Tung University and executed in 2020 and 2021 (No. 1090906 and 1100509).
In vivo optical imaging
For the optical imaging of tumor growth in vivo, an IVIS-50 system (Xenogen ® Inc. Alamda, CA, USA) was used to image the expression of mRFP in tumors formed by FaDu cells and FaDu-PB2R cells. Mice (n = 6) were anesthetized using 2% isoflurane before and during the imaging acquisition. The regions of interest were semi-quantified as photons/s/cm2/sr. Data quantification was analyzed using the bundled Living Imaging Software (Ver. 4.7).
Excision of xenograft tumors and isolation of living cells
The xenograft tumors grown over one month were excised and cut into small pieces of clumps, which were rinsed using phosphate-buffered saline (PBS) and cultured in RPMI medium supplemented with 3% penicillin/streptomycin. The culture medium was refreshed daily until living cells crawled from excised tumor mass. The expression of mRFP in these cells was also visualized and confirmed using the fluorescence microscope (U-RFL-T 200 power supply, Olympus, Center Valley, PA, USA).
Cell proliferation assay
Cells (1 × 10⁵) were cultured in 6-well dishes, trypsinized, and counted every 24 h until the end of analysis (5 days) using hemocytometry. The cell numbers from triplicate measurements were used to calculate the average for each time point.
Cell viability assay
The procedure of cell viability assay followed the previous report with slight modification (Lin et al., 2021). In brief, cells (1 × 10³) were seeded in 96-well plates overnight. Subsequently, different concentrations of cisplatin (Sigma-Aldrich Co., St. Louis, MO, USA) were added to cultured cells at 37°C for 72 h. Cells were replaced by serum-free medium mixed with 5 mg/mL of MTT solution (Sigma-Aldrich, St. Louis, MO, USA) and incubated for 2–4 h. The produced crystals were dissolved in 100 μl DMSO (Krackeler Scientific, Inc., Albany, NY, USA). The plate was detected at 570 nm u”ing ’n enzyme-linked immunosorbent assay reader (Bio-Tek Instrument, USA). The obtained data were normalized to untreated control at the same time point to calculate survival fractions.
Colony formation assay
The radiosensitivity was determined by calculation of survival fractions using the colony formation assay. In brief, cultured cells were trypsinized and serial diluted in T-25 flasks and irradiated using incremental doses of X-rays. Irradiated cells were immediately seeded to 6-cm dishes with limited numbers according to the doses of treatment, and then maintained in an incubator for 14 days. The colony formed in dishes was gently rinsed with PBS, and stained with 0.02% crystal violet in 75% ethanol for 10 min. The dishes were examined using a light microscope for quantification of colony numbers (each colony containing over 50 cells was counted). The plating efficiency was defined by the ratio of colonies divided by the number of initial seeded cells. The survival fraction of each dose was determined by dividing the plating efficiency of irradiated cells to that of unirradiated controls.
Detection of ROS
The cell-permeable DCFDA (Invitrogen Inc., Carlsbad, CA, USA) assay was used for analysis of intracellular ROS by following the manufacturer’s instruction. Briefly, 1 × 10⁶ cells were resuspended in PBS and 5 μM DCFDA was added in the darkness for 1 h. Cells were subjected to flow cytometry (Cytomic FC 500, Beckman Coulter, Inc., Fullerton, CA, USA) for detection of cellular fluorescence at Ex/Em = 495/527 nm. The fluorescence intensity was semi-quantified in cells with or without the treatment of DCFDA.
Western blot analysis and antibodies
Western blot analysis was performed according to the previous report (Lin et al., 2021). Briefly, 30 μg of protein lysate was run on sodium dodecyl sulfate–polyacrylamide gel electrophoresis. Gel was then electrotransferred to a nitrocellulose membrane (BioTraceTM NT; Pall, Port Washington, NY, USA), which was then incubated with a primary antibody overnight followed by a horseradish peroxidase (HRP)-conjugated secondary antibody. The membrane was finally rinsed with Western lightning plus-ECL (Perkin-Elmer Inc., Waltham, MA, USA) to be detected using the LAS-4000 gel imaging system (GE Healthcare Inc., Wauwatosa, WI, USA). The primary antibodies used here included anti-CD133 (1:1000, Cat# GTX100567), anti-CD44 (1:1000, Cat# GTX628895), anti-ALDHA1 (1:1000, Cat# GTX123973), anti-Sox2 (1:1000, Cat# GTX101506), anti-HIF-1α (1:1000, Cat# GTX127309), anti-CD31 (1:1000, Cat# 130274), anti-Oct4 (1:1000, Cat# GTX627419) and the vendor of these antibodies is GeneTex Inc. (Alton Pkwy Irvine, CA, USA); and anti-Nrf2 (1:1000, Cat# 12721 s), anti-Nanog (1:1000, Cat# ab109250, Abcam, Cambridge, MA, USA), anti-vimentin (1:4000, Cat# ab92547, Abcam, Cambridge, MA, USA), and anti-Snail (1:1000, Cat# 3895 s, Cell Signaling, Danvers, Massachusetts, USA); anti-heme oxygenase-1 (1:00, Cat# Sc-136960, Santa Cruz Biotechnology Inc., Dallas, TX, USA); and anti-glyceraldehyde-3-phosphate dehydrogenase (1:5000, Cat# MA515738, Invitrogen Inc., Carlsbad, CA, USA). The intensity of protein bands was quantified using the densitometry (ImageJ ver 1.47, (National Institutes of Health, Bethesda, MD, USA).
Flow cytometric analysis
For detection and quantification of surface markers, the incubation buffer was added [1 g bovine serum albumin (BSA)/100 mL PBS, pH = 7.4] with a primary antibody to trypsinized cells (1 × 10⁶) on ice for 60 min. Cells were then centrifuged at 1,000 rpm for 5 min and rinsed with incubation buffer twice, and then resuspended in Alexa Fluor® 488-conjugated secondary antibody (1:100, Cat# ab150077 (rabbit IgG) or Cat# ab150133 (mouse IgG), Abcam, Cambridge, MA, USA) on ice for 30 min. After centrifugation, cells were resuspended in 0.5 mL of PBS, filtered through a 0.3-μm mesh, and subjected to the flow cytometer (Cytomic FC 500, Beckman Coulter, Inc., Fullerton, CA, USA). The primary antibodies used for detection of surface markers included anti-ALDHA1 (1:20, Cat# ab52492), anti-CD133 (1:100, Cat# GTX100567), anti-CD44 (1:100, Cat# GTX628895), and anti-CD24 (1:100, MA5-11828).
ALDEFLUOR assay
The expression of aldehyde dehydrogenase (ALDH) enzymatic activity in cells was analyzed using the ALDEFLUOR™ Kit (Stem Cell Technologies, Durham, NC, USA) following the manufacturer’s protocol and previous report with slight modification (Kryczek et al., 2012). In brief, 1 × 10⁶ cells were trypsinized and mixed with the substrate of ALDH, named BODIPY-aminoacetaldehyde (BAAA) in ALDEFLUOR™ detective buffer for 1 h. Cells were then centrifuged and resuspended in 0.5 mL detective buffer on ice until they were subjected to flow cytometric analysis equipped with an air-cooled argon laser excited at 488 nm. The ALDH inhibitor DEAB (50 μmol/mL) was used to diminish the fluorescence staining of ALDH expressing cells. For double-staining with CD133 or CD44, cells were treated with corresponding antibodies as mentioned above and then stained with the ALDEFLUOR™ Kit for flow cytometric analysis.
The side population analysis
Cells (1 × 10⁶) were resuspended in pre-warmed medium and mixed with 5 μg/mL of Hoechst33342 dye with or without the existence of verapamil (75 μM) under 37°C for 90 min. After incubation, cells were rinsed and resuspended in pre-cooled 5% FBS/PBS, and analyzed by flow cytometry. The side population was gated by the cells with low staining of Hoechst33342.
Sphere formation analysis
Five thousand cells were seeded in the Corning® Costar® Ultra-Low Attachment Multiple Well Plate (Sigma-Aldrich, Inc. St., Louis, MO, USA). The conditioned medium contained serum-free Dulbecco’s modified Eagle medium/F12, 20 ng/mL of epithelial growth factor, 20 ng/mL of basic fibroblast growth factor, 5 μg/mL of insulin, 1 × B27 supplement (Life Technologies, InvitrogenTM, Carlsbad, CA, USA), and 0.4% BSA. The formation of spheres (>50 μm) was visualized under a bright-field microscope after 4 days of incubation. The efficiency of sphere formation is the number of spheroids/the number of initial seeded cells.
In vivo NIR-II fluorescence imaging
The duration of in vivo NIR-II fluorescence imaging was up to 24 h, and the animal images were acquired at time indicated in the results. All animals were alive during this experiment. Imaging of xenograft tumors and associated vasculatures using the stereo-NIR-II fluorescence imaging system with fluorescent semiconducting Pdots that emit ultrabright NIR-II fluorescence (1000–1400 nm) has been reported recently (Su et al., 2022). In brief, 5 mg/mL of pDots-1000 (Em:1000 nm) was intravenously injected into tumor-bearing mice, which were immediately anesthetized with 2% isoflurane in the custom-made NIR-II fluorescence imaging system conducted with different long-pass filters under the 793 nm laser irradiation. The images were acquired using a cooled InGaAs camera (NIRvana 640, Princeton Instruments; 640 × 512 pixels, response 900–1700 nm) and a 35-mm C-mount zoom lens (LM35HC-SW, Kowa, Tokyo, Japan).
IHC
Tumors resected from tumor-bearing mice were rinsed with PBS and fixed in 4% paraformaldehyde with gentle shaking at 4°C overnight. The paraffin-embedded tissue sections were deparaffinized in xylene (Sigma-Aldrich, St. Louis, MO, USA) for 30 min followed by rehydration in graded ethanol and finally in PBS. The tissue sections were blocked in goat serum containing 5% H2O2, and incubated in a primary antibody for 1.5 h followed by the HRP-conjugated secondary antibody for another 1 h. The tissue sections were incubated with 3′,3′-diaminobenzidine (Dako Denmark A/S Produktionsvej 42 DK-2600 Glostrup Denmark) for development and then counterstained with H&E. The antibodies used for IHC included anti-CD31 (1:100, Cat# GTX130274), anti-E-cadherin (1:100, Cat# GTX100443), and N-cadherin (1:200, Cat# GTX127345). Tissue sections were stained by H&E. Images were acquired and quantified using an optical microscope with a digital camera (Olympus, Center Valley, PA, USA).
Wound healing assay
The CytoSelect™ 24-Well Wound Healing Assay (Cell Biolabs Inc., San Diego, CA, USA) was used for analysis of cell migration rate. A wound healing inert insert was included in the assay that provides a consistent width of wound gap for visualizing cell migration into a 0.9-mm wound field using a light microscope. Images of cell migration were acquired at different time points and the migration rate was determined by the following formula: migration rate (%) = (D0 − Dx) × 100/D0, where Dx is the wound width ratio at a specific time point, and D0 is the wound width ratio (set as 1) at the time when the insert was removed.
In vitro invasion assay
The matrigel (BD Biosciences, San Jose, CA, USA) was mixed with serum-free RPMI medium (1:4) and then added into Transwells (24 Well Millicell 8.0 μm; Millipore Co., Billerica, MA, USA). The Transwell was separately placed into the 24-well plate filled with normal RPMI medium. Cells (1 × 10⁵) were added on the top of solidified Matrigel. After 48 h of incubation, the Transwells were cleaned using the cotton stab and rinsed with PBS, followed by fixation using 4% paraformaldehyde for 10 min. The Transwells were stained with 1.25% (v/v) crystal violet solution in ethanol for 15 min. The Transwells were rinsed and the membranes were cut and placed onto slides for visualization under a light microscope (Leica DM IRB, Wetzlar, Germany). The number of invaded cells was quantified and averaged from three random image acquisition fields.
3D Invasion assay
The assay of cell migration at 3D environment was performed by following a previous report with slightly modifications (Sanz-Moreno et al., 2008). Cells (2 × 10⁵) were cultured in a 4-well chamber slide (Ibid. GmbH, Germany) overnight. The medium was then replaced with 500 μL of collagen I mix solution (1.8 mg/mL) and incubated for 30 min, and 400 μL of 15% FBS was added for 24 h. Subsequently, the plates were fixed with 4% paraformaldehyde, permeabilized by 0.5% Triton X-100, and stained with Alex-488-conjugated phalloidin (Invitrogen Corporation, CA, USA) for 30 min. The plates were visualized using a laser confocal microscope (ZEISS LSM 880 with AirtScan, Oberkochen, Germany) with oil lens, and the confocal Z sections were collected at 50 μm from the bottom of plates. The volume of visualization is 210 × 210 × 50 μm3. To obtain the 3D invasive imaging, the collected sequential Z sections were reconstructed using the Olympus FV10-ASW 1.7 software. Cells invasion was counted when they moved over 20 μm, and the reconstructed imaging was analyzed by visualizing three random areas.
Lentiviral infection of shRNA
Human embryonic kidney 293T packing cells (American Type Culture Collection, ATCC Cat #: CRL-3216TM, Manassas, VA, USA) were cultured overnight (70% confluence), followed by co-transfection with viral packaging plasmids CMV-△R8.91 (2.25 μg), pMD.G plasmids (0.25 μg), and pLKO.1-shNrf2 lentiviral plasmids [2.5 μg, clone ID: TRCN0000007558 with a hairpin sequence 5′-CCGG
Statistical analysis
The statistical methods included Student’s t-test and multiple t-test. Comparison of multiple groups was analyzed by one-way ANOVA followed by Tukey’s multiple comparison test. Each datum was averaged by the cell counts of triplicates, and p < 0.05 was regarded significant. The statistical analysis was performed by Prism v8.0 software (GraphPad Software, San Diego, CA, USA).
Footnotes
Acknowledgments
We thank Dr. Yu Kang and Dr. Congjian Xu (Fudan University, Shanghai, China) for providing Act-PBase plasmid and PB-tk-mRFP plasmids. We thank Mr. Hsueh-Yen Yu and Ms. Ke Xin Huang for technical support.
Availability of Data and Materials
All data generated or analyzed during this study are included in this published article.
Ethics Approval and Consent to Participate
Not applicable.
Patient Consent for Publication
Not applicable.
Author Disclosure Statement
The authors declare no conflict of interest.
Funding Information
These works were supported by the grants of the Ministry of Science and Technology of Taiwan (112–2124-M-A49A-501 and 111–2314-B-A49 -037-MY3),

Abbreviations Used
References
Supplementary Material
Please find the following supplemental material available below.
For Open Access articles published under a Creative Commons License, all supplemental material carries the same license as the article it is associated with.
For non-Open Access articles published, all supplemental material carries a non-exclusive license, and permission requests for re-use of supplemental material or any part of supplemental material shall be sent directly to the copyright owner as specified in the copyright notice associated with the article.
