




Abstract
Aims:
Drug resistance in ovarian cancer (OC) cells often leads to recurrence, metastasis, and high mortality rates among OC patients. Hydroxytyrosol (HT) has been reported to inhibit the proliferation of ovarian and other types of cancer cells. Here we synthesized a novel cyclohexane-hydroxytyrosol derivative (Chx-HT) for enhanced anticaner efficacy. We examined the growth-suppressing effect of Chx-HT on OC cells in vitro and in a xenograft mouse model and investigated the underlying mechanism.
Results:
We demonstrated that Chx-HT inhibits proliferation, promotes apoptosis, and remodels glucose and lipid metabolism by reducing fatty acid β-oxidation while increasing glycolysis, de novo fatty acid synthesis (FAS), and lipid droplet (LD) accumulation, impairs mitochondrial respiration, and induces oxidative stress both in vitro and in vivo. In addition, Chx-HT blocks autophagic flux by obstructing the maturation of lysosomal cathepsins in the late stage, but also activates autophagy through the p-AMPK/p-mTOR/p-ULK1 pathway in response to energy deficit.
Innovation and Conclusion:
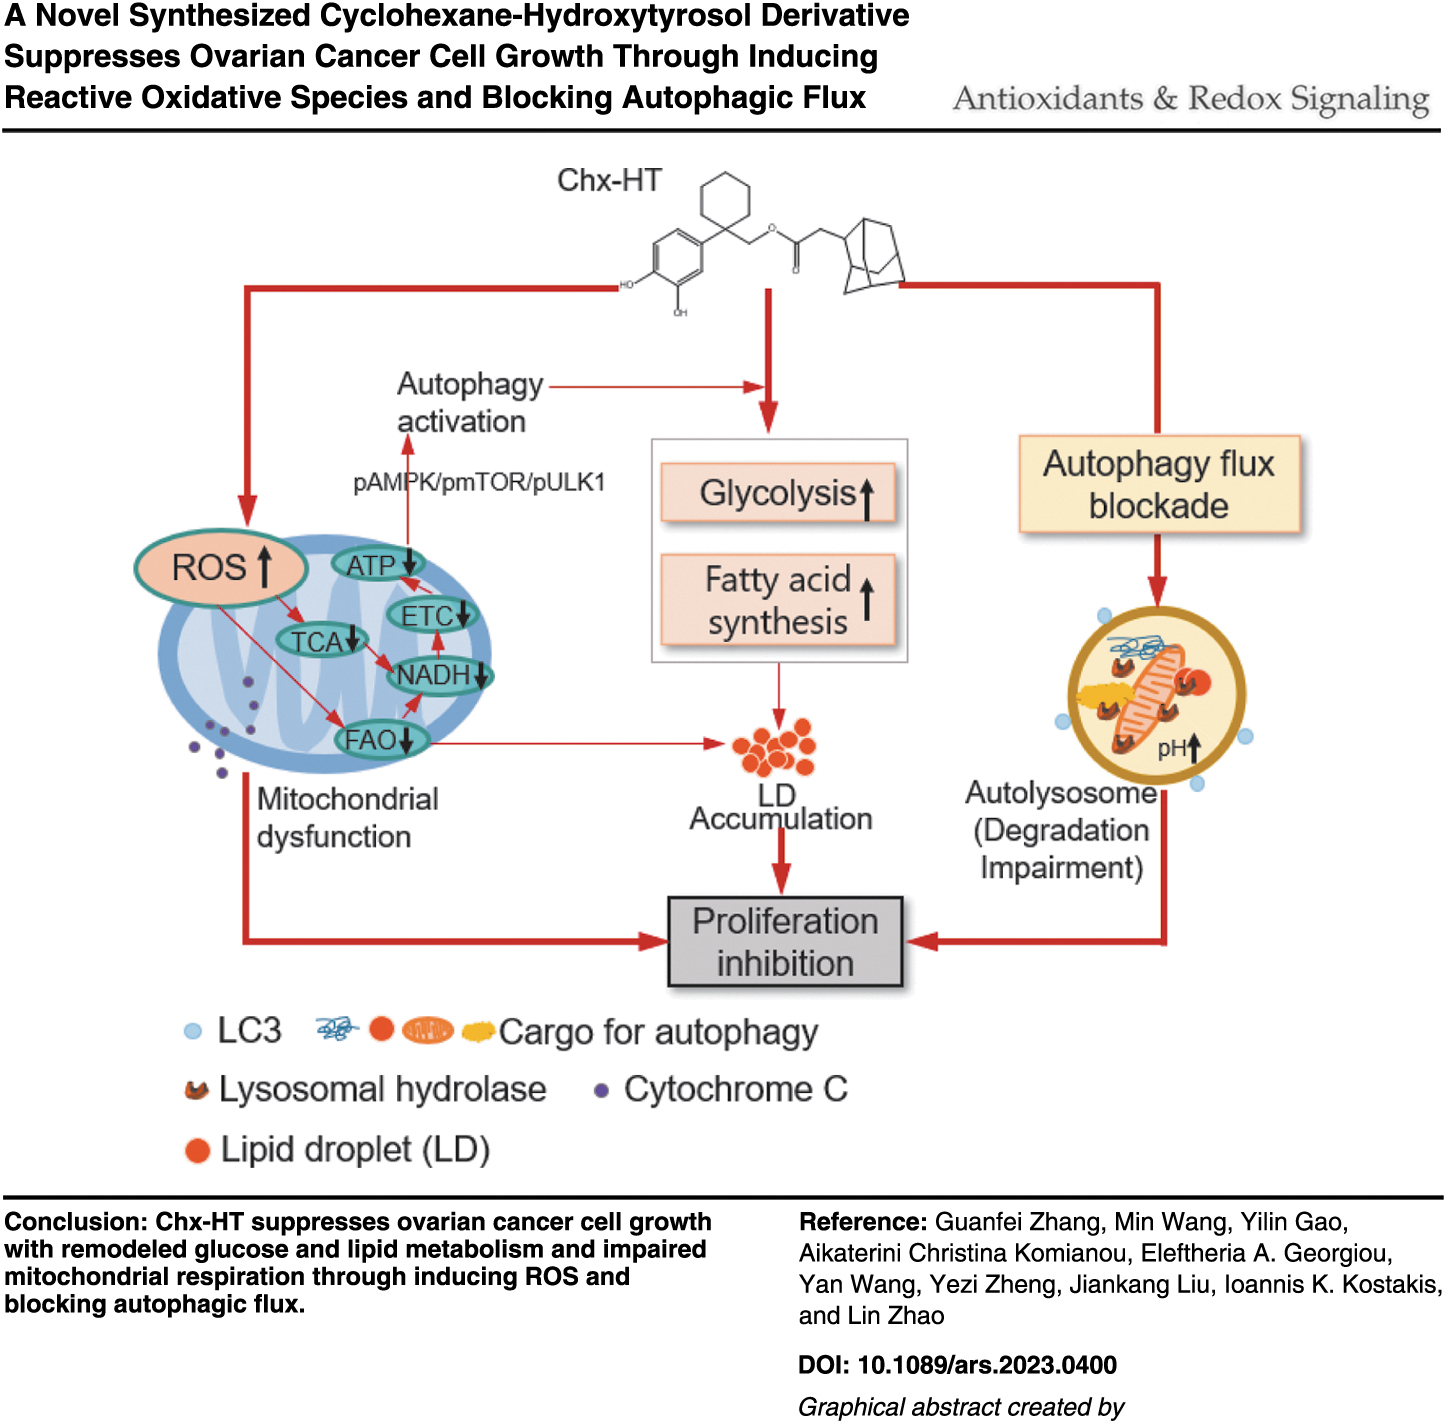
Reactive oxidative species (ROS) play a critical role in mediating the effects of Chx-HT on proliferation, apoptosis, autophagy, tricarboxylic acid (TCA) cycle, fatty acid β-oxidation, and mitochondrial respiration, and the autophagic activation underlies the effects of Chx-HT on glycolysis, de novo FAS, and LD accumulation in OC cells. Cotreating OC cells with Chx-HT and autophagic inhibitor or glycolytic inhibitor results in an additive inhibition of proliferation. Our study indicates that Chx-HT stands for a promising OC therapeutic by ROS and autophagy blockade-mediated metabolic remodeling.
Introduction
Ovarian cancer (OC
Innovation
Ovarian cancer (OC) cells exert metabolic reprograming. We synthesized a novel cyclohexane-hydroxytyrosol derivative (Chx-HT) to suppress the growth of OC cells. Reactive oxidative species mediates Chx-HT's effects on the inhibition of tricarboxylic acid, fatty acid β-oxidation (FAO), and mitochondrial respiration. Autophagic activation underlies Chx-HT's effects on the increase of lipid droplet accumulation, de novo fatty acid synthesis, and glycolysis.
Although aerobic glycolysis is considered to be the main form of energy metabolism in tumor cells, recent studies have shown that EOC cells also exhibit significantly enhanced oxidative phosphorylation (OXPHOS). This process produces large amounts of ATP to sustain the energy demands of EOC cell proliferation (Li et al., 2020). In comparison with normal ovarian cells, EOC cells exhibit higher OXPHOS activity, with elevated levels of OXPHOS enzymes, basal oxygen consumption rate (OCR), and respiratory capacity (Caneba et al., 2012; Dier et al., 2014; Li et al., 2020; Li et al., 2018). In addition, abnormal lipid metabolism is a common occurrence in several cancers, including OV. Studies have shown that the malignant progression of OC is accompanied by the increase of lipid metabolism.
These changes can promote proliferation and stimulate rapid and large-scale metastasis of OC cells in the peritoneal cavity through various signal pathways (Chaudhry et al., 2022; Dai et al., 2020). Key enzymes participating in lipid metabolism, such as FASN, ACLY, SCD1, and CPT1, and key lipid synthetic transcription factor SREBP1, have been reported to play crucial roles in the malignant progression of OC. Their upregulation not only substantially promotes the proliferation, migration, and drug resistance of OC cells but also correlates with the maintenance of tumor stem cell properties. Hence, OC cells undergo significant metabolic reprogramming (Granchi, 2018; Jiang et al., 2014; Li et al., 2017; Nie et al., 2013).
A recent study has highlighted the direct link between the metabolic reprogramming of cancer cells and autophagy, which is a prosurvival pathway that enables cancer cells to fit recycled components into metabolism to sustain their energy demands (Lin et al., 2018). Targeting autophagy thus offers a potential strategy for cancer treatment (Wang et al., 2020; Zhao et al., 2015). In particular, a study demonstrated that extracellular signal-regulated kinase (ERK)-mediated autophagy contributes to cisplatin resistance in OC cells, and inhibiting autophagy can help overcome this resistance (Wang and Wu, 2014).
LC3 stands out as the most extensively studied Atg8-like protein in mammals. It undergoes a crucial transformation under the processing of ATG4, leading to the formation of LC3-I (cytosolic form). The lipidation of LC3-I into LC3-II, a critical step in autophagy, is facilitated by a collaborative effort of ATG7, ATG3, and a complex comprising ATG12-ATG5 and ATG16L1, ultimately attaching phosphatidylethanolamine to LC3-I. Then the active membrane-bound form LC3-II incorporates into the extending phagophore membrane to engulf cellular components such as aberrant organelles and proteins (Brier et al., 2019). Autophagosomes are subsequently transported to lysosomes, where they fuse to form autolysosomes. This pivotal fusion event enables the degradation and recycling of malfunctioning cellular components, ultimately promoting cell viability (Guo et al., 2016).
The autophagic flux comprises several processes, including autophagosome formation, autophagosome-lysosome fusion, and intracellular content degradation, and the late-stage autophagic processes encompass cellular processes occurring subsequent to the fusion step (Tong et al., 2010). A fully functional lysosome is essential for the entire autophagic flux. A previous study reported that elaiophylin, a C2 symmetry 16-member macrodiolide antibiotic extracted from Streptomyces melanosporus, promotes autophagosome accumulation and blocks the late-stage autophagy, ultimately inhibiting the proliferation of OC cells (Zhao et al., 2015).
Hydroxytyrosol (HT), a well-known phenol present in olive oil, has attracted considerable scientific attention in recent years because of its inhibitory effects on multiple types of cancer such as breast cancer (Sirianni et al., 2010), colon cancer (Corona et al., 2009), prostate cancer (Luo et al., 2013), human promyelocytic leukemia cells (Fabiani et al., 2008), and others. HT was reported to inhibit the proliferation of OC cells through inhibiting the ERK1/2 signaling pathway (Oktay and Tuğrul, 2016). Herein, we describe the design and synthesis of a novel cyclohexane-hydroxytyrosol derivative (Chx-HT) for enhanced anticancer efficacy. More precisely, Chx-HT is a lipophilic adamantane ester of HT, bearing a cyclohexane substitution on the alpha-carbon of the HT side chain. With its distinct physical and chemical properties and nontoxic nature, adamantane is commonly used in pharmaceutical synthesis to enhance the pharmacological characteristics of core compounds.
The inclusion of the cyclohexyl group elevates the stereochemical diversity of the core compound, consequently amplifying its biological activity. Moreover, both adamantane and cyclohexyl groups exhibit excellent lipid solubility, contributing to improved membrane permeability of these core compounds (Bodor et al., 1988; Lin et al., 1989; Sayed et al., 2020).
In this study, we demonstrated the anticancer activity of Chx-HT in OC cells and uncovered the underlying mechanism as inducing oxidative stress and blocking late-stage autophagic degradation involving the maturation of lysosomal cathepsins, which leads to impaired mitochondrial respiration and remodeled glucose and lipid metabolism. More excitingly, Chx-HT exhibits potent efficacy in inhibiting tumor growth in a xenograft mouse model, suggesting that Chx-HT has great therapeutic potential in the treatment of drug-resistant OC.
Results
Synthesis of Chx-HT
For the synthesis of Chx-HT, 2-adamantane carboxylic acid (

For the preparation of compound
The purity of the tested compounds was >97%. The structure of HT is shown in Figure 1C.
Chx-HT inhibits proliferation and promotes apoptosis of OC cells in vitro and in vivo
HT has been demonstrated to inhibit the proliferation of human OC cell lines; however, achieving efficacy necessitates high dosage levels (Oktay and Tuğrul, 2016). Due to the critical importance of the two phenolic hydroxyl groups for HT activity, we synthesized a series of derivatives by modifying the hydroxyl group to enhance the anticancer activity of HT. We treated OC cell lines SKOV3 and OVCAR3 with these derivates of the same concentration (20 μM) for 48 h and found that Chx-HT has the best inhibitory effect on cell viability determined by MTT and mitochondrial membrane potential (MMP) (Supplementary Fig. S1). Notably, the cyclohexane substitution on the alpha-carbon and the lipophilic adamantane at the end of the HT side chain are necessary for the inhibitory activity of the derivative, and the position of the adamantane binding also matters.
Next is to explore the inhibitory effect of Chx-HT on OC cells in detail. Results showed that the IC50 of Chx-HT treatment of 48 h in SKOV3 and OVCAR3 cells is significantly lower than that of HT (Supplementary Fig. S2A, B). Furthermore, Chx-HT inhibited SKOV3 and OVCAR3 cell proliferation in a dose- and time-dependent manner (Fig. 2A, B). Crystal violet staining and soft agar assays showed less ability of colony formation on Chx-HT-treated SKOV3 cells (Fig. 2C, D). We also determine if the cisplatin sensitivity is restored following Chx-HT treatment. The concurrent use of Chx-HT with cisplatin resulted in a synergistic inhibition of SKOV3 cell proliferation (Supplementary Fig. S2B).

To elucidate the underlying mechanisms, we assessed the apoptosis and cell cycle distribution of OC cells following Chx-HT treatment. Results showed increased apoptosis in Chx-HT-treated SKOV3 and OVCAR3 cells, accompanied by the release of cytochrome C from mitochondria to cytoplasm (Fig. 2E, F and Supplementary Fig. S2C). Besides, we also observed a decrease in Bcl-2 level, an elevation in Bak, and the activation of cleaved-caspase9 and -PARP proteins (Fig. 2G, H). Further to verify the apoptotic effect of Chx-HT, we applied Z-VAD-FMK (a pan-caspase inhibitor) or Chx-HT alone or in combination to treat SKOV3 cells, and found that Z-VAD-FMK mitigated the inhibitory effect of Chx-HT on cell proliferation (Supplementary Fig. S2D). However, Chx-HT showed no effect on the cell cycle in both SKOV3 and OVCAR3 cells (Supplementary Fig. S2E–G).
Furthermore, the cytotoxicity of Chx-HT in normal ovarian epithelium IOSE80 cells was assessed and observed a slightly inhibitory effect on the proliferation at different concentrations and time points compared with SKOV3 cells, demonstrating the specificity of Chx-HT toward cancer cells (Supplementary Fig. S2H, I). These results indicate that Chx-HT specifically inhibits OC cell proliferation with less cytotoxicity toward normal ovarian cells.
Before examining the in vivo antitumor effect of Chx-HT, we first had to evaluate its toxicity. Vehicle or 20 mg/kg Chx-HT was administered to C57BL/6 mice through intraperitoneal (i.p.) injection or gavage every day for 24 days. Daily dosing for the 20 mg/kg was well tolerated, as demonstrated by the monitors of body weight and food and water intakes (Supplementary Fig. S2J–L). Besides, a histological examination of vital organs also showed no significant differences (Supplementary Fig. S2M). Thus, a dose of 20 mg/kg Chx-HT does not cause toxicity and side effects to mice.
To examine the antitumor effect in vivo, we generated an SKOV3 cell tumor xenograft model using male BALB/c null mice. Vehicle or 10 or 20 mg/kg of Chx-HT was administered through i.p. every day for 4 weeks. Chx-HT exhibited a conspicuous antitumor effect in vivo during the experiment period, significantly decreasing tumor volume and weight (Fig. 2I, J and Supplementary S2N), but without affecting body weight (Supplementary Fig. S2O). The tumor growth inhibition rate was higher than 50% in Chx-HT groups (both 10 and 20 mg/kg) compared with the control group. The expression of Ki67 was also significantly reduced by Chx-HT in tumors (Fig. 2K). Besides, the increased levels of proapoptotic protein BAK and cleaved-Caspase 9 were observed in Chx-HT groups (Fig. 2L). Next, we assessed whether estrogen influences the inhibitory effect of Chx-HT on the SKOV3 xenograft tumor, and we generated a xenograft model using female BALB/c null mice.
The results revealed that Chx-HT exhibited an equally potent inhibitory effect on tumor growth (Supplementary Fig. S2P), irrespective of the presence or absence of estrogen. Together, Chx-HT exerts a significant inhibition on the SKOV3 xenograft tumor without apparent toxicity and side effects.
Chx-HT remodels glucose metabolism by enhancing glycolysis and reducing tricarboxylic acid cycle in OC cells in vitro and in vivo
Tumor initiation and progression necessitate the metabolic reprogramming of cancer cells (Martinez-Reyes and Chandel, 2021). We sought to investigate whether Chx-HT influences the metabolism in OC cells. Our results showed an increase in glucose uptake and lactate secretion after Chx-HT treatment, suggesting an enhanced glycolysis in both SKOV3 and OVCAR3 cells (Fig. 3A, B). Furthermore, quantification of the extracellular acidification rate (ECAR), which is indicative of glycolytic flux, revealed an increase in glycolysis, glycolytic capacity, and glycolytic reserve upon Chx-HT treatment (Fig. 3C). In addition, the mRNA levels of key glycolytic enzymes, including glucose transporter GLUT1, limiting enzymes HK2 and PKM2, and lactate metabolism MCT4, were upregulated upon Chx-HT treatment, further supporting an increased glycolytic flux (Fig. 3D).
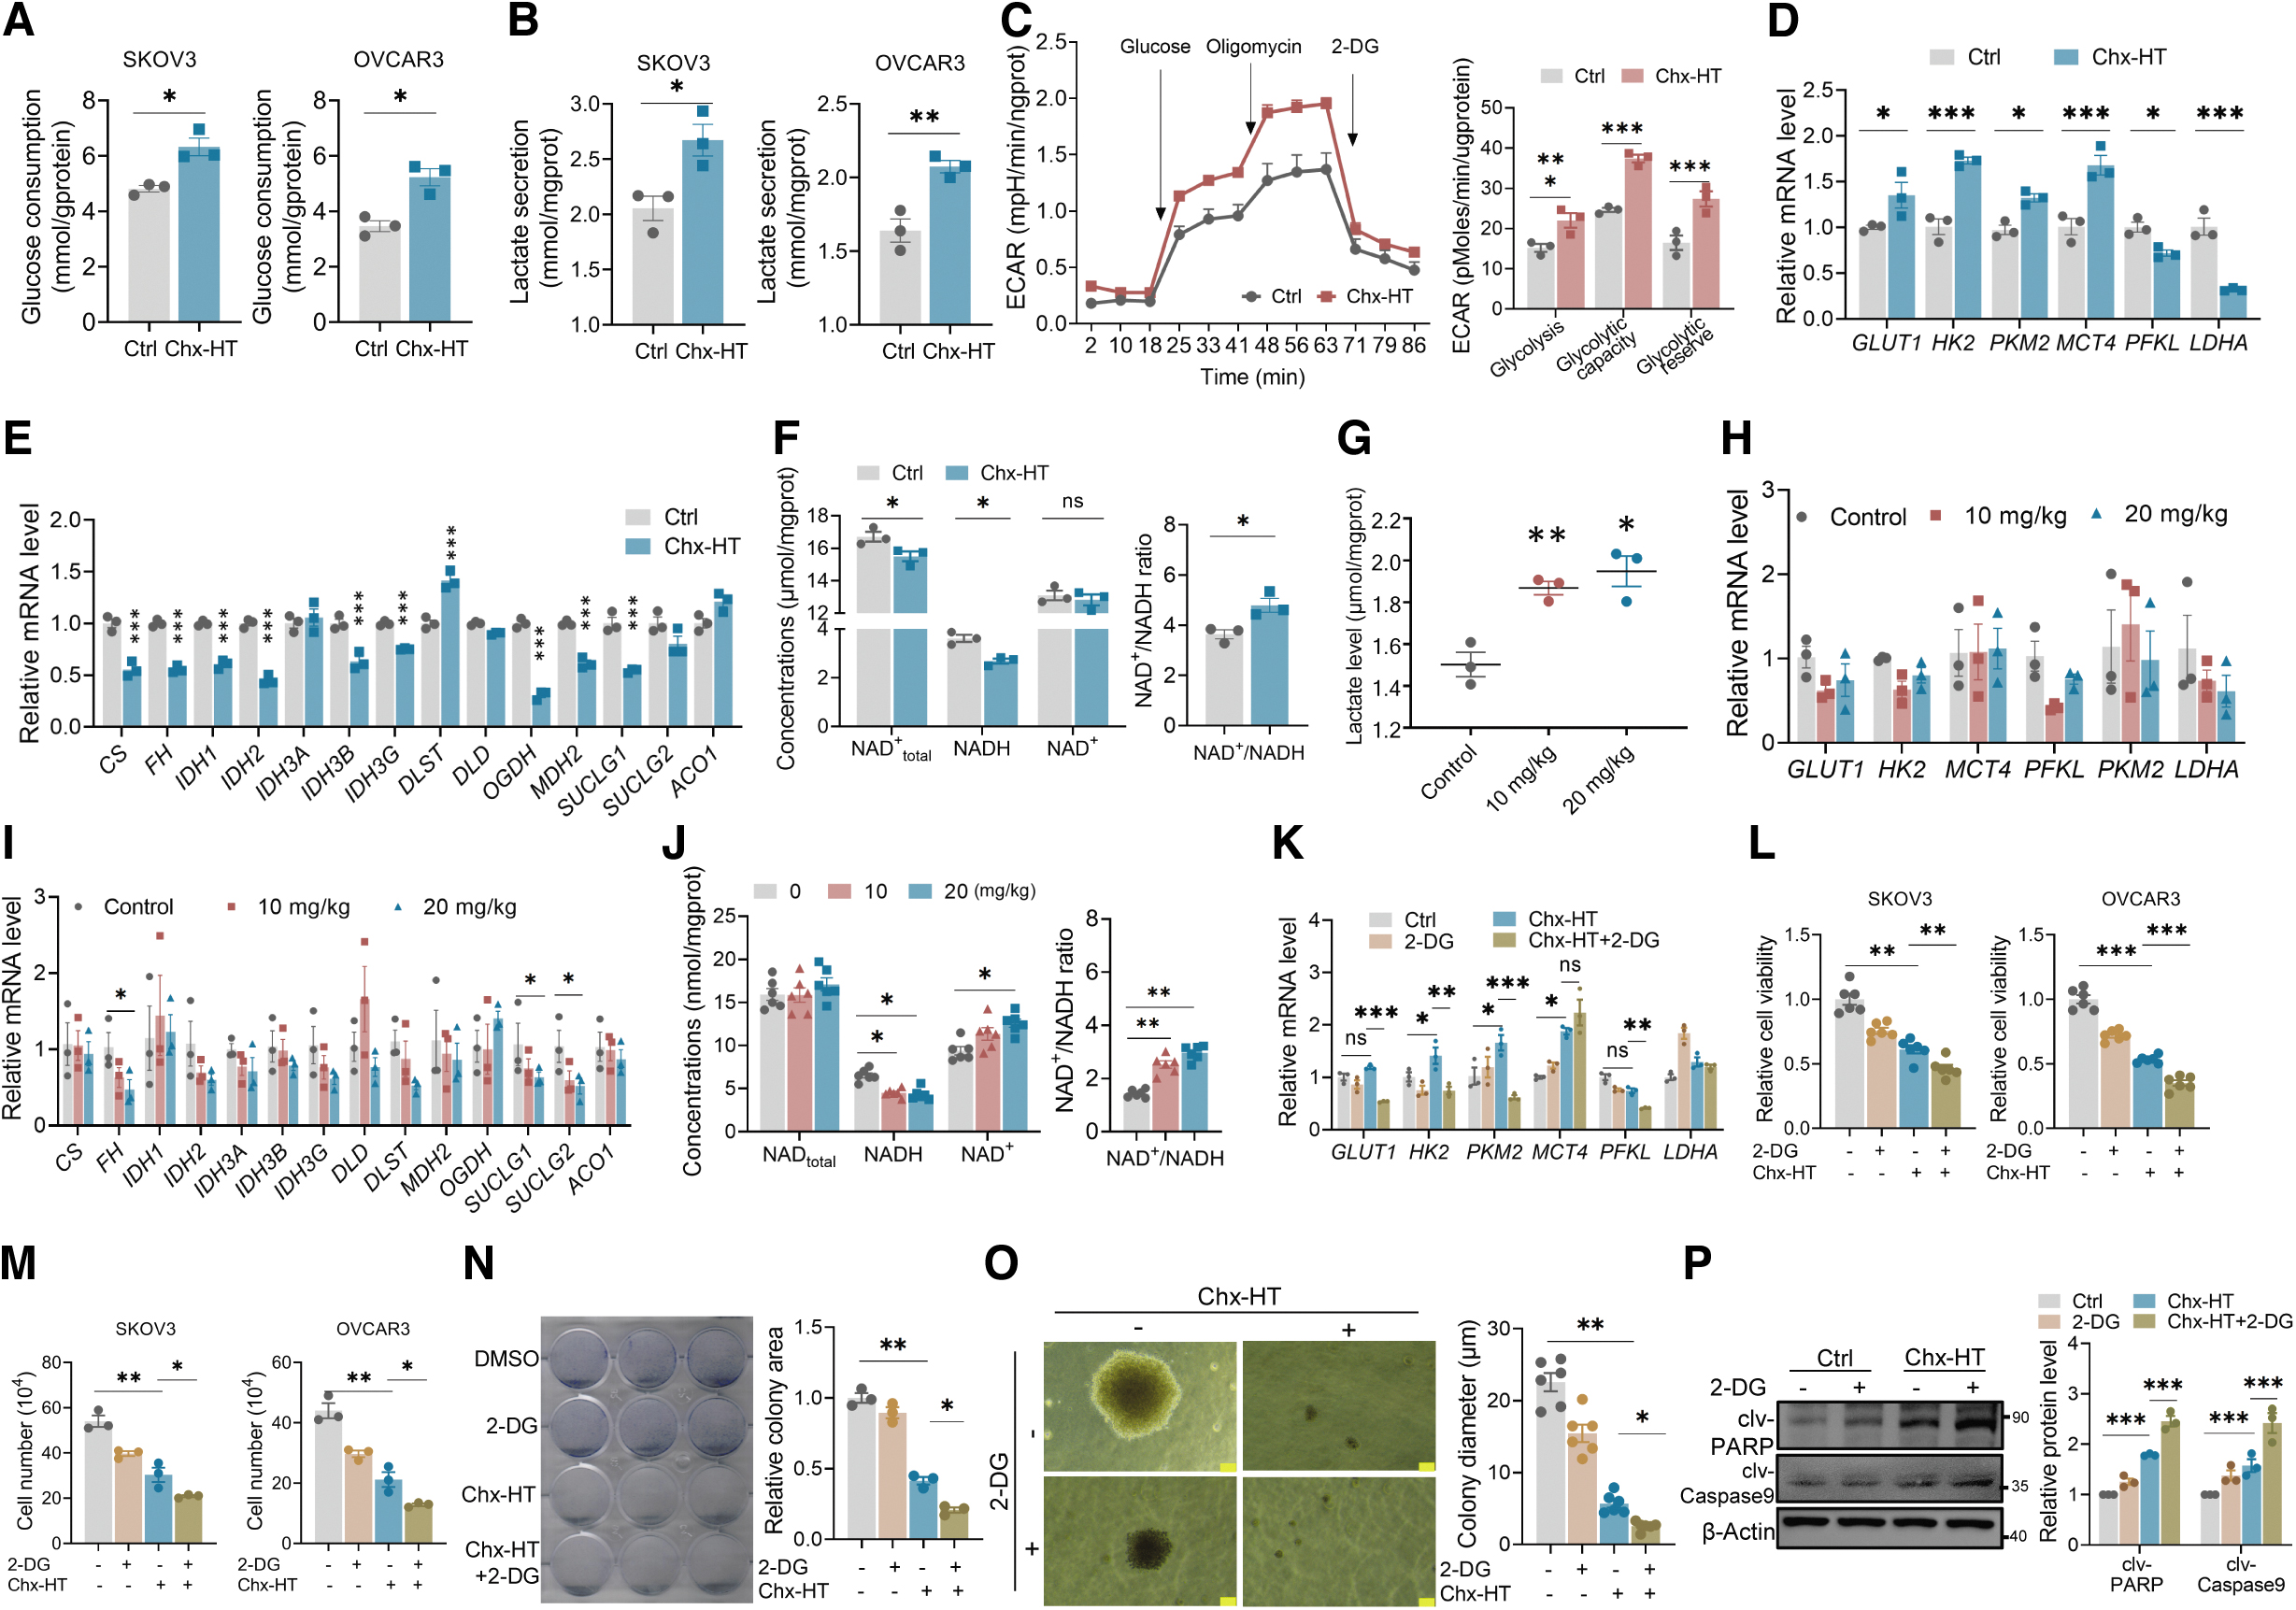
Recent studies have provided genetic evidence that mitochondrial metabolism is crucial for tumorigenesis (Fogal et al., 2010; Guo et al., 2011; Weinberg et al., 2010). Cancer cells effectively utilize mitochondrial metabolism, such as TCA cycle and FAO to generate intermediates for multiple biosynthesis and provide NADH and FADH2 for OXPHOS (Adamik et al., 2020; Sakowicz-Burkiewicz et al., 2021; Zhang et al., 2022). We examined the effects of Chx-HT on the TCA cycle in SKOV3 cells and found that most metabolic enzymes in the TCA cycle were downregulated upon Chx-HT treatment (Fig. 3E). Interestingly, we observed an increase in the mRNA level of dihydrolipoamide succinyltransferase (DLST).
In addition, we also determined whether Chx-HT influences the NADH level, and the results showed a decreased NADH level and an imbalanced NAD+/NADH ratio upon Chx-HT treatment (Fig. 3F). We checked the rate-limiting enzyme involved in the synthesis of NAD+, and found that Chx-HT treatment does not change the mRNA level of NAMPT (Supplementary Fig. S3A). Together, these data indicate that Chx-HT decreases the TCA cycle in OC cells.
Our in vivo results in xenograft tumors also showed increased glycolysis in Chx-HT groups, with an elevated lactate level (Fig. 3G). Interestingly, no significant changes were observed in the mRNA levels of glycolytic enzymes (Fig. 3H). In addition, we noted a decrease in the mRNA levels of some key TCA enzymes, including FH, SUCLG1, and SUCLG2, accompanied by a reduction in NADH levels (Fig. 3I, J) and an increase in the NAD+/NADH ratio. Intriguingly, the Chx-HT administration showed no changes to total NAD as well as to the mRNA level of NAMPT enzyme (Supplementary Fig. S3B), suggesting that Chx-HT treatment resulted in less NAD+ being reduced to NADH, but did not affect NAD+ generation or the total NAD levels.
Increased glycolysis is associated with the development of tumor cell. However, our results showed that Chx-HT significantly increases the glycolysis in OC cells. This led us to hypothesize that enhancing glycolysis may be a metabolic adaptation in response to Chx-HT treatment stress. To test this hypothesis, we treated SKOV3 cells with 2-deoxyglucose (2-DG), a glucose analog that inhibits glycolysis by targeting hexokinase, to observe whether glycolytic inhibition further enhances the proliferation inhibition of Chx-HT. The results showed that 2-DG treatment significantly decreased glycolytic enzyme transcription (Fig. 3K) and further decreased proliferation (Fig. 3L, M) and clonogenicity (Fig. 3N, O) and promoted apoptosis (Fig. 3P) in Chx-HT-treated SKOV3 cells. These data indicate that Chx-HT induces a remodeling of glucose metabolism in OC cells both in vitro and in vivo, characterized by increased glycolysis and reduced TCA cycle.
Chx-HT remodels lipid metabolism by reducing FAO, upregulating de novo fatty acid synthesis, and accumulating lipid droplet in OC cells in vitro and in vivo
Previous studies have highlighted that OC malignant progression is often accompanied by an increase in lipid metabolism (Chaudhry et al., 2022; Dai et al., 2020). We then investigated whether Chx-HT influences lipid metabolism in SKOV3 and OVCAR3 cells, and observed an increased number of Bodipy 493/503 or Nile red-labeled lipid droplets (LDs) (Fig. 4A, B), as well as triglyceride (TG) level (Fig. 4C). In addition, we detected the mRNA levels of CIDEA, B, and C (cell death inducing factor DFFA-like effecter A, B, and C) and PLIN1, 2, and 3 (perilipin 1, 2, and 3, the major lipid droplet-binding proteins) and observed that Chx-HT led to higher mRNA levels of PLIN1 and PLIN3 (Fig. 4D).
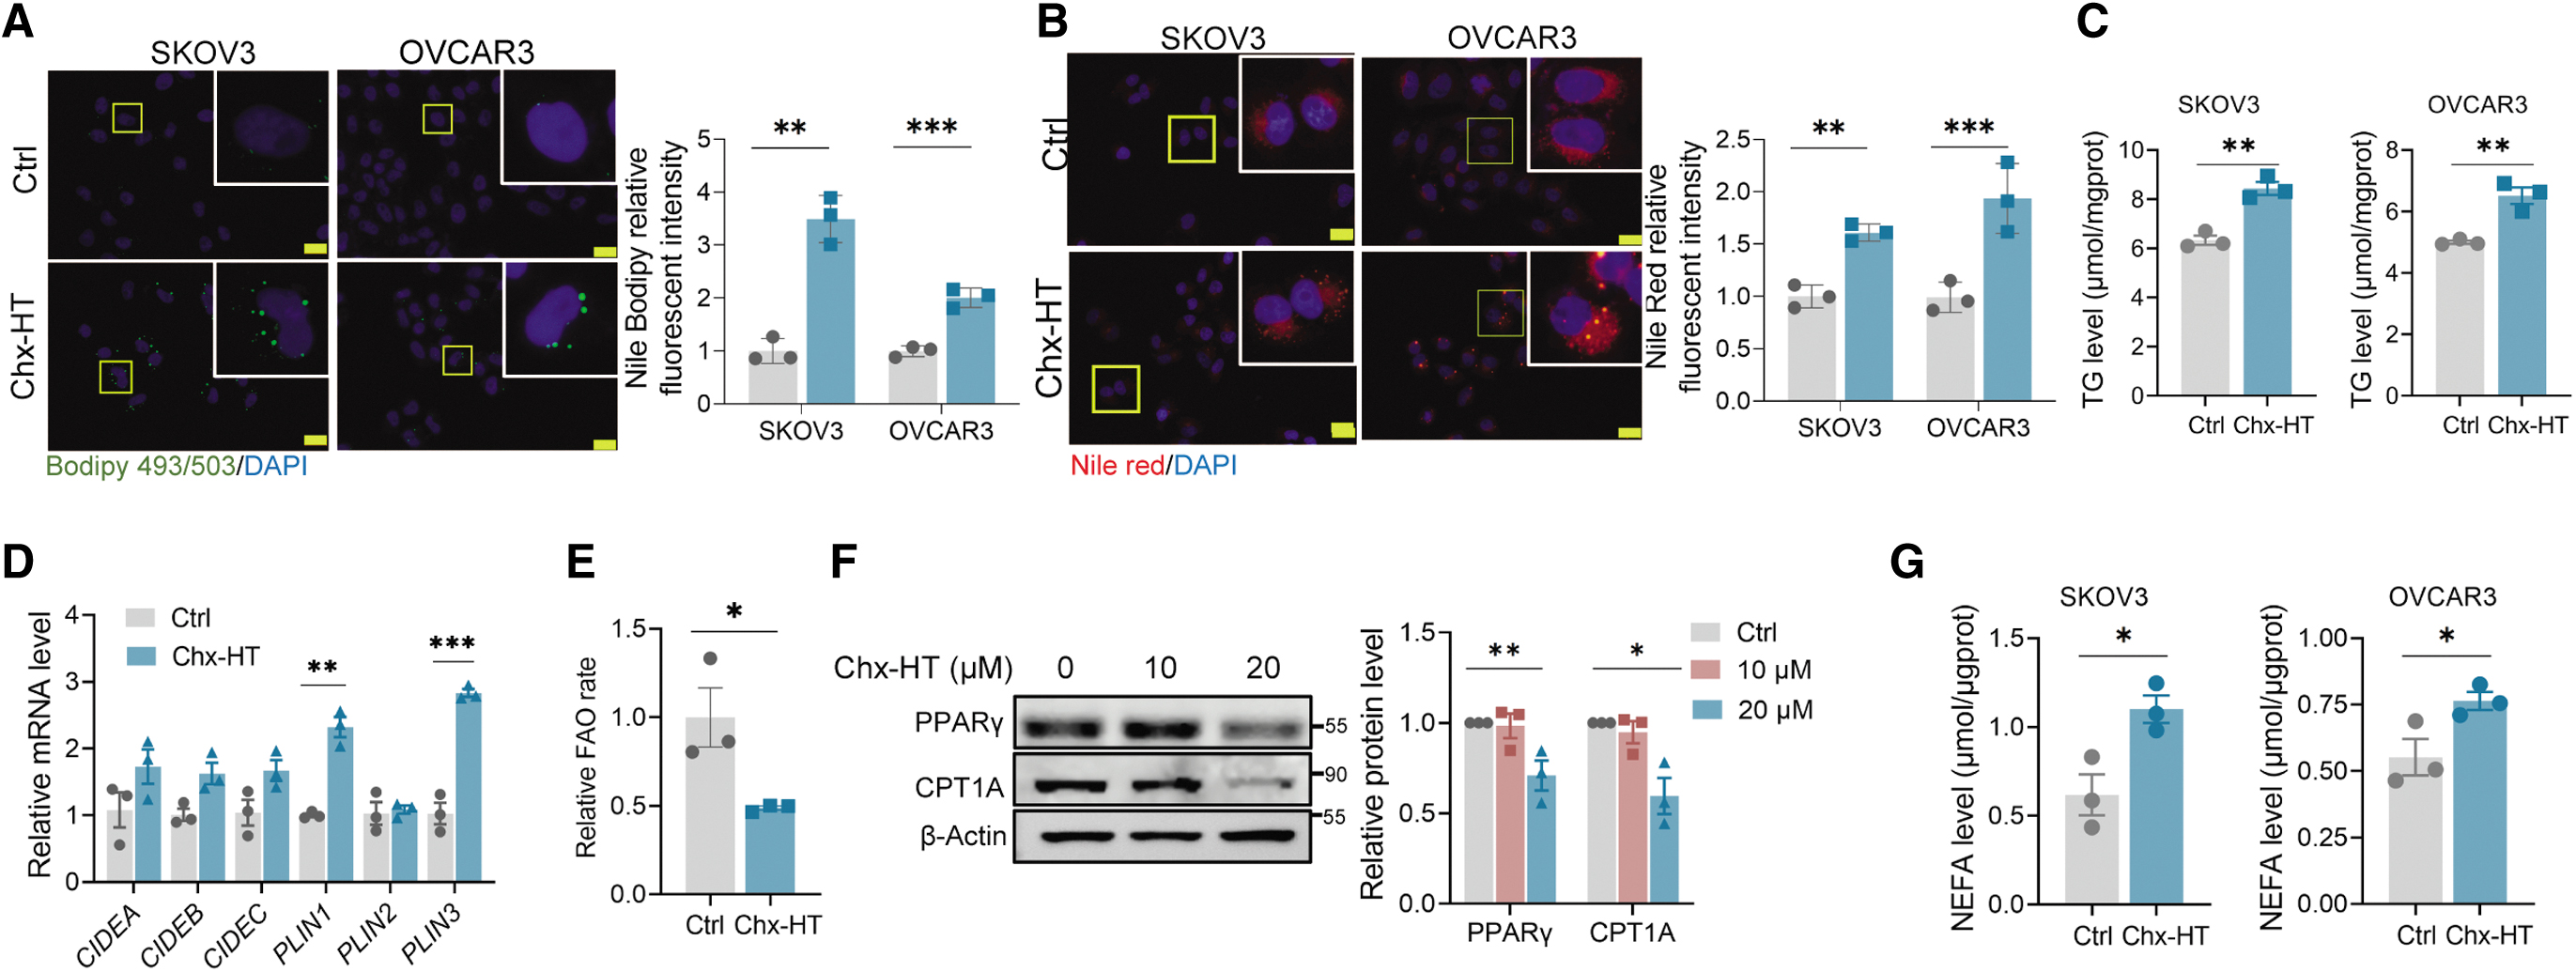

Interestingly, we observed a decreased FAO rate in Chx-HT-treated SKOV3 cells (Fig. 4E), This decrease in FAO rate, together with a reduction in NADH upon Chx-HT treatment, futher indicated the damage to mitochondrial function upon Chx-HT treatment. Consistently, the decreased protein expression of lipid-activated transcription factor γ (PPARγ) and carnitine palmitoyl transferase 1A (CPT1A) (Fig. 4F) was observed. In addition, we observed an increase in de novo fatty acid synthesis (FAS) upon Chx-HT treatment (Fig. 4G). Both the protein and mRNA expressions of key regulators in de novo lipogenesis, such as SREBP1, ACC, and FASN, were increased upon Chx-HT treatment (Fig. 4H, I).
Consistent with our in vitro findings, we also observed an increased LD accumulation in tumors in vivo. The results revealed a significantly more LD (Fig. 4J) and TG level (Fig. 4K) in the 20 mg/kg group. Furthermore, a decreased protein level of CPT1A in the 20 mg/kg group was observed (Fig. 4L), alongside increased protein levels of SREBP1, ACC, and FASN upon Chx-HT treatment (Fig. 4M).
To comprehensively examine how Chx-HT promotes FAS and LD formation, we had to figure out where FAS obtained its substrates. As the glucose uptake and glycolysis were increased upon Chx-HT treatment (Fig. 3A, B), we hypothesized that the substrates for FAS might be originated from glycolytic products. To verify our hypothesis, we treated SKOV3 cell with 2-DG to observe whether glycolytic inhibition counteracts the increased LDs and FAS induced by Chx-HT. The results showed that 2-DG treatment significantly blocked LD formation (Fig. 4O, P) and FAS (Fig. 4Q, R), suggesting that glycolysis enhanced by Chx-HT supports LD accumulation and FAS.
Chx-HT results in impaired mitochondrial respiration and oxidative stress in OC cells in vitro and in vivo
Considering the observed decrease in TCA cycle, FAO, and NADH level in Chx-HT-treated cells, we were intrigued to explore whether Chx-HT also causes mitochondrial dysfunction. Our results showed that Chx-HT led to a reduced MMP in a time-dependent manner (Fig. 5A). As mitochondrial dysfunction is primarily caused by OXPHOS impairment (Fernandez-Vizarra and Zeviani, 2021), we observed a significant reduction of ATP upon Chx-HT treatment (Fig. 5B). Furthermore, real-time monitoring of mitochondrial OCR revealed significant reductions in basal respiration, ATP turnover, and maximum respiration in Chx-HT-treated cells, indicating impaired respiratory function (Fig. 5C). Based on these findings, we hypothesized that the decreased mitochondrial respiration is associated with the electron transport chain (ETC) defects.

Also, the results showed that Chx-HT significantly suppressed the activities of ETC complexes I–IV (Fig. 5D) and downregulated the expression of ETC complex I subunit (NDUFS3) and complex II subunit (SDHB) (Fig. 5E), indicating that Chx-HT impairs mitochondrial respiration in OC cells.
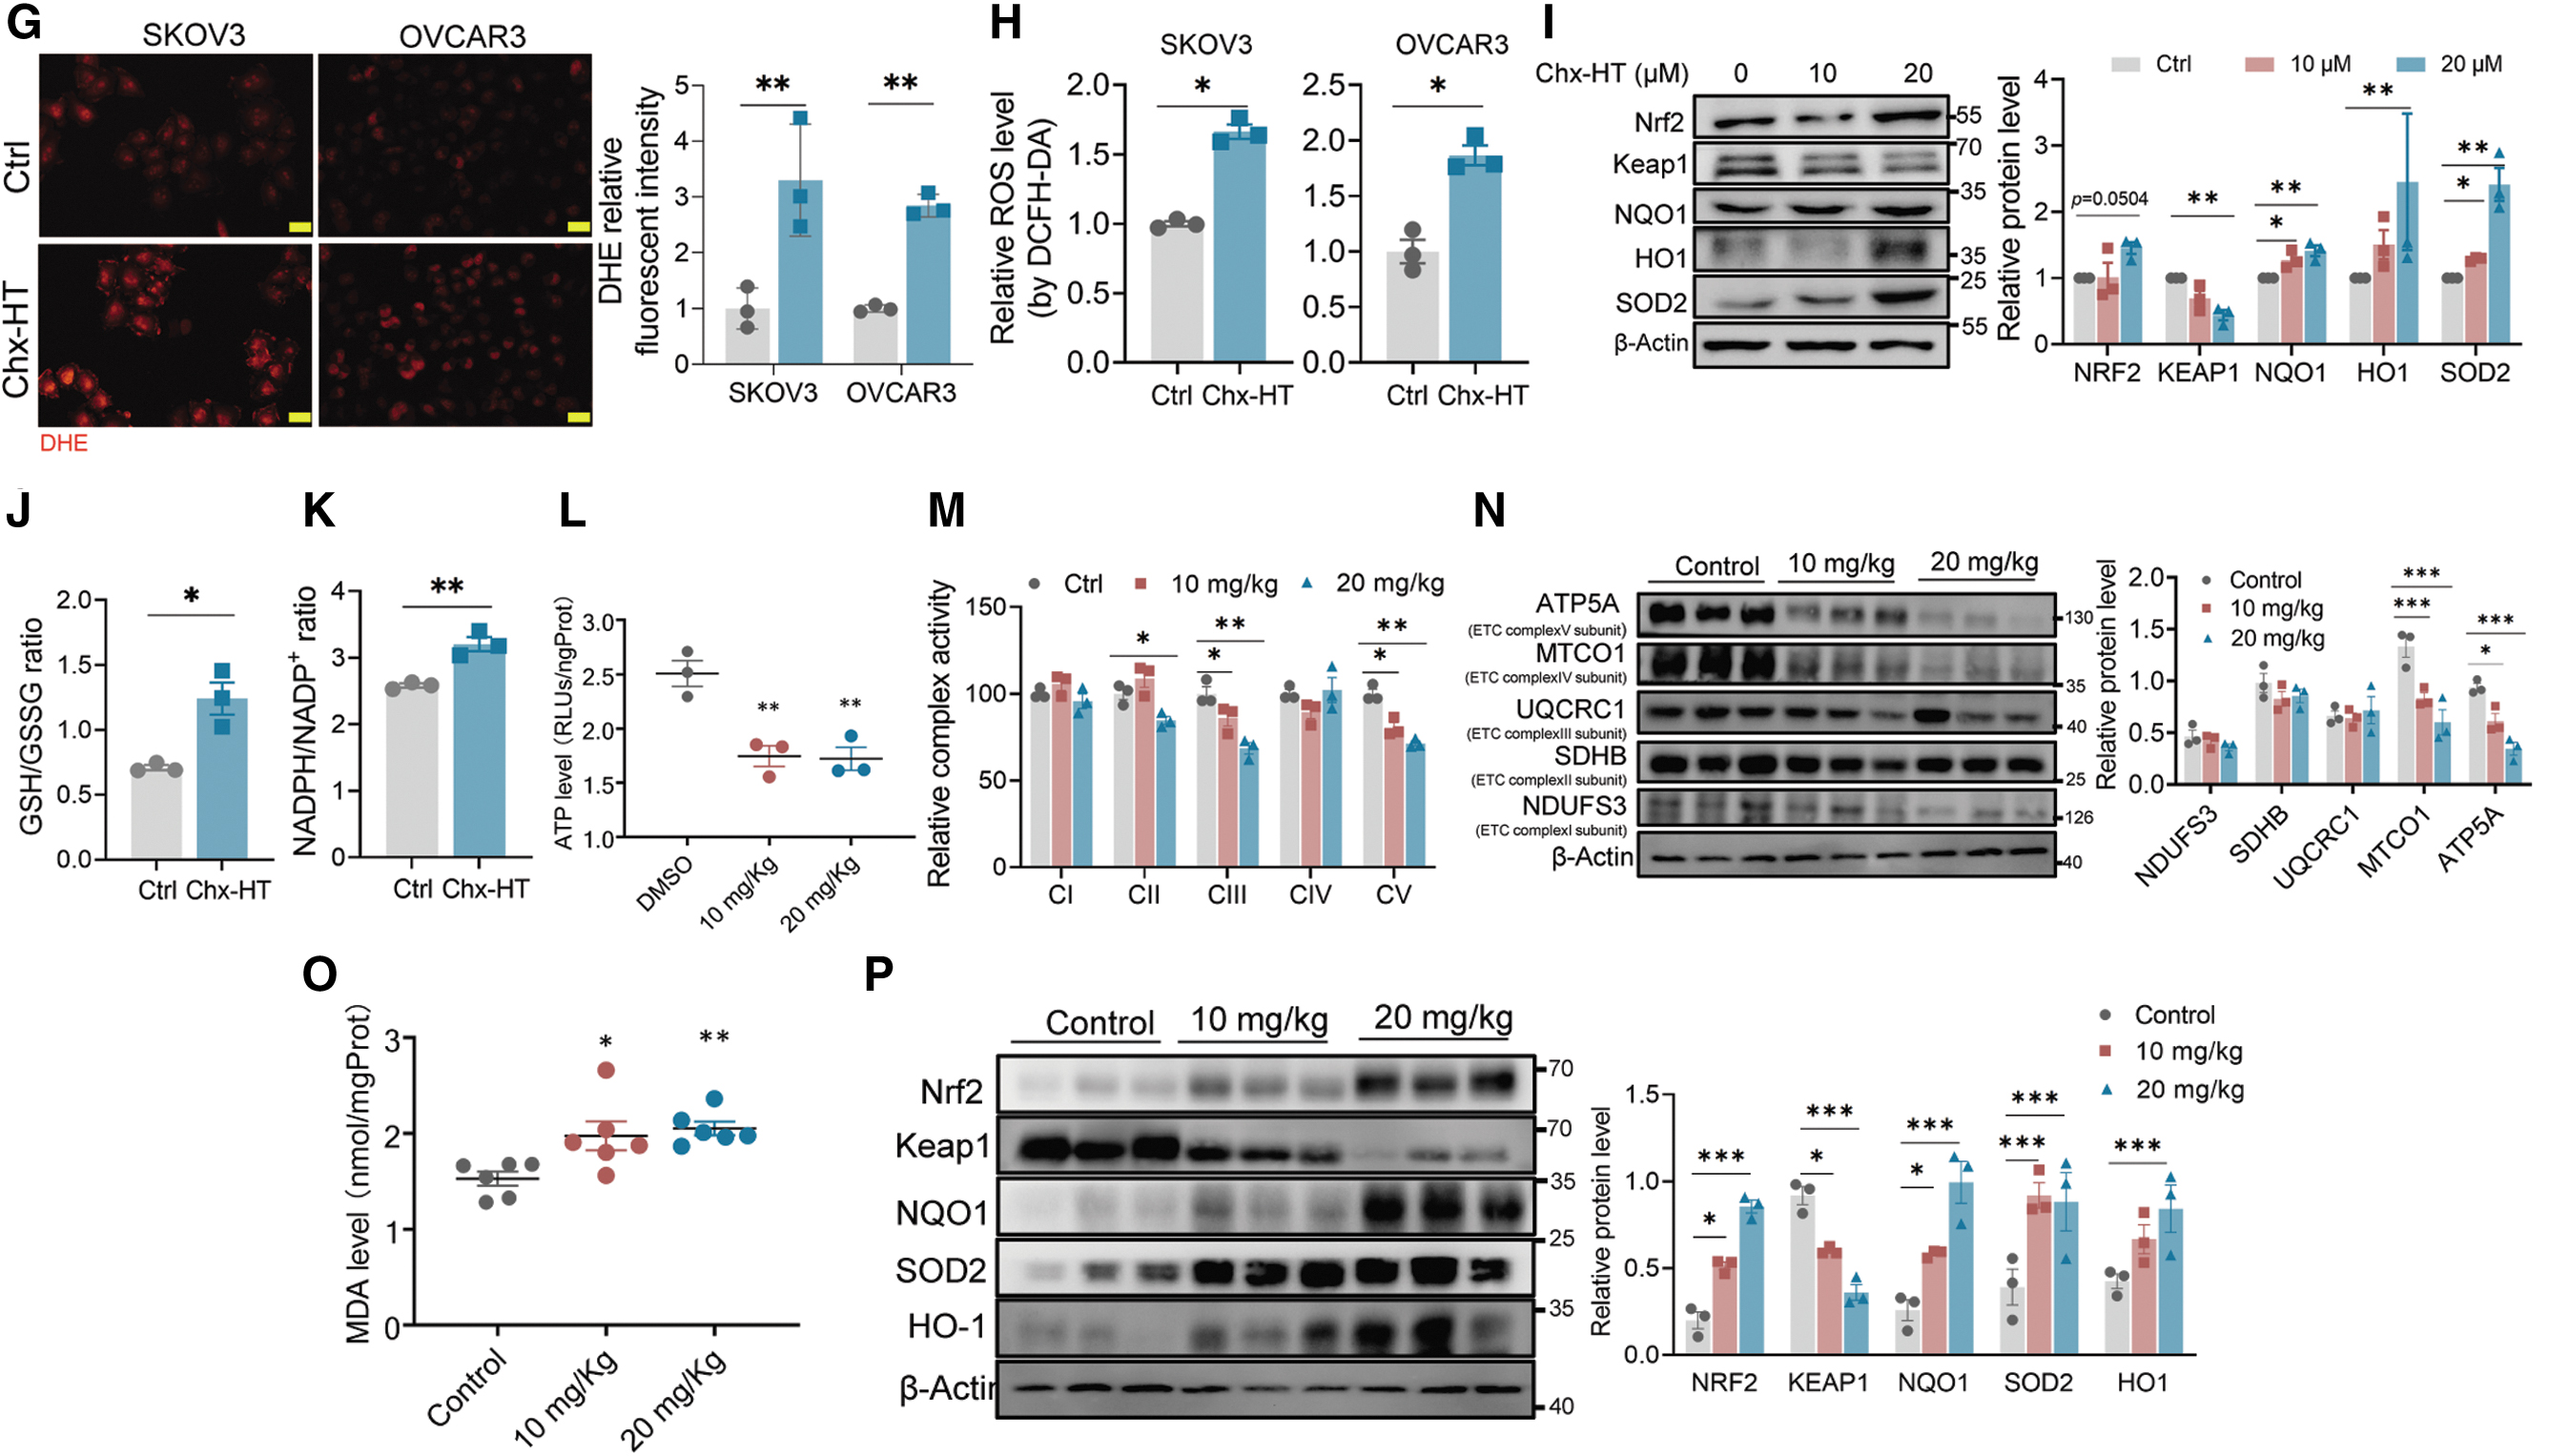
Evidence suggested that mitochondrial dysfunction is associated with reactive oxidative species (ROS) elevation (Xia et al., 2018). We used MitoSOX red to assess the mitochondrial superoxide and observed a marked fluorescence upon Chx-HT treatment (Fig. 5F). We also investigated the effect of Chx-HT on cellular ROS and found a significant increase in superoxide production, as determined by the dihydroethidium (DHE) probe (Fig. 5G), and in the overall ROS level, as determined by 2′,7′-dichlorodihydrofluorescein diacetate (DCFH-DA) (Fig. 5H).
This led us to investigate whether this ROS elevation resulted from damage to the antioxidant system. We examined the expression of key antioxidant proteins regulated by Nrf2/Keap1, including NQO1, HO1, and SOD2, and intriguingly, we observed a significant increase in the expression of these proteins in response to Chx-HT (Fig. 5I). In addition, as the cellular antioxidant systems rely on the NADPH pool for the maintenance of reduced glutathione, we also observed an increase ratio of glutathione (GSH)/glutathione disulfide (GSSG) and NADPH/NADP+ (Fig. 5J, K). These data indicate that Chx-HT elicits robust oxidative stress accompanied by an enhanced Nrf2/Keap1 antioxidant defense system.
We also examined the effect of Chx-HT on mitochondrial respiration in xenograft tumors. Chx-HT treatment reduced ATP levels (Fig. 5L) and activities of ETC complexes II, III, and IV in tumors (Fig. 5M). Interestingly, Chx-HT decreased the levels of ETC complexes IV (MTCO1) and V (ATP5A) subunits in tumors, rather than NDUFS3 and SDHB (Fig. 5N). However, it is clear that Chx-HT impairs mitochondrial respiration in vivo. Besides, we also observed an increased oxidative stress in Chx-HT-treated tumors, as demonstrated by increased lipid peroxidation (Fig. 5O), as well as an induction of the Nrf2-dependent antioxidant defense system, as demonstrated by the dramatic upregulation of the NQO1, HO1, and SOD2 proteins (Fig. 5P).
These data suggest that Chx-HT causes impaired mitochondrial respiration and oxidative stress in OC cells both in vitro and in vivo.
ROS mediate Chx-HT effects on proliferation, apoptosis, glycolysis, TCA cycle, FAO, and mitochondrial respiration but not on lipid synthesis and LD accumulation in OC cells
As Chx-HT caused mitochondrial dysfunction and ROS accumulation, we tested whether scavenging ROS with N-acetyl cysteine (NAC) reduces proliferation inhibition and cell apoptosis by Chx-HT. The data showed that NAC significantly reduced ROS level detected by MitoSOX red and DHE and DCFH-DA probes (Fig. 6A–C). Also, NAC treatment significantly increased cell viability, cell number, and colony formation and decreased Chx-HT-induced apoptosis in Chx-HT-treated cells (Fig. 6D–I). These data indicate that Chx-HT inhibits proliferation and induces apoptosis of OC cells through ROS.

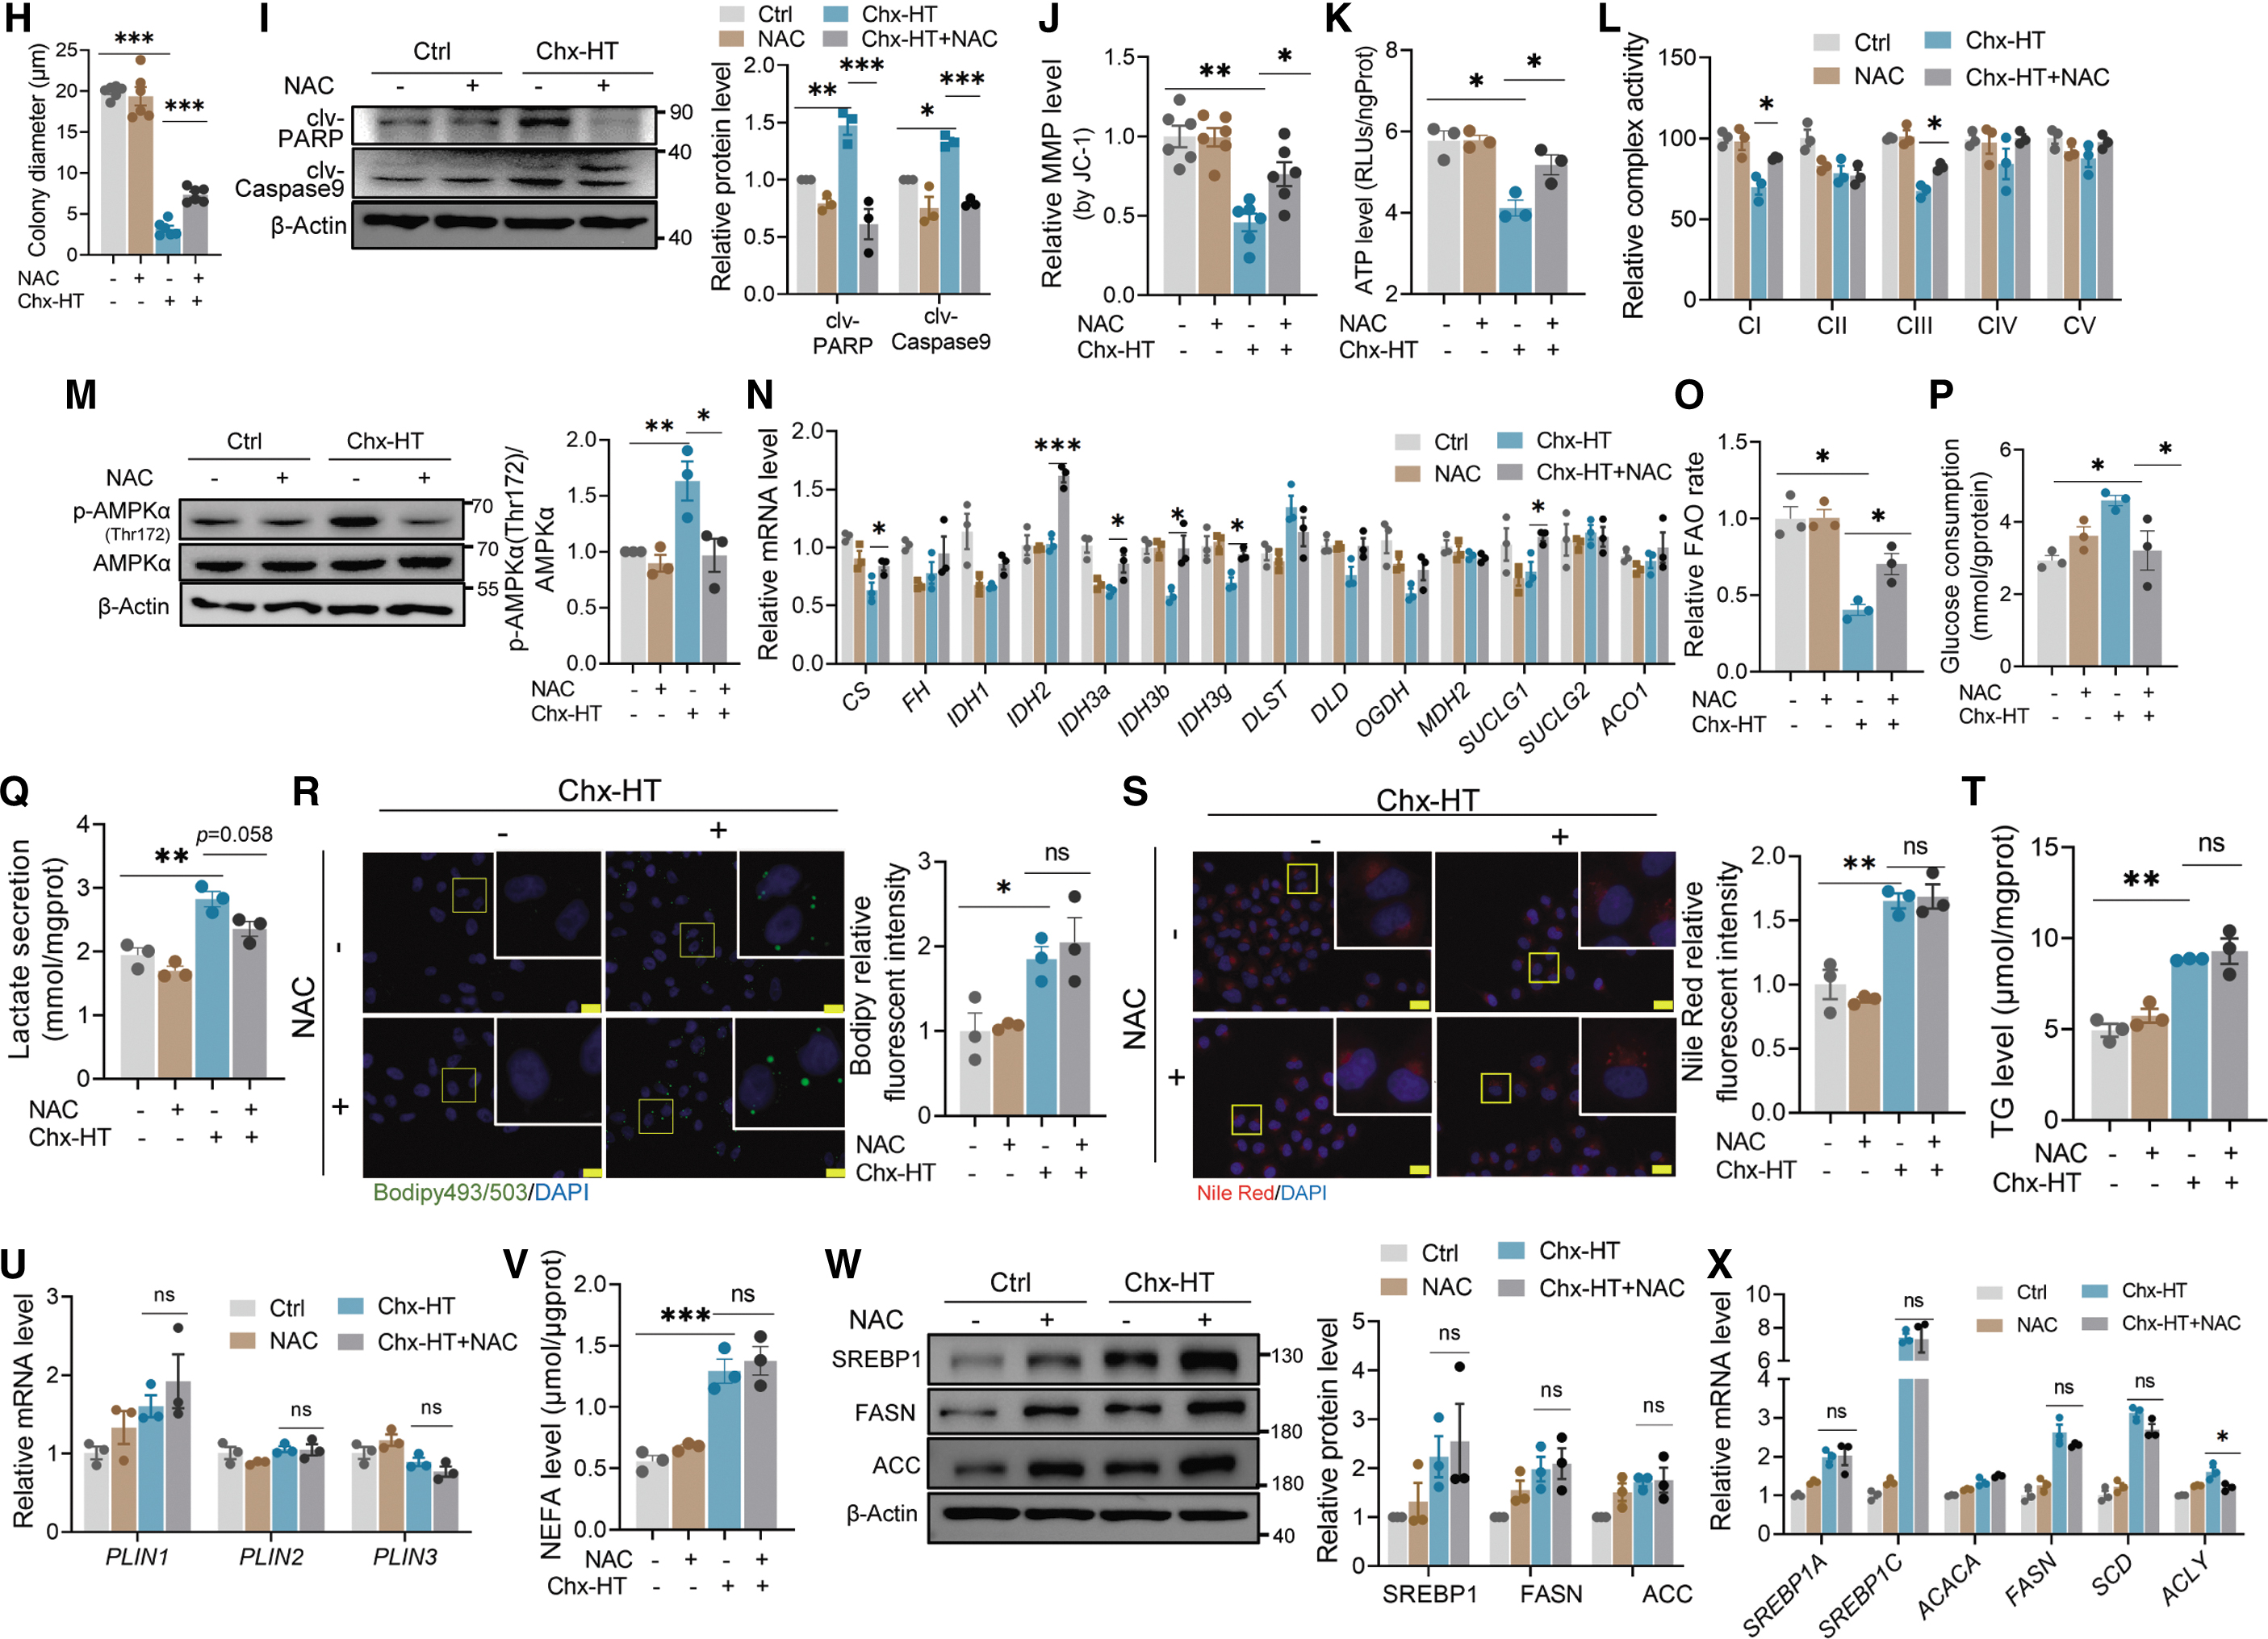
Next, we sought to determine whether NAC treatment can also restore the mitochondrial function impaired by Chx-HT. Our data showed that NAC treatment partially restored the levels of MMP and ATP and activities of ETC complexes I and III (Fig. 6J–L). Accordingly, NAC treatment inhibited the Chx-HT-induced activation of AMP-activated protein kinase (AMPK) (Fig. 6M). Besides, NAC treatment was able to increase the TCA cycle and FAO in Chx-HT-treated SKOV3 cells (Fig. 6N, O). Overall, these data suggest that NAC can restore Chx-HT-induced mitochondrial function by scavenging ROS.
Next, we investigated the impact of NAC treatment on remodeling glucose and lipid metabolism. NAC treatment was effective in reducing glucose uptake and lactate secretion (Fig. 6P, Q), but unable to decrease the LD accumulation and FAS. NAC treatment did not exert decreased effects on LD accumulation promoted by Chx-HT (Fig. 6R–U). Also, NAC did not alter the de novo lipogenesis upregulated by Chx-HT (Fig. 6V–Y). We further confirmed that the increase in ROS is an upstream event in glucose metabolism remodeling and mitochondrial respiration impairment. We measured ROS level, lactate secretion, and ETC complex activity during the initial stages of Chx-HT treatment.
The results showed that an increase in ROS was observed as early as 1 h (Supplementary Fig. S3C), whereas increased lactate secretion and impaired ETC complex activity were only observed at the 6-h mark (Supplementary Fig. S3D, E), further suggesting that ROS elevation contributes to glucose metabolism remodeling and mitochondrial respiration impairment.
These data indicate that ROS are involved in the effects of Chx-HT on proliferation, apoptosis, glycolysis, TCA cycle, FAO, and mitochondrial respiration, but not on lipid synthesis and LD accumulation in OC cells.
Chx-HT induces autophagosome accumulation by promoting autophagic initiation and blocking the late-stage autophagic degradation in OC cells
A previous study reported that cancer cells under drug therapies alter metabolism to assure survival through autophagic induction (Lue et al., 2017). The unchanged effects of ROS elevation on the promotion of LD accumulation and FAS led us to question whether autophagy is involved in these metabolic alterations. To address this, we investigated the effect of Chx-HT on autophagy in OC cells. In SKOV3 and OVCAR3 cells transfected with GFP-LC3B, Chx-HT increased the numbers of fluorescent puncta per cell in a dose-dependent manner (Fig. 7A). An enhanced LC3 conversion from LC3-I to LC3-II, as well as the accumulation of SQSTM1/p62 protein (Fig. 7B), a selective autophagy receptor degraded along with ubiquitinated substrates during autolysosome degradation (Katsuragi et al., 2015; Wang et al., 2020), was further revealed by immunoblotting assays (Fig. 7B).
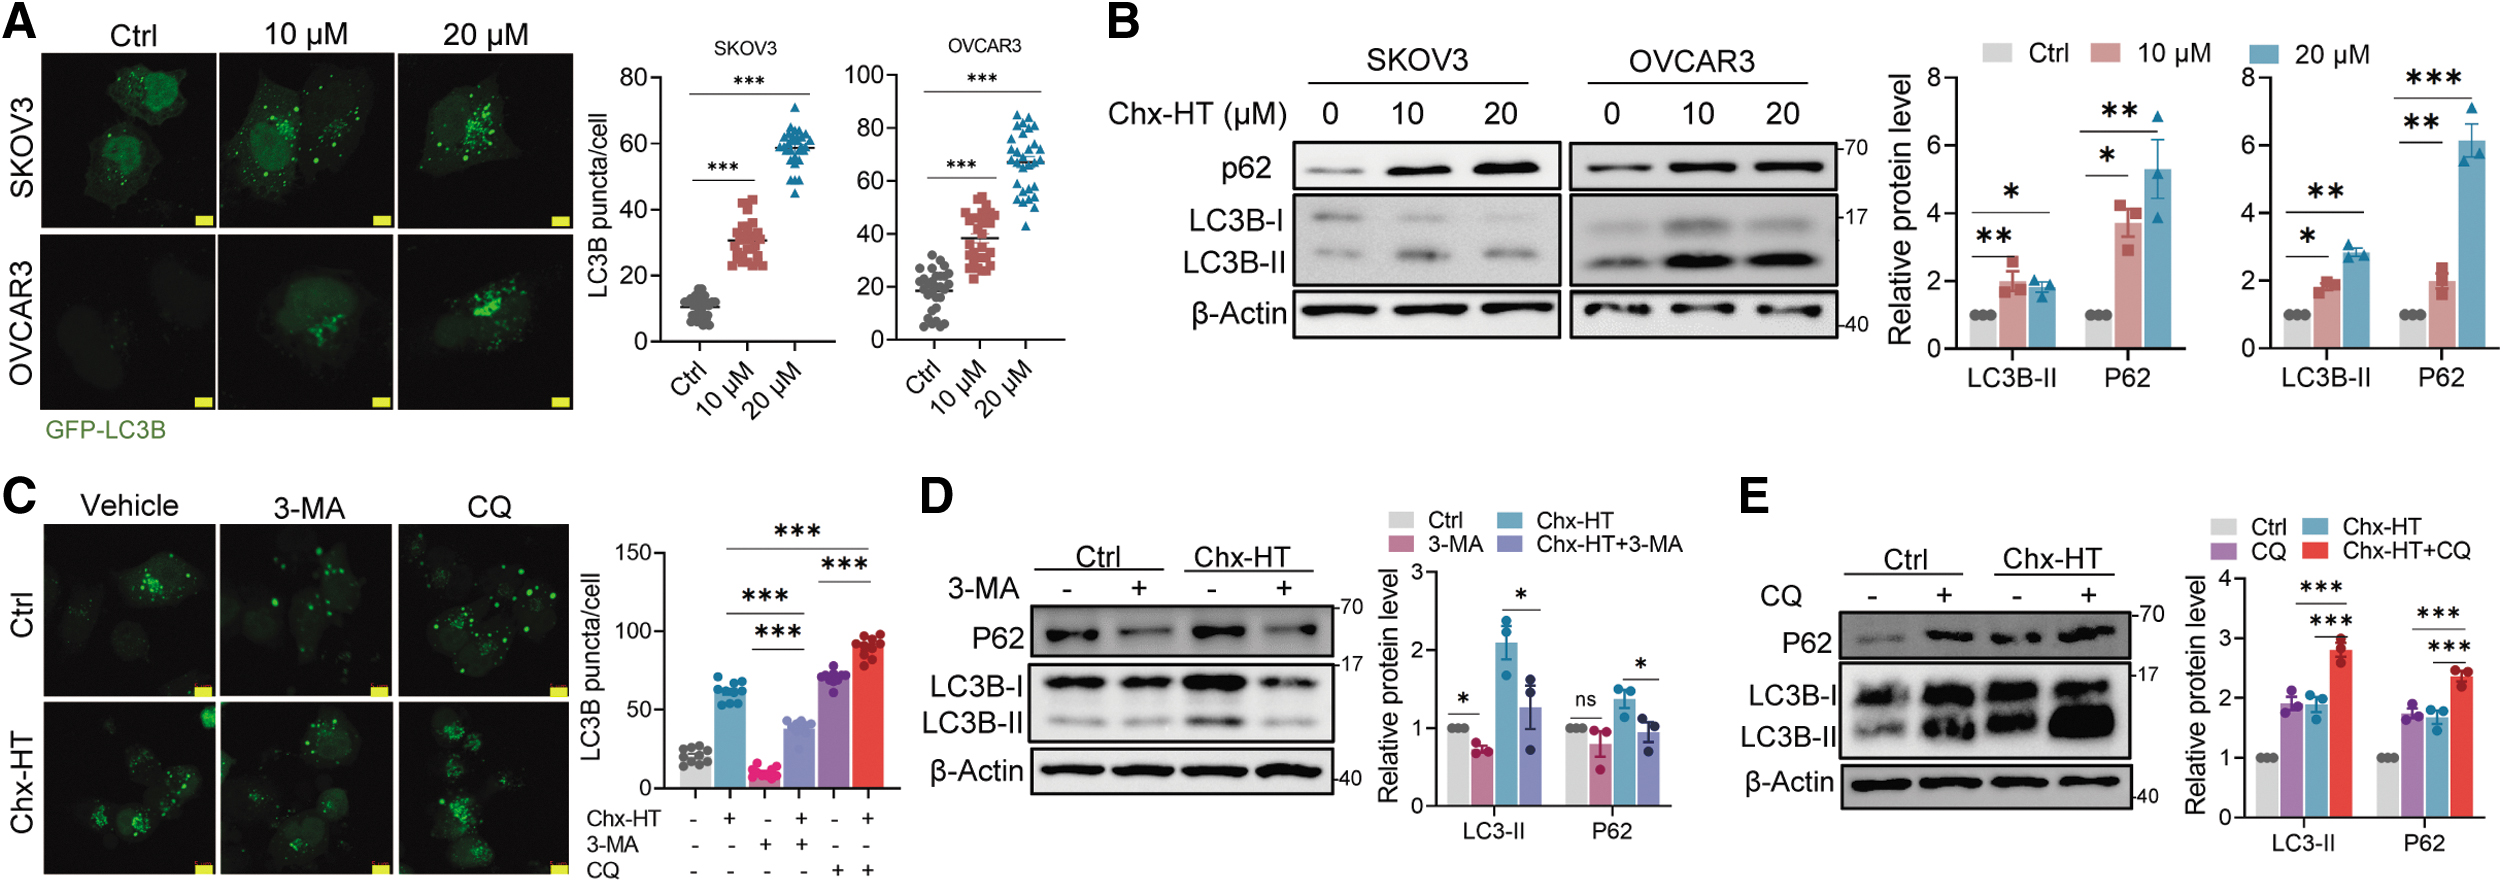
These results suggest that Chx-HT results in autophagosome accumulation, for which the probable explanation is the activation of autophagy or the inhibition of autophagosome degradation.
We then proceeded to investigate the cause of autophagosome accumulation. Combined treatment with Chx-HT and 3-methyladenine (3-MA), a commonly used agent blocking the upstream steps of autophagy, significantly decreased GFP-LC3B puncta accumulation, demonstrating that Chx-HT is an autophagy inducer (Fig. 7C). While combined treatment with Chx-HT and chloroquine (CQ), a commonly used agent blocking the downstream steps of autophagy, significantly induced more GFP-LC3B puncta accumulation than Chx-HT or CQ treatment alone (Fig. 7C), indicating an inhibition of late-stage autophagy. Similar results were obtained from LC3B-II and p62 protein levels (Fig. 7D, E). These data suggest that both autophagy initiation and late-stage blockade contribute to autophagosome accumulations upon Chx-HT.
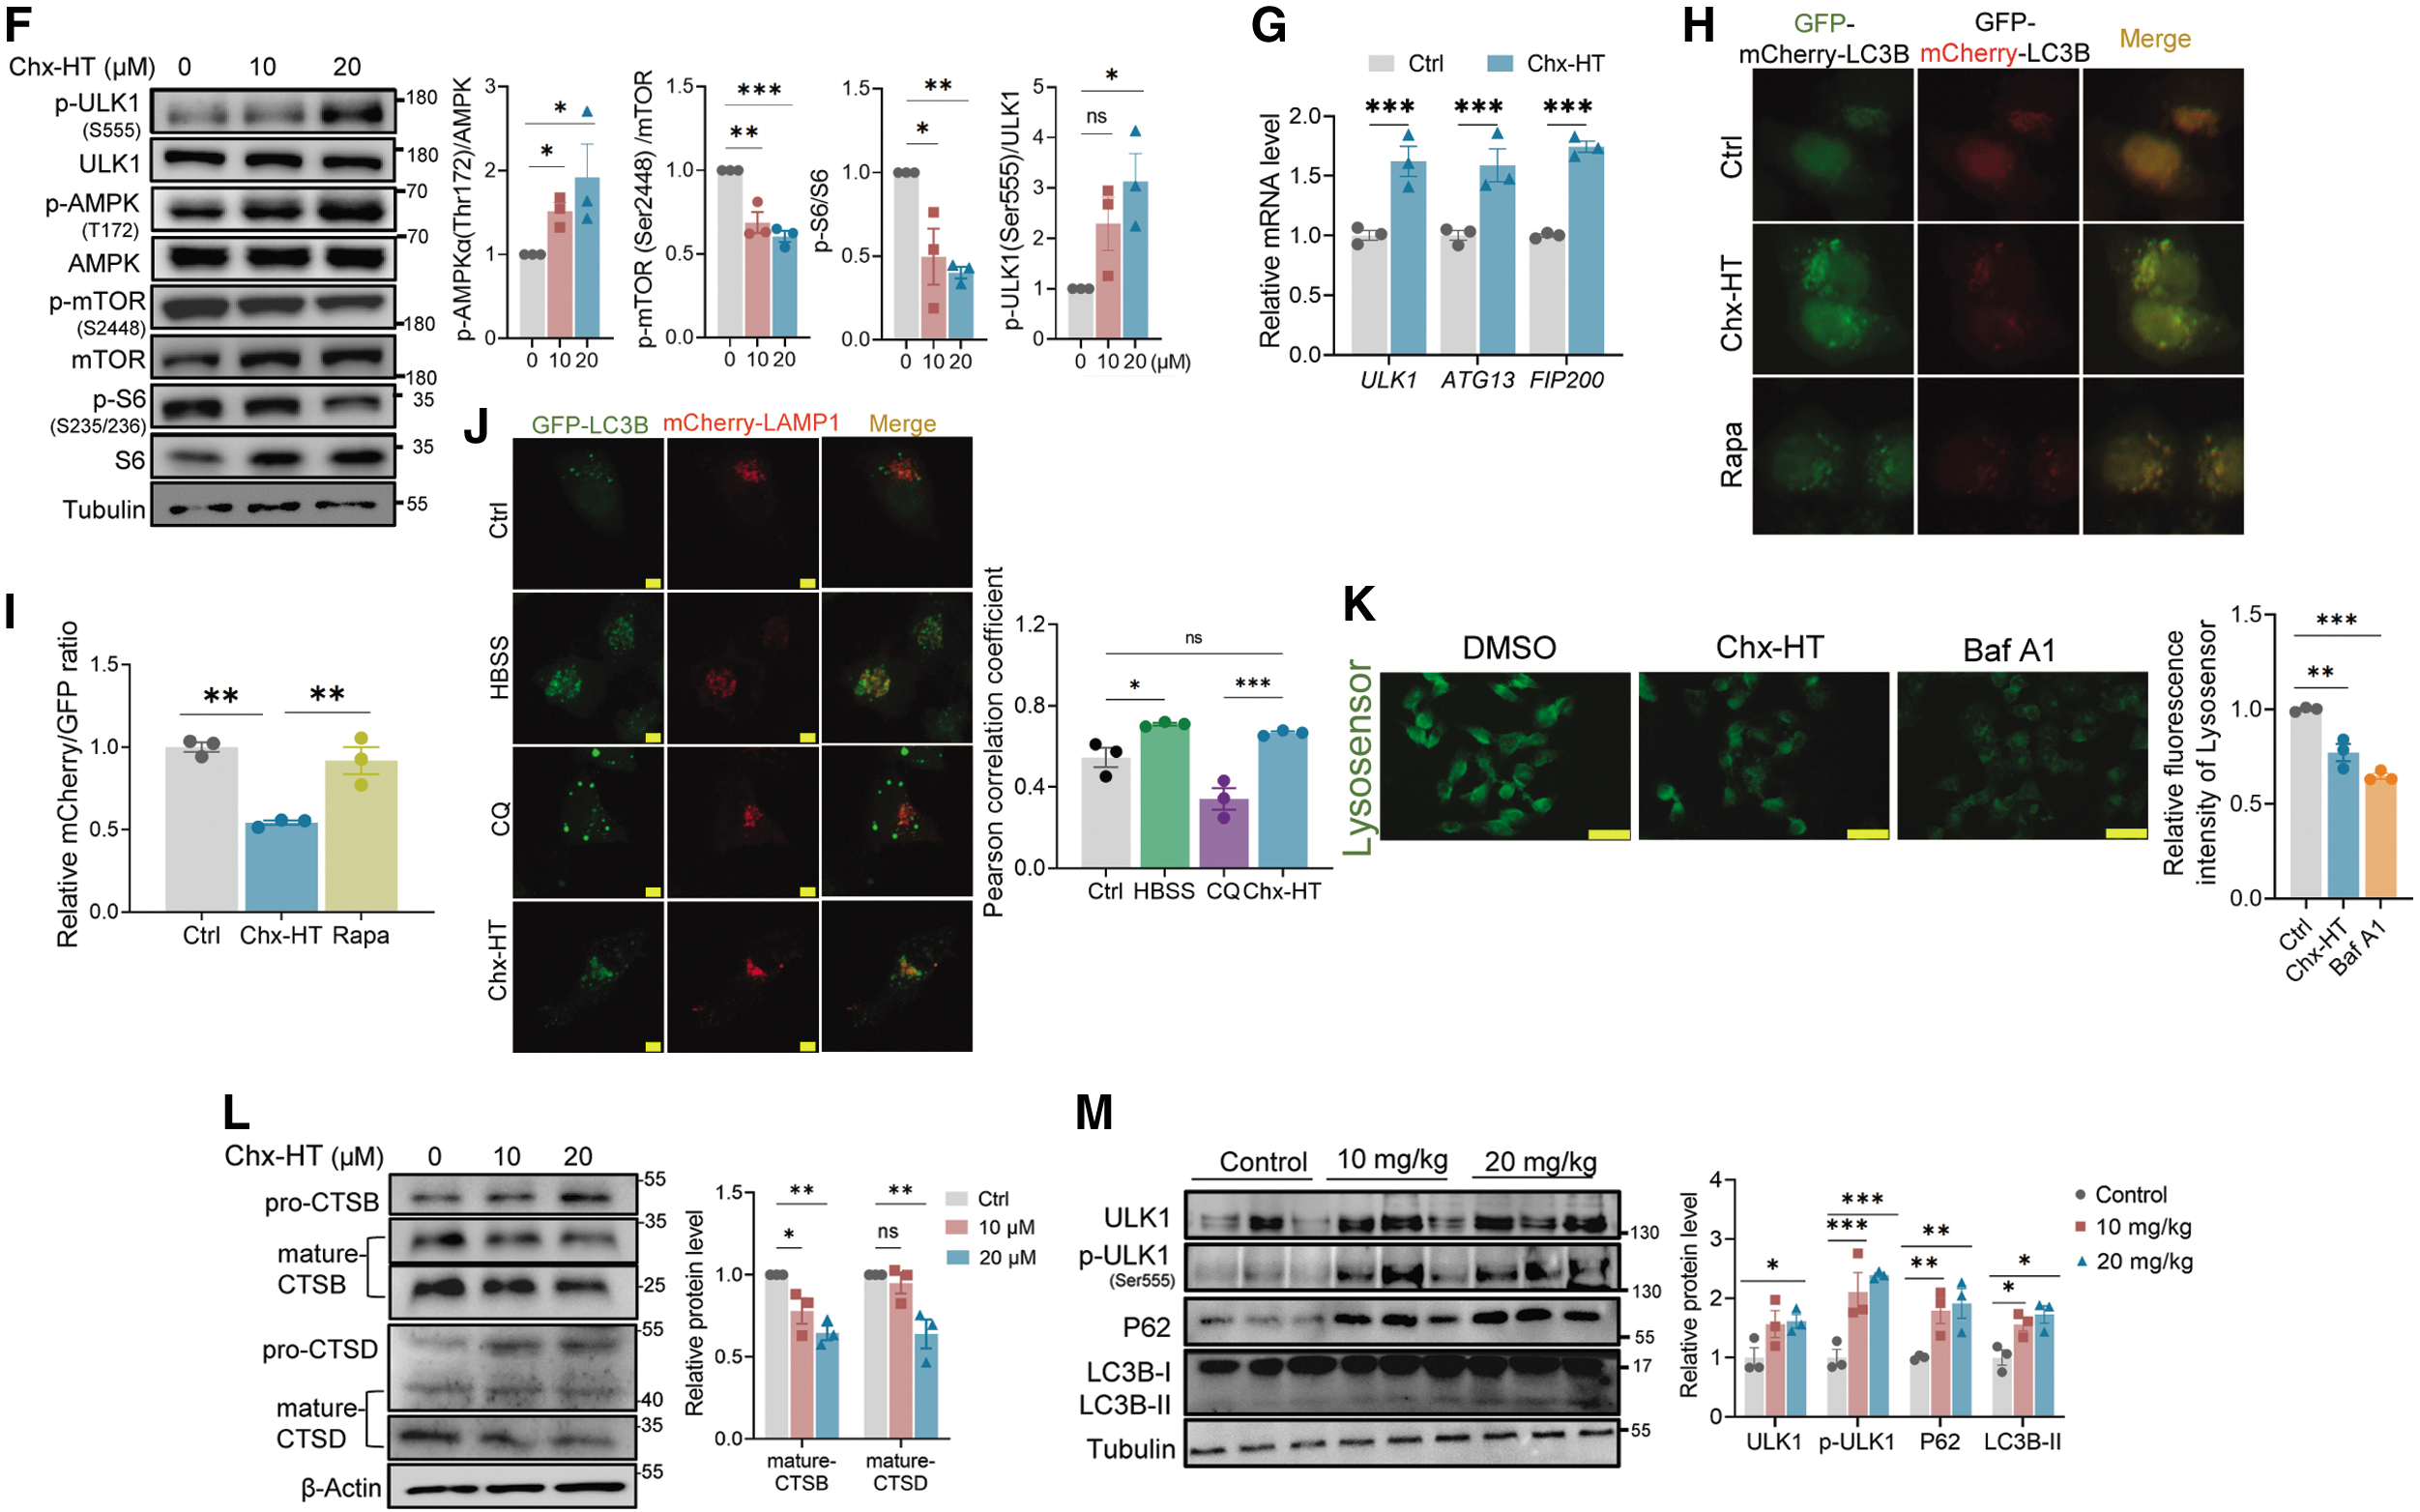
We first sought to confirm the mechanism by which autophagy is initiated. Autophagy is usually initiated by a conserved kinase complex containing the yeast serine-threonine kinase ATG1 (mammals have two homologues, ULK1 and ULK2) and its associated subunits, ATG13 and ATG17 (mammalian counterparts are reported as mATG13 and FIP200) (Kim et al., 2011). We observed a significant ULK1 phosphorylation on site ser555 (Fig. 7F), which is considered to initiate autophagy (Egan et al., 2011). We also observed an increased mRNA level of ATG13 and FIP200 on Chx-HT-treated SKOV3 cells (Fig. 7G). Moreover, AMPK has been reported to stimulate autophagy by activating ULK1 on ser555 (Lindqvist et al., 2018), and our results also indicated a significant AMPK activation upon Chx-HT treatment (Fig. 7F). Besides, ULK1 is also activated by the suppression of mTORC1 (Lindqvist et al., 2018), and we observed a decreased phosphorylation of mTORC1 and its substrate S6K (p70S6 kinase) (Fig. 7F) upon Chx-HT treatment. These data suggest that Chx-HT initiates autophagy in OC cells through the p-AMPK/p-mTOR/p-ULK1 pathway.
We next investigated the mechanism by which Chx-HT inhibits the downstream events of autophagic flux. We used a tandem fluorescence mCherry-GFP-LC3 plasmid to monitor autophagic flux. As green fluorescent protein (GFP) is acid-sensitive and thereby can be quenched in a low lysosomal pH, more red puncta are exhibited by mCherry (acid-insensitive) during a complete autophagic flux. Conversely, it exhibits a decreased mCherry/GFP ratio when the fusion between autophagosomes and lysosomes is blocked or when the lysosomal function is impaired. Upon Chx-HT treatment, we observed enhanced GFP fluorescence and a reduced mCherry/GFP ratio compared with control or rapamycin treatment (Fig. 7H, I). These data showed that Chx-HT blocks the late-stage autophagic flux in OC cells. Will the fusion blockade could be a probable explanation for the impaired autophagy flux induced by Chx-HT?
We assessed the fusion through the colocalization of GFP-LC3B and lysosomal-associated membrane protein 1 (LAMP1), a marker for lysosomal membranes. As shown in Figure 7J and Supplementary Figure S3F, we found that CQ exhibited a significant separation of GFP-LC3B puncta (green) and mCherry-LAMP1 puncta (red) with a low Pearson correlation coefficient (PCC) of 0.341, suggesting an inhibited fusion. In contrast, nutrient deprivation of Hank's balanced salt solution (HBSS) treatment induced a conspicuous overlap with a high PCC of 0.676, indicating a normal fusion. An increased colocalization upon Chx-HT treatment (PCC = 0.666) is similar to the effect of HBSS treatment, indicating that Chx-HT does not block the fusion between autophagosomes and lysosomes. Next, we assumed that the autophagic flux blockage may be due to lysosomal dysfunction.
Because the low lysosomal pH is required for maintaining lysosomal function, we first used Lysosensor DND-189, which is a pH-dependent probe and exhibits increased fluorescence upon acidification, to evaluate the lysosomal pH. As shown in Figure 7K, Chx-HT caused a decreased fluorescence similar to Baf A1 (a vacuolar H+ATPase inhibitor), indicating that Chx-HT-inhibited lysosomal acidification contributes to autophagic flux impairment.
Next, we investigated the effect of Chx-HT on the expression and activation of lysosomal cathepsins. As the major group of lysosomal proteases, cathepsins execute degradation and recycle cellular contents to maintain cellular homeostasis and differentiation, and thereby are essential for the degradation of autophagy (Jung et al., 2015). They are synthesized as immature (inactive) procathepsins and then are proteolytically activated to mature forms under acidic conditions. We performed Western blotting to examine the maturation process of cathepsin D (CTSD) and cathepsin B (CTSB) using antibodies recognizing their pro- and mat-forms. In addition, the results showed that Chx-HT significantly impaired the maturation of CTSB and CTSD (Fig. 7L). Previous studies reported that lysosomal dysfunction raises an accumulation of polyubiquitinated proteins (Lao et al., 2014; Wang et al., 2020).
Our results showed that Chx-HT significantly increased the levels of ubiquitinated proteins (Supplementary Fig. S3G). Taken together, these results indicate that Chx-HT blocks autophagic flux by impairing lysosomal cathepsin activity.
Next, to evaluate whether Chx-HT inhibits autophagic flux on SKOV3 xenograft tumors, we performed Western blot to detect the protein level of ULK, p-ULK1, LC3B-II, and P62. Significantly increased levels of ULK1, p-ULK1, and LC3B-II were observed in Chx-HT-treated xenograft tumors, indicating an induction of autophagic initiation (Fig. 7M). Furthermore, the inhibition of autophagic late stage was also observed in Chx-HT-treated xenograft tumors, as demonstrated by increased protein levels of p62 in both 10 and 20 mg/kg groups (Fig. 7M). Collectively, these data indicate that Chx-HT activates autophagic initiation and blocks autophagic late stage in xenograft tumors.
We then examined whether ROS elevation contributes to the autophagosome accumulation. To confirm this, we treated SKOV3 cells overexpressing GFP-LC3B with NAC, and observed a significant decrease in LC3B puncta induced by Chx-HT (Supplementary Fig. S3H). In addition, Western blot analysis revealed that NAC treatment led to a significant decrease in LC3B-II and a slight decrease in p62 expression in Chx-HT-treated cells (Supplementary Fig. S3I). Next, we further confirmed that the increase in ROS is an upstream event in the inhibition of autophagic flux. We measured ROS level and autophagic flux inhibition during the initial stages of Chx-HT treatment. The results showed that an increase in ROS was observed as early as 1 h (Supplementary Fig. S3C), whereas accumulated autophagosomes was only observed at the 6-h mark (Supplementary Fig. S3J, K).
Together, these results suggest that ROS elevation contributes to the accumulation of autophagosomes, and that NAC treatment can reduce this accumulation.
Chx-HT's effects on LD accumulation, de novo FAS, and glycolysis rely on autophagic activation, while autophagic blockade underlies its effects on proliferation and apoptosis
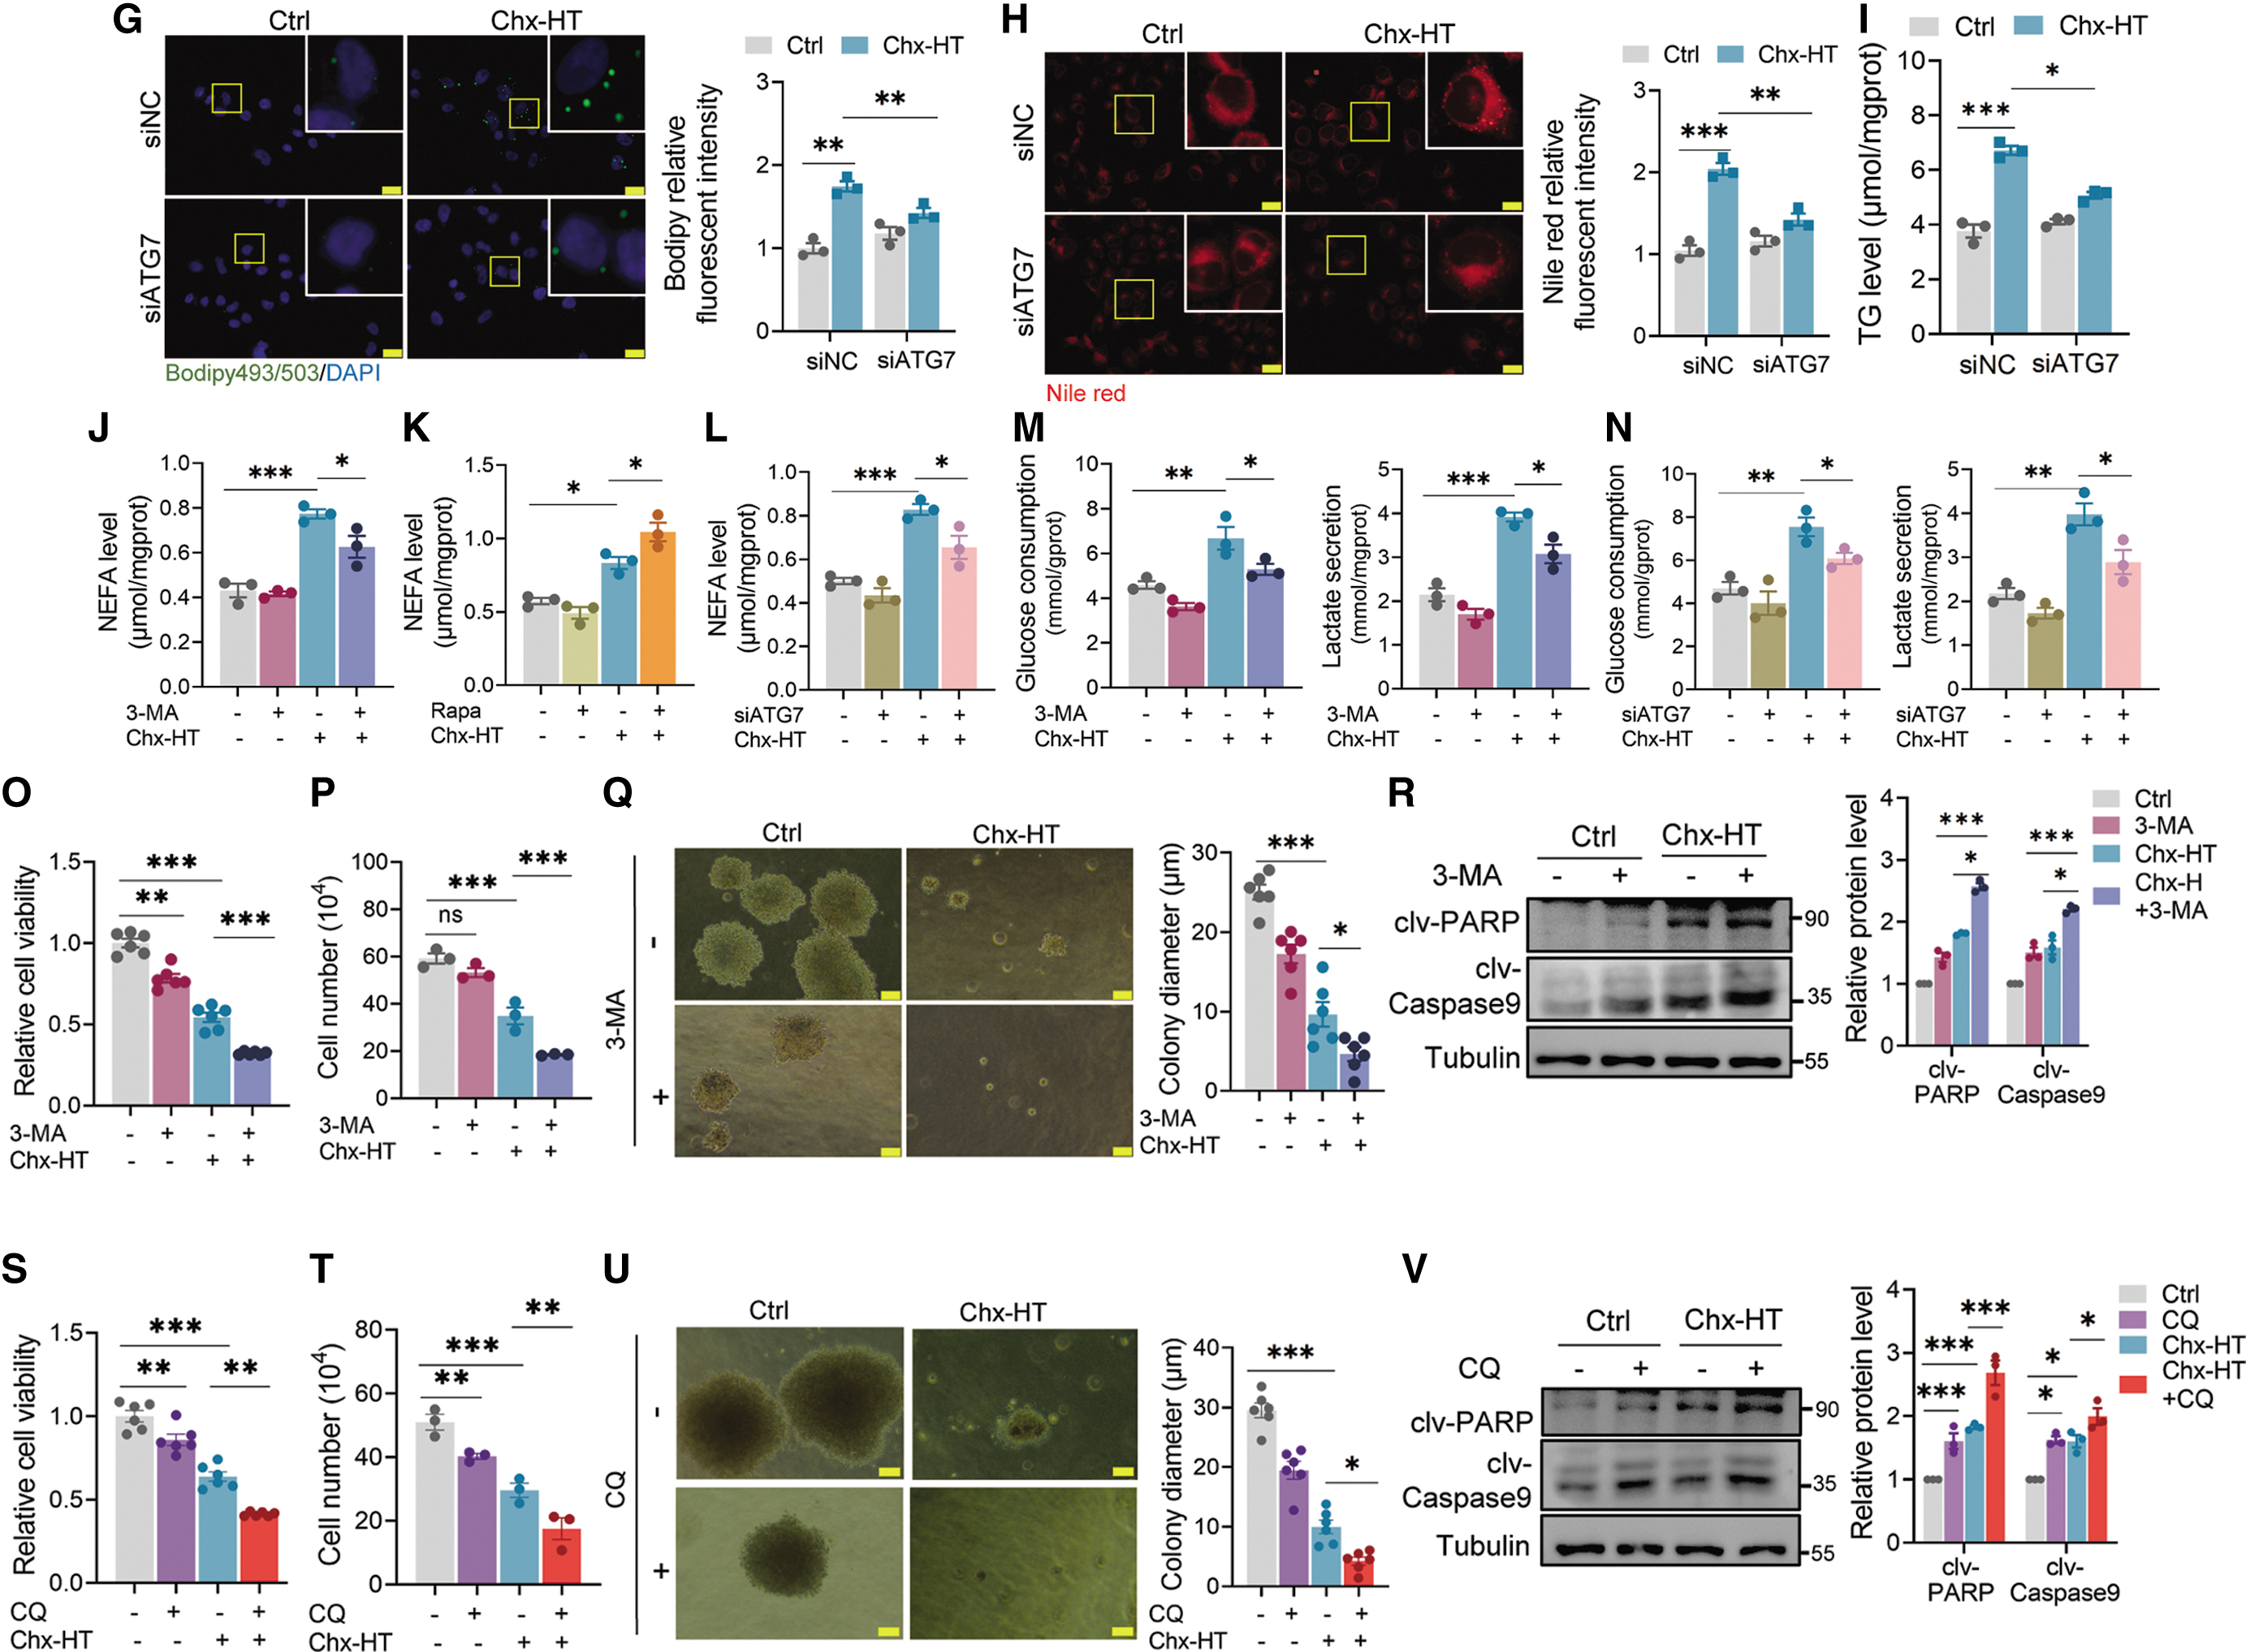
Since Chx-HT induces autophagic initiation in OC cells, we next investigate whether it contributes to the Chx-HT-induced LD accumulation. To explore this, we examined the effects of 3-MA (an autophagy inhibitor) and rapamycin (an mammalian target of rapamycin [mTOR] inhibitor that promotes autophagy) on LD numbers and TG levels. Remarkably, treatment with 3-MA significantly reduced LD and TG levels in Chx-HT-treated SKOV3 cells (Fig. 8A–C). Conversely, rapamycin further increased LD and TG levels (Fig. 8D–F). These findings underscore the importance of autophagy in sustaining LD levels and highlight the association between autophagy and Chx-HT-induced LD accumulation. To further confirm this, we also knocked down ATG7 in SKOV3 cells using siRNA transfection, and found that Chx-HT increased LD numbers and TG level in siNC cells, but not in siATG7 ones (Fig. 8G–I), manifesting that autophagy is required to maintain LD elevation upon Chx-HT treatment.
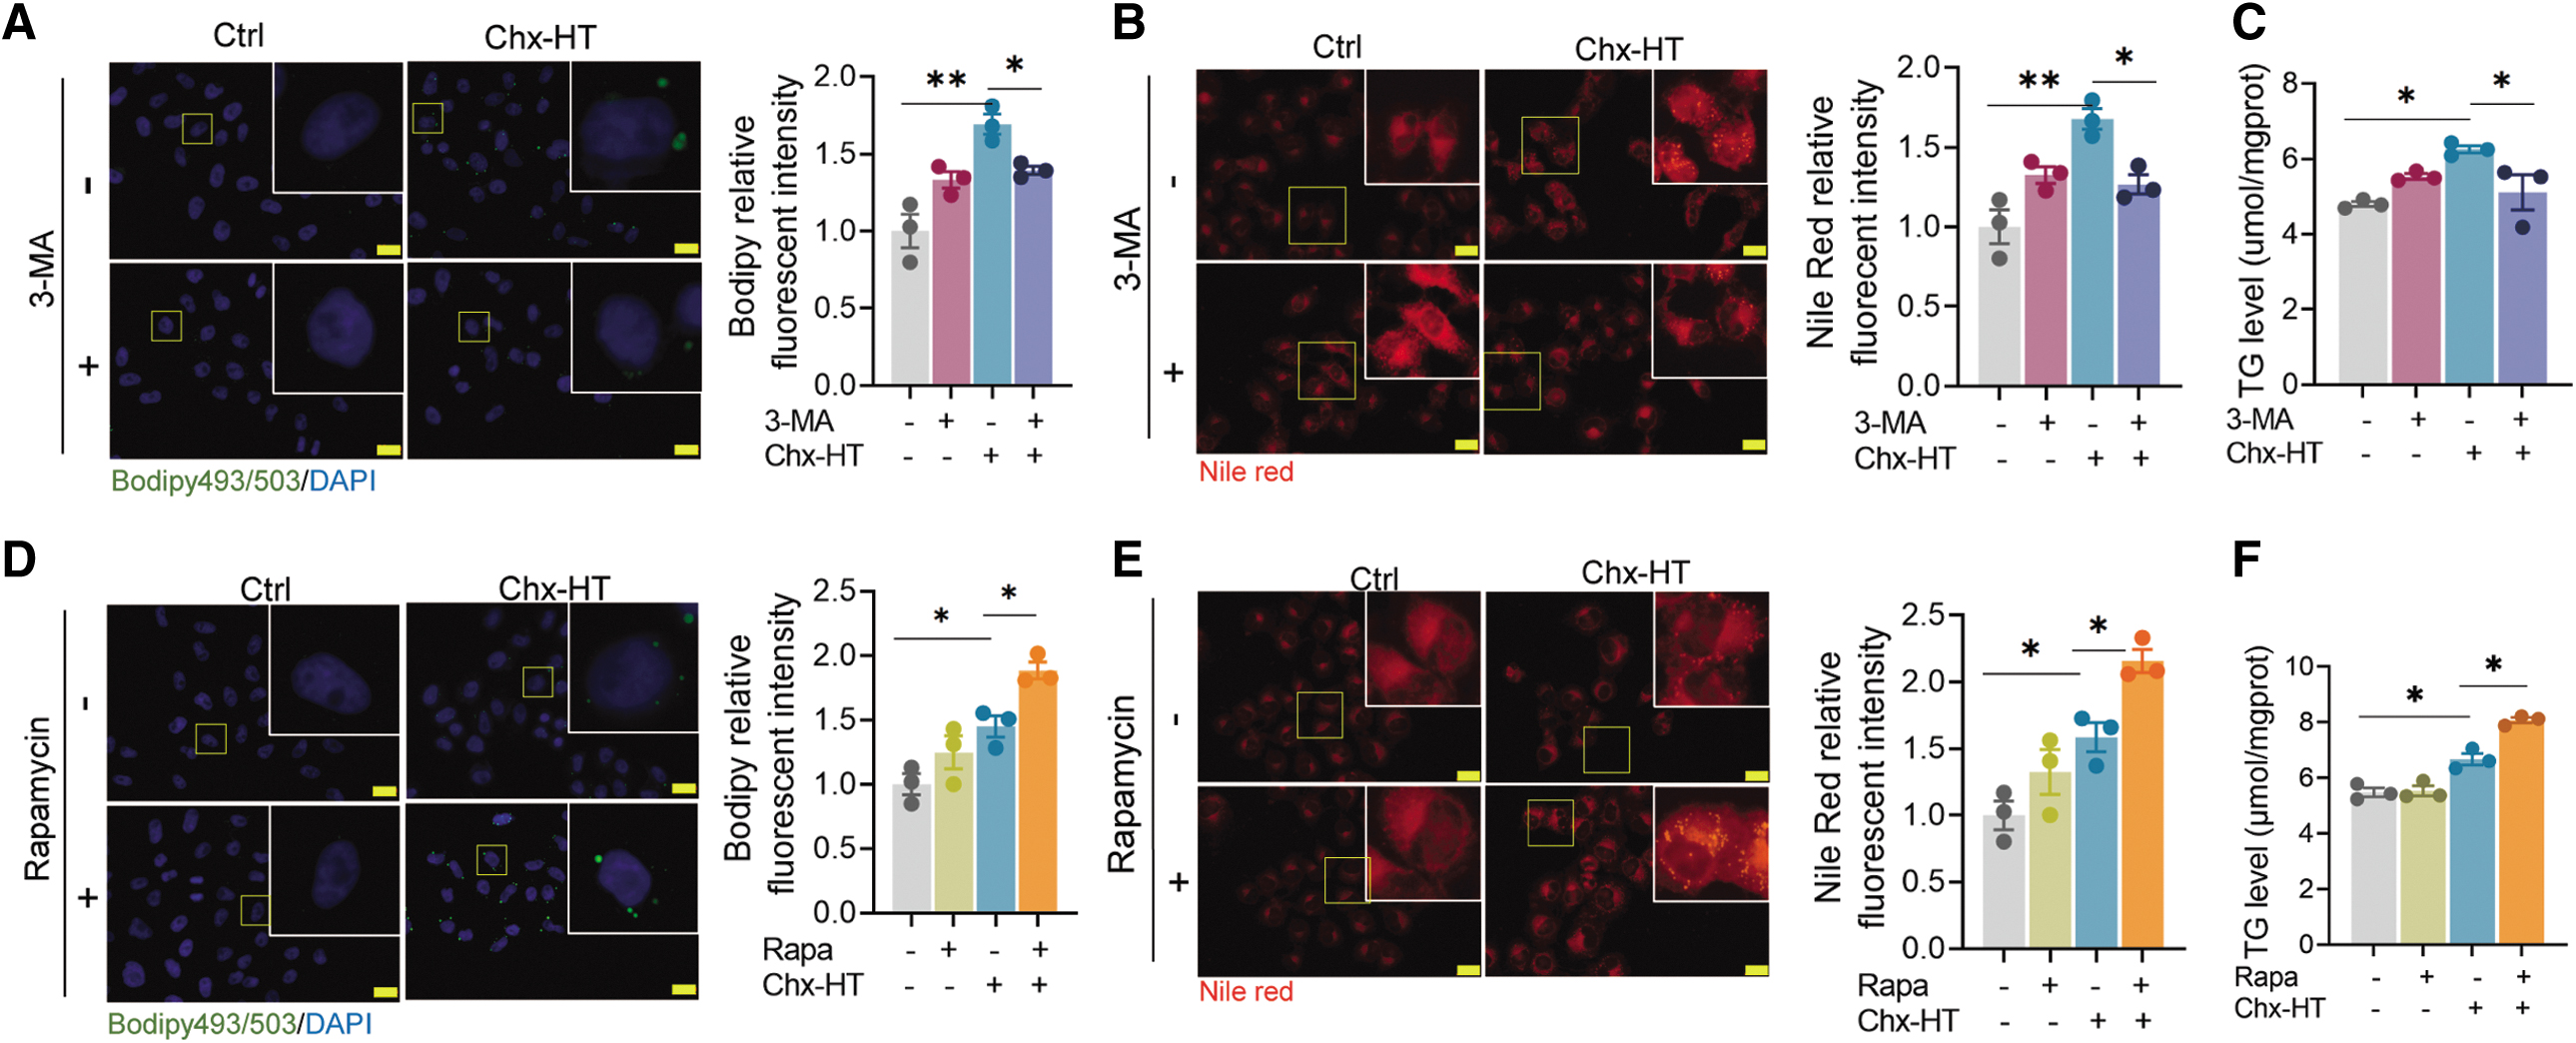
Collectively, these results, combined with the impairment of lysosomal cathepsin activities, support a model, in which increased LDs generated by autophagy is unable to be degraded by impaired lysosomes, leading to a robust LD accumulation in Chx-HT-treated cells.
Next is to examine whether autophagy initiation contributed to FAS. The results showed that 3-MA treatment significantly inhibited the increased FAS in Chx-HT-treated SKOV3 cells (Fig. 8J and Supplementary Fig. S4A). In contrast, rapamycin promoted the FAS (Fig. 8K and Supplementary Fig. S4B). Consistent with the effect of 3-MA, we found that Chx-HT significantly increased FAS in siNC-transfected cells, and these increases were abolished in siATG7-transfected cells (Fig. 8L and Supplementary Fig. S4C). However, inhibiting autophagy did not lead to a restoration of FAO rate and TCA cycle in Chx-HT-treated SKOV3 cells (Supplementary Fig. S4E, F).
Previous studies reported that autophagy maintains glycolysis for oncogenesis (Karvela et al., 2016; Lock et al., 2011). We therefore hypothesized that the increased glycolysis observed in Chx-HT-treated OC cells is a result of the autophagic response under therapeutic stress. To test this hypothesis, we treated SKOV3 cells with 3-MA and observed that it abolished glycolysis in Chx-HT-treated SKOV3 cells (Fig. 8M and Supplementary Fig. S4G), indicating that autophagy is responsible for sustaining glycolysis. This was further confirmed by using siATG7 transfection, where Chx-HT-induced elevation of glycolysis was observed in siNC cells but not in siATG7 ones (Fig. 8N and Supplementary Fig. S4H).
The autophagy initiation by Chx-HT treatment suggests that it may function as a prosurvival pathway to mitigate metabolic and therapeutic stress. To test this hypothesis, we treated SKOV3 cells with 3-MA or CQ to monitor cell proliferation. The results demonstrated that inhibiting autophagy using 3-MA reduced Chx-HT-treated SKOV3 cell proliferation, as evidenced by decreased cell viability, colony formation, and increased apoptosis, compared with Chx-HT treatment alone (Fig. 8O–R and Supplementary Fig. S4I). Similarly, further inhibition of the late-stage autophagic flux using CQ resulted in similar effects (Fig. 8S–V and Supplementary Fig. S4J). These data indicate that autophagy activation is a prosurvival mechanism in response to Chx-HT treatment, and that further inhibition of autophagy significantly enhances the proliferation inhibition of SKOV3 cells.
Collectively, these data suggest that Chx-HT activates autophagy and enhances glucose consumption and glycolysis, but also leads to lipid biosynthesis. Further inhibition of proliferation is observed by combined using of Chx-HT and autophagic inhibitors, such as 3-MA or CQ, or the glycolytic inhibitor 2-DG.
Discussion
OC is currently considered a refractory solid tumor. Despite the initial treatment, many advanced OC patients eventually become refractory or relapse; therefore, identification and development of novel therapeutics are urgently needed. A previous study showed that HT has antiproliferative and apoptotic effects on human OC cell lines, but high doses are required for efficacy (Oktay and Tuğrul, 2016). We previously demonstrated that HT inhibits proliferation of prostate cancer cell and impairs mitochondria with reduced MMP, ATP levels, and OXPHOS and increased ROS levels (Luo et al., 2013). In this study, we designed and synthesized Chx-HT. We chose to add an adamantane moiety and cyclohexane substitution of the α-carbon of the HT side chain to cause mitochondrial dysfunction.
In vitro, Chx-HT inhibits proliferation and promotes apoptosis of OC cells through inducing oxidative stress and blocking late-stage autophagic degradation, with remodeled glucose and lipid metabolism, such as enhancing glycolysis, reducing TCA cycle and FAO, and upregulating FAS and LD accumulation, and impaired mitochondrial respiration. In vivo, Chx-HT administration displays a remarkable antitumor effect in the xenograft mouse model without toxicity and side effects.
Treatment with Chx-HT leads to a significant impairment of mitochondrial function, as evidenced by the reduction in the downregulation of enzymes participating in key metabolic processes, such as the TCA cycle and FAO. This impairment is further manifested by a reduction in NADH, and an imbalance in the NAD+/NADH ratio. Interestingly, we observed a slight decrease in total NAD in SKOV3 cells, but no decrease was observed in tumor tissues. Chx-HT treatment does not change the mRNA level of NAMPT, the rate-limiting enzymes involved in the synthesis of NAD+ in both xenograft tumors and in SKOV3 cells. Therefore, Chx-HT treatment resulted in less NAD+ being reduced to NADH, but it did not affect the generation of NAD+ or the total NAD levels.
In addition, Chx-HT treatment leads to decreased MMP and mitochondrial respiration, which is associated with reduced ETC complex activities, resulting in a decreased production of ATP. Furthermore, Chx-HT treatment induces increased ROS, mediating effects on proliferation, apoptosis, glycolysis, TCA, FAO, and mitochondrial respiration. This aligns with the observed sequence, in which the ROS increase acts as an upstream event in the remodeling of glucose metabolism and the impairment of mitochondrial respiration. Interestingly, the Nrf2/Keap1 antioxidant defense system is also enhanced by Chx-HT. Chx-HT can directly induce an increase in ROS in cancer cells, similar to HT (Luo et al., 2013). The increased ROS damage mitochondrial functions, affecting FAO, TCA, and respiration, which further amplifies the release of mitochondrial ROS (mtROS) (Pitkanen and Robinson, 1996).
This increased mtROS exacerbate mitochondrial dysfunction, establishing a vicious cycle. In addition, mtROS regulate the signaling outside mitochondria, in the nucleus, promoting the transcriptional activity of Nrf2 (Indo et al., 2023). Although the Nrf2 antioxidant system reacts to the ROS elevation, its aim to neutralize excessive ROS is not effectively achieved. This is due to the ongoing vicious cycle of mitochondrial dysfunction and increased mtROS induced by Chx-HT. As a result, a simultaneous increase in mtROS and the Nrf2 antioxidant system was observed upon Chx-HT treatment. Remarkably, the exogenous antioxidant NAC exhibited a significant reduction in mtROS levels, thereby partially restoring the inhibited proliferation and apoptosis induced by Chx-HT. Additionally, NAC resulted in an augmentation of TCA cycle, FAO, and mitochondrial respiration downregulated by Chx-HT.
Treatment with Chx-HT triggers the upstream event of autophagy while suppressing the late-stage event in the autophagic flux. The late stage of autophagic flux involves lysosomal degradation, and our results indicate that Chx-HT impairs lysosomal pH and the maturation of CTSB/CTSD, leading to a blockade in lysosomal degradation. This late-stage blockade in autophagic flux may compensatorily induce the activation of upstream event of autophagy. In addition, our results showed that Chx-HT treatment caused an impairment to mitochondrial respiratory function and a decrease in ATP levels. This energy deficiency would prompt cells to induce autophagy, which is deemed a prosurvival pathway for cancer cells exposed to therapies (Lue et al., 2017). Our results indeed indicate that Chx-HT induced activation of autophagy through the p-AMPK/p-mTOR/p-ULK1 pathway.
Similar results have been also reported that graphene-oxide-induced mitochondrial dysfunction activated autophagy but also hindered late-stage autophagic flux by impairing lysosomal degradation capacity (Xiaoli et al., 2021). Notably, accumulating evidences suggest that enhanced autophagy plays a significant role in drug resistance, prompting investigations targeting autophagy as a potential therapeutic strategy in OC (Zhao et al., 2015).
Inhibiting the late-stage autophagy flux can lead to the excessive accumulation of undegraded substances within autophagic vacuoles, ultimately resulting in accelerated cell death (Degtyarev et al., 2008). One of the extensively studied groups of lysosomal hydrolases responsible for degrading cargos within lysosomes under acidic conditions are the cathepsins, particularly CTSB/CTSD. These cathepsins have been implicated in cancer progression and metastasis. To investigate how Chx-HT inhibits autophagic flux, we examined the autophagosome-lysosome fusion and lysosomal function after Chx-HT treatment. Our results demonstrate that Chx-HT functions as a late-stage autophagy inhibitor by reducing lysosomal pH and cathepsin maturation without impairing the fusion of autophagosomes and lysosomes. This finding is consistent with many studies indicating that inhibition of late-stage autophagy has antitumor effects (Wang et al., 2020; Zhao et al., 2015). In addition, our results suggest that Chx-HT-induced ROS play a role in blocking autophagic flux.
Further evidence is needed to confirm whether it is caused by mtROS. Nevertheless, existing research indicates the involvement of mtROS in the blockade of autophagic flux (Hu et al., 2016; Yuan et al., 2019).
Therapy-induced autophagy strategically exploits core biological processes to ensure tumor cell fitness and survival (Lue et al., 2017). A previous study indicated that in Ras-mutated cells, autophagy promotes glycolysis during oncogenic transformation (Lock et al., 2011). Conversely, the knockdown of ATG7 in chronic myeloid leukemia cells resulted in decreased glycolysis (Karvela et al., 2016). These studies highlight the significance of autophagy in regulating glycolysis. Chx-HT treatment elicits a strong autophagic response, which in turn leads to elevated glucose consumption and enhanced glycolysis. In addition, this response contributes to an associated increase in lipogenesis, which represents a core mechanism of drug resistance in cancer cells (Xu et al., 2021).
Moreover, heightened glycolysis and inhibited TCA cycle induced by Chx-HT may shunt more metabolic intermediates toward the lipid synthesis pathway. Prior studies have elucidated a significant correlation between glycolysis regulators and lipid metabolism. Notably, PKM2 has been shown to positively regulate SREBP1 protein levels, thereby contributing to the modulation of lipid metabolism (Kumar et al., 2020; Zhao et al., 2018). Therefore, the activation of autophagy presents a potential therapeutic window for combined treatments to further inhibit OC. By combining autophagic or glycolytic inhibitors with Chx-HT therapies, additive effects on the inhibition of proliferation can be achieved. Hence, the inhibition of autophagy holds promising clinical significance in reducing chemotherapeutic resistance, thereby minimizing tumor recurrence and relapse (Ojha et al., 2014).
In summary, we disclosed that Chx-HT shows a potent antitumor effect on OC cells with a novel mechanism. Chx-HT effectively suppresses the growth of OC cells by remodeling glucose and lipid metabolism and impairing mitochondrial respiration. In this process, ROS mediate alterations in glycolysis, TCA cycle, FAO, and mitochondrial respiration, while autophagy mediates changes in lipogenesis and LD formation. Our present data highlight Chx-HT as a novel HT derivative for OC therapies.
Materials and Methods
Synthesis of Chx-HT
All commercially available chemicals were purchased from Alfa Aesar. Melting points were determined on a Büchi apparatus and were uncorrected.
1
H NMR,
13
C NMR, and 2D spectra were recorded on a Bruker Avance III 600, 400 spectrometer (Bruker GmbH, Germany) using dimethyl sulfoxide (DMSO-d6
), methanol (CD3OD), and chloroform (CDCl3) as deuterated solvents and were referenced to tetramethylsilane (δ scale). The signals of
1
H and
13
C spectra were unambiguously assigned by using 2D NMR techniques:
1
H
1
H COSY, HMQC, and HMBC.
1
H NMR and
13
C NMR are available online in the Supplementary Data.
1
H NMR and
13
C NMR of
Analytical thin-layer chromatography was carried out on precoated (0.25 mm) Merck KgaA (Darmstadt, Germany) silica gel F-254 plates. HR-MS were obtained on an LTQ-Orbitrap Discovery Mass Spectrometer (Thermo Scientific, Brehmen, Germany).
Synthesis of ethyl 2-(adamantan-2-ylidene)acetate (2 )
NaH (60% w/w in mineral oil) (540 mg, 13.3 mmol) was added portion wise to a mixture of 2-adamantanone (2 g, 13.3 mmol,
Synthesis of ethyl 2-(adamantan-2-yl)acetate (3 )
Ammonium formate (430 mg, 6.81 mmol) and 10% Pd/C (10 mg) were added to a solution of ester
Synthesis of adamantan-2-ylacetic acid (4 )
A mixture of ester
1,2-bis(benzyloxy)benzene (6 )
To a solution of catechol (110 mg, 1 mmol,
13 C NMR (151 MHz, CDCl3) δ (ppm): 149.13 (C-1, 2), 137.45 (C-1′, 1″), 128.49 (C-3′, 5′, 3″, 5″), 127.78 (C-4′, 4″), 127.34 (C-2′, 6′, 2″, 6″), 121.70 (C-4, 5), 115.37 (C-3, 6), 71.37 (1, 2-OCH2).
(((4-bromo-1,2-phenylene)bis(oxy))bis(methylene))dibenzene (7 )
A mixture of compound
1 H NMR (600 MHz, CDCl3) δ (ppm): 7.48 (d, J = 7.0 Hz, 2H, H-2′, 6′), 7.45 (d, J = 7.0 Hz, 2H, H-2″, 6″), 7.43–7.32 (m, 6H, H-3′, 5′, 3″, 5″, 4″, 4″), 7.11 (d, J = 2.3 Hz, 1H, H-3), 7.03 (dd, J = 8.6, 2.3 Hz, 1H, H-5), 6.82 (d, J = 8.6 Hz, 1H, H-6), 5.16 (s, 4H, 1, 2-OCH 2). 13 C NMR (151 MHz, CDCl3) δ (ppm): 149.81 (C-2), 148.13 (C-1), 136.83 (C-1′), 136.55 (C-1″), 128.50 (C-3′, 5′), 128.46 (C-3″, 5″), 127.95 (C-4′), 127.86 (C-4″), 127.29 (C-2′, 6′), 127.23 (C-2″, 6″), 124.14 (C-5), 118.15 (C-6), 116.49 (C-3), 113.40 (C-4), 71.46 (2-OCH2), 71.36 (1-OCH2).
1-(3,4-bis(benzyloxy)phenyl)cyclohexane-1-carbonitrile (9 )
To a solution of bromide
Without further purification, compound
Data for 1-(3,4-bis(benzyloxy)phenyl)cyclohexan-1-ol
Data for 1-(3,4-bis(benzyloxy)phenyl)cyclohexane-1-carbonitrile
13 C NMR (151 MHz, CDCl3) δ (ppm): 148.92 (C-3), 148.70 (C-4), 137.13 (C-1′), 137.05 (C-1″), 134.75 (C-1), 128.53 (C-3′, C-5′), 128.51 (C-3″, C-5″), 127.93 (C-4′), 127.87 (C-4″), 127.59 (C-2′, C-6′), 127.27 (C-2″, C-6″), 122.84 (CN), 118.59 (C-6), 114.90 (C-5), 113.55 (C-2), 71.75 (3-OCH2), 71.28 (4-OCH2), 43.73 (Ccyclohexyl), 37.44 (2 × Ccyclohexyl), 25.00 (Ccyclohexyl), 23.61 (2 × Ccyclohexyl).
1-(3,4-bis(benzyloxy)phenyl)cyclohexane-1-carbaldehyde (10 )
To a solution of carbonitrile
1 H NMR (600 MHz, CDCl3): δ 9.35 (s, 1H, CHO), 7.54–7.49 (m, 4H, H-2″, 6″, 2′″, 6′″), 7.46–7.40 (m, 4H, H-3″, 5″, 3′″, 5′″), 7.39–7.35 (m, 2H, H-4″, 4′″), 7.02–6.96 (m, 2H, H-5, H-2), 6.92 (dd, J = 8.4, 2.0 Hz, 1H, H-6), 5.22 (s, 2H, 3-OCH2), 5.21 (s, 2H, 4-OCH2), 2.33–2.24 (m, 2H, H-2′, 6′), 1.85–1.78 (m, 2H, H-3′, 5′), 1.73–1.60 (m, 3H, H-3′, 4′, 5′), 1.56–1.45 (m, 2H, H-2′, 6′), 1.41–1.31 (m, 1H, H-4′). 13 C NMR (151 MHz, CDCl3): δ 202.00 (CHO), 148.95 (C-3), 148.42 (C-4), 137.23 (C-1″), 137.20 (C-1′″, C-1), 128.50 (C-3″, 5″), 128.46 (C-3′″, 5′″), 127.54 (C-4″), 127.25 (C-4′″), 127.62 (C-2″, 6″), 127.33 (C-2′″, 6′″), 120.46 (C-6), 114.98 (C-2), 114.91 (C-5), 71.66 (3-OCH2), 71.14 (4-OCH2), 53.78 (C-1′), 31.26 (C-2′, 6′), 25.61 (C-4′), 22.81 (C-3′, 5′).
(1-(3,4-bis(benzyloxy)phenyl)cyclohexyl)methanol (11 )
To a solution of aldehyde
1 H NMR (600 MHz, CDCl3) δ (ppm): 7.52 (dd, J = 7.9, 0.9 Hz, 2H, H-2′, H-6′), 7.48 (dd, J = 7.9, 0.9 Hz, 2H, H-2″, H-6″), 7.45–7.38 (m, 4H, H-3′, H-5′, H-3″, H-5″), 7.37–7.32 (m, 2H, H-4′, H-4″), 6.99–6.96 (m, 2H, H-2, H-5), 6.93 (dd, J = 8.5, 2.2 Hz, 1H, H-6), 5.23 (s, 2H, 3-OCH2), 5.20 (s, 2H, 4-OCH2), 3.43 (s, 2H, CH 2OH), 2.13–2.00 (m, 2H, CH cyclohexyl), 1.62–1.46 (m, 5H, CH cyclohexyl), 1.42–1.26 (m, 3H, CH cyclohexyl). 13 C NMR (151 MHz, CDCl3) δ (ppm): 148.62 (C-3), 147.70 (C-4), 137.54 (C-1′), 137.50 (C-1″), 136.93 (C-1), 128.58 (C-3′, C-5′), 128.54 (C-3″, C-5″), 127.89 (C-4, C-4″), 127.65 (C-2′, C-6′), 127.41 (C-2″, C-6″), 120.79 (C-6), 115.84 (C-5), 114.89 (C-2), 73.11 (CH2OH), 71.87 (3-OCH2), 71.31 (4-OCH2), 43.61 (Ccyclohexyl), 32.74 (2 × Ccyclohexyl), 26.66 (Ccyclohexyl), 22.05 (2 × Ccyclohexyl).
(1-(3,4-bis(benzyloxy)phenyl)cyclohexyl)methyl 2-(adamantan-2-yl)acetate (12 )
A mixture of acid
1 H NMR (600 MHz, CDCl3) δ (ppm): 7.52–7.41 (m, 4H, Hbenzyl), 7.41–7.27 (m, 6H, Hbenzyl), 6.97–6.93 (m, 1H, Hphenyl), 6.92–6.86 (m, 2H, Hphenyl), 5.15 (s, 2H, CH 2Obenzyloxy), 5.14 (s, 2H, CH 2Obenzyloxy), 3.93 (s, 2H, CH 2O), 2.40–2.30 (m, 2H, CH2 CO), 2.13–2.08 (m, 1H, Hadamantly), 2.05–1.93 (m, 1H, Hcyclohexyl), 1.90–1.66 (m, 12H, Hadamantly), 1.65–1.42 (m, 7H, 2 × Hadamantly, 5 × Hcyclohexyl), 1.36–1.27 (m, 4H, Hcyclohexyl). 13 C NMR (151 MHz, CDCl3) δ (ppm): 173.64 (CO), 148.53 (C), 147.68 (C), 137.67 (C), 137.17 (C), 128.61 (CHbenzyl), 128.57 (CHbenzyl), 127.88 (CHbenzyl), 127.65 (CHbenzyl), 127.45 (CHbenzyl), 120.78 (CHphenyl), 115.82 (CHphenyl), 114.62 (CHphenyl), 72.95 (CH2O), 72.09 (CH2Obenzyloxy), 71.40 (CH2Obenzyloxy), 41.47 (Ccyclohexyl), 41.40 (Cadamantyl), 39.01 (CH2CO), 38.39 (Cadamantyl), 38.34 (Cadamantyl), 32.98 (Ccyclohexyl), 31.93 (Cadamantyl), 31.62 (Cadamantyl), 28.03 (Cadamantyl), 27.96 (Cadamantyl), 26.43 (Ccyclohexyl), 21.98 (Ccyclohexyl).
(1-(3,4-dihydroxyphenyl)cyclohexyl)methyl 2-(adamantan-2-yl)acetate (Chx-HT)
A solution of compound
1 H-NMR (600 MHz, CD3OD) δ (ppm): 6.83 (d, J = 2.0 Hz, 1H, H-2′), 6.72 (d, J = 8.3 Hz, 1H, H-6′), 6.69 (dd, J = 8.3, 2.0 Hz, 1H, H-5′), 3.94 (s, 2H, CH 2O), 2.37 (d, J = 7.7 Hz, 2H, CH 2CO), 2.10–2.04 (m, 3H, 1Hadamantyl, 2HCHex), 1.86–1.79 (m, 6H, Hadamantyl), 1.79–1.71 (m, 6H, Hadamantyl), 1.64–1.58 (m, 2H, H cyclohexyl), 1.55–1.47 (m, 5H, 2Hadamantyl, 3HCHex), 1.46–1.35 (m, 3H, HCHex). 13 C NMR (151 MHz, CD3OD) δ (ppm): 175.24 (CO), 146.02 (C-3′), 144.32 (C-4′), 136.22 (C-1′), 119.60 (C-6′), 116.17 (C-5′), 115.64 (C-2′), 74.44 (CH2O), 42.71 (C cyclohexyl), 42.29 (Cadamantyl), 39.98 (CH2CO), 39.29 (Cadamantyl), 39.18 (Cadamantyl), 34.00 (Ccyclohexyl), 33.15 (Cadamantyl), 32.45 (Cadamantyl), 29.36 (Cadamantyl), 29.30 (Cadamantyl), 27.54 (Ccyclohexyl), 23.09 (Ccyclohexyl). HR-MS (ESI) m/z: Calcd για C25H33O4: [M−H]− = 397.2384, found 397.2376.
Reagents
Chx-HT was dissolved in DMSO to make a stock solution of 100 mM and stored at −20°C, and diluted to indicated concentrations with proper medium before use. DMSO (D2650), rapamycin (V900930), 3-MA (M9281), bafilomycin A1 (196000), CQ (C6628), 2-DG (D8375), N-acetyl-
Plasmids of pEGFP-LC3B (P0199), pmCherry-EGFP-LC3B (P0446), and pLAMP1-mCherry (P10755) were purchased from Miaolingbio (Wuhan, China). Cisplatin (HY-17394), Z-VAD(OMe)-FMK (HY-16658), polyethylene glycol 300 (HY-Y0873), and Tween 80 (HY-Y1891) were purchased from MCE (Shanghai, China). Dulbecco's modified Eagle's medium (10-013-CVRC) and RPMI 1640 medium (10-040-CVR) were purchased from MCE (NewYork). Fetal bovine serum (FBS; 2053264) was purchased from Biological Industries (Beit Haemek, Israel). Bovine insulin (FS1112) was purchased from FUSHENBIO (Shanghai, China).
Cell lines and cell culture
SKOV3, OVCAR3, and IOSE80 cells were purchased from the American Type Culture Collection. SKOV3 and OVCAR3 cells were cultured in RPMI-1640 medium (Corning, NewYork) and IOSE80 cells were maintained in Dulbecco's modified Eagle's medium (Corning) supplemented with 10% FBS (#2053264; Biological Industries) and 10 U/mL penicillin–streptomycin (Gibco, Life Technologies), in a humidified atmosphere of 5% CO2, at 37°C. The culture medium for cultivating OVCAR3 cells requires the addition of 0.01 mg/mL bovine insulin (FUSHENBIO, Shanghai, China).
Cytotoxicity assay
To examine cell viability, 2 × 10³ cells/well were plated into a 96-well plate (Corning, NewYork) overnight. Next, the cells were treated with or without Chx-HT solutions at the indicated concentrations for the desired time period. To evaluate the effects of NAC (1 mM), 3-MA (100 μM), CQ (5 μM), and 2-DG (1 μM) on cell viability, cells were treated with each agent alone or in combination with Chx-HT. After treatment, cells were incubated with 0.5 mg/mL MTT solution diluted in FBS-free medium at 37°C for 4 h, and then were washed with phosphate-buffered saline (PBS) twice. Finally, the cells were dissolved in DMSO to read the absorbance of 490 nm with a microplate reader (Thermo Scientific, MA).
To examine cell number, 10 × 103 cells/well were plated in a 12-well plate (Corning) overnight. Next, the cells were treated with or without Chx-HT solutions at the indicated concentrations for the desired time period. NAC (1 mM), 3-MA (100 μM), CQ (5 μM), and 2-DG (1 μM) were applied to treat cells alone or combined with Chx-HT. After treatment, cell count was performed using a hemocytometer with trypan blue dye (Sigma-Aldrich, St. Louis).
To examine clonogenic growth with crystal violet staining, 200 cells per well were plated in a 12-well plate overnight. Next, the cells were treated with or without Chx-HT solutions at the indicated concentrations for ∼10 days. NAC (1 mM), 3-MA (100 μM), CQ (5 μM), and 2-DG (1 μM) were applied to treat cells alone or combined with Chx-HT. After treatment, plates were fixed in 4% paraformaldehyde solution for 15 min, stained for 30 min with crystal violet solution (Solarbio, Beijing, China), washed in tap water, and air-dried.
Soft agar clonogenic assay was also applied to examine clonogenic growth. For bottom agar, 0.5 mL 2 × medium (containing 20% FBS) with DMSO or Chx-HT was mixed with 0.5 mL 1.2% agarose solution and added to a 12-well plate, ensuring that bubbles are not introduced in the process. For the top agar, 0.5 mL 2 × medium (containing 20% FBS) with DMSO or Chx-HT and 200 cells were mixed with 0.5 mL 1.2% agarose solution and added to cover the solid bottom agar, ensuring no bubbles also. Finally, 1 mL normal medium with DMSO or Chx-HT was added to cover the top agar. NAC (1 mM), 3-MA (100 μM), CQ (5 μM), and 2-DG (1 μM) were applied to treat cells alone or combined with Chx-HT.
Of note, the concentrations of Chx-HT, NAC, 3-MA, CQ, and 2-DG in 2 × medium should be two times of the indicated concentrations. After treatment for ∼10 days, cell clone images were captured by a Nexcope NIB620 inverted microscope (Nexcope, Ningbo, China).
For cell cycle analysis, cells were fixed in 70% ethanol and stained with PI/RNase staining buffer (BD Biosciences, NJ). For apoptosis assay, cells were incubated in annexin 5-FITC and PI solution (Solarbio, Beijing, China) for 20 min at room temperature. Both cell cycle and cell apoptotic profiles were analyzed by flow cytometry (Beckman, Fullerton, CA).
Autophagy flux analysis through fluorescence microscopy
SKOV3 cells were first seeded and grown on coverslips in a 12-well plate overnight. For GFP-LC3 puncta analysis, cells were transfected with GFP-LC3B plasmid for 24 h and then treated with Chx-HT alone or with 3-MA or CQ. For the autophagosome-lysosome fusion analysis, cells were transfected with GFP-LC3B and mCherry-Lamp1 plasmids for 24 h and then treated with DSMO, Chx-HT, CQ, or HBSS. All fluorescent images of GFP-LC3 puncta and autophagosome-lysosome fusion analyses were taken using confocal microscopy (Carl Zeiss, Jena, Germany) and quantified using ImageJ software.
For autophagic flux analysis, cells were transfected with mCherry-GFP-LC3B plasmid for 24 h and then treated with DSMO, Chx-HT, or rapamycin. For lysosomal pH analysis, cells were grown on coverslips in a 12-well plate overnight and then treated with DMSO, Chx-HT, or bafilomycin A1. Then cells were incubated with 2 μM LysoSensor Green DND-189 (#40767ES50; Yeasen, Shanghai, China) reagent diluted in FBS-free medium at 37°C for 45 min. Following incubation, cells were washed with PBS and maintained in FBS-free medium. All fluorescent images of autophagic flux and lysosomal pH analyses were taken using a Nexcope NIB620 inverted microscope (Nexcope) and quantified using ImageJ software.
LD and mitochondrial staining
SKOV3 cells were grown on coverslips in a 12-well plate overnight and then treated with DMSO or Chx-HT. For LD staining, cells were fixed in 4% paraformaldehyde for 30 min and rinsed with PBS. Then cells were incubated in Bodipy 493/503 (#D3922; ThermoFisher) solution dissolved in PBS at a final concentration of 1 μM or in Nile red (#N3013; Sigma-Aldrich) solution dissolved in PBS at a final concentration of 1 μg/mL for 10 min. Bodipy or Nile red was removed, and slides were rinsed with PBS three times.
For mitochondrial morphology analysis, cells were incubated in MitoTracker Green (#M7514; Thermo Fisher) or MitoTracker Red (#M7512; Thermo Fisher) solution dissolved in FBS-free medium at a final concentration of 150 nM at 37°C for 20 min. Then MitoTracker Green or MitoTracker Red was removed, and slides were rinsed with PBS three times.
All fluorescent images of LD and mitochondrial morphology analyses were taken using a Nexcope NIB620 inverted microscope (Nexcope) and quantified using ImageJ software.
siRNA transfection
All siRNAs used in this study were synthesized by GenePharma (Shanghai, China). Briefly, SKOV3 cells were seeded in a 12-well plate and incubated for 24 h. Cells were then transfected with siRNA duplexes (75 nM) with the Lipofectamine RNAiMAX transfection reagent (Invitrogen) diluted in OptiMEM (Gibco) following instructions from the manufacturers. The Western blot assay was used to examine knockdown efficiency after 48 h of transfection. The siRNA sequences are listed below:
siNC: 5′-UUCUCCGAACGUGUCACGU-3′
5′-ACGUGACACGUUCGGAGAA-3′
SiATG7: 5′-CAACAUCCCUGGUUACAAG-3′
5′-CUUGUAACCAGGGAUGUUG-3′
Quantitative real-time polymerase chain reaction analysis
Total RNA was extracted with TRIzol (#AG21102; Agbio, Changsha, China) according to the manufacturer's instructions. Five hundred nanograms of RNA were reverse-transcribed using the cDNA Synthesis SuperMix kit (#AU341-02; Transgen Biotech, Beijing, China). Equal amounts of cDNA for each sample were mixed with SYBR Green qPCR SuperMix (#AQ601-01; Transgen Biotech). Quantitative real-time polymerase chain reactions (qRT-PCRs) were performed using the CFX connect real-time system (BioRad, Hercules). Each sample was tested in triplicate. GAPDH was used as an internal control for all samples. The primers are listed in Supplementary Table S1.
Western blot analysis
Cells were washed twice with cold PBS and lysed with cell lysis buffer for WB and IP buffer containing protease inhibitor PMSF (#P7626; Sigma-Aldrich). The protein lysates were separated by sodium dodecyl sulfate (SDS) gel electrophoresis, transferred to polyvinylidene fluoride membrane, and incubated with specific primary antibodies overnight at 4°C and horseradish peroxidase-conjugated second antibodies for 1 h at room temperature. β-Actin or α-tubulin was used as an internal control. Band intensities were visualized by ChemiScope 3300 Mini (CLINX Science, Shanghai, China) and quantified by the ImageJ software. The antibodies used and their dilutions are listed in Supplementary Table S2.
Mitochondria isolation
Mitochondrial fractions were isolated using a glass Dounce homogenizer. Cells were pelleted by centrifugation at 2000 g, for 5 min, 4°C, and the cell pellet was washed with prechilled PBS. Fresh tumor tissues were cut into small pieces and washed with prechilled PBS. Then, 1 mL RSB buffer (10 mM Tris-base, pH 7.4, 10 mM NaCl, 2.5 mM MgCl2) containing 1 mM PMSF was added, and the cell pellets or tissue pieces were homogenized on ice with a glass Dounce homogenizer. The homogenate was transferred to a 2 mL EP tube and mixed with 0.7 mL 2.5 × MS homogenization buffer (12.5 mM Tris-base, pH 7.4, 525 mM mannitol, 175 mM glucose, and 2.5 mM EDTA-Na2) containing 1 mM PMSF. The mixture was sedimented at 1300 g for 10 min at 4°C twice, and the supernatant was resedimented at 17,000 g for 15 min at 4°C.
The resulting pellet was resuspended with 1 × MS buffer for the detection of ETC complex activities, or was lysed with IP buffer for the preparation of mitochondrial protein. The supernatant was collected as cytosolic protein.
ETC complex activity determination
The assessment of the ETC complex activity of cells or tumor tissues followed a previously described method (Feng et al., 2011). In brief, after mitochondrial extraction, the mitochondrial protein concentration was determined using the BCA method and adjusted to the same concentration. Subsequently, equal amounts of mitochondria are added to the reaction solution of each complex activity. The reaction rates are then recorded using a microplate reader (Thermo Scientific) for a duration of 5 min, with an interval of 30 s.
Complex I facilitated the generation of reducing CoQ, which engaged in a quantitative nonenzyme-catalyzed chemical reaction with 2,6-dichlorophenolindophenol (DCIP). This reaction took place in a solution (50 mM Tris-HCl, pH 8.1, 0.35% free fatty acid-free bovine serum albumin (BSA), 1 μM antimycin A, 0.2 mM sodium azide, 50 μM CoQ, 50 μM DCIP, and 0.2 mM NADH to initiate the reaction), resulting in a gradual fading of the color of the reaction solution. The rate of this color fading was monitored to characterize the catalytic activity of complex I.
The same methodology was used to monitor the rate at which complex II catalyzed the generation of reducing CoQ, serving as a measure of its catalytic activity. This evaluation took place within a reaction solution comprising 50 mM K3PO4 at pH 7.8, 2 mM EDTA, 0.1% free fatty acid-free BSA, 3 μM rotenone, 1 μM antimycin A, 0.2 mM sodium azide, 200 μM ATP, 50 μM CoQ, and 50 μM DCIP, and 10 mM sodium succinate was added to initiate the reaction.
To assess the enzyme activity of complex III, the rate of cytochrome c reduction by ubiquinol cytochrome c reductase was measured in a reaction solution (50 mM Tris-HCl, pH 7.8, 0.2 mM sodium azide, 0.05% Tween-20, 0.01% free fatty acid-free BSA, 50 mM decylubiquinol, and 50 μM cytochrome c).
The enzyme activity of complex IV was determined by monitoring the rate at which reduced cytochrome c was oxidized by cytochrome c oxidase in a reaction solution (50 mM K3PO4, pH 7.0, 0.01% free fatty acid-free BSA, 0.2% tween-20, and 50 μM reduced cytochrome c to initiate the reaction).
For the detection of ATP synthase activity, the principle of an enzyme cascade reaction was applied. ATP synthase utilized the energy generated by succinic acid through successive enzymatic catalytic reactions. In the presence of ADP and inorganic phosphoric acid, the generated ATP was used by hexokinase to synthesize glucose-6-phosphate. Subsequently, glucose-6-phosphate dehydrogenase converted NADP+ to NADPH in the presence of glucose-6-phosphate. This entire process allowed for the assessment of ATP synthase activity, and the reaction solution consisted of 10 mM HEPES, pH 8.0, 20 mM glucose, 3 mM MgCl2, 0.75 mM NADP+, 20 mM sodium succinate, 5 U hexokinase, 2.5 U glucose-6-phosphate dehydrogenase, 10 mM K2HPO4, and 1 mM ADP to initiate the reaction.
MMP determination
MMP in the cancer cell lines was measured by the JC-1 probe (T4069; Sigma-Aldrich). A total of 2000 SKOV3 cells/well were seeded in 96-well plates overnight and treated with DMSO or Chx-HT. NAC (1 mM) was applied to continuous treatment alone or with Chx-HT. After treatment, cells were incubated with JC-1 solution diluted in FBS-free medium at a final concentration of 10 μg/mL at 37°C for 1 h, then the JC-1 solution was removed, and cells were washed with PBS twice. Finally, 100 μL PBS per well was added to read the fluorescence at an emission (Em) wavelength of 530 nm with an excitation (Ex) wavelength of 485 nm, and at an Em-wavelength of 590 nm with an Ex-wavelength of 485 nm, respectively. The MMP was then calculated by fluorescence 1 (Ex 485 nm, Em 530 nm)/fluorescence 2 (Ex 485 nm, Em 590 nm).
Cellular ATP level determination
Cellular ATP concentration was measured using the ATP assay kit (#S0026; Beyotime) following the manufacturer's instructions. SKOV3 cells were seeded in a 12-well plate overnight and treated with DMSO or Chx-HT for 24 h. NAC (1 mM) was applied to treatment alone or with Chx-HT. After treatment, cells were washed using prechilled PBS and lysed with 100 μL lysis buffer per well immediately. Cell lysate was then collected and centrifuged at 12,000 g for 5 min. Luminescence in the supernatant was measured within 1 min with a microplate reader (#Spark 10 M; Tecan, Männedorf, Switzerland). To quantify the ATP concentration, individual value was normalized by protein content per well.
Seahorse analysis
The OCR and ECAR were assayed using a Seahorse XFe24 Extracellular Flux analyzer (Seahorse Bioscience, MA). The cells (2 × 10⁴ cells/well) were seeded into a Seahorse XF24 cell culture plate overnight and then treated with DMSO or Chx-HT for 24 h. The medium was then washed and changed with XF RPMI medium (Seahorse Bioscience) containing 2 mM glutaMAX (#35050-061; Gibco, MD), 1 mM sodium pyruvate (#S8636; Sigma-Aldrich), and 25 mM glucose, and equilibrated for 30 min at 37°C before analysis. The process of OCR determination was composed of four stages, including basal condition and sequential loads of oligomycin (1 μM), FCCP (1 μM), and antimycin A (2 μM), and was measured using a Seahorse XFe24 analyzer with three cycles of mixing (150 s), waiting (120 s), and measuring (210 s).
The process of ECAR determination was also composed of four stages, including basal condition and sequential loads of glucose (25 mM), oligomycin (1 μM), and 2-DG (500 mM). The measurements were monitored using a Seahorse XFe24 analyzer with three cycles of mixing (150 s), waiting (120 s), and measuring (210 s).
Cellular NAD+/NADH ratio determination
The NAD+/NADH ratio was measured with the NAD+/NADH assay kit (#S0175; Beyotime) according to the manufacturer's instructions. SKOV3 cells were first seeded into six-well plates overnight and then treated with DMSO or Chx-HT for 24 h. Cells were collected and washed with prechilled PBS. Then the cells were lysed with 200 μL NAD+/NADH extracting solution. To measure the total NAD+, 20 μL of the samples was moved to empty wells of 96-well plates, mixed with 90 μL of alcohol dehydrogenase solution, and incubated at 37°C for 15 min. Following incubations, samples were mixed with the chromogenic agent and allowed another incubation for 30 min at 37°C. The absorbance was read at 450 nm with a microplate reader (Thermo Scientific). To measure NADH, 50 μL of samples was moved to empty EP tubes and incubated at 60°C for 30 min to degrade NAD+.
Following incubations, samples were centrifuged at 12,000 g for 5 min at 4°C. Also, the following operation refers to the total NAD+ measurement. [NAD+] = [NADtotal] − [NADH]. Individual values were normalized by protein content per well.
Cellular NADP+/NADPH ratio determination
The NADP+/NADPH ratio was measured with the NADP+/NADPH assay kit (#S0179-4; Beyotime) according to the manufacturer's instructions. SKOV3 cells were first seeded into six-well plates overnight and then treated with DMSO or Chx-HT for 24 h. Cells were collected and washed with prechilled PBS. Then the cells were lysed with 200 μL NADP+/NADPH extracting solution and centrifuged at 4°C, 12,000 g for 10 min, and the supernatant collected. To measure the total NADP, 50 μL of the supernatants was moved to empty wells of 96-well plates, mixed with 100 μL of G6PDH solution and incubated at 37°C for 10 min. Following incubations, samples were mixed with chromogenic agent and allowed another incubation for 20 min at 37°C. The absorbance was read at 450 nm with a microplate reader (Thermo Scientific).
To measure NADPH, 100 μL of samples was moved to empty EP tubes and incubated at 60°C for 30 min to degrade NADP+. Following incubations, samples were centrifuged at 12,000 g for 5 min at 4°C. Also, the following operation refers to the total NADP measurement. [NADP+] = [NADPtotal] − [NADPH]. Individual values were normalized by protein content per well.
Cellular GSH/GSSG ratio determination
The GSH/GSSG ratio was measured with the for GSH/GSSG assay kit (#S0053-1; Beyotime) according to the manufacturer's instructions. SKOV3 cells were first seeded into six-well plates overnight and then treated with DMSO or Chx-HT for 24 h. Cells were collected and washed with prechilled PBS. The protein removal reagent M solution in a volume three times that of the cell pellet was added and lysed with rapid freeze–thaw using liquid nitrogen for three times. Samples were placed at 4°C on ice for 5 min and centrifuged at 4°C, 10,000 g for 10 min, and the supernatant collected. For the determination of total glutathione: 150 μL of the prepared supernatant was added into 50 μL of 0.5 mg/mL NADPH solution and mixed well.
The absorbance at 412 nm immediately was measureed using a microplate reader (Thermo Scientific), with readings taken every 5 min for a total of 25 min, resulting in 5 data points. For the determination of GSSG content, 100 μL of the prepared supernatant was added to 20 μL of GSH clearing solution and vortexed immediately. Then the mix was added to 4 μL of GSH clearing reagent working solution, vortexed immediately, and allowed to react at 25°C for 60 min. The subsequent steps are consistent with the method for determining total glutathione. GSH = Total Glutathione − GSSG × 2. Individual values were normalized by protein content per well.
ROS determination
ROS levels were measured with MitoSOX Red (#M36008; Thermo Fisher), DHE (#S0063; Beyotime), and DCFH-DA (#D6883; Sigma-Aldrich) dyes. SKOV3 cells were first seeded into 12-well plates overnight and then treated with DMSO or Chx-HT for 24 h. NAC (1 mM) was applied to continuous treatment alone or with Chx-HT. To measure mitochondrial superoxide, cells were incubated with MitoSOX Red solution dissolved in FBS-free medium for 45 min at 37°C and then washed with PBS. To measure cellular superoxide, cells were incubated with DHE solution dissolved in FBS-free medium for 45 min at 37°C and then washed with PBS. All fluorescent images were taken using a Nexcope NIB620 inverted microscope (Nexcope) and quantified using ImageJ software. To measure the cellular ROS level, cells were incubated with DCFH-DA solution dissolved in FBS-free medium for 30 min at 37°C and washed with prechilled PBS.
Then cells were lysed and centrifuged at 12,000 g for 5 min at 4°C. Supernatant was collected and fluorescence signal was detected using a microplate reader (#Spark 10 M; Tecan).
TG determination
TG concentration was measured using the TG Colorimetric Assay Kit (#E-BC-K261-M; Elabscience, Wuhan, China). Briefly, the cells were seeded in a 6 cm dish and treated with DMSO or Chx-HT for 24 h. NAC (1 mM), 3-MA (100 μM), rapamycin (50 nM), and 2-DG (1 μM) were applied to continuous treatments alone or with Chx-HT. After treatment, cells were washed with prechilled PBS and dissolved in isopropyl alcohol for lysis with ultrasonic. After centrifugation, supernatant was added to reaction reagent and incubated for 10 min at 37°C. Absorbance was measured at 510 nm with a microplate reader (Thermo Scientific). Individual values were normalized by protein content per well.
Nonesterified free fatty acid determination
Nonesterified fatty acid concentration was measured using the nonesterified free fatty acid assay kit (#A042-1-1; Nanjing Jiancheng, Nanjing, China). Briefly, the cells were seeded in a 6 cm dish and treated with DMSO or Chx-HT for 24 h. NAC (1 mM) was applied for continuous treatments alone or with Chx-HT. After treatment, cells were washed with prechilled PBS and dissolved in CHCl3 and for lysis with ultrasonic. Copper reagent was added and mixed for 2 min, and then, the mixture was centrifugated at room temperature for 10 min at 3500 rpm. After centrifugation, the bottom layer extract was suctioned with an injector and incubated with the chromogenic reagent for 2 min at room temperature. Absorbance was measured at 440 nm with a spectrophotometer (Thermo Scientific). Individual values were normalized by protein content per well.
Glucose consumption and lactate secretion determination
SKOV3 cells were first seeded into six-well plates overnight and then treated with DMSO or Chx-HT for 24 h. NAC (1 mM) was applied to treat cells alone or with Chx-HT. After treatment, the medium was collected for determination of glucose consumption and lactate secretion. Glucose concentration was determined using a glucose colorimetric assay kit (#F006-1-1; Nanjing Jiancheng) and lactate concentration was determined using a lactic acid assay kit (#A019-2-1; Nanjing Jiancheng) according to the manufacturer's protocol. To quantify the concentrations, individual values were normalized by protein content per well.
FAO determination
The fatty acid β-oxidation was measured by the FAO kit (#HL50679 v.A; Haling Bio, Shanghai, China) following the manual. Cells were cultured in a 10 cm dish overnight and treated with DMSO or TPP-HT for 24 h, at least five dishes for each group. Then cells were rinsed with prechilled PBS and homogenized on ice with a glass Dounce homogenizer to extract mitochondria. Fifty microliters of intact mitochondria (total 500 μg mitochondrial protein) was mixed with reagents and immediately transferred to a cuvette to read the absorbances of 420 and 470 nm with a spectrophotometer (Thermo Scientific). The reads were taken once a minute for six times. The value is calculated as follows: V = [(OD420 − OD470)0 min − (OD420 − OD470)5 min].
Xenograft tumor growth mouse model
SKOV3 cells (5 × 10⁶) were resuspended in 100 μL medium and were injected subcutaneously into the right or left side of 6-week-old BALB/c male nude mice (n = 3) or female ones (n = 6; Charles River, Beijing, China). Tumors were monitored until they reached an average size of 50–80 mm3 (∼1 week), at which point treatments were begun. Mice were divided into three groups (three mice/group) randomly on the third day after injection and were administered with DMSO and Chx-HT (10 and 20 mg/kg) i.p., every day for 4 weeks.
Chx-HT was first dissolved in 10% DMSO, then 40% PEG300, 5% Tween 80, and 45% saline were added, respectively. The solution must be mixed well before adding the next reagent. Tumors and mouse weights were measured every other day. Tumors were collected and weighted after the mice were sacrificed. Tumor volumes were calculated using the formula V = 1/2 × L × W 2 where “L” is tumor length and “W” is tumor width. The animals were maintained in Exhaust Ventilated Closed-System Cage Rack at 23°C–25°C, with a relative humidity of 50%–60% under a specific pathogen-free environment. Experiments were approved by the Institutional Animal Care and Use Committee at Xi'an Jiaotong University.
Hematoxylin and eosin staining and immunohistochemistry
After the nude mice were sacrificed, tumors and organs were resected immediately and fixed in 4% paraformaldehyde at room temperature for 72 h. Samples were embedded with paraffin, sectioned, and stained with hematoxylin and eosin for staining, or stained with the primary antibody Ki67 (#GB111141; Servicebio) for immunohistochemistry. All images were taken using a Nexcope NIB620 inverted microscope (Nexcope) and quantified using ImageJ software.
Oil red O staining
After the nude mice were sacrificed, tumors and organs were resected immediately and fixed in 4% paraformaldehyde at room temperature for 72 h. Samples were embedded with OCT, sectioned, and stained with Oil red O. All images were taken using a Nexcope NIB620 inverted microscope (Nexcope) and quantified using ImageJ software.
Malondialdehyde determination
Malondialdehyde (MDA) concentration was measured using the MDA Assay Kit (#A003-1-2; Nanjing Jiancheng). Briefly, the tumors were ground in a homogenizer (KZ-II; Servicebio) following the manufacturer's instructions with ethanol. The mixture was added to the TBA reagent and incubated for 40 min at 95°C. After centrifugation, the absorbance of supernatant was measured at 532 nm with a microplate reader (Thermo Scientific). Individual values were normalized by protein content per well.
Statistical analysis
The electronic laboratory notebook was not used. Statistical analysis was performed using Graphpad Prism 9 software (GraphPad Software). Normal distribution of samples was checked by applying Shapiro–Wilk normality tests. For data that passed the normality test, homogeneity of variance test was further applied. If data also passed the homogeneity test, p-values were calculated using two-tailed Student's t-test, one-way ANOVA, or two-way ANOVA followed by Tukey's post hoc test; otherwise, p-values were calculated using Welch's t-test or the Kruskal–Wallis test. For data groups with no normal distributions, the Mann–Whitney or Kruskal–Wallis nonparametric test was used. Data are presented as the mean ± standard error of the mean. p < 0.05 was considered statistically significant.
Footnotes
Authors' Contributions
G.Z.: experimental design, data acquisition and analysis, and article preparation. M.W. and Y.G.: data acquisition. A.C.K. and E.A.G.: synthesis experiment. Y.W. and Y.Z.: animal experiments. J.L.: funding acquisition and project supervision. I.K.K.: design of chemical synthesis and article preparation. L.Z.: funding acquisition, supervision and design of the project, experimental design, data analysis, and article preparation. The final version of the article was reviewed, edited, and approved by all the coauthors.
Author Disclosure Statement
No competing financial interests exist.
Funding Information
This research was funded by the National Natural Science Foundation of China (NNSFC): numbers 3160040749, 32171102, and 31770917; the NNSFC Integrated Project of Major Research Plan number 92249303; and the Natural Science Basic Research Project of Shaanxi Province: number 2021JQ-022.
Supplementary Material
Supplementary Data
Supplementary Figure S1
Supplementary Figure S2
Supplementary Figure S3
Supplementary Figure S4
Supplementary Table S1
Supplementary Table S2
Abbreviations Used
References
Supplementary Material
Please find the following supplemental material available below.
For Open Access articles published under a Creative Commons License, all supplemental material carries the same license as the article it is associated with.
For non-Open Access articles published, all supplemental material carries a non-exclusive license, and permission requests for re-use of supplemental material or any part of supplemental material shall be sent directly to the copyright owner as specified in the copyright notice associated with the article.
