




Abstract
Aims:
Redox signaling plays a key role in skeletal muscle remodeling induced by exercise and prolonged inactivity, but it is unclear which oxidant triggers myofiber hypertrophy due to the lack of strategies to precisely regulate individual oxidants in vivo. In this study, we used tetrathiomolybdate (TM) to dissociate the link between superoxide (O2 •−) and hydrogen peroxide and thereby to specifically explore the role of O2 •− in muscle hypertrophy in C2C12 cells and mice.
Results:
TM can linearly regulate intracellular O2 •− levels by inhibition of superoxide dismutase 1 (SOD1). A 70% increase in O2 •− levels in C2C12 myoblast cells and mice is necessary and sufficient for triggering hypertrophy of differentiated myotubes and can enhance exercise performance by more than 50% in mice. SOD1 knockout blocks TM-induced O2 •− increments and thereby prevents hypertrophy, whereas SOD1 restoration rescues all these effects. Scavenging O2 •− with antioxidants abolishes TM-induced hypertrophy and the enhancement of exercise performance, whereas the restoration of O2 •− levels with a O2 •− generator promotes muscle hypertrophy independent of SOD1 activity.
Innovation and Conclusion:
These findings suggest that O2 •− is an endogenous initiator of myofiber hypertrophy and that TM may be used to treat muscle wasting diseases. Our work not only suggests a novel druggable mechanism to increase muscle mass but also provides a tool for precisely regulating O2 •− levels in vivo. Antioxid. Redox Signal. 42, 1–15.
INNOVATION (Fig. 1)
Tetrathiomolybdate (TM) induces muscle hypertrophy and enhances exercise performance.
TM linearly regulates intracellular superoxide (O2 •−) levels via superoxide dismutase (SOD1) inhibition.
TM-induced hypertrophy is dependent on SOD1 inhibition.
O2 •− is an intrinsic initiator of muscle hypertrophy.
Introduction
Loss of muscle mass in aging and various chronic diseases represents a life-debilitating condition (Antonio-Herrera and Bergthaler, 2023; Cruz-Jentoft and Sayer, 2019; Domaniku et al., 2023), and no effective drugs have been approved for its treatment (De Spiegeleer et al., 2018, Domaniku et al., 2023). Exercise-induced hypertrophy has therefore been accepted as the only approach to prevent or slow muscle loss (Cohen et al., 2015; Roberts et al., 2023). Given that physical exercise causes an acute increase in reactive oxygen species (ROS) production in skeletal muscle (Bouviere et al., 2021; Powers et al., 2020) and antioxidants abolish the health-promoting effects of physical exercise (Bouviere et al., 2021; Ristow, 2014; Ristow et al., 2009), increased ROS has been considered a redox signal that orchestrates exercise-induced muscle remodeling (Powers and Schrager, 2022). However, there is no direct evidence for the causal role of ROS in hypertrophy, and which and how specific oxidants contribute to muscle hypertrophy remain unclear, largely due to the lack of strategies to precisely regulate individual oxidants in vivo.
As two crucial redox signaling agents, superoxide (O2 •−) and hydrogen peroxide (H2O2) can be produced in response to a plethora of stimuli (including physical exercise) via various mechanisms, which subsequently elicit diverse biological activities by targeting different signaling pathways (Sies and Jones, 2020; Wang et al., 2018). These two species might be potential redox signals involved in muscle hypertrophy. Notably, although many proteins have been identified as targets of H2O2 mainly through thiol-based modifications (Sies and Jones, 2020; Zeida et al., 2019), none of them is directly associated with hypertrophy, leading us to suspect that it might be O2 •− rather than H2O2 that contributes to this process. However, specifically regulating O2 •− levels is very difficult (Wang et al., 2018), and there are currently no tools available to precisely modulate O2 •− levels in vivo.
As tetrathiomolybdate (TM) can inhibit the activity of superoxide dismutase 1 (SOD1) (Alvarez et al., 2010), a predominant enzyme for the dismutation of O2 •− into H2O2 and O2, in this study, we used TM to dissociate the link between O2 •− and H2O2 and thereby to specifically explore the signaling role of O2 •− in muscle hypertrophy. We present three major findings. First, we find that TM activates muscle hypertrophy and enhances exercise performance, suggesting that this drug for Wilson’s disease (Weiss et al., 2017) may also be used to treat muscle wasting diseases. Second, we show that TM can linearly regulate intracellular O2 •− levels, making it possible to precisely investigate the functions of this ROS molecule. Third, we demonstrate causality, namely, O2 •− is both a necessary and sufficient signal for triggering muscle hypertrophy.
Results
TM linearly regulates O2 •− levels via SOD1 inhibition
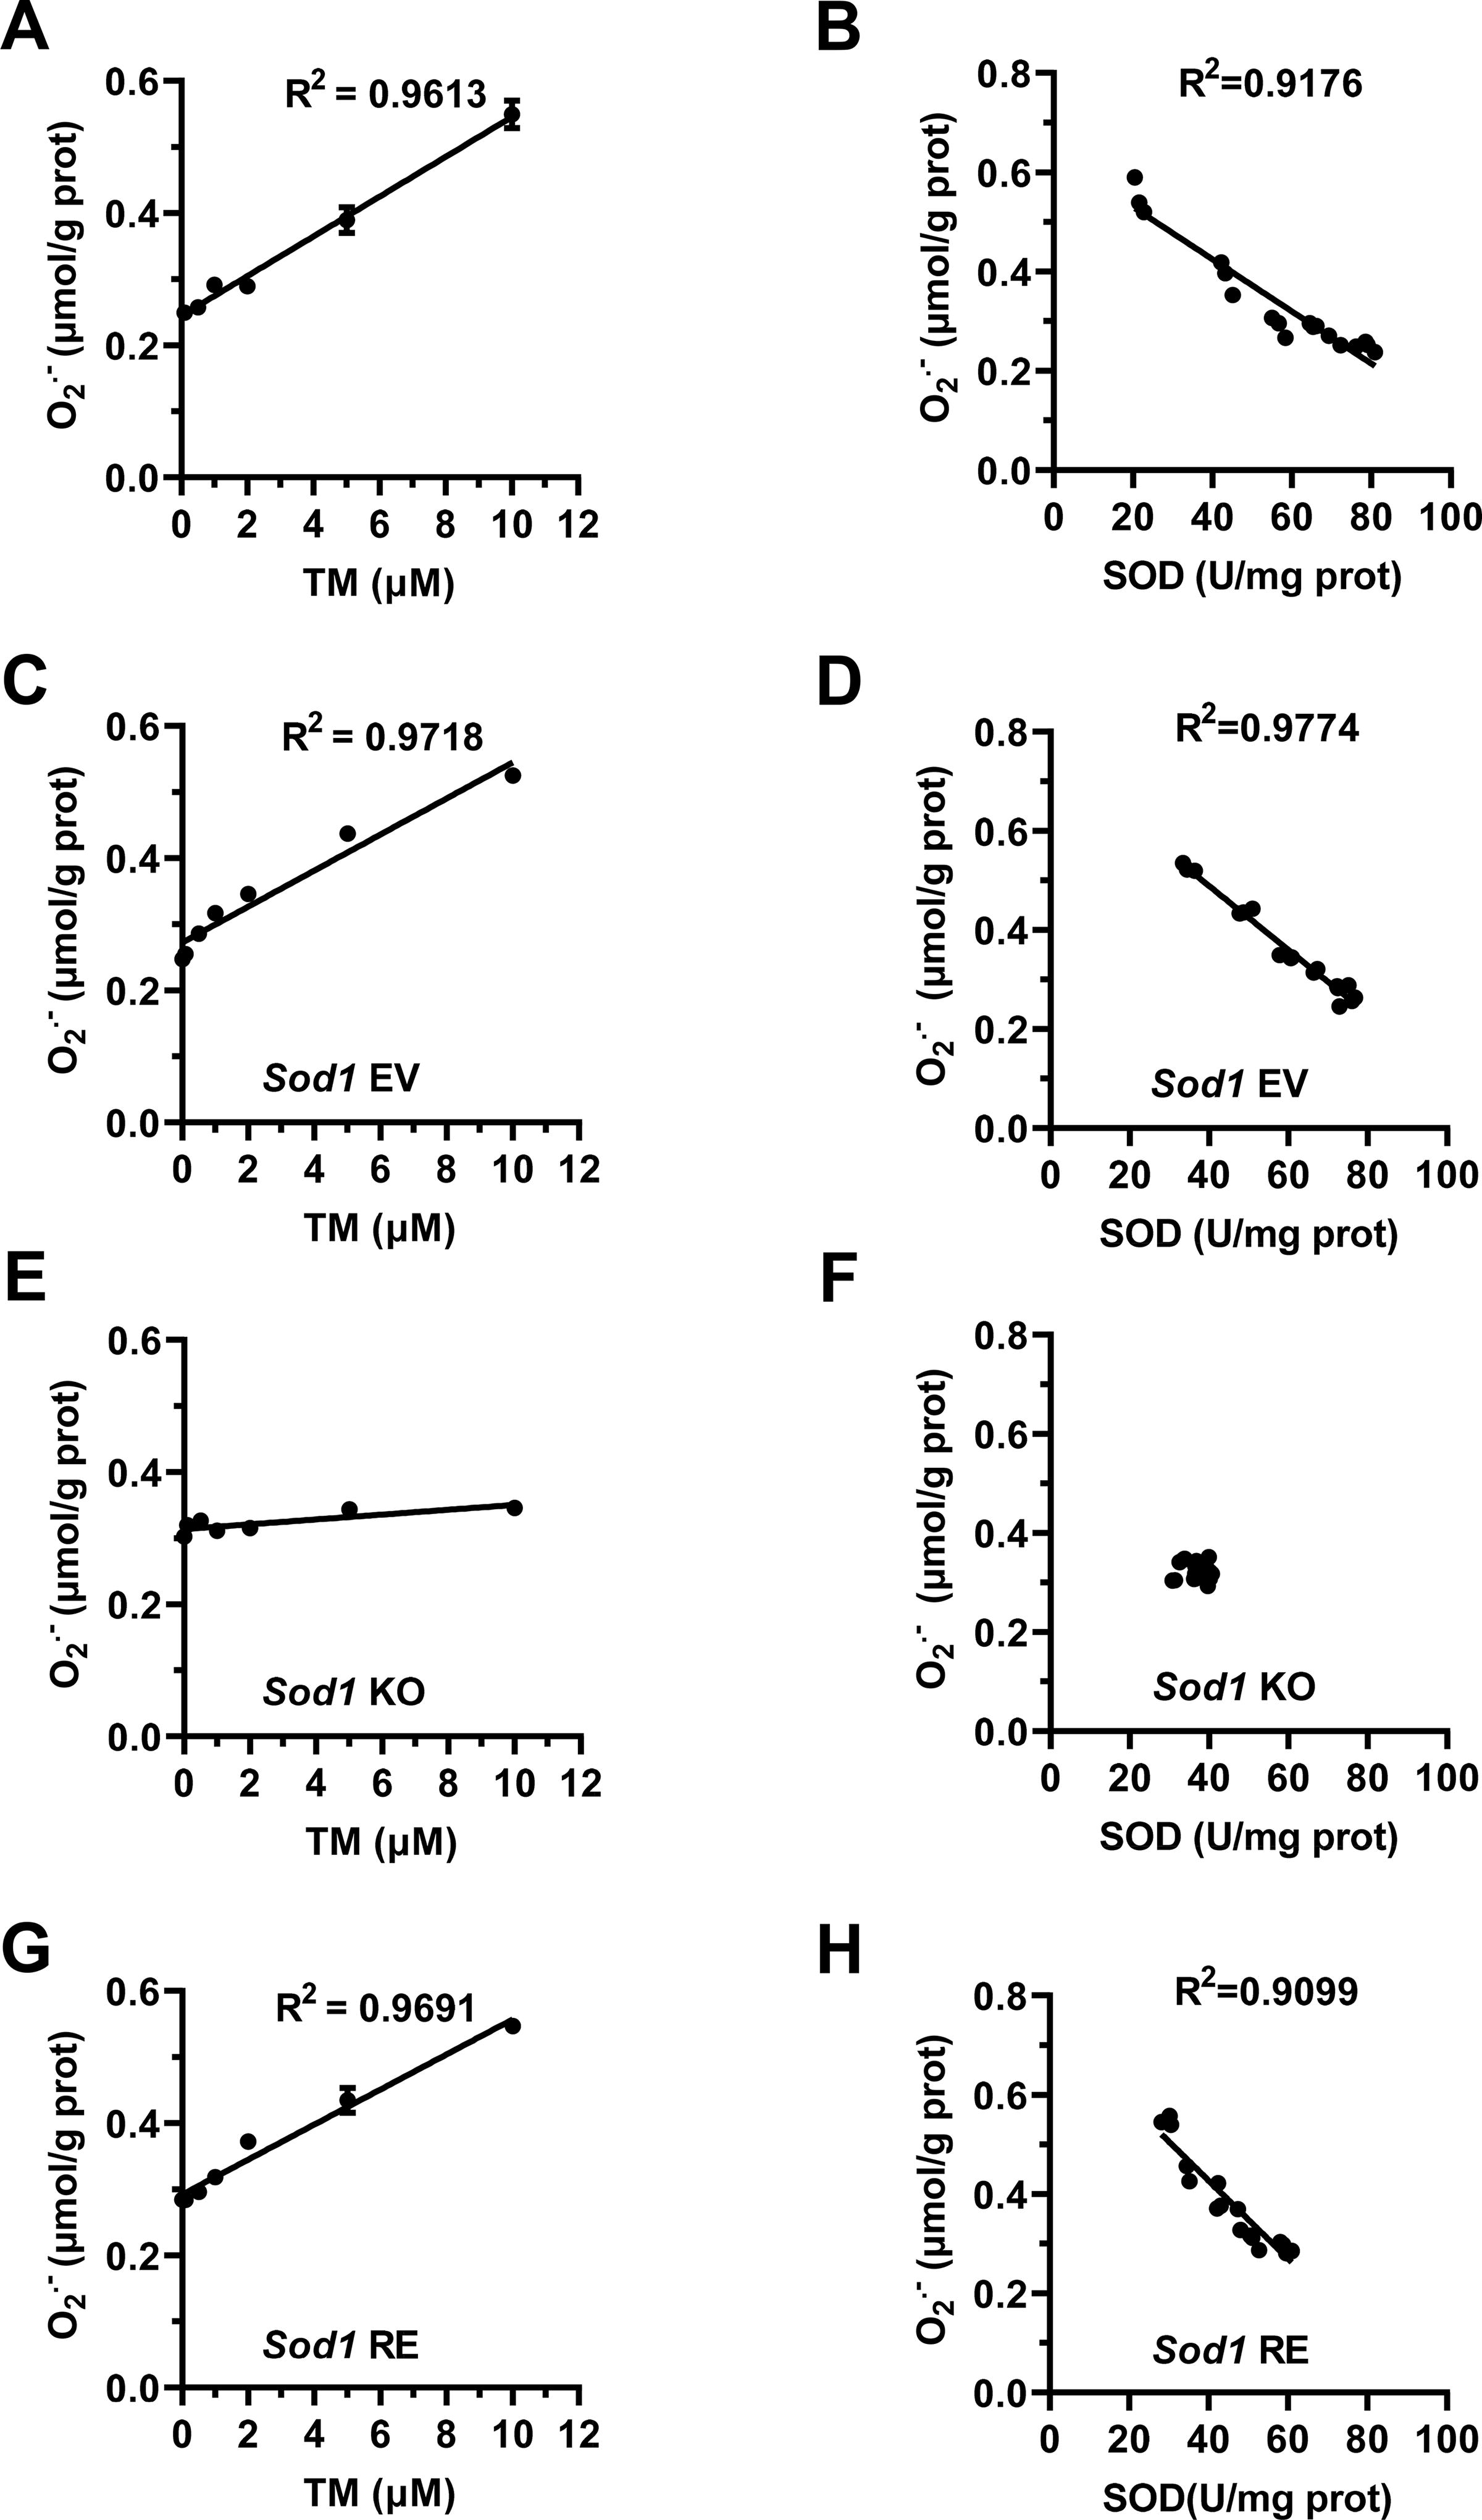
To gain detailed information on TM in regulating intracellular O2 •− levels, different concentrations of TM were administered to C2C12 cells. After exposure of cells to TM for 16 h, intracellular O2 •− levels were increased linearly with the increase in TM dose ranging from 0.1 to 10 μM (R 2>0.9, Fig. 2A), whereas SOD activity showed a dose-dependent decrease with TM (R 2>0.9, Supplementary Fig. S1A). The Spearman correlation showed that O2 •− levels in C2C12 cells were negatively and linearly correlated with SOD activity (R 2>0.9, Fig. 2B), indicating that the decreased SOD activity accounts for TM-induced O2 •− elevation. Since TM-induced SOD inhibition has been attributed to its copper-chelating activity (Alvarez et al., 2010) and SOD1 is the major SOD isoform in C2C12 cells and mouse gastrocnemius muscle (Fig. S1B and S1C), TM may regulate O2 •− through suppressing SOD1 activity. To confirm this assumption, the role of TM was tested in Sod1 KO (Sod1 −/−) and restored (Sod1 re) C2C12 cells. Under Sod1 KO, the mRNA expression levels of Sod2 and Sod3 and the baseline levels of O2 •− showed a slight increase (Supplementary Fig. S1D and S1E). TM failed to modulate SOD activity and intracellular levels of O2 •− in Sod1 −/− cells, but these effects were rescued in Sod1 re cells (Fig. 2C-2H and S1F-S1H). These data suggest that TM can linearly regulate intracellular O2 •− levels through inhibiting SOD1 activity.

TM promotes muscle hypertrophy
Based on these findings, if O2 •− serves as an intrinsic signal triggering muscle hypertrophy, TM administration would be expected to promote myogenesis and enhance exercise performance. To test this hypothesis, we investigated whether and how TM affects muscle hypertrophy in C2C12 cells and mice. After exposure of myoblasts to different concentrations of TM for 24 h, we observed a significant increase in cell proliferation, with a peak at 3.5 μM (Supplementary Fig. S2A). Therefore, this optimal TM concentration was used in all the following cellular studies. After culturing myoblasts in differentiation medium (Yaffe and Saxel, 1977), we found that, compared with vehicle-treated control cells, TM treatment significantly promoted myoblast proliferation within 72 h (Fig. 3A) and shifted the expression peak of genes encoding myogenin (MyoG) and myosin heavy chain (MyHC), two important myogenic differentiation markers (Zammit, 2017), to the left (Fig. 3B and 3C), as well as increased the protein expression of MyoG and MyHC (Fig. 3D). By immunofluorescence staining of myotubes with antibody against MyHC, a marker of terminal differentiation (Zammit, 2017), on the sixth day after exposure of cells to the differentiation culture medium, more pronounced myotube fluorescence and larger myotubes were observed in TM-treated cells compared with vehicle-treated control cells (Fig. 3E). These cellular results revealed that TM facilitates hypertrophy via promoting cell proliferation and MyoD.

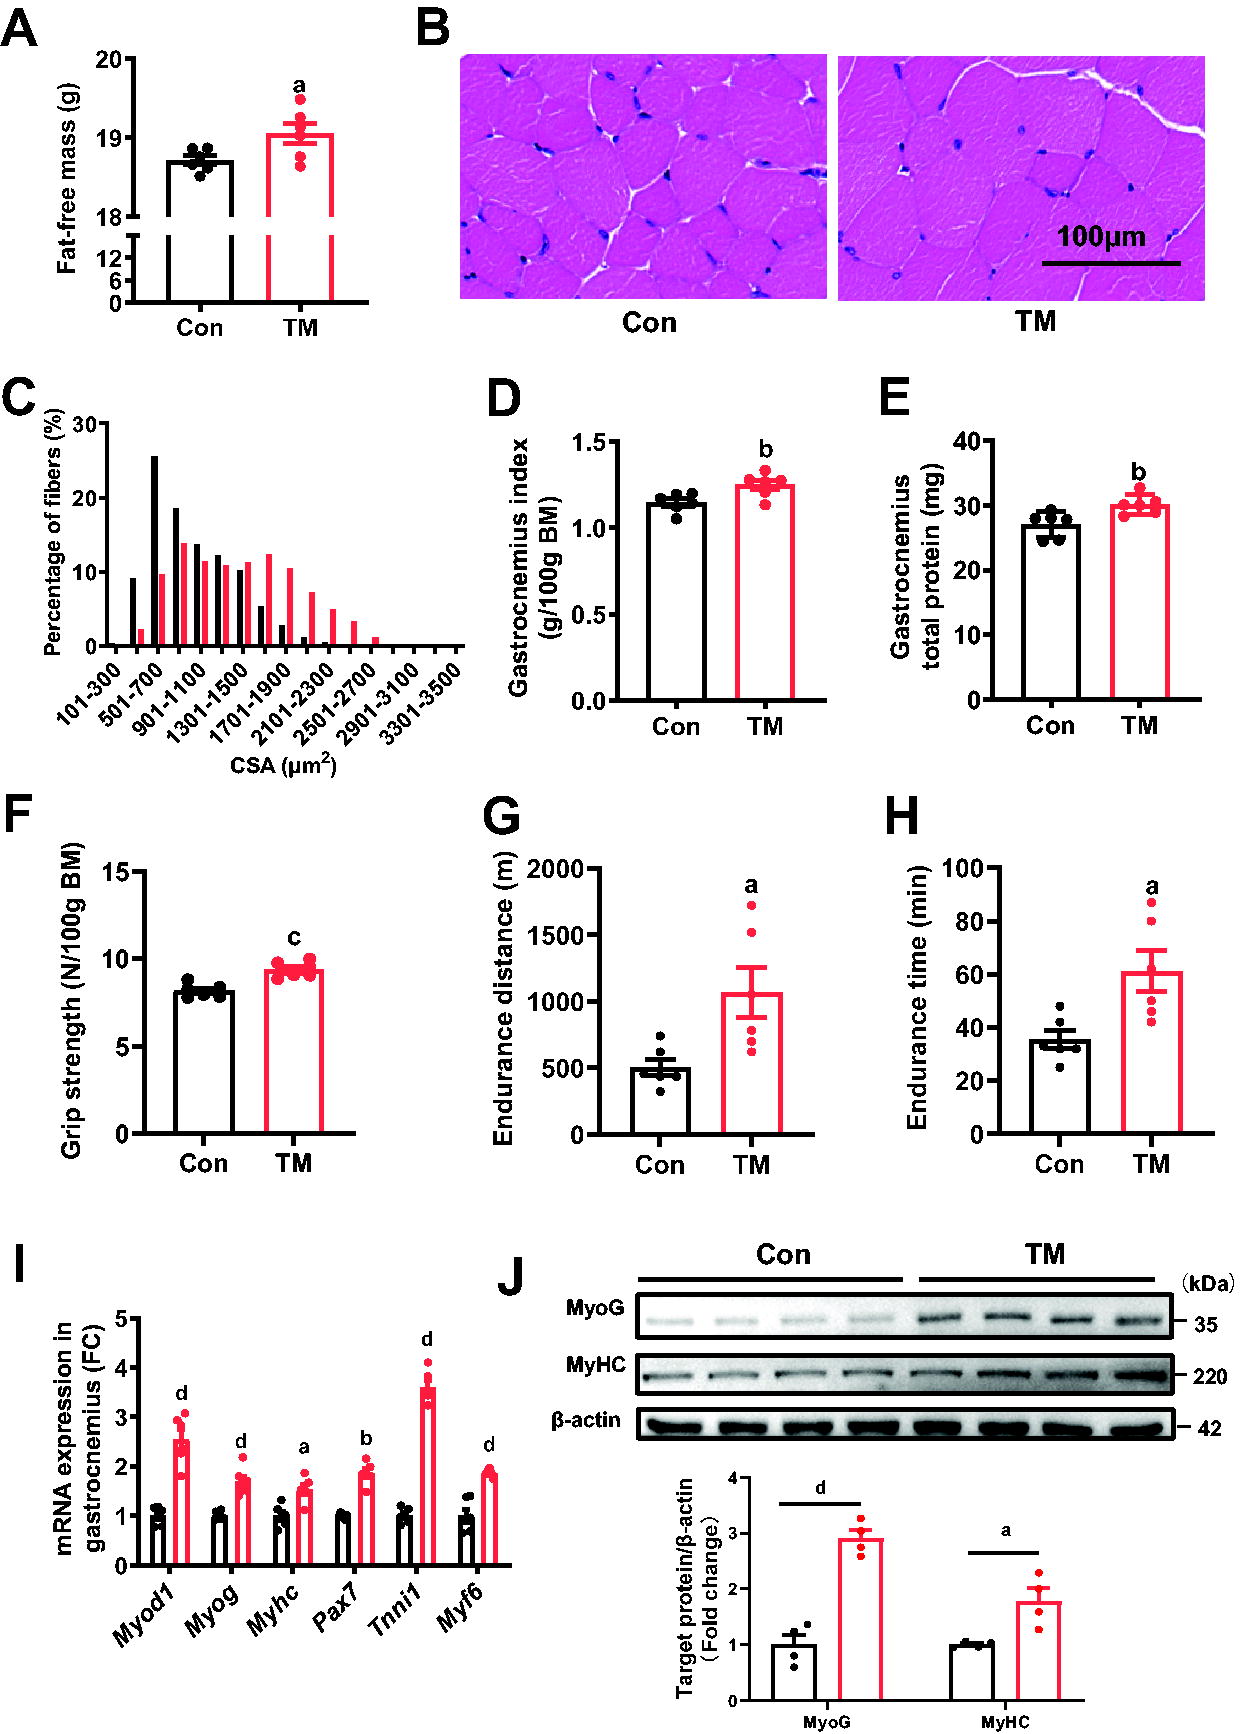
Subsequent analysis of myofiber hypertrophy and exercise performance in mice showed that administration of 10 mg/kg body mass TM for 4 weeks significantly increased fat-free mass (Fig. 4A), augmented gastrocnemius fiber size, weight, and total protein contents (Fig. 4B-4E), enhanced grip force (Fig. 4F), and prolonged endurance running distance and time by about 50% (Fig. 4G and 4H). The relative mRNA expression of MyoD target genes and protein expression of MyoG and MyHC in gastrocnemius of TM-treated mice was also increased (Fig. 4I and 4J). Notably, TM administration did not significantly alter body mass, food intake, and serum levels of alanine aminotransferase and aspartate aminotransferase (Supplementary Fig. S2B-E), but reduced both subcutaneous and visceral white adipose tissue (WAT) as indicated by inguinal WAT and epididymal WAT (Supplementary Fig. S2F and S2G), which implied that TM had no evident liver injury in mice and increased the ratio of fat-free mass. These data strongly suggest that TM exposure is sufficient to promote myofiber hypertrophy and enhance exercise performance.
Superoxide modulates muscle hypertrophy
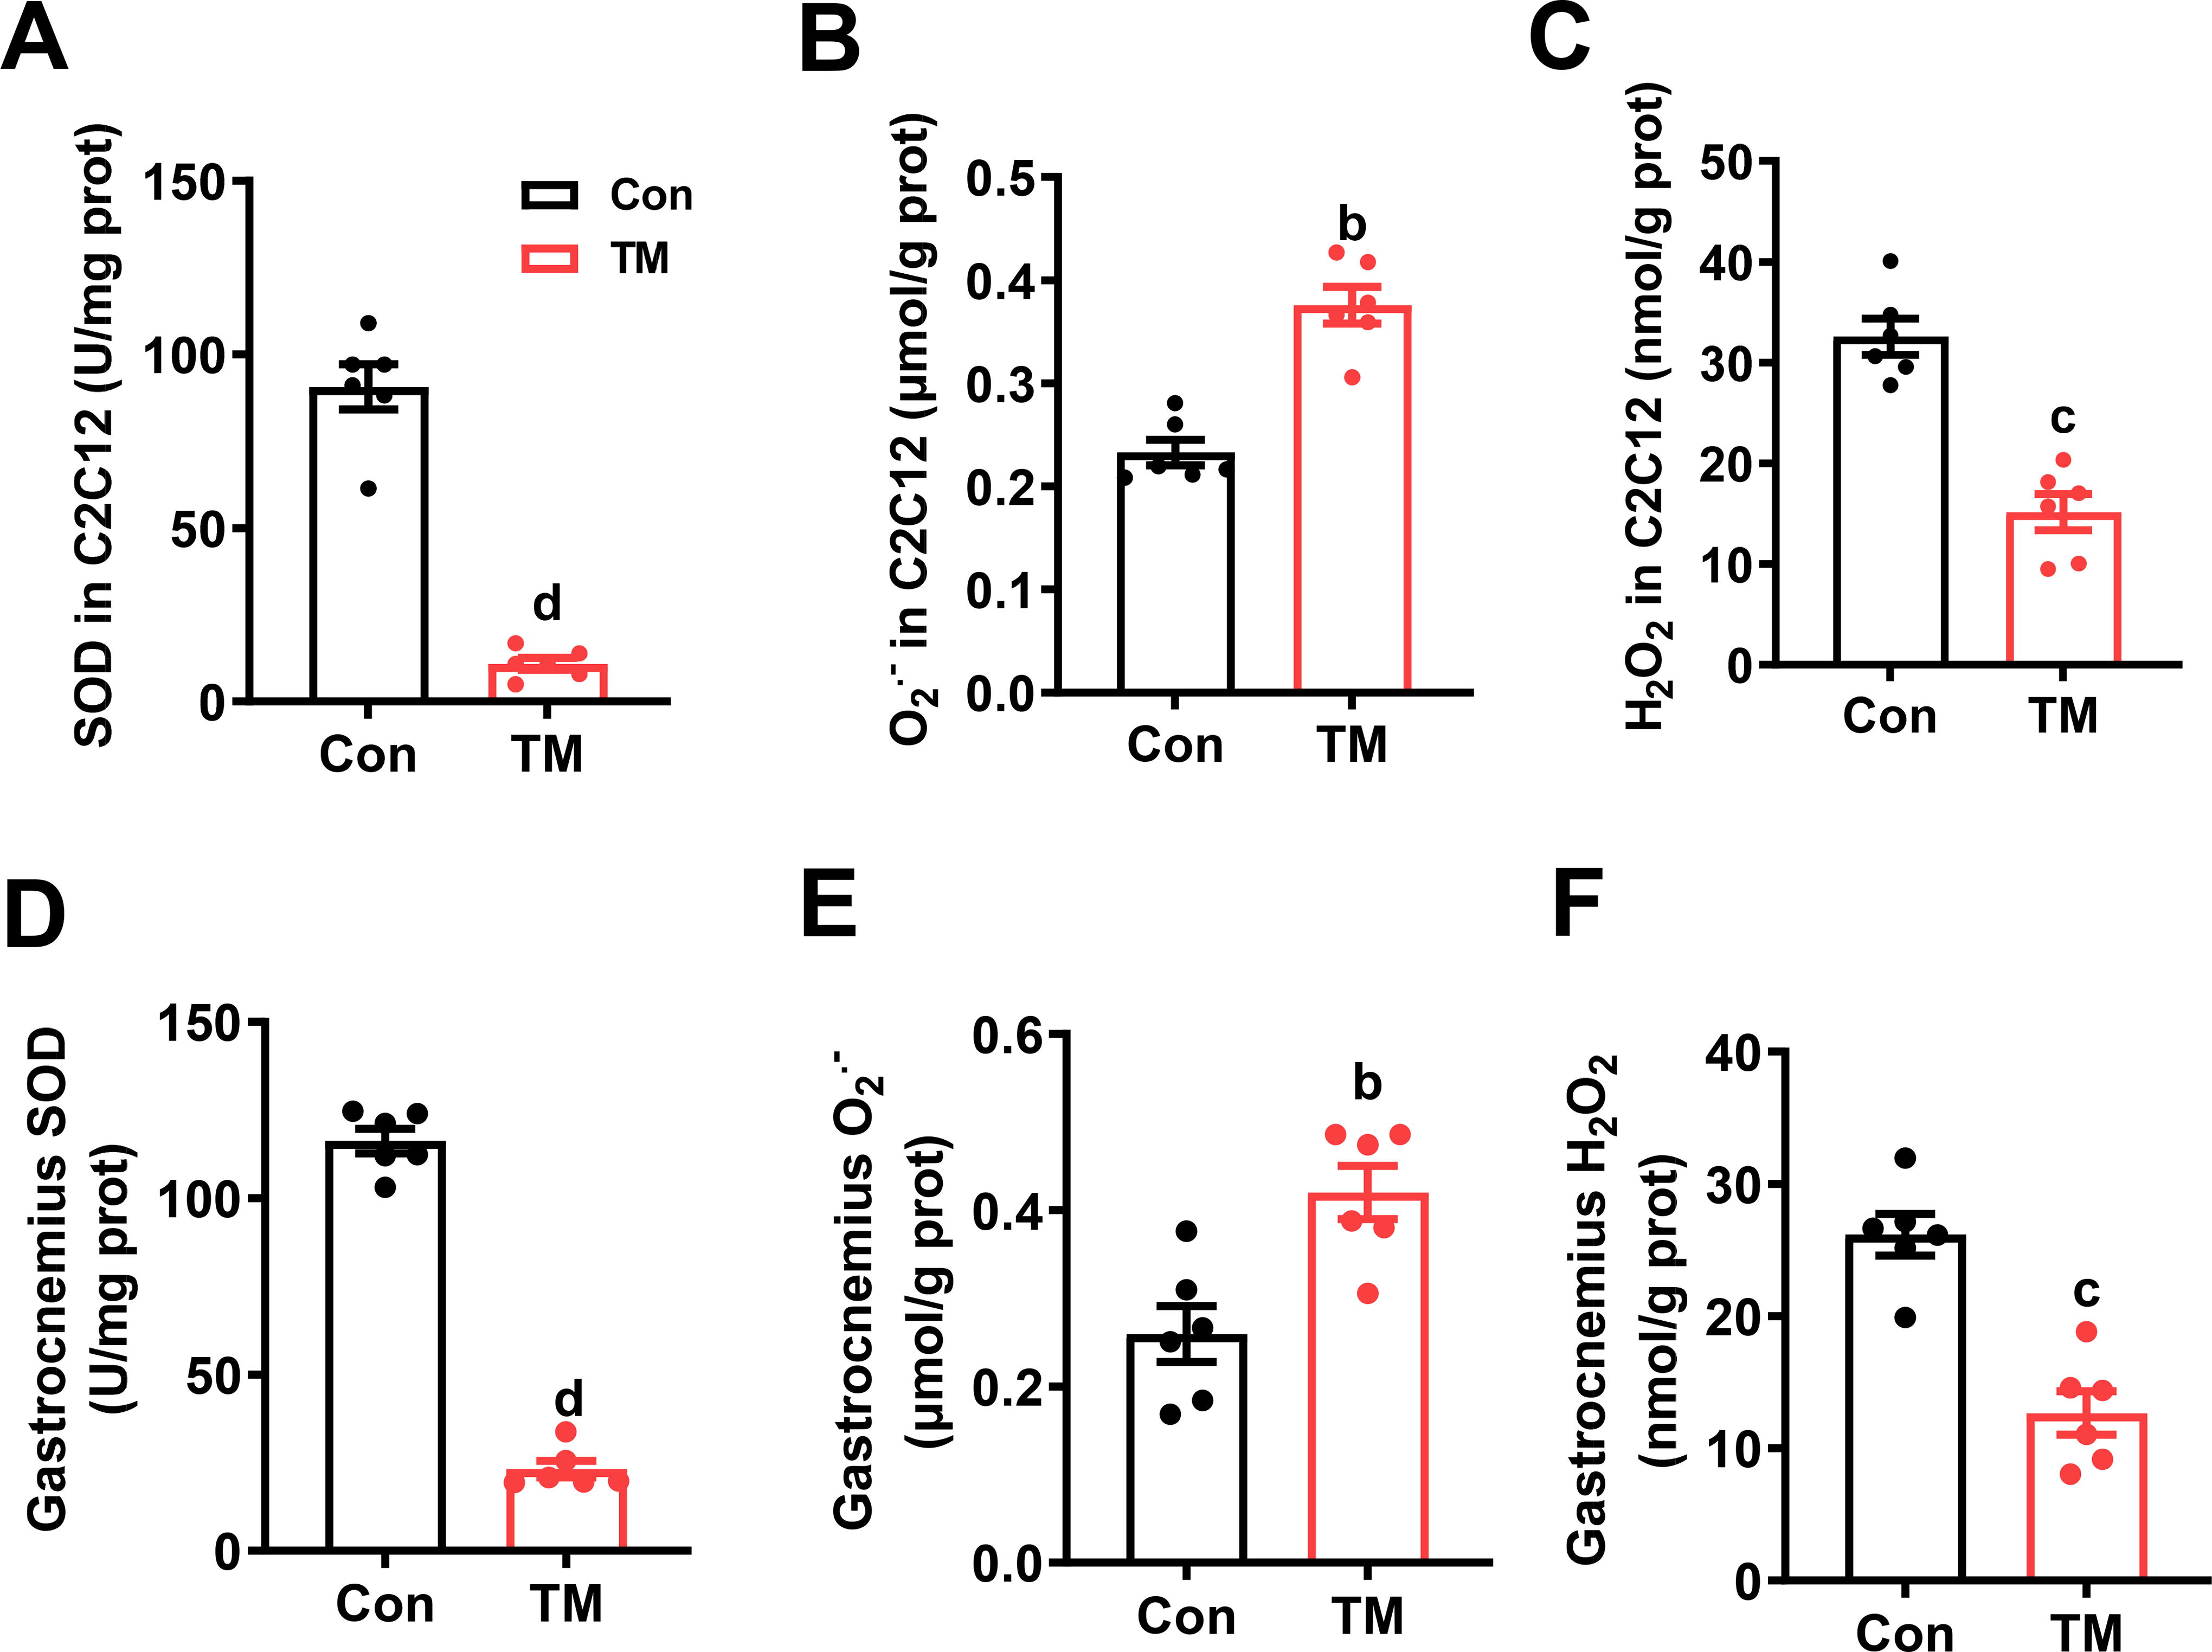
Since TM can linearly regulate O2 •− levels through inhibiting SOD1 activity, to reveal the intrinsic signaling mechanism by which TM administration causes hypertrophy and exercise enhancement, we first evaluated the role of TM in SOD activity and O2 •− production in vitro and in vivo. In C2C12 cells, SOD activity was decreased substantially after TM treatment (Fig. 5A), which was accompanied by an increase in O2 •− levels (about 70%) and a decrease in H2O2 levels (Fig. 5B and 5C). In mice, TM-induced variations in SOD, O2 •−, and H2O2 were basically the same in trend and amplitude as those in C2C12 cells (Fig. 5D-5F), suggesting that a dose of 10 mg/kg body mass TM in mice is equivalent to a dose of 3.5 μM in C2C12 cells.
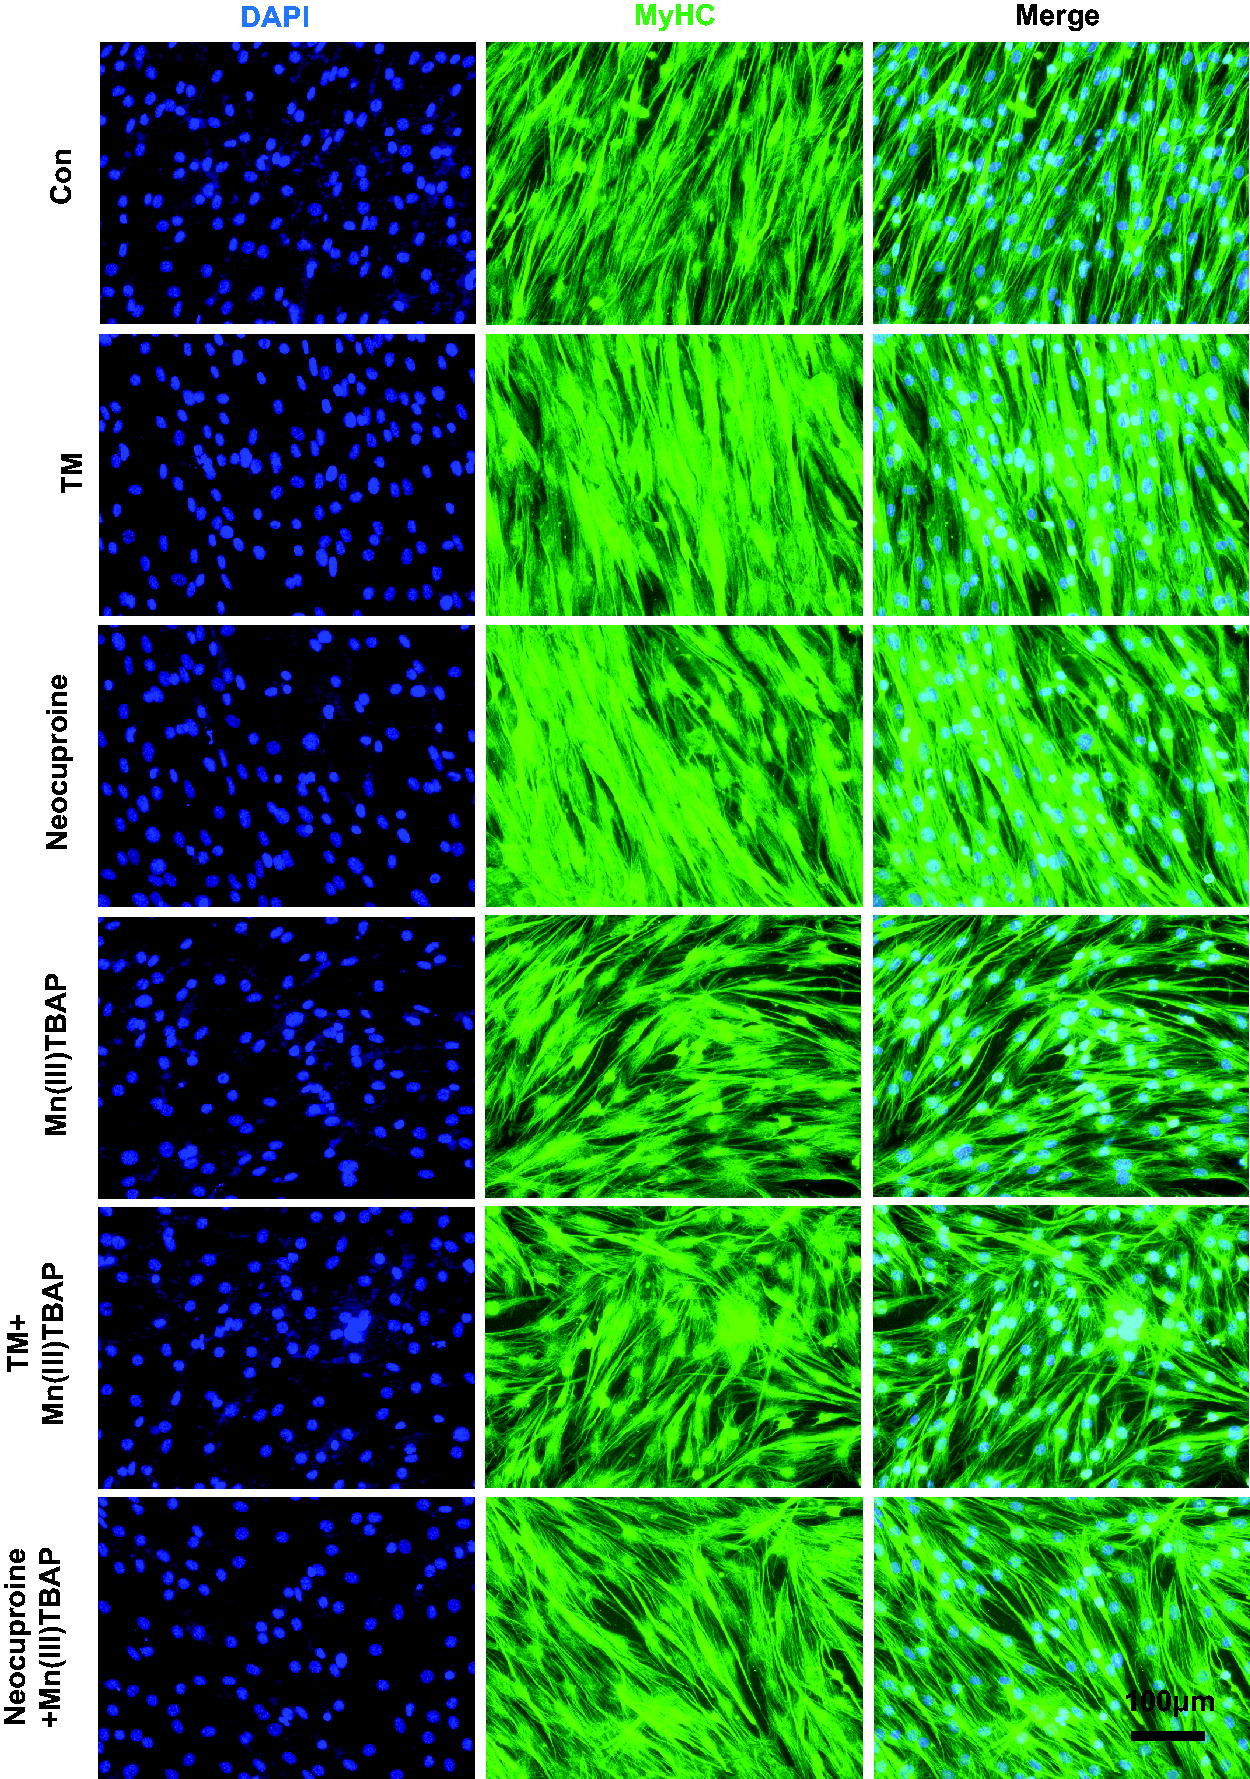
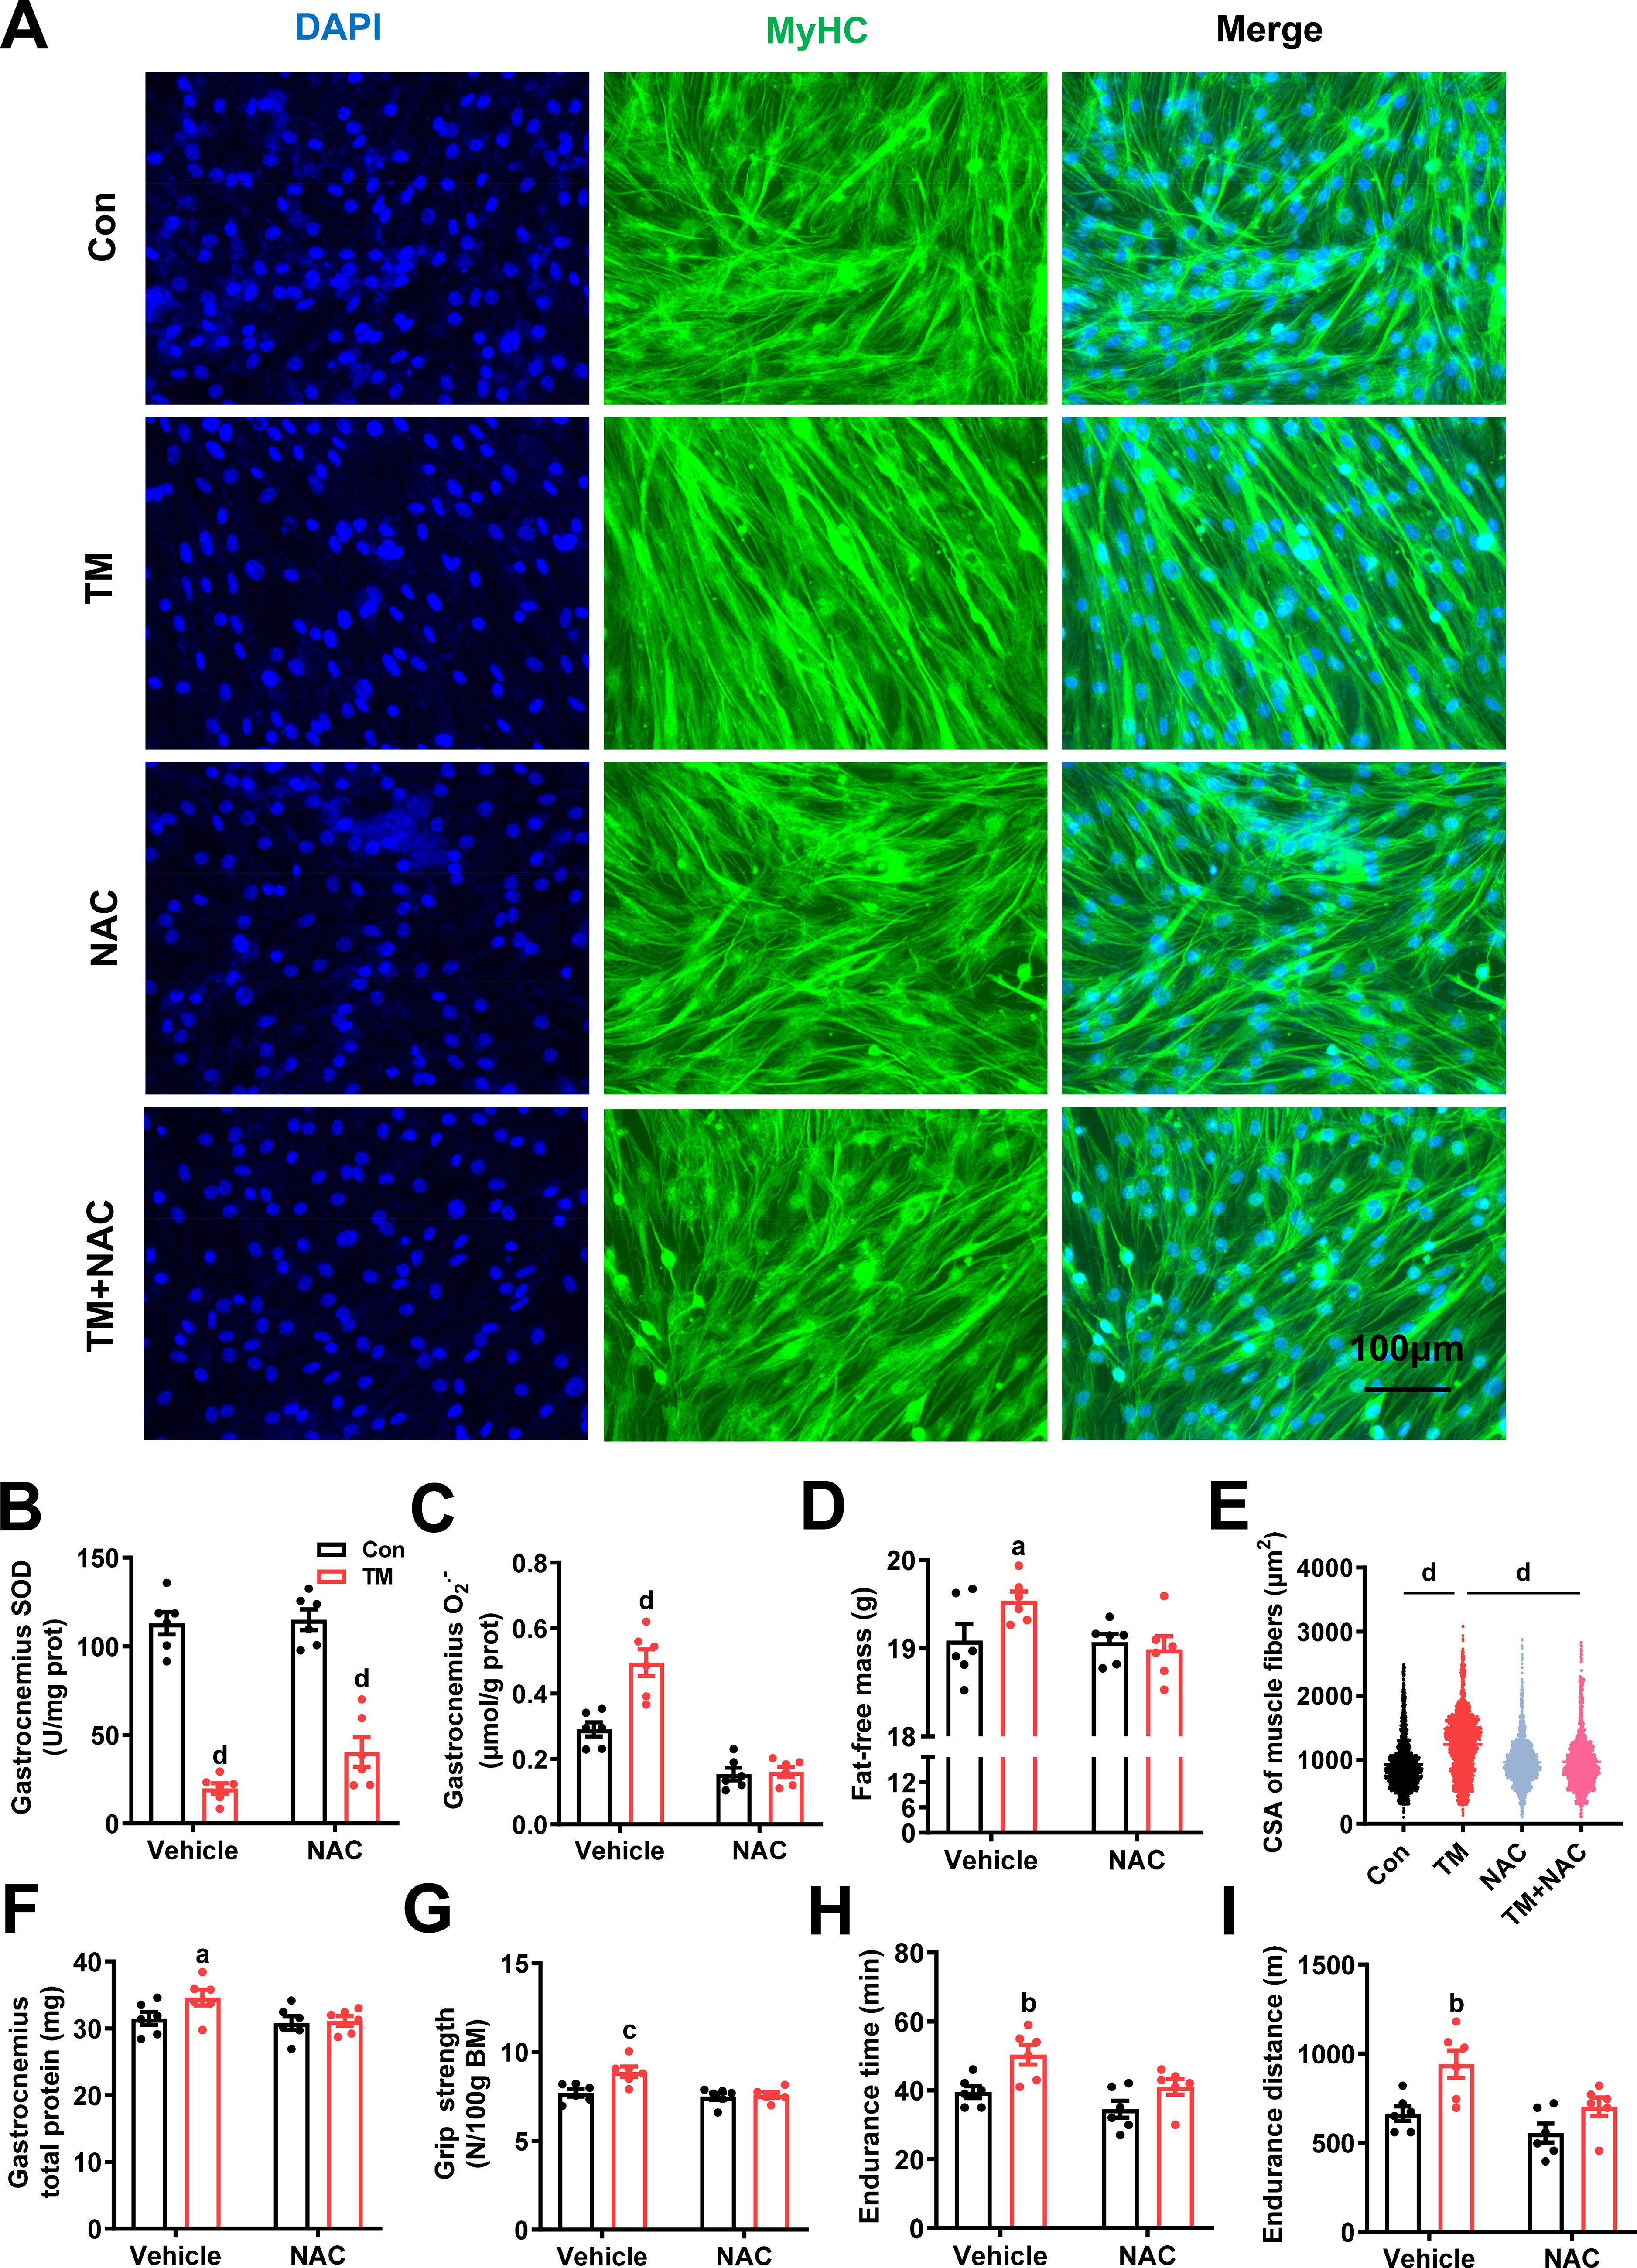
To investigate whether O2 •− is required for TM-induced myofiber hypertrophy and to preclude the potential role of TM as sulfide donor at high concentrations (Dyson et al., 2017), we tested the compared effects of TM with a sulfur-free copper chelator neocuproine (2,9-dimethyl-1,10-phenanthroline) (Al-Sa'doni et al., 1997) in C2C12 cells with or without the presence of a cell-permeable nonselective O2 •− scavenger Mn(III)TBAP [anionic Mn(III) meso-tetrakis (4-carboxylatophenyl) porphyrin] (Faulkner et al., 1994; Muscoli et al., 2003). Neocuproine mimicked all the effects of TM, including facilitating hypertrophy (Fig. 6 and S3A), inhibiting SOD activity, increasing O2 •− and decreasing H2O2 levels, and promoting myoblast proliferation and differentiation (Supplementary Fig. S3B-S3H), which excludes the role of sulfide potentially induced by TM in hypertrophy. Besides, as 3.5 μM TM treatment increased H2S levels to 330 nmol/g protein that was comparable to 1 μM GYY4137 treatment (Supplementary Fig. S3I and S3J), so we also tested the effects of 1 μM GYY4137 treatment on the biomarkers of muscle hypertrophy. Results showed that GYY4137 did not upregulate any hypertrophic biomarkers (Supplementary Fig. S3K), further excluding the role of sulfide in TM-induced hypertrophy. The addition of Mn(III)TBAP did not impact SOD activity (Supplementary Fig. S3B), but it blocked the increase in O2 •− levels (Supplementary Fig. S3C) and reversed all other muscle hypertrophic effects of neocuproine or TM (Supplementary Fig. S3A, and S3E-S3J). These results suggest that the increase in O2 •− or decrease in H2O2 rather than sulfide is crucial for TM-induced hypertrophy. To further clarify whether it is the increase in O2 •− or decrease in H2O2 that orchestrates the hypertrophy, we cotreated cells with TM and another broad-spectrum antioxidant N-acetylcysteine (NAC) (Dekhuijzen, 2004; Samuni et al., 2013). We noticed that most of the effects of NAC in TM-treated cells were similar to those of Mn(III)TBAP (Fig. 7A and S4A-S4J), except that Mn(III)TBAP increased but NAC reduced H2O2 levels (Supplementary Fig. S3D and S4D), excluding the role of decreased H2O2 in TM-induced hypertrophy. Consistent with these cellular results, NAC in mice also suppressed O2 •− levels in an SOD-independent manner (Fig. 7B and 7C) and blocked all other effects of TM, including hypertrophy and exercise performance (Fig. 7D-7I and S5A-S5G). These in vitro and in vivo results suggested that O2 •− is a necessary signal for TM-induced muscle hypertrophy.
Given that TM may inhibit several copper metalloenzymes (Alvarez et al., 2010), to reinforce the above notion and to reveal whether SOD1 inhibition is necessary for the increase in O2 •− levels and hypertrophy, the roles of TM were evaluated in Sod1 −/− and Sod1 re C2C12 cells. In addition, to test whether O2 •− is a sufficient signal for hypertrophy, the effects of exogenous O2 •− that was generated by the xanthine–xanthine oxidase system (X/XO) (Nishikimi, 1975) were investigated in these cells. We observed that the effects of TM on O2 •− levels, cell proliferation, and differentiation and the formation of myotubes were blocked in Sod1 −/− myoblasts, but rescued in Sod1 re cells (Fig. 8A-8H and S6A-S6D), suggesting that TM-induced increase in O2 •− levels and myotube formation is dependent on SOD1 inhibition. Although X/XO did not affect SOD activity (Fig. 8A), X/XO (0.1 μM xanthine and 0.01 mU/mL xanthine oxidase) could well mimic 3.5 μM TM in increasing O2 •− to similar levels (Fig. 8B) and in causing other effects in C2C12 cells (Fig. 8C-8H and S6A-S6D). In contrast to TM, the effects of X/XO on O2 •− levels and hypertrophy were not altered by Sod1 KO or restoration (Fig. 8C-8H and S6A-S6D). These data provide evidence that although TM-induced O2 •− production depends on SOD1 inhibition, it is the O2 •− signal rather than SOD1 inhibition that is both necessary and sufficient to promote myofiber hypertrophy.

The activation of mTOR signaling contributes to muscle hypertrophy
To explore the potential signaling pathways that orchestrate TM-induced muscle hypertrophy, we measured the mRNA expression of core genes of canonical myogenic pathways (Roberts et al., 2023; Sartori et al., 2021; Schiaffino et al., 2021) in mouse gastrocnemius muscle. The results showed that TM treatment did not evidently change the expression of core genes that involved proteasome, autophagy, and several other myogenic pathways (Supplementary Fig. S7A-S7C), but obviously upregulated the expression of genes in the mammalian target of rapamycin (mTOR) signaling pathway (Supplementary Fig. S7D) and in mitochondrial biogenesis (Fig. S7E). Intriguingly, mTOR has been considered as a key regulator in maintaining skeletal muscle mass through promoting protein synthesis (Yoon, 2017), and mTOR activation mediates specific oxidant-induced muscle hypertrophy (Ito et al., 2013). Therefore, these lines of evidence suggest that the activation of mTOR and subsequent promotion of protein synthesis may contribute to TM-SOD1-O2 •− axis-induced muscle hypertrophy.
Discussion
In this study, we reveal that TM activates skeletal muscle hypertrophy and enhances exercise performance through SOD1 inhibition. As a copper-chelating agent (Wei et al., 2014), TM is used clinically for the treatment of Wilson’s disease (Alvarez et al., 2010; Weiss et al., 2017), a hepatic and neurological disorder that resulted from copper accumulation. Thus, this novel role of TM in hypertrophy suggests that this drug may also have the potential to treat muscle-wasting diseases. Through the formation of a sulfur-bridged copper–molybdenum cluster, TM has been reported to inhibit several copper enzymes, including adenosine triphosphatase, ascorbate oxidase, ceruloplasmin, cytochrome oxidase, SOD1, and tyrosinase (Alvarez et al., 2010; Chidambaram et al., 1984; Fang et al., 2019). Our evidence that SOD1 KO abolished TM-induced hypertrophy and SOD1 RE rescued the hypertrophy suggests that SOD1 inhibition rather than copper chelation itself of TM is responsible for hypertrophy. Consistent with these findings, previous studies demonstrated that skeletal muscle-specific SOD1 KO in mice increases muscle mass (Zhang et al., 2013) and SOD1 gain-of-function mutation may initiate Wilson’s disease (Wiedau-Pazos et al., 1996). Given that the main function of SOD1 is to catalyze the dismutation of O2 •− into H2O2 and O2, this finding indicates that some oxidants may engage in the activation of hypertrophy.
As expected, our further findings suggest that TM can linearly regulate intracellular O2 •− levels through SOD1 inhibition, and a 70% increase in O2 •− levels is necessary and sufficient for muscle hypertrophy. Since the discovery of ROS as signal transduction messengers in 1996 (Sen and Packer, 1996), many redox-sensitive proteins have been identified (Sies and Jones, 2020) and blockade of redox signaling by antioxidants eliminates most exercise-induced adaptations to exercise (Bouviere et al., 2021; Ristow, 2014; Ristow et al., 2009), suggesting that ROS may serve as key signaling agents in initiating adaptive responses to exercise. But which specific oxidants trigger these responses and even contribute to hypertrophy remains unclear. Given that O2 •− is the first ROS produced in vivo, if there are specific molecules in ROS that act to initiate signaling for hypertrophy, O2 •− should be the most candidate. However, due to the close crosslink between O2 •−and H2O2, it is very difficult to specifically explore the function of O2 •−. In this study, we found that TM can successfully dissociate O2 •− from H2O2 through SOD1 inhibition and dose dependently increase intracellular O2 •− levels, which therefore provides a tool for specifically and precisely investigating the signaling transduction and physiological roles of O2 •−. With this tool, we further revealed that the increase in O2 •− levels by about 70% is sufficient to trigger MyoD and muscle hypertrophy, whereas O2 •− scavenging with a SOD mimic or broad-spectrum antioxidant NAC abolishes the hypertrophic effect. Therefore, these lines of evidence imply that O2 •− may be an intrinsic initiator of hypertrophy.
ROS plays a hormetic role in pathological and physiological processes. While excessive ROS may cause damage to biomolecules, moderately high levels of ROS serve as signaling molecules (Sies and Jones, 2020; Wang et al., 2018) to benefit health through hormesis-induced optimization of homeostasis (Calabrese et al., 2007; Lu et al., 2021; Pennisi et al., 2011; Trovato Salinaro et al., 2014). Although the precise mechanisms for ROS in modulating skeletal muscle functions remain to be elucidated, several cellular transduction pathways leading to muscle hypertrophy are redox-sensitive. For instance, antioxidants have been reported to inhibit hypertrophy by preventing the phosphorylation of extracellular signal-regulated kinase 1/2, p70S6 kinase, and insulin-like growth factor 1 (Handayaningsih et al., 2011; Makanae et al., 2013), typical processes for known hypertrophic signaling pathways (Glass, 2003; Roberts et al., 2023). In addition, peroxynitrite can activate mTOR and thereby promote hypertrophy (Ito et al., 2013). Consistent with this study, we also observed that TM treatment significantly upregulated the mRNA expression of key genes involved in mTOR signaling. Given that TM can linearly increase O2 •− levels through SOD1 inhibition and O2 •− can easily react with nitric oxide to generate peroxynitrite in vivo (Radi, 2018), it is logical to suppose that the increase in O2 •− levels may indirectly activate mTOR through peroxynitrite, which may orchestrate TM-SOD1-O2 •− axis-induced muscle hypertrophy.
In summary, the present work uncovered previous undescribed perspectives on skeletal muscle hypertrophy. TM was shown to precisely regulate intracellular O2 •− levels, and a moderate increase in O2 •− levels is necessary and sufficient to trigger muscle hypertrophy and enhance exercise performance. This activation of muscle hypertrophy by TM-O2 •− provides a therapeutic approach for the treatment of muscle wasting diseases.
Innovation
Redox signaling plays a key role in skeletal muscle remodeling induced by exercise and prolonged inactivity, but it is unclear which oxidant triggers myofiber hypertrophy due to the lack of strategies to precisely regulate individual oxidants in vivo. In this study, we found that TM can linearly regulate intracellular O2 •− levels and that a 70% increase in superoxide is necessary and sufficient for muscle hypertrophy (Fig. 1). These findings suggest superoxide as an endogenous initiator of myofiber hypertrophy and provide a tool for studying the precise regulation of superoxide in vivo.
Methods
An electronic laboratory notebook was not used.
Animals
All mouse studies were approved by the Institutional Review Board of the Hunan Normal University and performed in accordance with the Laboratory Animal Resources guidelines. Six-week-old male C57BL/6N mice and standard rodent chow diets were purchased from Beijing Charles River Laboratories (Beijing, China). Mice were housed at 22–25°C on a 12-h light/12-h dark cycle with ad libitum access to food and water. All experiments were started with 8-week-old mice.
Drug administration
TM (10 mg/kg/day, Jingkang, Changsha, China) was administered by incorporation into rodent chow diets. NAC [10 mg/mL in drinking water (Meier et al., 2013), Aladdin, Shanghai, China] was administered in sterile drinking water that was changed every day. The mice were treated with the above drugs alone or in combination every day for 4 weeks.
Measurement of limb muscle grip strength
The grip strength of all limbs was measured using a validated grip strength meter (Calvin Biotechnology, Nanjing, China) as described previously (Mandillo et al., 2008). Briefly, on day 21 after drug administration, the mice were lifted by their tails and made to grab the pull-gauge with their limbs. The tail was then pulled horizontally until the mice released the gauge. The maximal value of the grip strength was recorded during consecutive attempts (three sequential trials per mouse), and the average was set as the score of an individual mouse.
Treadmill exercise testing
All mice were acclimated to the treadmill (Yaokun Biotechnology, Huaibei, China) five days before the endurance test. During the acclimation days (from day 20 to day 24 after drug administration), the mice were loaded onto the treadmill at 0° incline, run for 2 min with acceleration from 0 m/min to 10 m/min, and then held at a constant speed of 10 m/min for 10 min. On the test day (day 25 after drug administration), mice ran at 10 m/min at a 5° incline for 1 min, and then the speed was increased by 0.2 m/min until the mice were exhausted. Exhaustion was defined as the inability to remount the treadmill after receiving five consecutive shocks (3 mA) plus light physical prodding for more than 5 s. The running time and distance were then calculated.
Fat-free mass
Fat mass was evaluated by a bioimpedance spectroscopy device as described previously (Aubertin et al., 2017), and fat-free mass was calculated by subtracting fat mass from body weight.
Hematoxylin and eosin staining
Gastrocnemius muscle tissues were fixed in 4% paraformaldehyde for 24 h at room temperature, dehydrated, and embedded into paraffin. Three-micrometer thick slices were cut across the middle part of the muscle and stained with hematoxylin and eosin. The whole slide images were collected at 20× magnification with Pannoramic SCAN (3DHISTECH, Budapest, Hungary). The images shown are representative results of at least three biological replicates. The cross-sectional areas of gastrocnemius myofibers (at least 1000 per sample) were determined using CaseViewer software (3DHISTECH, Budapest, Hungary).
Cell lines and drug treatment
C2C12 murine myoblasts were maintained in our laboratory and cultured in a growth medium (DMEM supplemented with 10% fetal bovine serum) at 37°C with 5% CO2. MyoD was induced by changing from the growth medium to a differentiation medium (DMEM supplemented with 2% horse serum) (Yaffe and Saxel, 1977). The pCDH-CMV-MCS-EF1-Puro lentiviral vector (YouBio, Changsha, China) alone, or containing murine SOD1, and lentiCRISPR V2 vector (YouBio, Changsha, China) containing SOD1-specific sgRNA were used to construct stable control and KO of SOD1 cell lines. For the SOD1 rescue (RE) experiment, SOD1-KO cells were infected with lentiviral particles expressing SOD1. Lentiviral particle production and infection were performed as described previously (Hua et al., 2019). Infected cells were selected in a medium containing 6 µg/mL puromycin and then maintained in a medium containing 3 µg/mL puromycin.
The following compounds were administered alone or in combination in C2C12 cells: TM (3.5 μM, Jingkang, Changsha, China), NAC [1 mM (Abubaker et al., 2019; Xu et al., 2013), Aladdin, Shanghai, China], Mn(III)TBAP [10 μM (Li et al., 2002), GlpBio, Montclair, USA), neocuproine (10 μM (Arnal et al., 2011), Aladdin, Shanghai, China], X/XO (0.1 μM xanthine and 0.01 mU/mL xanthine oxidase, Macklin, Shanghai, China), and GYY4137 [1 μM (Lee et al., 2011), MedChemExpress, Shanghai, China].
Immunofluorescence
C2C12 myotubes (6 days of drug treatment) were fixed in 4% paraformaldehyde for 10 min, subjected to membrane permeabilization with 0.2% Triton X-100 for 15 min, and blocked in 3% bovine serum albumin for 1 h at room temperature. The cells were then incubated with mouse antibodies against MyHC at 4°C overnight, followed by incubation with secondary fluorochrome-labeled antibodies (Alexa Fluor 488 goat anti-mouse IgG antibody) for 1 h at room temperature. After incubation with DAPI for 10 min to stain the nuclei, the cells were imaged using the EVOS™ imaging system (Thermo Fisher, Massachusetts, USA).
Cell proliferation assay
C2C12 myoblasts were seeded in 96-well plates at a density of 0.5–1 × 10⁴ cells per well. After 48 h of drug treatment, a cell counting kit-8 reagent (Biosharp, Guangzhou, China) was added to each well to measure cell proliferation at a wavelength of 450 nm (OD450).
Biochemical assays
Total SOD activity in tissue or cell lysates was determined according to the manufacturer’s instructions of a commercial kit (Jiancheng Bio, Nanjing, China) by the hydroxylamine method. O2 •− levels in tissue or cell lysates were estimated by SOD-inhibitable reduction of ferricytochrome c method (Pick and Mizel, 1981), and H2O2 levels in tissue or cell lysates were measured fluorometrically using Amplex Red assay and calculated by comparison to a standard curve (Karakuzu et al., 2019).
Western blot analysis
C2C12 cells (4 days of drug treatment) or frozen tissues (gastrocnemius) were lysed in RIPA buffer supplemented with Halt Protease and Phosphatase Inhibitor Cocktail (Servicebio, Wuhan, China) and 1 mM PMSF. Protein concentrations were determined using the BCA Protein Assay Kit (Servicebio, Wuhan, China) by a microplate reader (PERL ONG, Beijing, China). Twenty micrograms of protein per lane were loaded onto an 8%–12% polyacrylamide gel and then transferred to PVDF membranes using an electrophoresis chamber (Millipore, Shanghai, China) for 1.5 h. Membranes were blocked in 5% nonfat milk Tris-buffered saline (TBS) followed by overnight incubation in the primary antibody at 4°C. Primary antibodies used are as follows: anti-MyoG (#A6664, ABclonal, Wuhan, China), anti-MyHC (#A15292, ABclonal, Wuhan, China), and anti-β-actin (#AC026, ABclonal, Wuhan, China). Following primary antibody incubation, blots were washed four times for 10 min each time with TBS and 0.1% Tween 20 and incubated with an anti-rabbit IgG HRP-conjugated secondary antibody (#AS014, ABclonal, Wuhan, China). Blots were stripped with Enhanced Chemiluminescent Liquid (ECL, NCM, Suzhou, China). Blot imaging was performed on a chemiluminescence analyzer (Tanon-5200 Multi, Shanghai, China).
RNA extraction and processing
Total RNA was extracted from C2C12 cells (4 days of drug treatment) or frozen tissues (gastrocnemius) using TRIzol reagent according to the manufacturer’s instructions. The purities and concentrations of total RNA samples were determined by NanoDrop 2000 Spectrophotometer (Thermo Scientific, Wilmington, DE).
cDNA synthesis and real-time PCR
Total RNA weighing 200 ng was reverse transcribed using a cDNA Synthesis Mix (Takara, Dalian, China). Real-time PCR was carried out in an Applied Biosystems QuantStudio 5 Real-Time PCR System (ABI, Warrington, UK) with SYBR Green PCR master mix (Takara, Dalian, China) and gene-specific primers (Supplementary Table S1). The following conditions were used for real-time PCR: 95°C for 10 min, then 95°C for 15 s, and 60°C for 1 min in 40 cycles. The 2−ΔΔCT method (Pfaffl, 2001) was used to analyze the relative changes in gene expression normalized against glyceraldehyde-3-phosphate dehydrogenase mRNA expression. qRT-PCR experiments were designed and performed according to per Minimum Information for Publication of Quantitative Real-Time PCR Experiments guidelines (Bustin et al., 2009).
Statistical analysis
Data are expressed as mean ± SEM. Significance was determined by a two-tailed t-test, Tukey’s multiple-comparisons test for one-way ANOVA, or Tukey’s multiple-comparisons test for two-way ANOVA using Prism 9.0 software (GraphPad Software). A p value of <0.05 was considered significant. Spearman correlation rank coefficient (R 2) was calculated in Excel by two functions as follows: Rank Function [=RANK.AVG()) and Correl function (=CORREL()].
Footnotes
Acknowledgments
The authors thank Lin Zheng, Yang Yang, Qian Zhang, Qiu Wang, Can Zhou, Yu Liang, Xinqi Cai, Lijuan Chen, Mengting Zhang, Meijing Wang, Qi Ouyang, Xingyu Huang, Xin Xiao, and Xi Zhou for assistance with experiments and the mouse studies, and to the Liangbi Chen’s laboratory that provided experimental assistance.
Authors’ Contributions
G.L. designed and conceived the experiments. S.L., Y.Z., F.W., M.L., L.G., K.C., and L.L. conducted experiments. G.L., S.L., Y.Z., and F.W. performed the analysis. G.L., F.W., Z.D., and R.X. contributed to the interpretation of results. G.L. and F.W. wrote the article. G.L., F.W., S.L., and F.J.G. revised the article.
Author Disclosure Statement
G.L., S.L., and F.W. declare that they are inventors on a patent describing tetrathiomolybdate and muscle hypertrophy (CN114042083B). The remaining authors declare no competing interests. The funding sponsors had no role in the writing of the article and in the decision to submit the article for publication.
Funding Information
G.L. was supported by the National Natural Science Foundation of China (31871198) and the Opening Fund of The National & Local Joint Engineering Laboratory of Animal Peptide Drug Development (Hunan Normal University, National Development and Reform Commission). F.W. was supported by the National Natural Science Foundation of China (81903138), the Natural Science Foundation of Hunan Province (2022JJ30413), and Scientific Research Foundation of Hunan Provincial Education Department (23B0090). F.J.G. was supported by the National Cancer Institute Intramural Research Program.
Supplementary Material
Supplementary Figure S1
Supplementary Figure S2
Supplementary Figure S3
Supplementary Figure S4
Supplementary Figure S5
Supplementary Figure S6
Supplementary Figure S7
Supplementary Table S1
Abbreviations Used
References
Supplementary Material
Please find the following supplemental material available below.
For Open Access articles published under a Creative Commons License, all supplemental material carries the same license as the article it is associated with.
For non-Open Access articles published, all supplemental material carries a non-exclusive license, and permission requests for re-use of supplemental material or any part of supplemental material shall be sent directly to the copyright owner as specified in the copyright notice associated with the article.
