
Abstract
Aims:
The limited therapeutic options for diabetic tubulopathy (DT) in early diabetic kidney disease (DKD) reflect the difficulty of targeting renal tubular compartment. While renin–angiotensin–aldosterone system (RAS) inhibitors are commonly utilized in the management of DKD, how intrarenal RAS contributes to diabetic tubular injury is not fully understood. Mitochondrial disruption and reactive oxygen species (ROS) overgeneration have been involved in diabetic tubular injury. Herein, we aim to test the hypothesis that angiotensin-converting enzyme (ACE)-dependent intrarenal angiotensin II (AngII) disrupts tubular mitochondrial membranous homeostasis and causes excessive ROS generation in DT.
Results:
Mice suffered from renal tubular mitochondrial disruption and ROS overgeneration following high-fat diet/streptozocin-type 2 diabetic induction. Intrarenal AngII generation is ACE-dependent in DT. Local AngII accumulation in renal tissues was achieved by intrarenal artery injection. ACE-dependent intrarenal AngII-treated mice exhibit markedly elevated levels of makers of tubular injury. CTP: Phosphoethanolamine cytidylyltransferase (PCYT2), the primary regulatory enzyme for the biosynthesis of phosphatidylethanolamine, was enriched in renal tubules according to single-cell RNA sequencing. ACE-dependent intrarenal AngII-induced tubular membranous disruption, ROS overgeneration, and PCYT2 downregulation. The diabetic ambiance deteriorated the detrimental effect of ACE-dependent intrarenal AngII on renal tubules. Captopril, the ACE inhibitor (ACEI), showed efficiency in partially ameliorating ACE-dependent intrarenal AngII-induced tubular deterioration pre- and post-diabetic induction.
Innovation and Conclusion:
This study uncovers a critical role of ACE-dependent intrarenal AngII in mitochondrial membranous disruption, ROS overgeneration, and PCYT2 deficiency in diabetic renal tubules, providing novel insight into DT pathogenesis and ACEI-combined therapeutic targets. Antioxid. Redox Signal. 42, 767–786.
Introduction
Diabetic kidney disease (DKD), a high-burden microvascular complication, has become a primary cause of end-stage renal disease (ESRD) worldwide (Umanath and Lewis, 2018). Increasingly recognized as “diabetic tubulopathy (DT),” tubular injury in early DKD comes to the forefront as an emerging entity. Approximately 40% of newly diagnosed ESRD is attributable to DT, affecting about 1/3 of patients with diabetes (Marquardt et al., 2017). Nevertheless, limited therapeutic medications, such as renin–angiotensin–aldosterone system (RAS), are available to impede DT advancement (Neuen et al., 2019; Perico et al., 2017). Therefore, elucidating the novel mechanisms implicated in DT would address the unmet demand to decelerate or even reverse DT.
Apart from the widely recognized systemic RAS, intrarenal RAS is supported by the findings that angiotensin II (AngII) level in tubular fluid transcends the bloodstream. Angiotensin-converting enzyme (ACE) can be synthesized in proximal renal tubules (Navar et al., 2011; Roman et al., 2016). Renal tubular epithelial cells (RTECs) are highly abundant in mitochondria to meet high energy demand for substance exchange (Bhargava and Schnellmann, 2017). RTECs are therefore susceptible to mitochondrial disturbances, a crucial event in instigating renal tubular injury (Micakovic et al., 2018). RAS affected mitochondrial β-oxidation in diabetic cardiomyocytes (Blumensatt et al., 2017). As yet, there have been no in-depth studies focusing on how intrarenal RAS mediates renal mitochondrial abnormalities in DT.
Abnormal mitochondrial membrane, especially for the highly conserved inner membrane cristae where oxidative phosphorylation (OXPHOS) enzymes reside, is intrinsically correlated with mitochondrial function (Cogliati et al., 2013). Upon diabetic exposure, oxidative stress resulting from reactive oxygen species (ROS) overgeneration has been involved in renal injury (Chen et al., 2023, Ding et al., 2018). CTP: Phosphoethanolamine cytidylyltransferase (PCYT2), the regulatory enzyme of the CDP-ethanolamine Kennedy pathway, regulates the de novo biosynthesis of phosphatidylethanolamine (PE) from ethanolamine and diacylglycerol (Cikes et al., 2023; Pavlovic and Bakovic, 2013). PCYT2 suppression causes accumulation of substrate phosphoethanolamine (PEtn), affecting mitochondrial respiration and cellular survival (Gohil et al., 2013). PCYT2 deficiency participated in diabetic hepatic mitochondrial injury (Xu et al., 2023) and insulin resistance in nonalcoholic steatohepatitis (Grapentine et al., 2022). As yet, it has not been determined whether PCYT2 also plays a role in DT.
In this study, we identified ACE-dependent intrarenal AngII as a crucial factor in disrupting tubular mitochondrial membrane, causing ROS overgeneration, and downregulating PCYT2 in DT. Diabetes aggravated the tubular detrimental effect of intrarenal AngII. ACE inhibitor (ACEI) partially alleviated intrarenal AngII-induced tubular degradation pre- and post-diabetic induction. These findings provide new insights into the pathogenesis of DT and potential therapeutic targets.
Results
The occurrence of renal tubular injury in early DKD
To preliminarily assess renal function in DKD, we established a DT mouse model employing high-fat diet (HFD) with intraperitoneal injection of streptozocin (STZ) in male C57BL/6J mice (Fig. 1A). Through HFD/STZ treatment, the body weight (Fig. 1B) and fasted blood glucose (FBG) (Fig. 1D) of DT mice increased with age. After 14 weeks and 5 days, DT mice exhibited a substantial increase in body weight (Fig. 1C), FBG (Fig. 1E), and urinary glucose (Fig. 1F). Notably, the DT mice had blood and urinary glucose that were twice and 200-fold higher, respectively, than control (CON) mice (Fig. 1E, F). Additionally, parameters reflecting renal functions, including serum creatinine (sCr), blood urea nitrogen (BUN), urinary albumin creatinine ratio (UACR), and urinary microalbumin (Umalb), were significantly increased in DT mice (Fig. 2A).

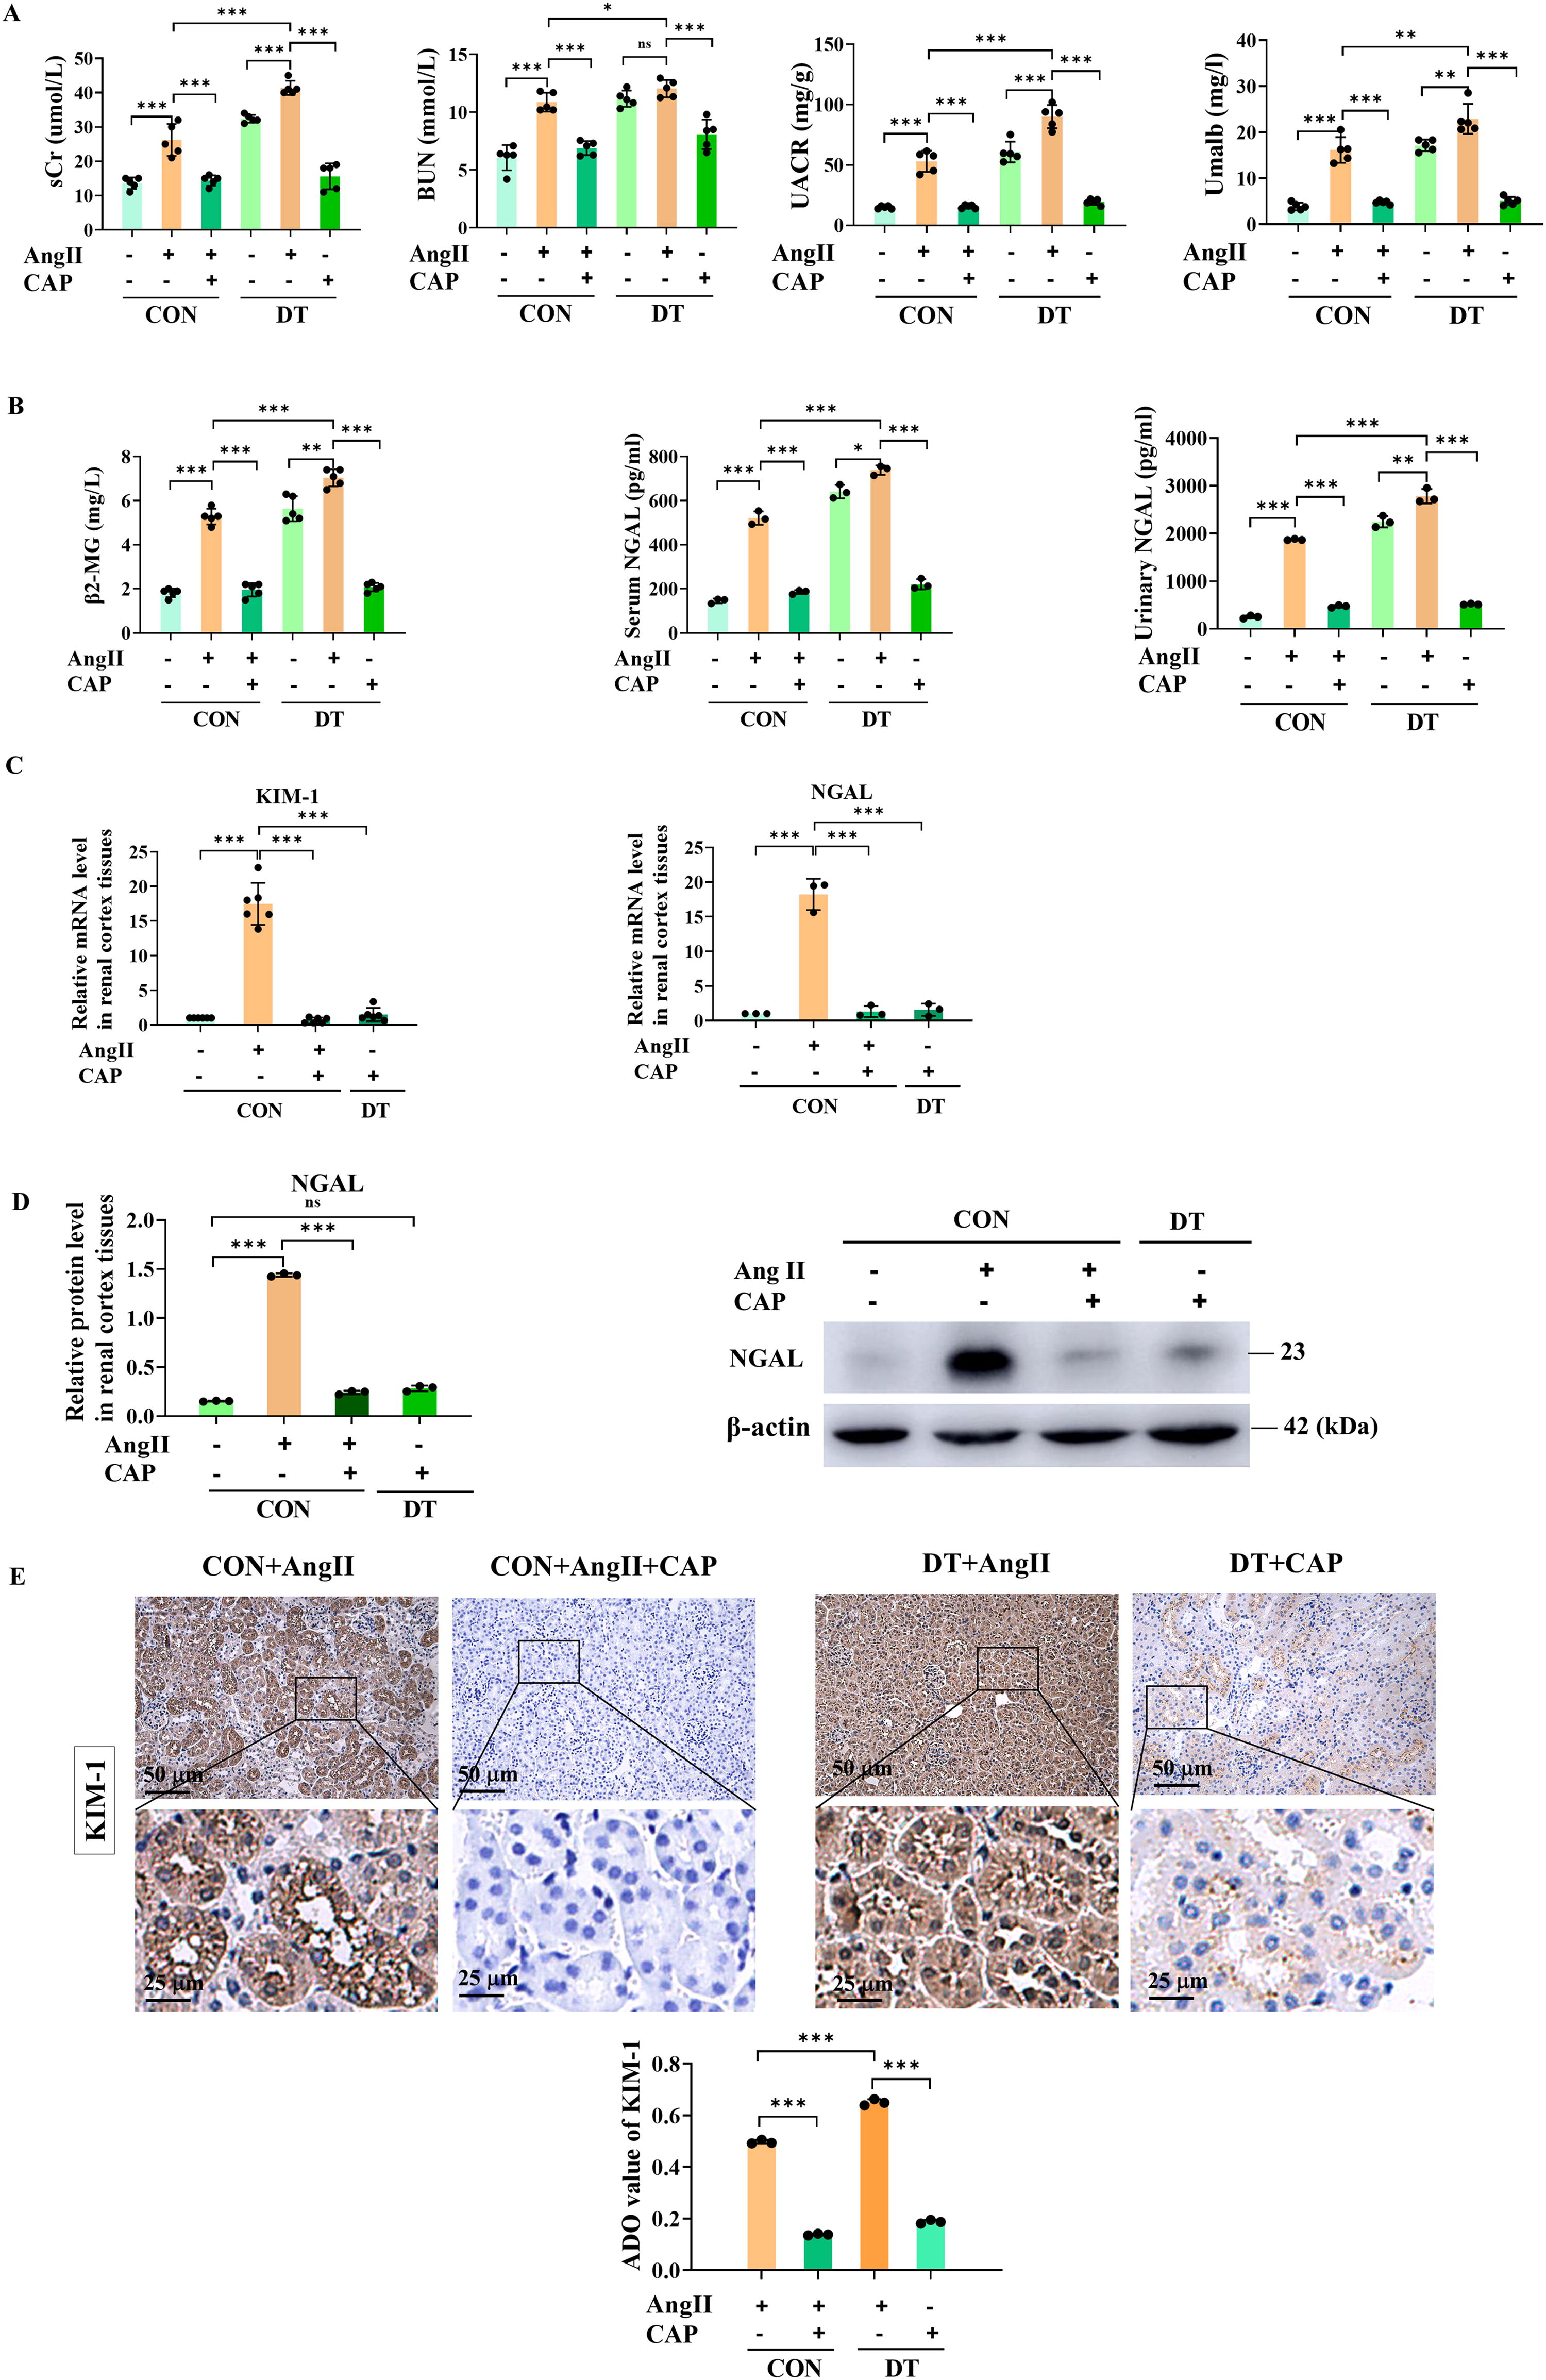
Given the increasing recognition of tubular injury in the etiology of DKD, we further investigated whether tubular injury occurs in diabetes. Kidney injury molecule-1 (KIM-1), neutrophil gelatinase-associated lipocalin (NGAL), and β2-microglobulin (β2-MG) were widely recognized as markers of renal tubular injury (Mori et al., 2021; Yao et al., 2022). In vitro, reverse transcription quantitative polymerase chain reaction (RT-qPCR) (Fig. 1H) and Western blot analysis (Fig. 1I) showed that high glucose (HG, 40 mM)-treated RTECs showed significantly higher expression of KIM-1 and NGAL than mannitol and normal glucose group (NG, 5.5 mM) (Fig. 1G). In vivo, the levels of β2-MG, serum, and urinary NGAL (Fig. 2B), renal mRNA (Fig. 2C), and protein level (Fig. 2D) of NGAL were significantly higher in DT mice. Masson’s trichrome staining was performed to evaluate collagen deposition (Fig. 1J). No significant changes were found in the Masson positive area between CON and DT groups, suggesting a DKD model was established at an early stage without developing renal fibrotic sclerosis. Hematoxylin and eosin (H&E) staining showed that DT mice had a threefold increase in the tubular injury score compared with CON mice, meaning deteriorative brush-border loss, tube dilatation, cast formation, and vacuolization (Fig. 1K). We ensued to evaluate the KIM-1 and NGAL levels within renal cortex. According to immunohistochemical (IHC) staining, there was a noticeable increase in renal expression of KIM-1 and NGAL in DT mice and patients with DKD (Fig. 1L, M). The clinical data of the participants were listed in Supplementary Table S1. Based on these results, a mouse model of DT has been established, demonstrating the occurrence of tubular injury in early DKD.
Intrarenal AngII-induced tubular injury is deteriorated by DT, which is partially alleviated by ACEI
Intrarenal AngII has been recognized as a factor contributing to diabetes development (Carey and Siragy, 2003). To investigate intrarenal-AngII involvement in DT, we performed intrarenal artery injection to efficiently accumulate AngII within renal tissues. Treated with intrarenal AngII, mice displayed significantly higher sCr, BUN, UACR, and Umalb. It is noteworthy that diabetic exposure markedly elevated the levels of these renal parameters. Captopril (CAP, the ACEI), partially alleviated AngII-induced renal deteriorations pre- and post-diabetic induction (Fig. 2A).
As for tubular injury, intrarenal AngII-treated mice have markedly elevated levels of tubular markers (serum β2-MG, and serum and urinary NGAL), which were aggravatedly elevated post-diabetic induction (Fig. 2B). RT-qPCR showed that intrarenal-AngII treatment significantly elevated KIM-1 and NGAL levels (Fig. 2C). Consistent result was observed in Western blot analysis, showing NGAL expression was noticeably higher in AngII-treated mice (Fig. 2D). IHC result further confirmed the increased KIM-1 expression in renal cortex of AngII-treated mice. Cap treatment partially ameliorated AngII-induced tubular deterioration pre- and post-diabetic induction (Fig. 2B–E). Therefore, intrarenal AngII was responsible for renal tubular injury, which was exaggerated by diabetic exposure and partially ameliorated in response to ACEI.
A small amount of intrarenal ACE, mainly tubular ACE, is expressed in DT
To explore intrarenal RAS involvement in the pathogenesis of DT, we next assessed the expression of key components of RAS in diabetes. RT-qPCR showed that the diabetic condition significantly elevated the amount of ACE2. However, the mRNA levels of angiotensinogen, ACE, and AngII type 1 receptor (AT1R) were downregulated, among which ACE was the mere component that showed a significantly downregulated expression in the kidney of DT mice compared with CON mice (Fig. 3A). We then assessed the differential tissue distribution of ACE expression in diabetes. As measured by RT-qPCR, renal ACE expression in DT mice was significantly lower than CON mice. The comparison of ACE expression in other organs was nearly equivalent to CON mice, except for aorta and plasma ACE (surrogates of endothelial ACE [Eriguchi et al., 2018]), which exhibited higher expression in DT mice (Fig. 3B). ACE was therefore selected for further investigation. Western blot analysis (Fig. 3C) and IHC staining (Fig. 3D) further confirmed the significantly reduced expression of intrarenal ACE in DT mice. According to RT-qPCR (Fig. 3E), CAP administration led to decreased expression of intrarenal ACE in CON and DT mice, indicating the efficient inhibition of ACE in mice. In accordance with the expression level, ACE activity was significantly diminished in DT mice compared with CON mice, both of which were effectively inhibited by CAP (Fig. 3F).
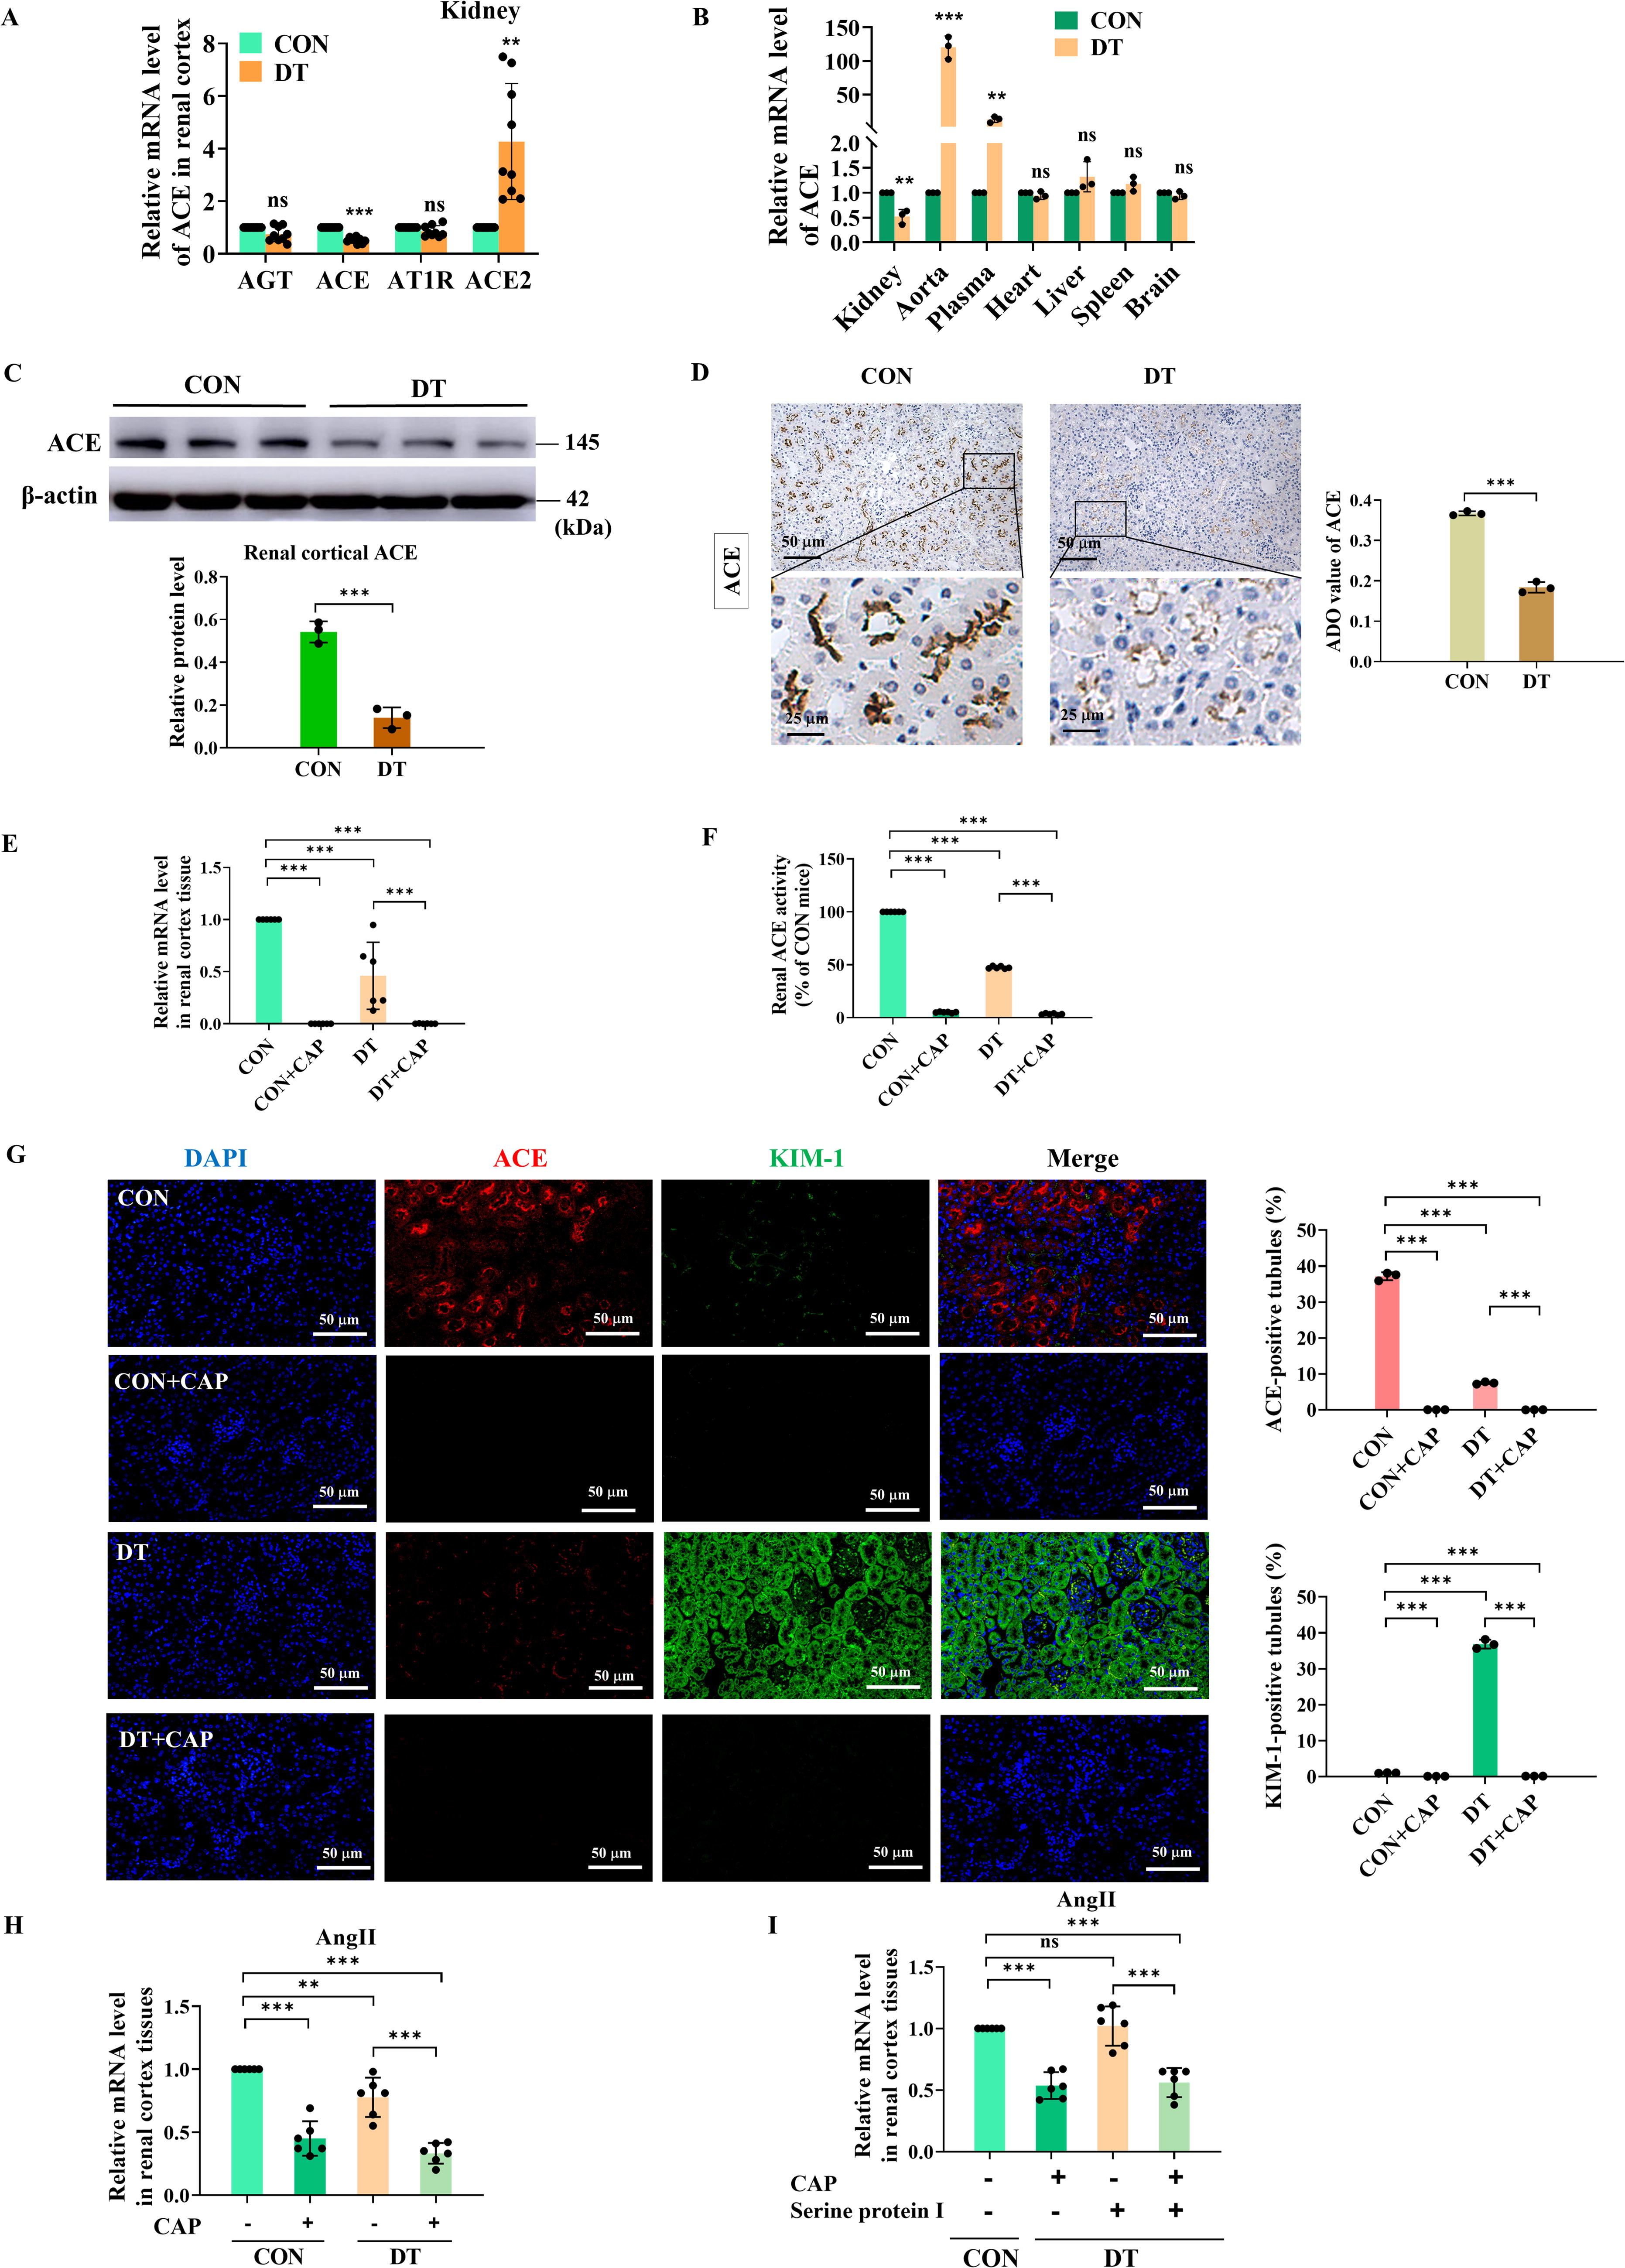
IHC staining displayed the location of intrarenal ACE in renal cortex (Fig. 3D). Compared with DT mice, the proximal tubules of CON mice were markedly immunolabeled with ACE, while ACE expression in glomeruli was barely detected. The primary site of ACE expression was proximal tubule brush border. These results suggested that ACE was decreased in DT mice and the intrarenal expression of ACE was mainly concentrated in renal tubules.
Minimal quantities of intrarenal ACE are adequate to correlate with diabetic tubular injury
To simultaneously assess tubular injury and ACE expression in diabetic conditions, we then performed the immunofluorescent (IF) co-staining of ACE and KIM-1 (Fig. 3G). The IF co-staining result showed that DT mice displayed significantly lower expression of ACE compared with CON mice. However, KIM-1 was substantially immunolabeled in diabetic renal tubules. Importantly, CAP treatment significantly reduced the ACE and KIM-1 immunostaining in the renal cortex of CON and DT mice. This finding further lent credence to the notion that although intrarenal ACE was reduced in DT, renal tubules were the site where intrarenal ACE impacted, indicating the potential involvement of intrarenal ACE in the pathogenesis of DT.
Intrarenal AngII generation is ACE-dependent in DT
Given that intrarenal AngII and ACE were involved in tubular injury in DT, we then delved into the correlation between them. RT-qPCR result (Fig. 3H) showed that there was a concurrent decrease in the expressions of intrarenal AngII and ACE in renal cortex tissues. Additionally, serine protein I-dependent intrarenal AngII has been involved in the development of type 2 diabetic renal vascular diseases (Park et al., 2010). However, in our DT model, the downregulation of AngII expression in renal cortex tissues was achieved by administering ACEI rather than the serine protein that was proposed in the previous study (Park et al., 2010). AngII downregulation failed to reach statistical significance in serine protein group, whereas AngII was significantly downregulated with the incorporation of CAP (Fig. 3I). This preliminarily suggested that AngII might exert functions relying on ACE in DT.
Tubular mitochondrial membranes disruption and ROS overgeneration in DT are partially alleviated by ACEI
RTECs possess abundant mitochondria to meet high-energetic demands (Bhargava and Schnellmann, 2017). We employed transmission electron microscope (TEM) to evaluate the tubular mitochondrial ultrastructure (Fig. 4A). Compared with CON group, DT mice displayed considerable mitochondrial ultrastructure disruption. It was evident by swollen morphology, irregular intermembranes, and disordered cristae with enlarged intercristal width and increased cristae junctions, or even absent cristae. As estimated, DT mice had significantly decreased mitochondrial length/width ratio, size, and crista number (Fig. 4B).
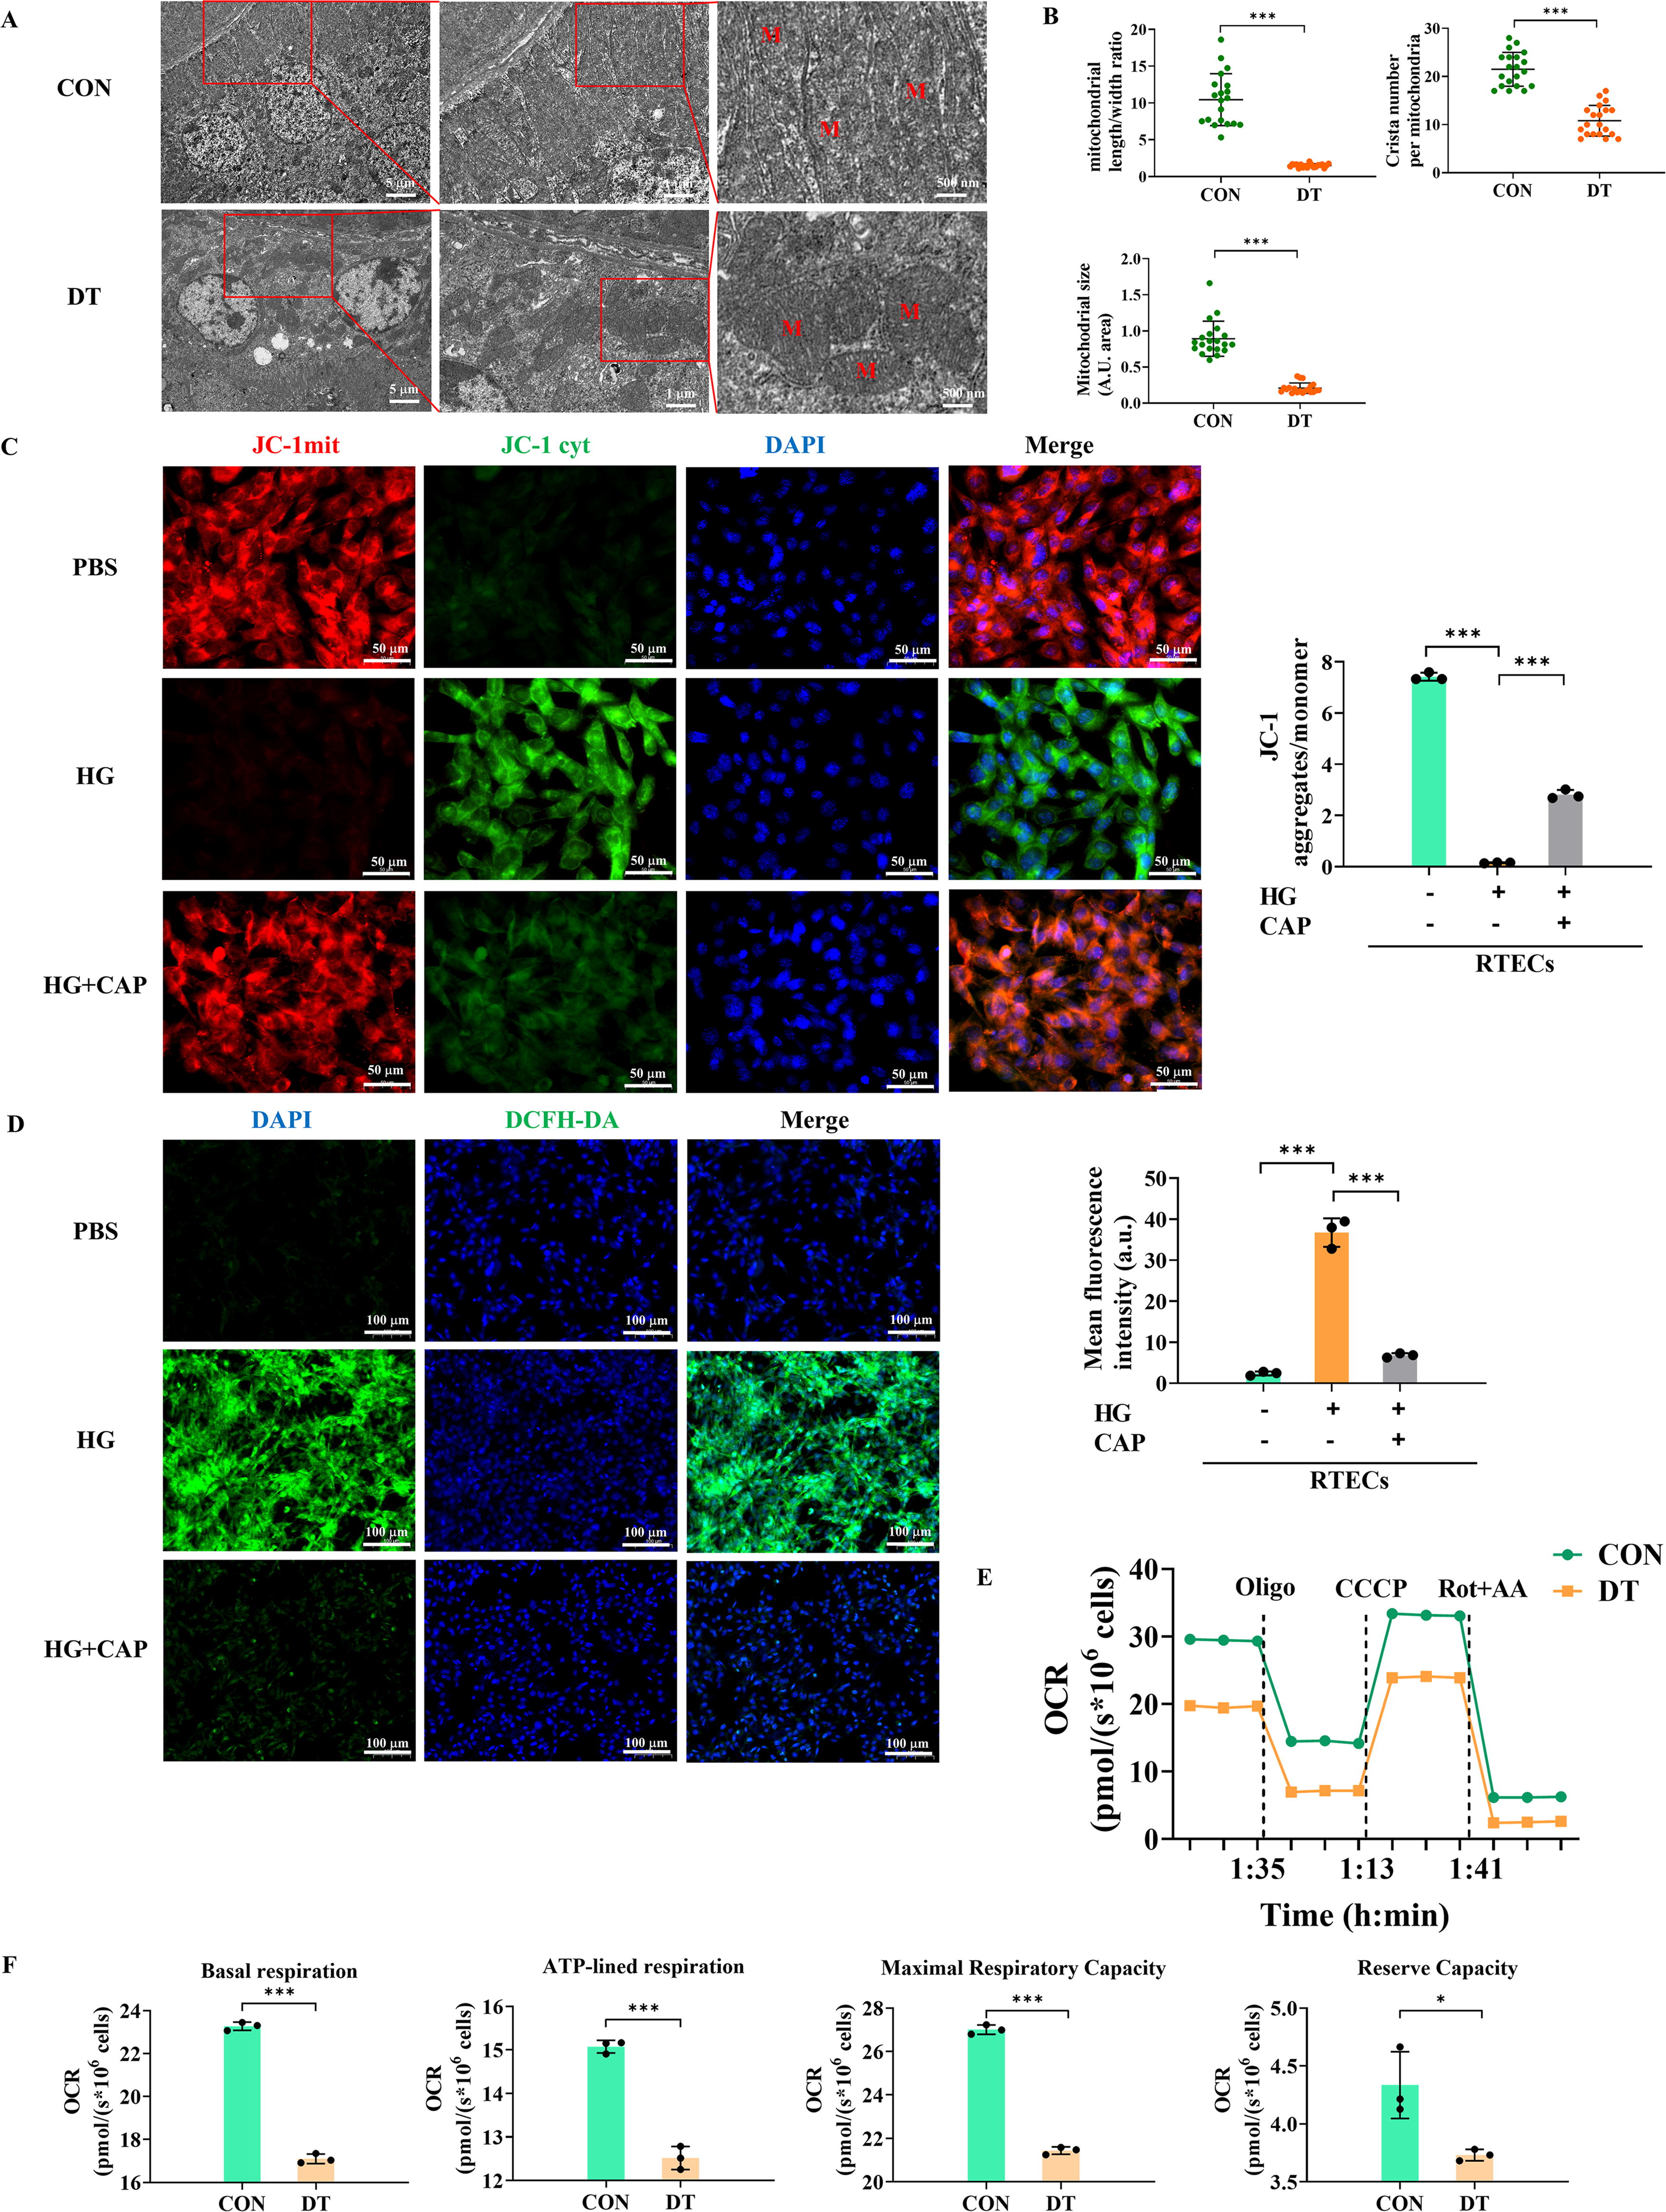
Maintaining mitochondrial membrane potential (MMP), produced by proton pumps in electron transport system, is crucial to mitochondrial membranous function (Liu et al., 2022; Xu et al., 2023). Confocal microscopy revealed that HG treatment significantly reduced the MMP of RTECs with decreased JC-1 fluorescence intensity (an MMP fluorescent probe) (Fig. 4C). Excessive accumulation of ROS is also an important event in the aftermath of mitochondrial membranous disruption (Veluthakal et al., 2024; Zorov et al., 2014). As evaluated by confocal microscopy using 2′-7′-dichlorofluorescin diacetate (DCFH-DA) staining, HG significantly enhanced tubular ROS generation (Fig. 4D). Notably, CAP treatment partially improved MMP and reduced ROS generation in HG-treated RTECs. Abnormal mitochondrial membranes, which contain multiple OXPHOS enzymes, impair mitochondrial respiration (Veluthakal et al., 2024). Subsequently, we assessed mitochondrial respiration in primary RTECs using Oroboros Oxygraph-2k (O2k) respirometer (Fig. 4E, F). A high-resolution respirometry showed that O2 consumption of RTECs isolated from DT mice was significantly decreased compared with CON mice, indicating the diminished mitochondrial OXPHOS capacity of diabetic RTECs.
Thus, diabetic exposure induced the abnormal structure and function of tubular mitochondrial membranes, with excessive ROS generation and reduced mitochondrial OXPHOS capacity, which could be potentially ameliorated by ACEI.
PCYT2 is enriched in RTECs and interacts with ACE
PCYT2, as the rate-limiting enzyme for PE synthesis, has been involved in mitochondrial disturbances (Gohil et al., 2013; Signorell et al., 2009). We subsequently investigated PCYT2 involvement in diabetic tubular injury. According to the protein–protein interaction (PPI) network established by GeneMANIA, PCYT2 functioned in conjunction with ACE (Fig. 5A). The Human Protein Atlas (HPA) database was utilized to determine the PCYT2 expression profiles in tissue distribution (Fig. 5B, C) and various renal cell types (Fig. 5D, E). It turned out that the kidney was ranked among the top four PCYT2-enriched organs (Fig. 5B, C). Compared with other renal cells, PCYT2 was found in much higher abundance in proximal renal tubular cells (PRTECs) (Fig. 5D). Among the top-rank genes identified within renal cells and infiltrating immune cells, PCYT2 was recognized as the most abundant gene in PRTECs (Fig. 5E).

To further validate the PCYT2 expression within the kidneys, we reviewed and visualized the publicly available single-cell RNA sequencing (scRNAseq) datasets in DKD mice (Fig. 5F–H). We found that PCYT2 was expressed at a higher level in proximal renal tubules than in distal tubules and glomerular cells, suggesting PRTECs is the primary cell type that PCYT2 concentrated in DKD mice (Fig. 5F). Besides, compared with CON mice, renal cells of DKD mice displayed decreased levels of PCYT2 (Fig. 5G, H). Therefore, PCYT2 was identified as the enriched gene in PRTECs, and was therefore selected for subsequent experiments.
Renal tubular PCYT2 is downregulated in diabetes, which is related to tubular injury
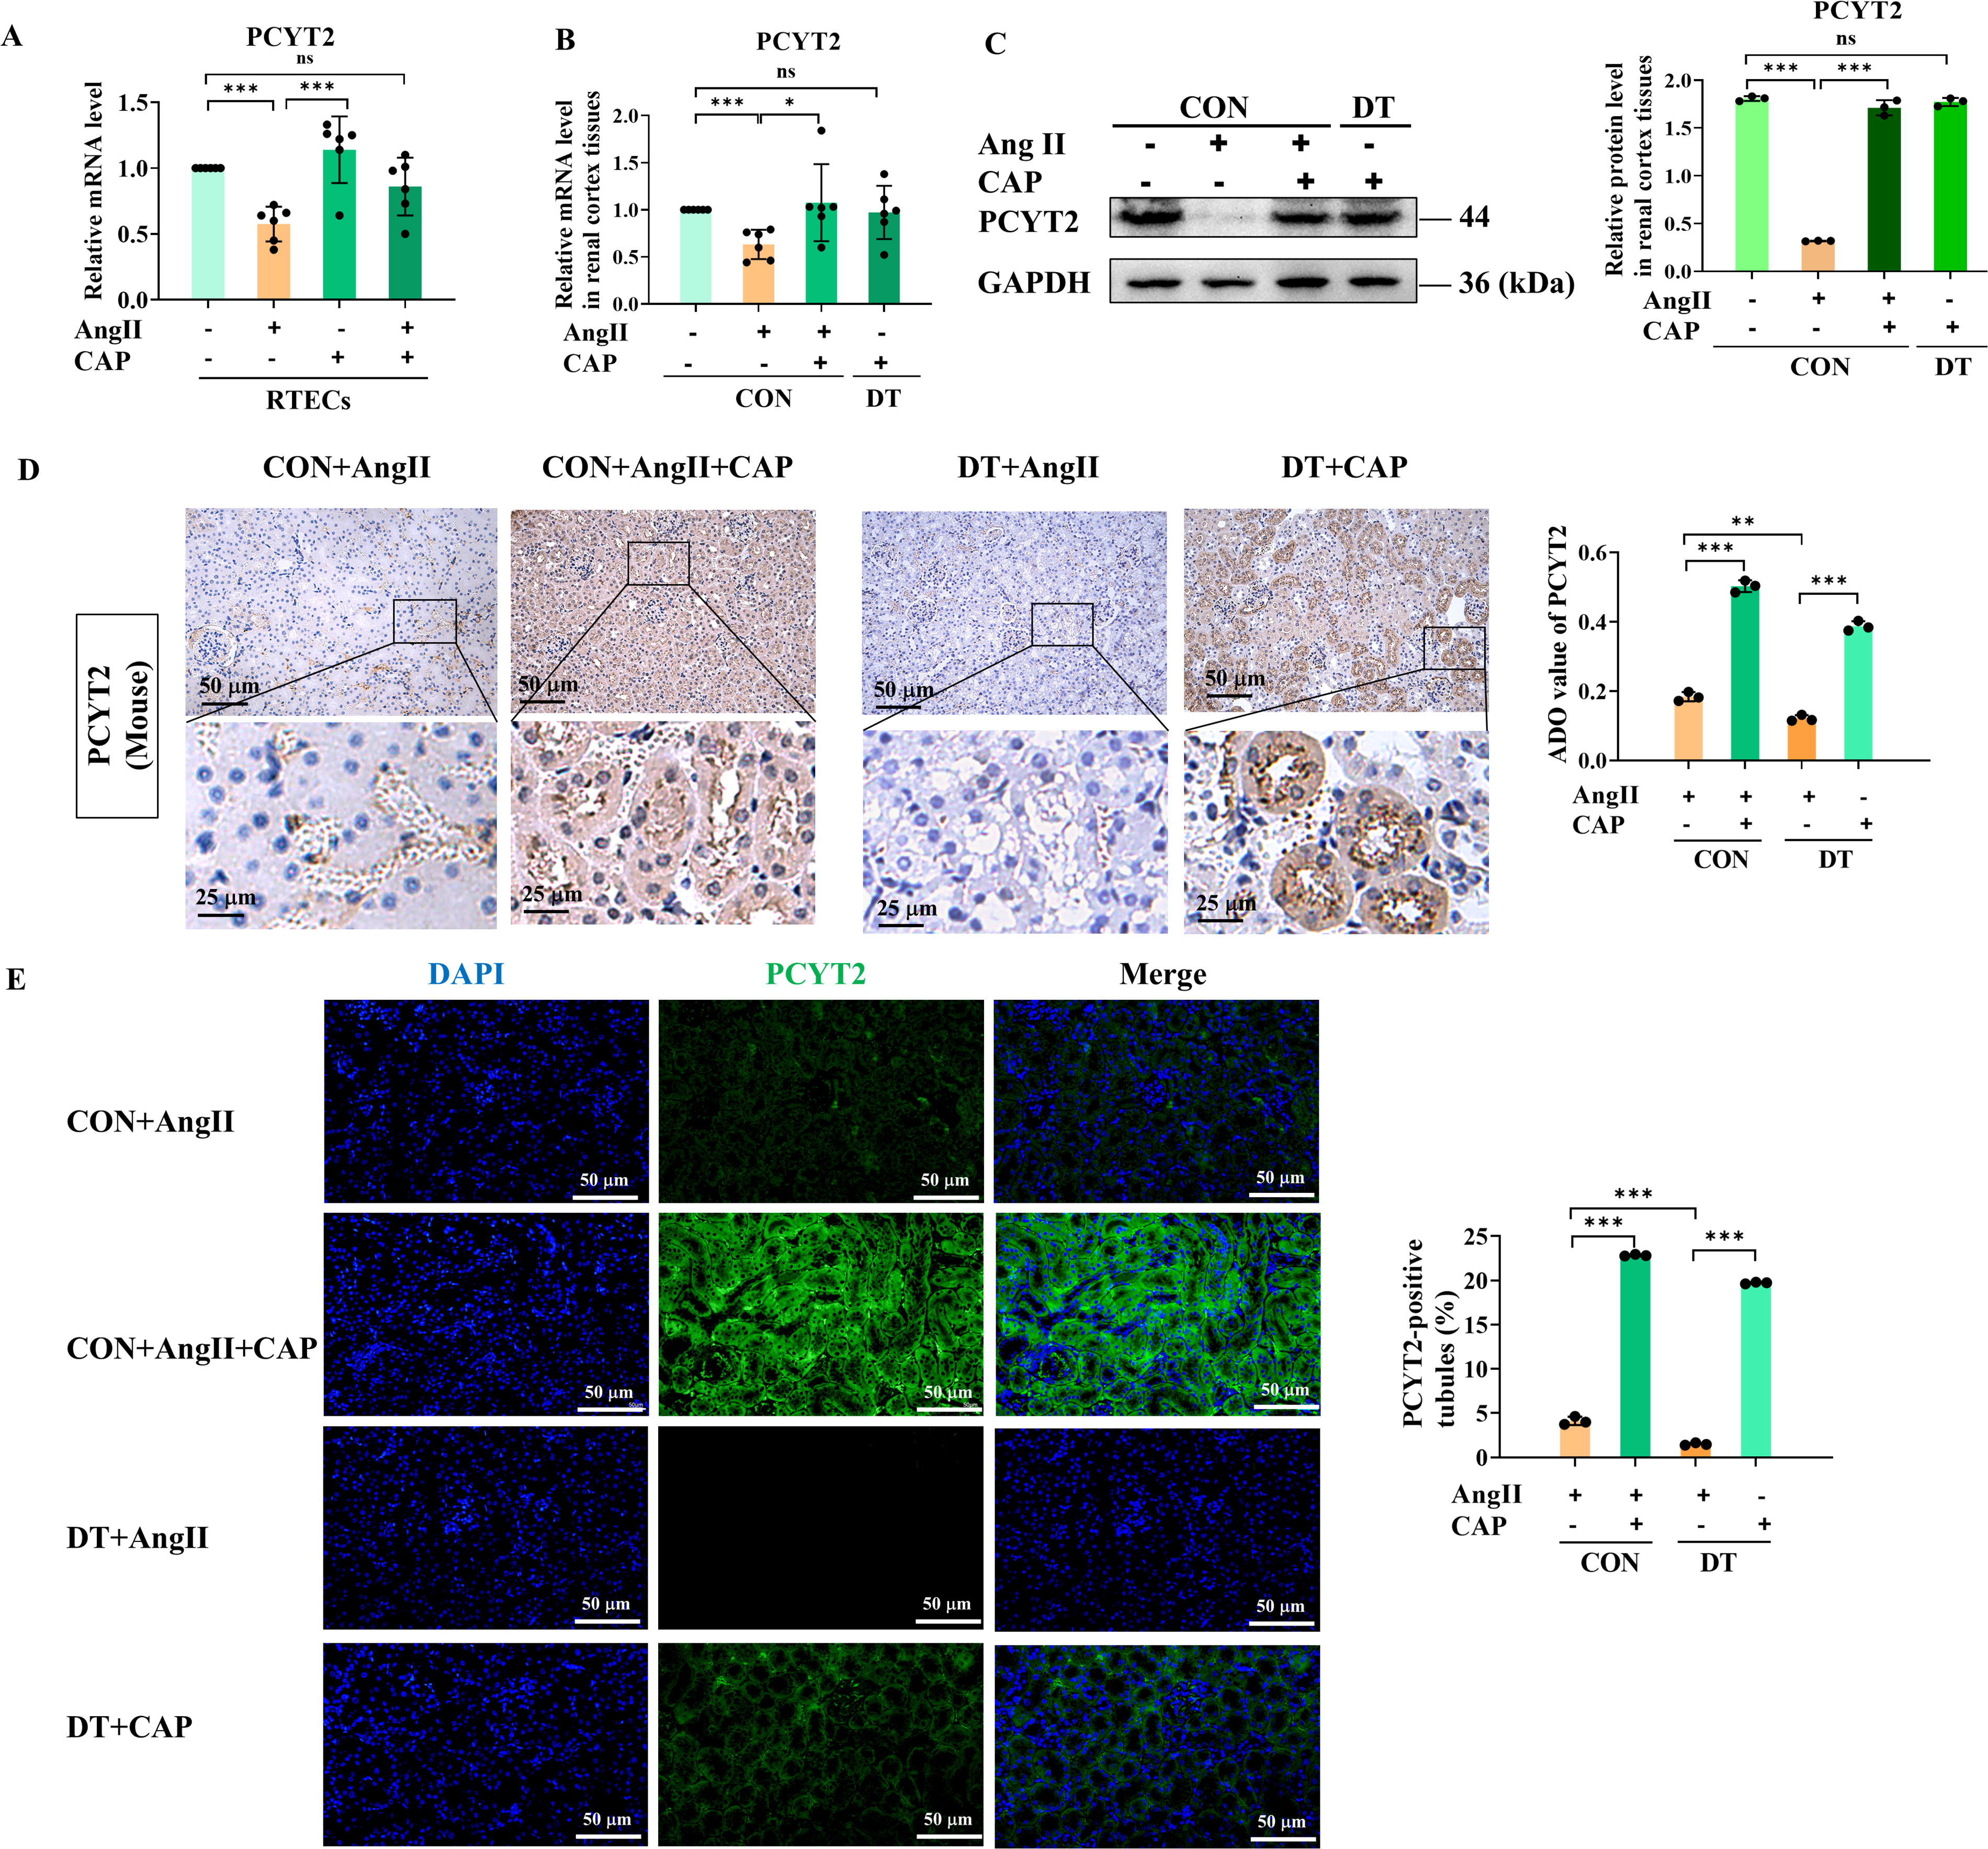
To investigate the PCYT2 involvement in DT in vitro, we assessed its expression in RTECs by RT-qPCR (Fig. 6A) and Western blot analysis (Fig. 6B), showing that PCYT2 expression was significantly decreased in the HG group compared with the NG and mannitol group. In vivo, compared with CON mice, RT-qPCR showed that diabetic induction caused a significant reduction in tubular PYCT2 expression (Fig. 6C), with a pronounced accumulation of its substrate PEtn (Fig. 6D). IHC staining (Fig. 6E) further validated the tubular PCYT2 suppression in DT mice. To evaluate the correlation between patient prognosis and AngII/PCYT2, we performed the IF co-staining of AngII, PCYT2, and KIM-1 in human renal biopsy tissues. We found that the decrease in AngII and PCYT2 levels coincided with a negative DKD patient prognosis, as indicated by an elevation in renal tubular injury marker KIM-1 (Fig. 6F). Interestingly, PCYT2 suppression in DT mice was effectively improved by CAP, according to RT-qPCR (Fig. 8A, B), Western blot analysis (Fig. 8C), IHC staining (Fig. 8D), and IF staining (Fig. 8E). These results suggested that PCYT2 expression was downregulated in diabetic renal tubules, in which AngII showed a consistent decrease in expression, indicating the potential role of AngII and PCYT2 in diabetic tubular injury.

ACE-independent intrarenal AngII-induced membranous disruption and ROS overgeneration are aggravated by DT, which are partially mitigated by ACEI
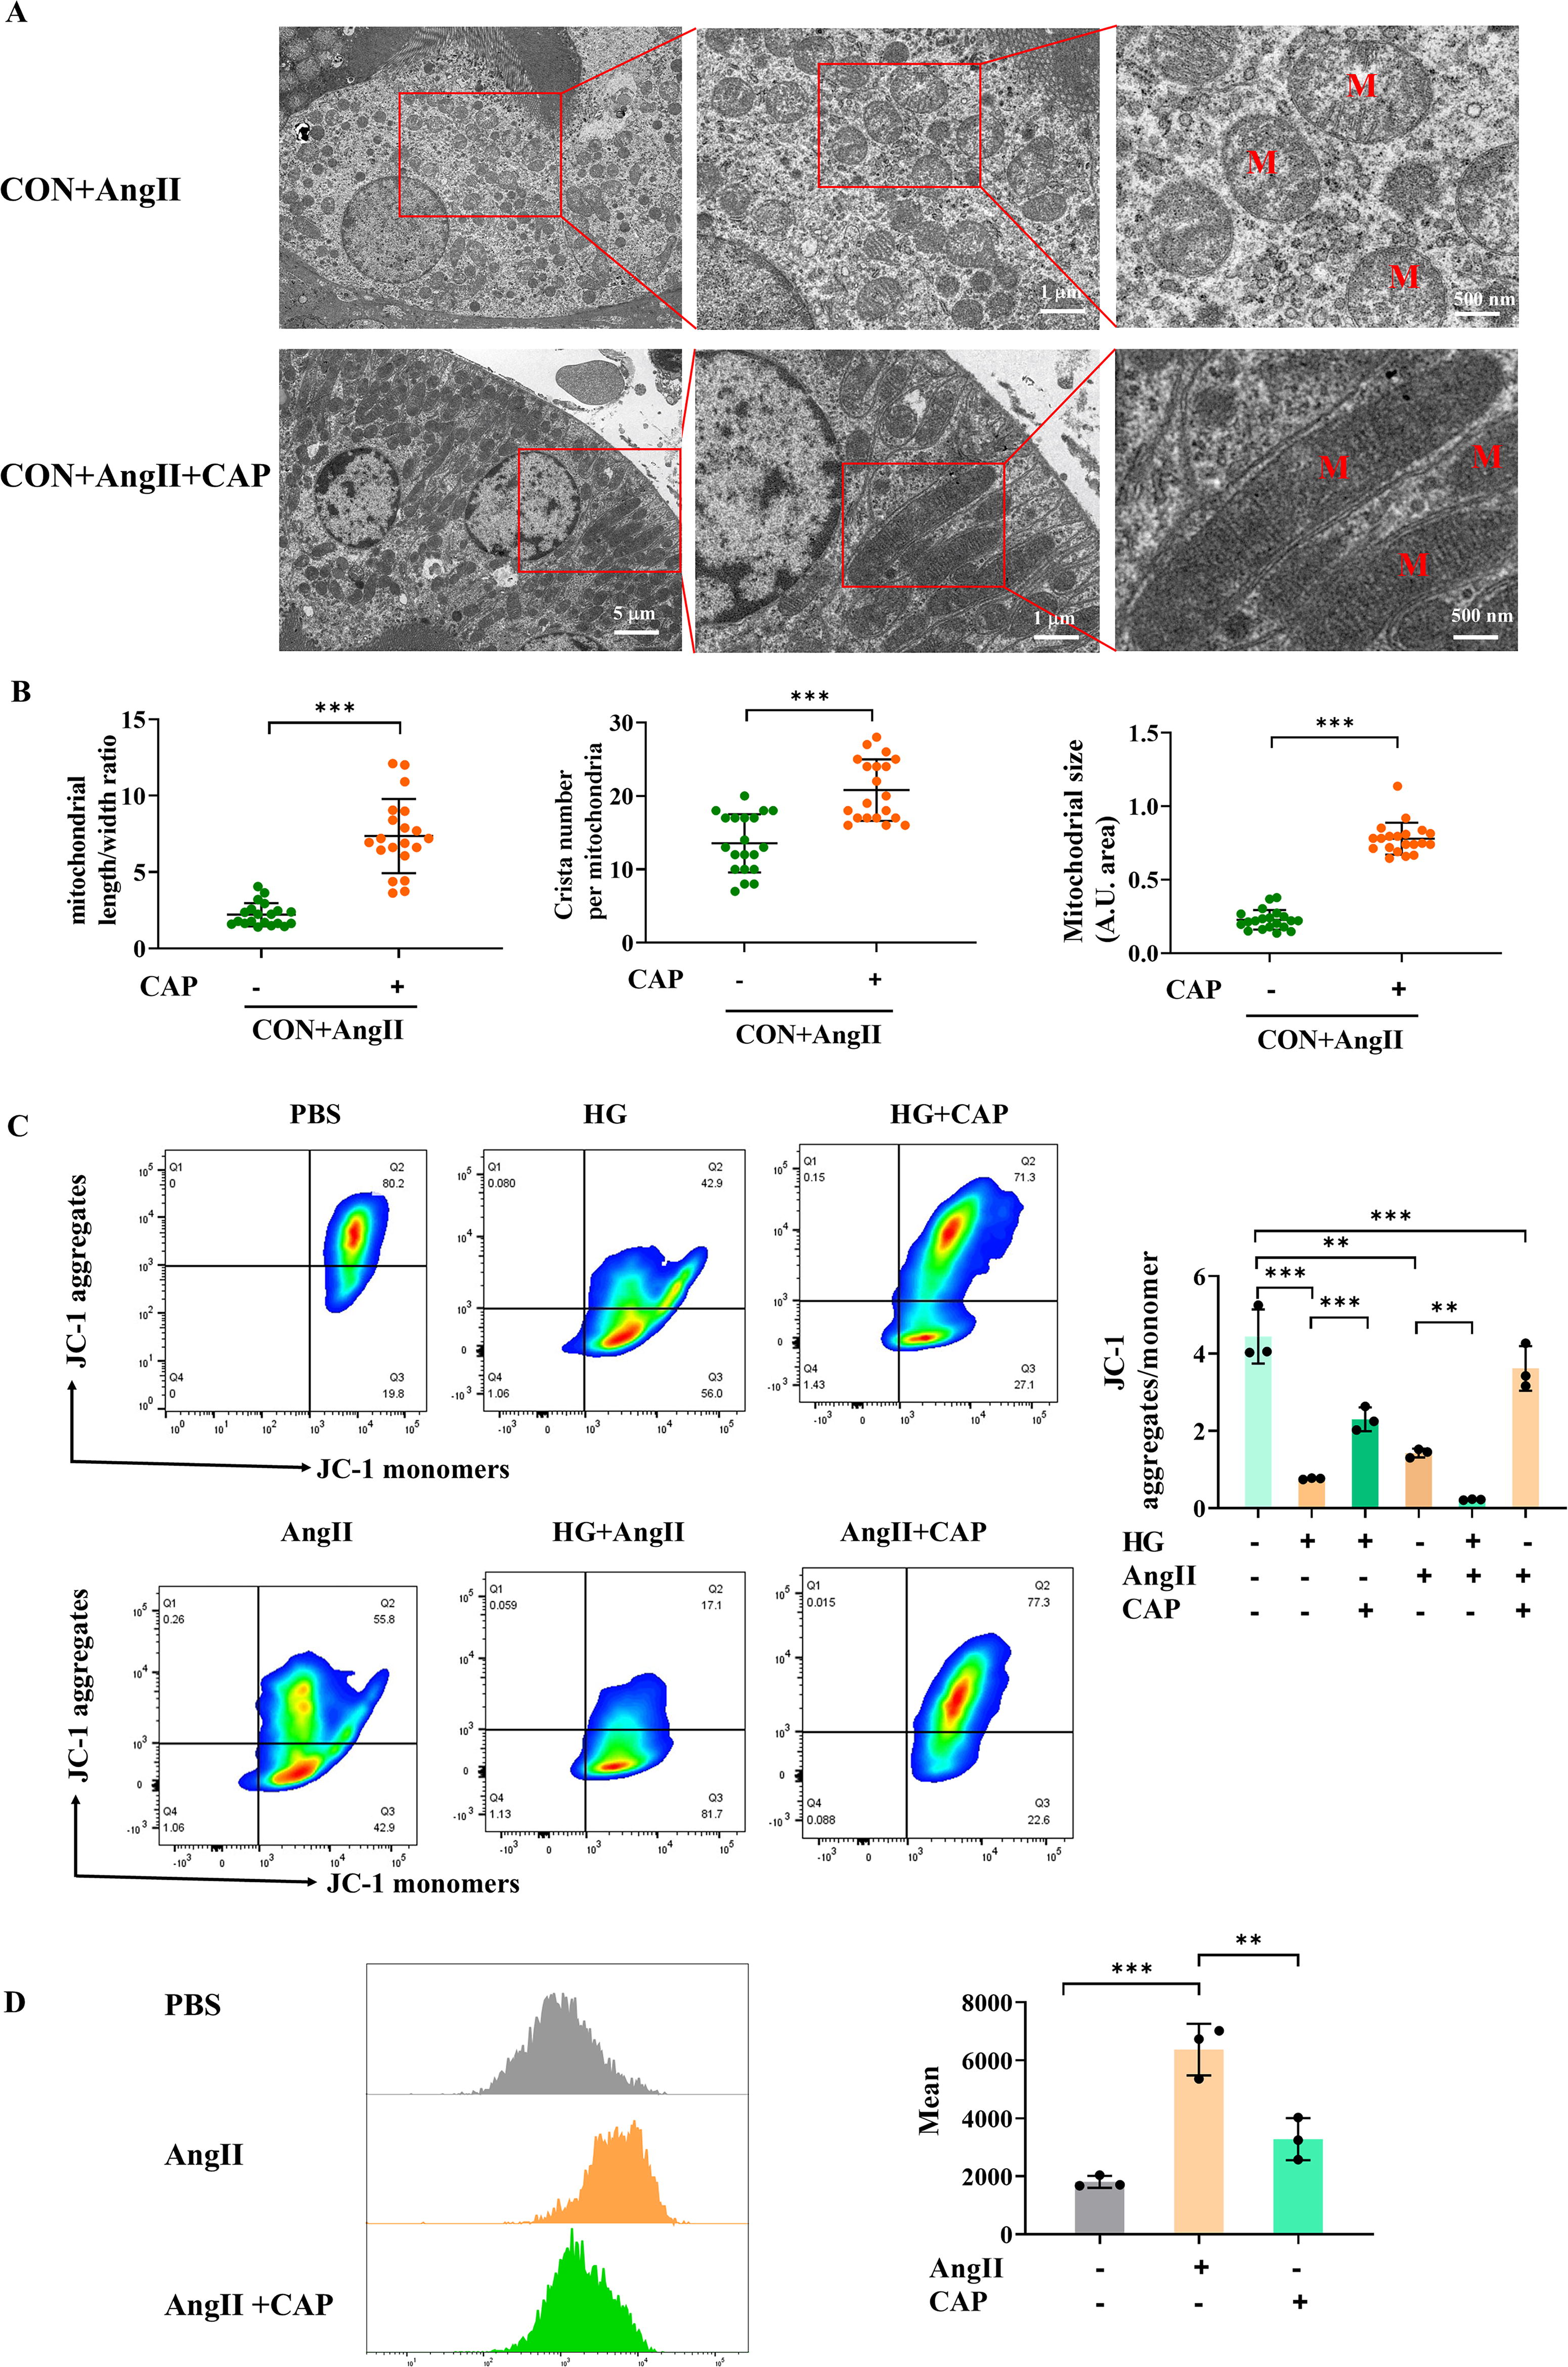
Next, we further investigate the potential mechanism by which AngII contributes to diabetic tubular injury. Given that diabetes accentuated the aberrant mitochondria of RTECs, it is important to investigate if ACE-independent intrarenal AngII contributes to mitochondrial abnormality. Consistent with DT mice, TEM revealed considerable mitochondrial ultrastructural disturbance in AngII-treated mice (Fig. 7A, B). As indicated by JC-1 flow cytometry, AngII significantly reduced MMP, which was more deteriorative in HG condition. Notably, CAP partially alleviated ultrastructural defects and improved the MMP (Fig. 7C). Additionally, flow cytometry of DCFH-DA staining demonstrated a significant increase in tubular ROS generation in AngII-treated RTECs, which could be alleviated by CAP (Fig. 7D). Therefore, ACE-dependent AngII interrupted tubular mitochondrial membrane and elevated ROS generation, a response that can be exacerbated by HG exposure and improved by ACEI treatment.
ACE-independent intrarenal AngII-induced tubular PCYT2 suppression is aggravated by DT, which is partially improved by ACEI
Since PCYT2 downregulation was found in diabetic tubules, we next explored whether ACE-independent intrarenal AngII also affected PCYT2 expression. In RTECs, RT-qPCR showed that AngII treatment significantly decreased PCYT2 expression (Fig. 8A). We then assessed the PCYT2 expression in renal cortex of AngII-treated mice pre- and post-diabetic induction. Consistent results were found in vivo, according to RT-qPCR (Fig. 8B) and Western blot result (Fig. 8C), AngII-treated mice displayed downregulated levels of PCYT2.
IHC (Fig. 8D) and IF (Fig. 8E) staining further confirmed the substantially decreased immunolabel PCYT2 in renal cortex of AngII-treated mice. Notably, diabetic exposure aggravated PCYT2 downregulation in AngII-treated mice. CAP administration brought partial improvement in AngII- and DT-induced PCYT2 suppression. Thus, ACE-dependent intrarenal AngII potentially caused PCYT2 downregulation in DT, in which diabetes aggravated downregulation and CAP offered therapeutic improvement.
Discussion
The contemporary trend in clinical practice increasingly focuses on early and preventive interventions for DKD (Shahzad et al., 2021). Recent studies propose the involvement of RAS in the onset of DKD (Lu et al., 2020), however, how intrarenal RAS causes diabetic renal tubular injury is not fully understood. This study demonstrates the critical role of ACE-dependent intrarenal AngII in the pathogenesis of DT, a culprit in early DKD. We report that ACE-dependent intrarenal AngII serves as a catalyst for disrupting mitochondrial membrane, increasing ROS generation and downregulating PCYT2 of RTECs, ultimately inducing diabetic tubular injury (Fig. 9).

The mainstay of current therapeutic strategies for DKD mainly targets glomerulus and relies on RAS inhibition. However, these therapies delay but do not halt or reverse DKD progression (Shahzad et al., 2021). In early DKD, tubular injury was recognized as the primary cause of microalbuminuria rather than hyperfiltration (Eriguchi et al., 2018). Despite being predominantly conceived as a glomerular disease (Eriguchi et al., 2018), DKD is also causally associated with proximal tubular defects (Liu et al., 2022; Mori et al., 2021) and tubule-targeted therapies potentially benefit the overall improvement (Gilbert, 2017; Liu et al., 2022).
In our previous research, we have reported the involvement of RAS activation in causing damage to proximal tubules in metabolic disorders (Liu et al., 2021). Unlike systemic RAS, intrarenal RAS is a local autocrine/paracrine system with angiotensin-dependent and -independent effects (Yang and Xu, 2017). An important factor influencing the DKD development is the involvement of intrarenal RAS. ACE was produced by various types of renal innate cells, including RTECs 32203081 (Eriguchi et al., 2018, Liebau et al., 2006). The blockade of ACE provided early protective effects against renal tubular injury in DT (Shahzad et al., 2021). Tubular epithelial ACE expression was downregulated in DKD (Eriguchi et al., 2018; Park et al., 2010; Ye et al., 2006). These observations were supported by our results of DT mice, showing that ACE level was markedly reduced in diabetic renal tissues. Conventional notion held that AngII was a short-acting and vasoactive hormone causing hemodynamic alterations in DKD (Burns, 2000). AngII has been causally associated with renal tubular lesions in previous studies. AngII-induced cellular hypertrophy in tubular cells, which was mediated by the synthesis and activation of endogenous transforming growth factor-β (Wolf et al., 1993; 1995). In our study, in conjunction with intrarenal ACE reduction, AngII concomitantly declined in renal tissues. An administration of ACEI, rather than serine protein I (Park et al., 2010), downregulated the intrarenal AngII expression, indicating AngII functions in a manner of ACE-dependence. We found that AngII caused the declined renal outcomes and tubular deterioration. The ACEI potentially alleviated these tubular detrimental effects, further confirming the ACE-dependent property of AngII. However, it is unclear how ACE-dependent intrarenal AngII ameliorated the diabetic renal tubular injury.
Next, we further investigated the underlying mechanism of ACE-dependent intrarenal AngII driving DT progression. RTECs are susceptible to mitochondrial bioenergetic disruption. Several novel mitochondria-targeted treatments for kidney diseases are being developed (Liu et al., 2022; Szeto, 2017). Indeed, oxidative stress resulting from ROS overgeneration is a causative factor of diabetic renal tubular injury (Li et al., 2019; Liu et al., 2022). In line with these reports, mitochondrial ultrastructural and functional membranous defects, excessive ROS generation, and decreased mitochondrial OXPHOS capacity were observed in our study. When the self-detoxification rate is exceeded, ROS manifests with substantially hazardous concentrations, despite being biologically generated as mitochondrial metabolites (Veluthakal et al., 2024). The disrupted mitochondrial membranes and ROS overgeneration could therefore partially explain the diabetic tubular injury. Moreover, the malfunctioning of renal mitochondria in hyperglycemia was influenced by the RAS (Li et al., 2019). We hypothesized that RAS components might exert detrimental effects on tubular mitochondria in diabetes. In our study, membranous defects were observed in intrarenal AngII-treated mice, which were accentuated under DT conditions. The treatment of AngII also resulted in an augmentation in the generation of tubular ROS. ACEI treatment alleviated this mitochondrial damage caused by intrarenal AngII, further indicating its effects were ACE dependent. To our knowledge, this study is the first report that identifies ACE-dependent intrarenal AngII as a crucial contributor to tubular mitochondrial membranous disruption and ROS overgeneration in DT.
The most intriguing finding of our study was that intrarenal ACE-dependent AngII downregulated the expression of tubular PCYT2, a crucial regulatory enzyme in the biosynthesis of PE (Cikes et al., 2023, Pavlovic and Bakovic, 2013). PCYT2 dysregulation has been linked to many clinical disorders, including diabetic liver injury (Grapentine et al., 2022; Xu et al., 2023). As yet, the understanding of dysregulated PCYT2 in DT is limited. In the present study, we demonstrated that ACE-dependent AngII reduced PCYT2 level in tubules, which was further aggravated by diabetes. Besides, a dismal prognosis was observed in patients with DKD with low tubular PCYT2 expression. A recent study indicated a high-affinity angiotensin II type 2 receptor (AT2R) in tubular mitochondria. AT2R overexpression in RTECs suppressed mitochondrial ROS production and cell proliferation during early diabetes (Micakovic et al., 2018). PCYT2 expression has been associated with cell proliferation, a process that requires phospholipid synthesis (Pavlovic and Bakovic, 2013). The detrimental impact of AngII/AT1R signaling on DKD is well documented (Micakovic et al., 2018). It is conceivable that the disproportionate effect of AngII on the two receptors may contribute to tubular PCYT2 downregulation in the early stage of DKD, which awaits further investigation.
In previous studies, suppressing PCYT2 resulted in mitochondrial inner membranous disruption for lacking disk-shaped cristae (Pavlovic and Bakovic, 2013). Abnormal accumulation of PCYT2 substrate PEtn limited mitochondrial respiration (Xu et al., 2023). It is therefore speculated that mitochondrial membranous injury may be attributed to ACE-dependent intrarenal AngII/PCYT2 downregulation, which renders diabetic tubular injury. On the other hand, downregulated PCYT2 reduced long-chain PE synthesis and lipidome, affecting mitochondrial lipid bilayer physicochemical properties (Cikes et al., 2023), thereby potentially compromising the mitochondria membranous structures and RTEC lipid bilayer stability. Although this causal relationship awaits further investigation, these observations help uncover a novel regulatory mechanism for ACE-dependent intrarenal AngII-mediated renal tubular injury in DT.
As per angiotensin receptor blocker (ARB), another widely utilized RAS inhibitor, single-cell transcriptome profile reveals that ARB is more prone to exhibit anti-inflammatory and anti-fibrotic effects on RTECs rather than affecting mitochondrial function (Wu et al., 2022) or mitochondrial pathway (Satoh et al., 2008). An ARB-neprilysin inhibitor prodrug combination could repair the mitochondrial DNA damage in diabetic kidneys, but mitochondrial membranous restoration was not discussed (Myakala et al., 2021). In this study, considering that AngII affected the mitochondrial membrane in a manner of ACE-dependence, ACEI was therefore selected to inhibit the RAS.
In the clinical setting, based on our findings, it is conceivable that the tubular PCYT2 delimitation in renal biopsy tissues makes it a promising candidate for early assessment and dynamic monitoring of DKD. Additionally, deno-associated virus-based delivery of PCYT2 contributed to PE synthesis and glucose homeostasis (Cikes et al., 2023). Instead of the phosphatidylserine decarboxylase pathway, supplementation with CDP-ethanolamine through PCYT2-targeted pathway (Xu et al., 2023) or artificial PCYT2 substrate (Cikes et al., 2023) could augment the PE production, potentially mitigating mitochondrial membrane damage in DT. In this study, the detrimental effect of ACE-dependent intrarenal AngII pre- and post-diabetic induction is partially, but not entirely, alleviated by ACEI. Our findings raise the possibility that combination therapy consisting of ACEI and PCYT2-targeted medicines may convey more beneficial effects on tubular injury than either intervention alone in patients with DT.
Limitations
A merit of the present study is to indicate a nonvasoconstrictor role for ACE-independent intrarenal AngII in influencing tubular mitochondria in DT. This study, like any, has limitations that warrant consideration. First, we need to identify the specific interactome between mitochondrial abnormalities and PCYT2, along with dosing the PCYT2-dependent PE levels in the kidneys. Additionally, future research will address the differential expression of PCYT2 in animal models and validate our in vivo results. Subsequent experiments will further explore the targeted pathways of PCYT2 under the influence of ACE-independent intrarenal AngII and its two receptors (AT1R and AT2R) in DT.
Conclusion
This study evolves our understanding of the mechanisms underlying DT, by identifying ACE-dependent intrarenal AngII as a pivotal evildoer of tubular mitochondrial membranous disruption, ROS overgeneration, and PCYT2 suppression. Diabetes aggravates the tubular detrimental effect of ACE-dependent intrarenal AngII. ACEI partially, but not completely, ameliorates ACE-dependent intrarenal AngII-induced tubular deterioration pre- and post-diabetic induction, raising the possibility that early combined therapy of ACEI and PCYT2-targeted medications conveyed more beneficial effects on tubular injury than either intervention alone in DT.
Materials and Methods
Human kidney samples
Kidney samples of patients with DKD were obtained from clinically indicated kidney biopsies according to the KDOQI and Chinese clinical guidelines (Expert Group of Chinese Society of Nephrology, 2021; National Kidney Foundation, 2012). Patients undergoing surgery for renal cell carcinoma offer normal adjacent renal tissues. Written informed consent was acquired from each participant. All protocols were approved by Human Ethics Committee of the First Affiliated Hospital of Jinan University (Permission No. 2018-041). The clinical characteristics of the patients were presented in Supplementary Table S1.
Animal models
Male C57BL/6J mice (20–25 g, 6 weeks old) were purchased from SPF Biotechnology Co., Ltd. All mice were maintained in a controlled environment (23 ± 1°C, 50 ± 5% relative humidity, 12-h light/dark cycle) with access to food and water ad libitum. Mice without AngII administration were randomly divided into two groups (n = 15 per group): (i) CON group: mice were fed with normal chow diet (67.4% carbohydrate, 12.0% lipid, and 20.6% protein, #XT101WC, Jiangsu Xietong Pharmaceutical Bio-engineering); and (ii) DT group: mice fed with 8-week HFD to induce insulin resistance (20.6% carbohydrate, 60.0% lipid, and 19.4% protein, #TP23300, TROPHIC Animal Feed High-tech Co., Ltd.). Then, a type 2 diabetic state was induced by a daily intraperitoneal injection of STZ (50 mg/kg) to the HFD-fed mice for 5 days (Mori et al., 2021, Wu et al., 2021, Yao et al., 2023, Zhou et al., 2023). Mice exhibiting FBG of 15.0–28.0 mmol/L were considered type 2 diabetic mice for subsequent experiments. The diabetic renal tubular lesions were assessed by tubular pathology and renal tubular injury markers.
Additionally, mice administrated with AngII were randomly divided into five groups (n = 5 per group): (i) CON+AngII, (ii) CON+AngII+CAP, (iii) DT+AngII, and (iv) DT+CAP group. The AngII was injected through left renal artery, a renal tissue-localizing injection approach (Baker et al., 2019, Hasin et al., 2011; Yamada et al., 2021). Fourteen-week-old mice were anesthetized (Pentobarbital sodium, 50 mg/kg, i.p.) and placed in supine position. An incision midline exposed the left kidney and renal artery. The needle branched into the renal artery after clamping left renal vein. Subsequently, 0.2 mg/kg of AngII (Sigma) dissolved in 0.2 mL phosphate buffer saline (PBS) was injected into the left renal artery (Hasin et al., 2011, Wysocki et al., 2010). For captopril administration, captopril (Sigma) was provided at 1 mg/mL (Sigma) in drinking water (Arikawa et al., 2007, KhatTab et al., 2005). Mice were intragastrically pretreated with captopril 30 min before AngII injection, as described previously (Hasin et al., 2011, Wysocki et al., 2010). A metabolic cage was used to collect urinary samples.
Twenty-four hours following all procedures, mice were sacrificed by cervical dislocation under anesthesia (Pentobarbital sodium, 50 mg/kg, i.p.). Orbital blood samples were collected. Both kidneys were separated and harvested.
Biochemical measurement
Serum and urinary samples of mice were obtained for biochemically measuring sCr, BUN, FBG, and other biochemical parameters using Labospect 008AS (Hitachi) with corresponding kits. All animal experimental protocols were approved by the Institutional Animal Care and Use Committee of the First Affiliated Hospital of Jinan University (Permission No. 32219008). All experiments complied with all relevant ethical regulations.
RTECs culture and treatment
The human PRTEC line, known as HK2 cells and transformed C3H mouse kidney-1 (TCMK-1) were purchased from the Cell Bank of the Chinese Academy of Sciences. RTECs were cultured in a mixture of dulbecco's modified eagle medium (DMEM)/Hams F12 (01-172-1ACS, Biological Industries) or minimum essential medium (MEM) (L550KJ, BasalMedia), supplemented with 10% fetal bovine serum (Gibco) and 1% penicillin–streptomycin (Gibco). RTECs were cultured at 37°C and 5% carbon dioxide concentration. The medium was substituted daily.
RTECs were treated with HG for 48 h in complete culture medium with 40 mM D-glucose. The controls were RTECs with 5.5 mM D-glucose or mannitol (Liu et al., 2022). To treat with AngII, RTECs were cultured with AngII at a final concentration of 1 μmol/L in complete culture medium (Lu et al., 2023).
Western blot analysis
Total proteins were extracted by immersing RTEC pellets or renal tissues in radio-immunoprecipitation assay (RIPA) lysis buffer, with 1% PMSF and 1% phosphatase inhibitors. BCA protein quantification kit (Beyotime) measured protein concentration. The proteins underwent separation using sodium dodecyl sulfate-polyacrylamide gel electrophoresis and were transferred to polyvinylidene fluoride membranes. Following a 1-h incubation with 5% bovine albumin V at room temperature, the membrane was exposed to primary antibodies against KIM-1 (#bs-2713R, Bioss, 1:1000), NGAL (#AF1757-SP, R&D Systems, 1:1000), ACE (#49627, SAB, 1:1000), and PCYT2 (#14827-1-AP, Proteintech, 1:1000) at 4°C overnight. GAPDH (#2118, CST, 1:1000) and β-actin (#4970, CST, 1:3000) were utilized as loading controls.
Following TBST washing steps, the membranes were incubated with secondary antibodies labeled with horse-radish peroxidase (#ZB-2301, ZS, 1:10000) at room temperature for 1 h. Subsequently, the membranes were exposed to ECL reagent (WBKLS0500, Millipore). The protein signals were visualized by a Tanon-5200CE imaging system (Tanon Science & Technology).
RT-qPCR analysis
Total RNA was extracted using TRIzol reagent (Thermo Fisher Scientific, Inc.). The concentration and quality of isolated RNA were measured by a NanoDrop 2000 spectrophotometer (Thermo Fisher Scientific, Waltham, MA). A total of 2 μg of total RNA from each sample was reverse-transcribed into complementary DNA (cDNA) using RevertAid First Strand cDNA Synthesis Kits (K1622, Thermo Scientific). The reverse transcription conditions were 25°C for 5 min (min), 42°C for 60 min and 70°C for 5 min. Subsequently, the mRNA expression levels of KIM-1, NGAL, PCYT2, and RAS components were assessed by RT-qPCR with specifically designed primers (Supplementary Table S2) and SYBR Green PCR Master Mix (Applied Biosystems) using a Bio-Rad CFX-96 real-time PCR System (Bio-Rad). RT-qPCR reaction conditions were 95°C for 2 min, followed by 40 cycles of 95°C for 15 s and 60°C for 1 min. The mRNA levels were standardized using GAPDH. The relative RNA expression was calculated using 2−△△CT method.
Enzyme-linked immunosorbent assay
The levels of NGAL in serum and urine were quantified using an NGAL mouse enzyme-linked immunosorbent assay Kit (#MM-0267M2, MEIMIAN, Jiangsu Meimian Industrial Co., Ltd.). The concentration of NGAL was assessed by comparing the average optical density measured at a wavelength of 450 nm. The intra-assay coefficient variation in NGAL was 5.8% and the inter-assay variation was 7.9% with a limit of quantification of 0.1 ng/mL.
Renal ACE activity assessment
ACE activity was measured in renal cortex homogenates using an enzymatic assay kit (#BC5540, Solarbio) according to the manufacturer’s instructions. ACE catalyzes and hydrolyzes substrate FAPGG to generate FAP and diglycyrrhizin. FAPGG has a characteristic absorption peak at 340 nm, and the ACE activity was calculated according to its change rate at 340 nm.
Histological analysis
Renal tissues were embedded in paraffin following 24-h 4% paraformaldehyde immersion. Paraffin sections (4 μm) were deparaffinized, rehydrated, and stained with standard H&E. Briefly, kidney sections were successively immersed in hematoxylin solution (3–5 min), hematoxylin differentiation solution, and hematoxylin bluing solution, rinsing with tap water for each interval, followed by 95% ethanol (1 min) and eosin dye (15 s). The sections were then sealed with neutral gum, after dehydration steps with three consecutive absolute ethanol, twice normal butanol, and twice xylene (2 min each). Tubular injury score was calculated following the methodology previously described (Howard et al., 2012). The variables comprised tube dilation, brush-border loss, cast development, and cell lysis/vacuolization/sloughing. Each score was rated 0–4. The observer was uninformed of protocol assignments.
Immunofluorescence and immunohistochemistry
For IF labeling, renal tissues were fixed, blocked with 30% goat serum, and incubated with primary antibodies against AngII (#abs120050, Absin, 1:500), KIM-1 (#bs-2713R, Bioss, 1:200), ACE (#49627, SAB, 1:500), and PCYT2 (#14827-1-AP, Protentech, 1:200). Following PBS washing steps, kidney sections were incubated with fluorescence-conjugated secondary antibodies, and the nuclei were stained with DAPI. Images were obtained using fluorescence microscope (NIKON digital sight DS-FI2 digital).
For IHC, microwave-based antigen retrieval was applied to deparaffinized and rehydrated sections. Primary antibodies KIM-1 (#bs-2713R, Bioss, 1:1000), NGAL (#AF1757-SP, R&D Systems, 1:500), and PCYT2 (#14827-1-AP, Protentech, 1:500) were incubated. Images were obtained by a DM IL LED microscope (Leica Microsystems GmbH). Image J software (Wayne Rasband, National Institutes of Health [NIH]) was utilized to quantify the protein immunolabeling.
Datasets and PPI network analysis
Expression profiles of PCYT2 in different renal cell types and tissue distribution were obtained from the HPA database (https://www.proteinatlas.org/; accessed on 30 March 2024) (Tsitrina et al., 2023).
The GeneMANIA database (http://genemania.org/) was utilized to generate a PPI network between ACE and its closely interacted genes. The outer circle represents genes with the closest predicted interactions.
Single-cell RNA sequencing
The expression of PCYT2 in diabetic mouse kidney scRNAseq data were interrogated from the publicly available dataset. We determined the PCYT2 expression of the cell types that we clustered, including PRTECs, distal RTECs, and glomerular cells. Statistical tests and visualization for scRNAseq analysis were performed using R package Seurat v4.0.0.
Mitochondrial assessment
TEM for mitochondrial morphology
Renal cortex tissues (1 mm3 pieces) were immersed in 2.5% glutaraldehyde and stored at 4°C for 4 h. Tissues were rinsed with 0.1 M phosphoric acid prepared in PBS (PH7.4) and then post-fixed with 1% osmic acid-0.1M phosphate buffer prepared in PBS (PH7.4) for 2 h at room temperature. After dehydrating in ethanol to acetone, sections were infiltrated and embedded in acetone. Kidney sections (60–80 nm) were stained with 3% uranium acetate-lead sodium citrate. Images of mitochondrial ultrastructure were captured using TECNAI G2 20 TWIN (FEI).
Mitochondrial membrane potential
The alteration in MMP was assessed with an MMP assay kit using JC-1 fluorescence (#C2006, Beyotime), as previously described (Li et al., 2024, Lu et al., 2024, Sun et al., 2024, Wen et al., 2024). Briefly, RTECs plated at a density of 6 × 10⁵ cells/well on a 6-well plate were treated with JC-1 working buffer (5×) at 37°C for 20 min and washed twice with JC-1 dye buffer (1×). The fluorescent signals were promptly examined using Zeiss LSM 800 confocal microscopy or BD FACSCanto flow cytometry (BD Biosciences). Monomeric and aggregated JC-1, which generate red and green fluorescence, were identified at 514/529 and 585/590 nm (excitation/emission). The quantification of JC-1 fluorescence density was performed using image processing software (Image J, Wayne Rasband, NIH), and normalized as JC-1 aggregates/monomer ratio.
Reactive oxygen species
Cytosolic ROS were detected by DCFH-DA staining (#S0033M, Beyotime). RTECs were incubated with 10 µM DCFH-DA working solution for 20 min at 37°C, at a density of 5 × 10⁵ cells/well in a six-well cell culture plate. RTECs were then trypsinized, centrifuged, and re-suspended in 300 µL PBS. The fluorescent signals were promptly analyzed using Zeiss LSM 800 confocal microscopy and BD FACSCanto flow cytometry (BD Biosciences).
Mitochondrial oxygen consumption rate
The mitochondrial respiration of RTECs was detected by high-resolution respirometry, O2k (Oroboros Instruments) (Gao et al., 2023, Gnaiger, 2003). Briefly, the freshly mouse primary RTECs were isolated from renal tissues (1 mm3 pieces) using 32% Percoll gradient centrifugation (#17-0891-09, GE Healthcare) (DeWolf et al., 2022, Kim et al., 2020). The primary RTECs resuspended in DMEM/Hams F12 medium at 2 million cells/mL were transferred into each respirometer chamber. In each chamber, oxygen was permitted to enter and subsequently sealed. Baseline respiration was measured. Substrates and inhibitors of each electron transfer chain complex were orderly introduced into the chambers after stabilizing respiration curves. Oligomycin (5 mM, Sigma) as ATP synthase inhibitor; carbonyl cyanide m-chlorophenyl hydrazone (1 mM, Sigma) as uncoupler; Rotenone (1 mM, Sigma) as complex I inhibitor; Antimycin A (5 mM, Sigma) as complex III inhibitor. The software DatLab 7.4 was employed for real-time analysis and data acquisition.
Statistical analysis
The data were displayed as mean ± standard deviation. Student’s t-test compared two groups, while analysis of variance followed by Bonferroni’s test tested multiple comparisons. At least three separate experiments were carried out. The differences were assessed using GraphPad Prism 8.0 (GraphPad Software Inc., San Diego, CA). Statistical significance was determined when p < 0.05. The electronic laboratory notebook was not used.
Ethics approval and consent to participate
The studies involving human participants were reviewed and approved by the Ethics Committee of the First Affiliated Hospital of Jinan University (Permission No. 2018-041). The participants provided their written informed consent to participate in this study. All animal experimental protocols were approved by the Institutional Animal Care and Use Committee of Jinan University (Permission No. 32219008).
Footnotes
Acknowledgments
The authors acknowledge the patients for allowing the use of their biopsy samples and data for research purposes. The authors are grateful to Rachel Granham for English language revision.
Authors’ Contributions
Y.M., L.-H.Y., and R.-C.C. designed the studies, supervised the study, and edited the article. X.-Q.L. and Z.-Z.X. designed and conducted the experiments and co-wrote the article. K.M. performed the scRNAseq analysis and graphical visualization. X.-Y.L., H.-H.L., and B.H. analyzed the data and prepared figures. Q.Z. and H.-Y.L. performed the dataset analysis. All authors contributed to the article and approved the submitted version.
Author Disclosure Statement
The authors have no conflict of interest to declare.
Funding Information
This work was supported by the National Natural Science Foundation of China (82270756), China Scholarship Council program (202406780041), Guangdong Basic and Applied Basic Research Foundation (2024A1515011405); Guangdong Engineering Technology Research Center (507204531040), Guangzhou Development Zone Entrepreneurship Leading Talent Project (2017-L153), Guangzhou Entrepreneurship Leading Team (202009030005), Heyuan City Science and Technology Plan Project (230510171473347), and Heyuan City Science and Technology Plan Project (230510171473346).
Supplementary Material
Supplementary Table S1
Supplementary Table S2
Abbreviations Used
References
Supplementary Material
Please find the following supplemental material available below.
For Open Access articles published under a Creative Commons License, all supplemental material carries the same license as the article it is associated with.
For non-Open Access articles published, all supplemental material carries a non-exclusive license, and permission requests for re-use of supplemental material or any part of supplemental material shall be sent directly to the copyright owner as specified in the copyright notice associated with the article.