
Abstract
The field of astrobiology lacks a universal marker with which to indicate the presence of life. This study supports the proposal to use nucleic acids, specifically DNA, as a signature of life (biosignature). In addition to its specificity to living organisms, DNA is a functional molecule that can confer new activities and characteristics to other organisms, following the molecular biology dogma, that is, DNA is transcribed to RNA, which is translated into proteins. Previous criticisms of the use of DNA as a biosignature have asserted that DNA molecules would be destroyed by UV radiation in space. To address this concern, DNA in plasmid form was deposited onto different surfaces and exposed to UVC radiation. The surviving DNA was quantified via the quantitative polymerase chain reaction (qPCR). Results demonstrate increased survivability of DNA attached to surfaces versus non-adsorbed DNA. The DNA was also tested for biological activity via transformation into the bacterium Acinetobacter sp. and assaying for antibiotic resistance conferred by genes encoded by the plasmid. The success of these methods to detect DNA and its gene products after UV exposure (254 nm, 3.5 J/m2s) not only supports the use of the DNA molecule as a biosignature on mineral surfaces but also demonstrates that the DNA retained biological activity. Key Words: Extraterrestrial life—Biosignature—UV radiation—DNA—Ultramafic. Astrobiology 10, 285–292.
1. Introduction
T
However, the question remains as to how the presence of life can be recognized. This is problematic in that there is no clear definition of life that satisfies all the sciences (Chyba and McDonald, 1995; Cleland and Chyba, 2002), which leads to difficulty in establishing a biological marker or molecule whose production requires biological activity. Past research has proposed the use of the following types of biological markers: geochemical indicators such as carbon isotope ratios (Simoneit et al., 2004), biological marker gases like methane (Villanueva et al., 2008), and biomolecules such as proteins or amino acids (Boillot et al., 2002), lipids, nucleic acids, or some combination thereof (Parro et al., 2008). Each of these biological markers has its uses and its potential abiotic production mechanisms; here, we investigate the potential use of nucleic acids as a signature of life (biosignature). The choice of this molecule is based on the following three observations. First, nucleic acids are present in all forms of life on Earth. Second, the formation of polymeric, double-stranded DNA is unlikely under strictly abiotic conditions (Berger, 2003; Trevors, 2003). Other potential biological markers, such as polycyclic aromatic hydrocarbons, muramic acid, fatty acids, amino acids, or chemical signatures (such as isotopic ratios), can be produced chemically (Becker et al., 1997). Third, polymer nucleic acid detection methods like polymerase chain reaction (PCR) are highly specific and sensitive, with the ability to detect a single DNA molecule in a sample and surpass chemical detection methods (Pääbo et al., 1989). The use of PCR also allows researchers to determine any possible contamination by sequencing the amplified DNA and identifying it (Whitby et al., 2000).
Despite their enticing qualities, nucleic acids are not considered good biological markers due to the sensitivity of the molecules to external stresses as compared to other biological markers, such as proteins (Mileikowsky et al., 2000b). Amino acids, for example, can survive space conditions when they are shielded by UV-absorbing minerals (Boillot et al., 2002). Measurements of DNA fragility were made under terrestrial conditions (aqueous environments, positive temperatures) (Dose et al., 1991; Lindahl, 1993). The behavior of this molecule under the extreme conditions found in space is not clear and requires new investigation (Mileikowsky et al., 2000b). The decay of extracellular DNA has rarely been analyzed, partly due to the idea that DNA survivability must be reduced with time (Lindahl, 1993). However, early research has indicated that, even on Earth, environmental conditions exist that can preserve DNA, such as arid and cold regions ( Pääbo, 1985; Höss et al., 1996; Orlando, 2000), reducing buffers (Eglinton and Logan, 1991), adsorption under clay particles (Romanowski et al., 1991; Demanèche et al., 2001), or when in bone (Tuross, 1994). One study predicted that DNA could be unexpectedly well preserved under space conditions (Dose et al., 1995).
In space or on a planet like Mars, the degradation of DNA is mediated via three factors: (i) space radiation, mainly UV; (ii) vacuum or low pressures, which encourage strand breaks, mutations, and cross-linking; and (iii) level of hydration, with more-hydrated DNA being vulnerable to greater damage (Folkard et al., 1999). UV radiation in space is by far the most deleterious factor for life and may have led to the sterilization of the martian surface (Pavlov et al., 2002). DNA is particularly sensitive to UVC (100–280 nm in wavelength), since it coincides with the spectrophotometric peak for DNA's aromatic structure at 254 nm, and the majority of the DNA lesions observed throughout space missions are due to UV exposure (Cockell and Andrady, 1999; Horneck, 1999; Saffary et al., 2002).
To determine the ability of DNA to survive in space, we exposed DNA, either non-adsorbed or adsorbed to a mineral substrate, to UV at 254 nm. We chose to associate the DNA with a mineral surface to mimic the most likely conditions for DNA to exist and because some binding interactions can protect against UV and desiccation (Franchi et al., 1999; Nicholson et al., 2000; Shirkey et al., 2003). The survival of the DNA was measured via the quantitative polymerase chain reaction (qPCR). In addition, the integrity and biological activity of the DNA were measured via transformation into Acinetobacter sp. and monitoring for antibiotic resistance.
2. Materials and Methods
2.1. Plasmid preparation
The bacterial plasmid pCEA (44.3% G + C content) served as the model DNA molecule in this research (Pontiroli et al., 2009). Previous studies have shown that the molecular size of the plasmid does not affect its sorption to different soil types (Romanowski et al., 1991), which thus permitted the use of a single plasmid size [7,006 base pairs (bp)] in this study. pCEA, which contains the aadA gene that confers resistance to the antibiotics streptomycin and spectinomycin, was maintained in the bacterium Escherichia coli DH5α or JM109, depending on availability (the strain chosen did not impact these experiments), in Luria broth (LB) media with spectinomycin (50 μg/ml). Prior to application to the surfaces and UV exposure, the plasmid was extracted with the QIAfilter™ Plasmid Maxi Kit (QIAGEN, Valencia, CA) and stored in TE buffer (10 mM Tris, 1.0 mM EDTA, pH 8.0) (Sambrook et al., 1989). Plasmid concentration and purity were measured spectrophotometrically (OD260/280) with a NanoDrop ND-1000 spectrophotometer. Plasmid identity was verified via restriction digest with XbaI (producing 3 fragments) and agarose gel electrophoresis.
2.2. Surface preparation
Three different surfaces were examined in this research: montmorillonite clay, crushed metamorphic gabbro rock, and quartz sand. All experiments were performed in duplicate or triplicate, unless stated otherwise, with error bars indicated on the graphs. The montmorillonite clay, chosen for its sorption qualities as well as its similarity to clays found on Mars (Schwartz et al., 1995; Poly et al., 2000), was washed with purified water before being stored at 4°C, as described previously (Poly et al., 2000). The clay particles were stabilized in a homo-ionic form with the use of calcium ions (Lozzi et al., 2001), and the particle size was restricted to between 0.2 and 2 μm to homogenize its interaction with the DNA. To obtain particles smaller than 2 μm, the clay suspension was allowed to settle at 20°C for 8 hours, and the bottom 10 cm of clay was discarded; the remaining suspension was then centrifuged for 13 minutes at 5000 × g and the supernatant discarded to ensure the particles were larger than 0.2 μm. The metamorphic gabbro rock, provided by UMR 5125 of Earth Sciences, University Claude Bernard Lyon I, came from ocean drilling in the Hess valley (Leg 147, Hole 894G, Core 4R, Sect 02, 089-093 PC # 11) and has a metal composition close to that of martian rocks or meteorites (Lécuyer and Gruau, 1996). This rock was used interchangeably with a more readily available metamorphic rock from Twin Sisters, Washington, USA. The quartz sand, from Fontaine Bleu, France, has a negatively charged surface and acted as a control, along with a borosilicate glass slide.
2.3. DNA deposition onto the surfaces
Less than 1 week prior to plasmid application, the plasmid DNA was purified from TE buffer via ethanol precipitation at −20°C (Sambrook et al., 1989) and resuspended in ultrapure water to avoid bias from the salts and EDTA in TE buffer. The plasmid DNA in water was deposited onto the different surfaces, with negative controls consisting of water droplets without DNA. The surface was rinsed to remove any non-adsorbed DNA, and the DNA remaining on the surface was then exposed to UV. Borosilicate glass slides, which were thoroughly cleaned with distilled water followed by 70% ethanol, were used as a support for these surfaces during UV exposure.
To allow DNA adsorption to the montmorillonite, 1 μg of DNA was added to a 5 mM CaCl2 solution containing 1.2 mg of clay; this DNA/clay ratio (0.83) has been shown to adsorb nearly all the DNA (Poly et al., 2000). The DNA-clay solution was mixed at 1200 rpm at 25°C for 2 hours and then centrifuged at 8000 × g for 20 minutes at 4°C. The supernatant was collected and stored. The pellet was washed twice with 40 μl of a 5 mM CaCl2 solution to remove all non-adsorbed DNA, and the supernatants were collected and stored. All the supernatants were later examined via agarose gel electrophoresis to verify the amount of DNA remaining on the surface. The DNA-clay pellet was suspended in either 40, 80, 160, 320, or 640 μl of 5 mM CaCl2 to provide different clay densities. These suspensions were deposited as 8 μl droplets on borosilicate glass slides and dried for 12 hours at 25°C at 25% humidity, with denser suspensions resulting in thicker clay layers.
For the crushed metamorphic gabbro rock and the quartz sand samples, 20 μl of a 40 ng/μl plasmid suspension was mixed with 250 mg of the crushed rock or sand in a 2 ml tube and allowed to adsorb for 1 hour. The samples were then washed with water for 5 seconds to remove any un-adsorbed DNA prior to deposition on borosilicate glass slides and UV exposure. To ensure that the borosilicate glass slides did not interfere with the UV exposure and DNA extraction, 5 μl of the plasmid DNA suspension containing 100 ng of DNA were deposited onto borosilicate glass slide controls and allowed to adsorb for 1 hour prior to rinsing with water and UV exposure.
2.4. UV exposure
The samples were exposed at a distance of 50 cm to a mercury lamp (Philips TUV 30W G30 T8, 85% of UVC) for an estimated 24 W/m2 at 25°C and 25% humidity for time periods ranging from 3 to 40 minutes [with an irradiance dose of 3.5 J/m2s (Tijsterman et al., 1999)]. All the samples were exposed perpendicularly and protected from extraneous radiation.
2.5. DNA recovery after UV exposure
Different methods were used to recover the adsorbed DNA from the surfaces, but all samples were eventually stored at −20°C. The DNA on the clay particles deposited on the borosilicate glass slides was harvested by 3 washes of 40 μl 5 mM CaCl2 and centrifuged (8000 × g for 20 minutes at 4°C). To remove the clay particles, 60 μl of a salt solution (180 mM NaCl and 80 mM sodium pyrophosphate) was added to the pellet, mixed at 1,200 rpm for 1 hour at 25°C, and centrifuged (15,000 × g, 20 minutes, 4°C). The supernatant was removed and supplemented with 40 μl diluted TE buffer (1/10 in ultrapure water) and stored at 4°C for 6 hours to allow DNA hydration (Pietramellara et al., 1997). For the metamorphic gabbro rock or the quartz sand samples, the DNA was harvested either by vortexing with water or by extraction with the Powersoil DNA Extraction Kit (MoBio, Carslbad, CA). The borosilicate glass slide controls were washed twice with 10 μl ultrapure water to recover lightly adsorbed DNA or twice with 10 μl diluted TE buffer (1/10 in ultrapure water) to recover the relatively strongly adsorbed DNA. Each wash was completed with a final rinse of 80 μl ultrapure water to bring the sample volume to 100 μl. All the surfaces were stained with ethidium bromide and examined under UV light to observe irreversible DNA adsorption.
2.6. DNA integrity analyses
DNA degradation, as reflected by the different forms of plasmid, was estimated by electrophoresis on 0.8% agarose gels. It was possible to observe the single strand breakage of covalently closed circular (CCC) plasmids to form open circular (OC) plasmids and the double strand breakage to form linear (L) plasmids. Controls consisted of pCEA restriction digested with EcoRV or ScaI.
Quantitative PCR was performed with the LightCycler DNA Master SYBR Green 1 kit with 3.5 mM MgCl2 in a LightCycler (Roche, Meylan, France) to measure the amount of intact aadA gene. Unexposed pCEA diluted in ultrapure water to a concentration of 2 × 10⁻⁶ng/μl was used as a control. The PCR was performed with the following primers to obtain a 382 bp fragment: p415 (5′-ATTCCGTGGCGTTAT-3′) as the forward primer and p416 (5′-TGACGGGCTGATACT-3′) as the reverse primer. The touchdown PCR started with an 8-minute denaturation at 95°C, then 40 cycles of 95°C denaturation for 10 seconds with an 8-second annealing at 65°C (which, after the first five cycles, decreases by 0.5°C/cycle for 20 cycles, with the last 15 cycles being performed at 55°C), and an elongation at 72°C for 16 seconds.
The potential for biological activity of the exposed DNA was measured by testing the DNA's ability to confer activity to a bacterial strain. Acinetobacter sp. BD413 (DSM586), which harbors the plasmid pBAB2 and is resistant to nalidixic acid and ampicillin, can be transformed naturally with environmental DNA (Kay et al., 2002; Ceccherini et al., 2003). The strain was cultured in LB medium containing 20 μg/ml nalidixic acid (Sigma Chemical Co., St. Louis, MO) and 50 μg/ml of ampicillin. An overnight culture of the strain at 28°C was diluted into fresh medium and cultured for an additional 2 hours to obtain a suspension of 108 cells/ml (de Vries and Wackernagel, 2002). The final bacterial suspension (315 μl) was mixed with the UV-exposed plasmid DNA suspension (35 μl of 2 ng/μl suspension) and incubated for 120 minutes at 28°C. Negative controls consisted of sterile water instead of the DNA suspensions. The bacteria were then plated on LB medium containing nalidixic acid (20 μg/ml), ampicillin (50 μg/ml), and spectinomycin (50 μg/ml) to select for transformants. Colonies were counted after 2 or 3 days of incubation at 28°C. The colonies were examined via PCR to verify the presence of aadA. The transformation efficiency (transformants/μg DNA) was calculated by dividing the number of colonies on the plate by the quantity of DNA plated.
3. Results
3.1. DNA recovery yields
The plasmids extracted from the E. coli hosts were analyzed for concentration, purity, and integrity. To ensure accurate DNA concentrations, the amount of DNA lost during deposition on the surfaces (left in the wash supernatant) and due to non-desorbable fractions of DNA was calculated. During the deposition onto the montmorillonite clay, less than 1% of the DNA was lost as measured by analysis of the gel deposits and qPCR of the supernatants. To ensure that the calcium ion concentrations used during the montmorillonite DNA extractions would not lead to DNA co-precipitation, plasmid DNA in 5 mM CaCl2 was centrifuged for 20 minutes at 15,000 × g, and the upper and lower liquid fractions were analyzed by spectrophotometry. No co-precipitation was noted at this CaCl2 concentration, unlike in previous experiments (Poly et al., 2000). By using the water extraction for the crushed metamorphic gabbro rock and the quartz sand, up to 80% of the DNA was recovered in the first rinse, 15% in the second, and close to the entire remaining DNA in the third rinse, as measured by qPCR. The soil DNA extraction kit recovered up to 20% of DNA deposited on the crushed rock and 30% of that deposited on the sand. For the borosilicate glass slide controls, 80% percent of the DNA deposited was recovered between the water and diluted TE buffer rinses.
3.2. DNA quantitation by qPCR after UV exposure
3.2.1. Montmorillonite clay
The condition of the plasmid DNA deposited on the various substrates and on the borosilicate glass slide controls was assessed by qPCR. Figure 1 demonstrates how increased UV exposure leads to a logarithmic decrease in intact, amplifiable DNA. For the glass slide controls, the degradation appears to follow a hyperbolic curve, as seen in other DNA degradation studies (Ceccherini et al., 2003), with the degradation decreasing around the fifth minute due to the loss of available DNA. These results demonstrate the heterogeneity of DNA behavior in the dry state, even with a homogenous matrix, and foreshadow the difficulties with more complex matrices. Plasmid DNA on montmorillonite clay behaved differently than on the borosilicate glass slide controls following UV exposure (Fig. 1). The qPCR results show a large difference in the decay kinetics between non-adsorbed DNA versus DNA bound to clay. The total amount of plasmid adsorbed on the clay was quite stable during the UV exposure, even after 35 minutes. On the other hand, the amount of non-adsorbed DNA was reduced 100-fold for the same exposure time.

Quantity of amplifiable DNA, as assessed via qPCR, after deposition on various substrates and exposure to UV for varying times. Weakly adsorbed DNA was removed with an ultrapure water rinse, while strongly adsorbed DNA required diluted TE (1/10 in ultrapure water).
The clay appears to provide a strong protective effect. By varying the thickness of the clay and monitoring DNA integrity via qPCR, it is demonstrated that the clay particles do indeed shield the DNA from damage (Fig. 2). This effect occurs at greater than 10 μm clay thicknesses, which allows at least 88% of the DNA to be protected. Controls of clay without DNA, DNA without clay, and DNA with clay but without exposure to UV supported the results obtained in Fig. 2.
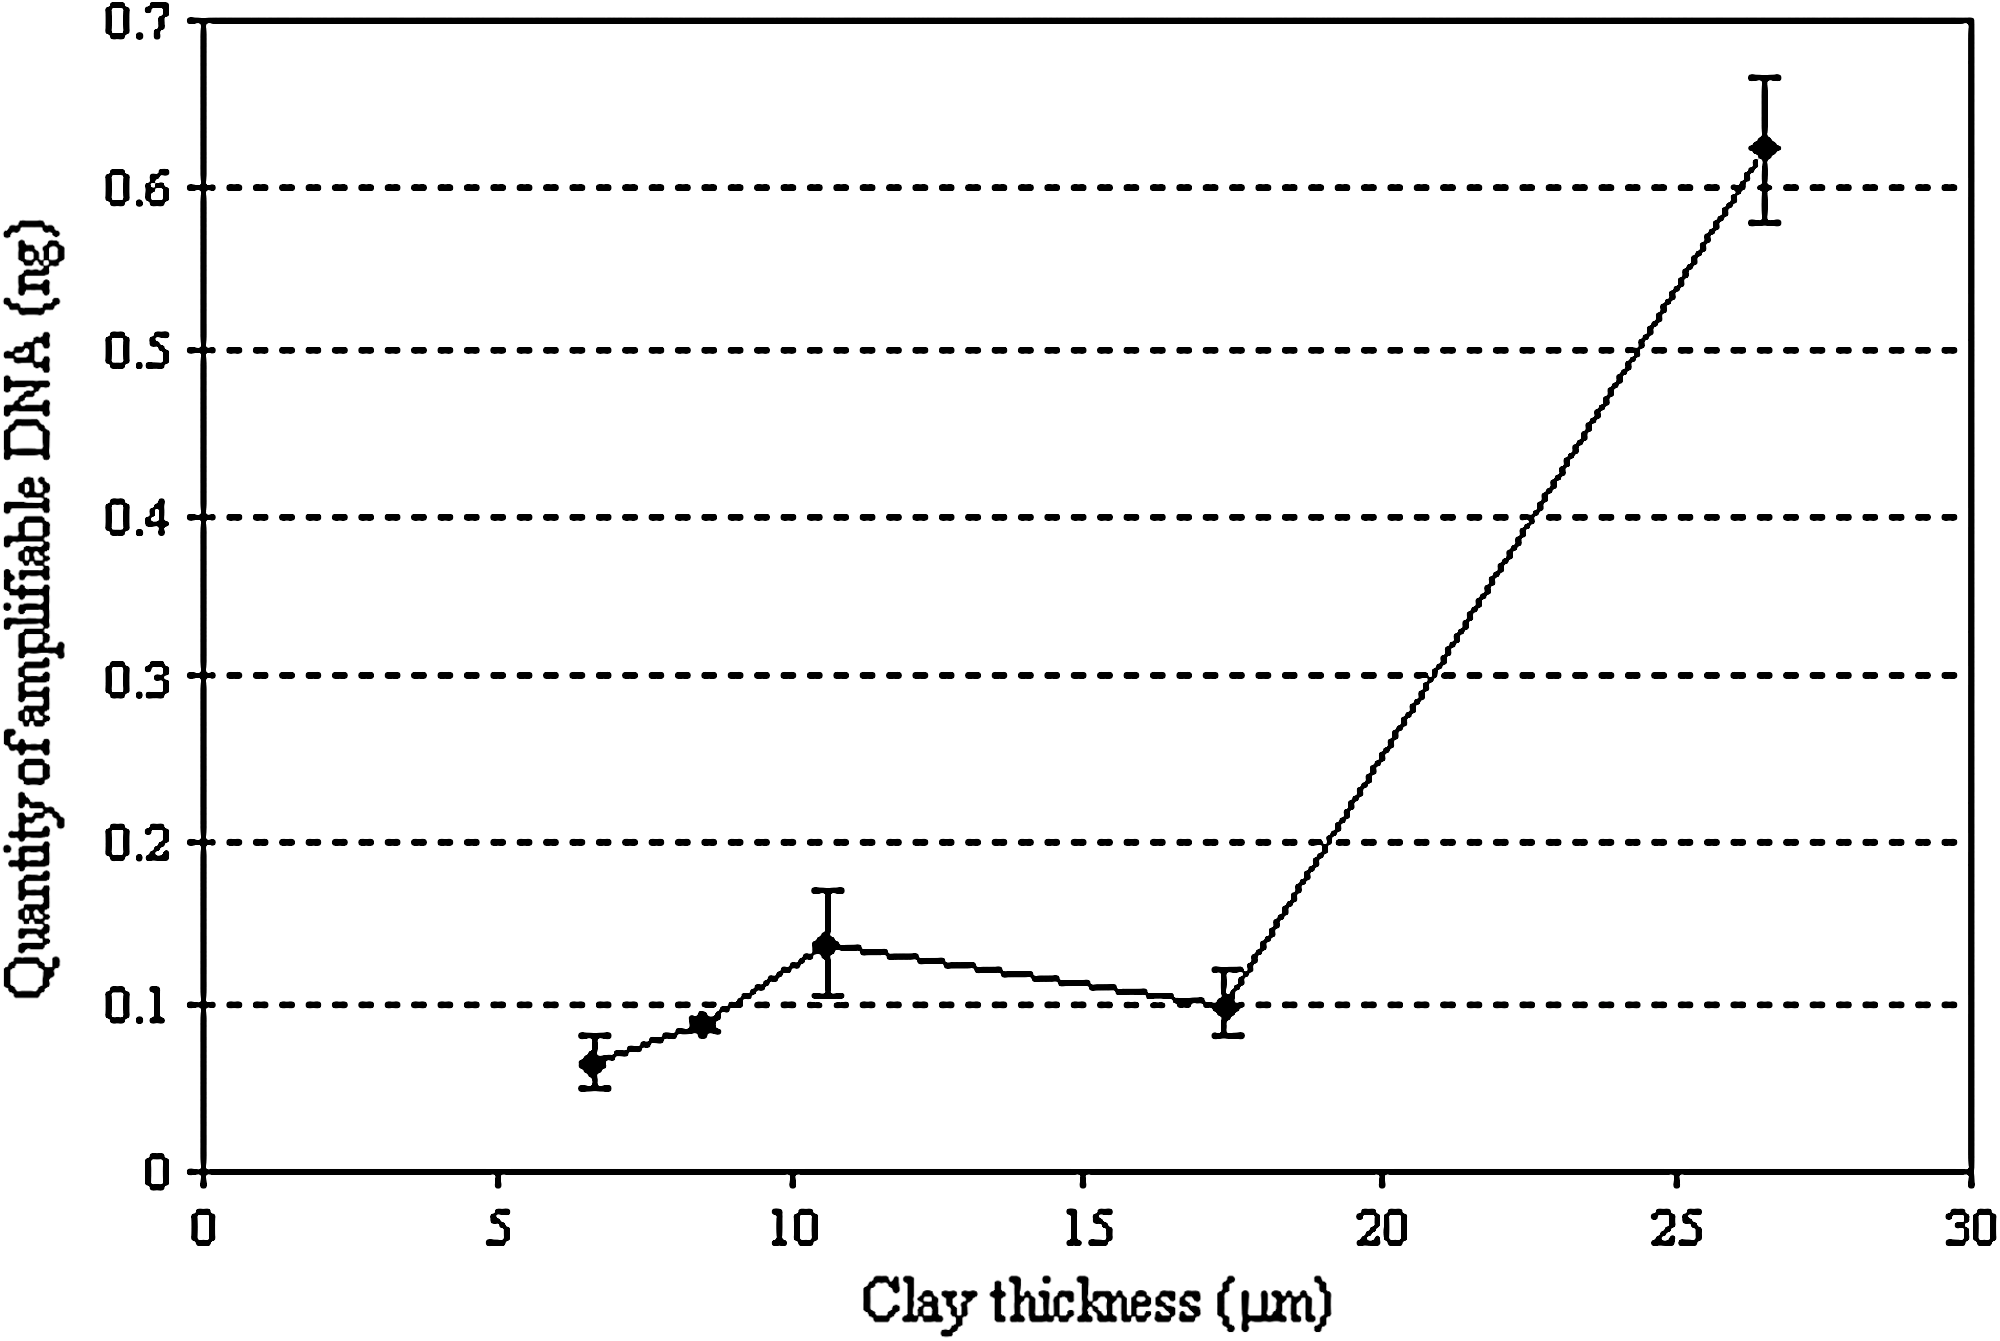
Quantity of amplifiable DNA, as assessed by qPCR, after shielding by varying clay thickness. Increasing clay thickness provides plasmid DNA with increasing protection against UV damage.
3.2.2. Crushed metamorphic gabbro rock or quartz sand
In one set of experiments, plasmid DNA deposited on crushed metamorphic gabbro rock or on sand was exposed to UV for up to 20 minutes. In Fig. 3, the amount of DNA recovered from sand or rock, by either water rinses or DNA extraction kit, was compared with qPCR. DNA sorption was higher on the rock than on the sand. At a neutral pH, the quartz in the sand and DNA are both negatively charged, which leads to electrostatic repulsion and prevention of adsorption, which may explain the lower sorption. The results, which were normalized for loss of plasmid during extraction, indicate that the DNA extraction kit had a higher efficiency for the rock, while water rinses worked equally well for the sand. Negative controls (not shown) revealed that 5–10 ng/μl of DNA can be extracted from the rock alone, which leads to a low background that does not interfere with the analyses. After 3 minutes of UV exposure, it appeared that the DNA on the rock experienced less degradation than that on the sand.
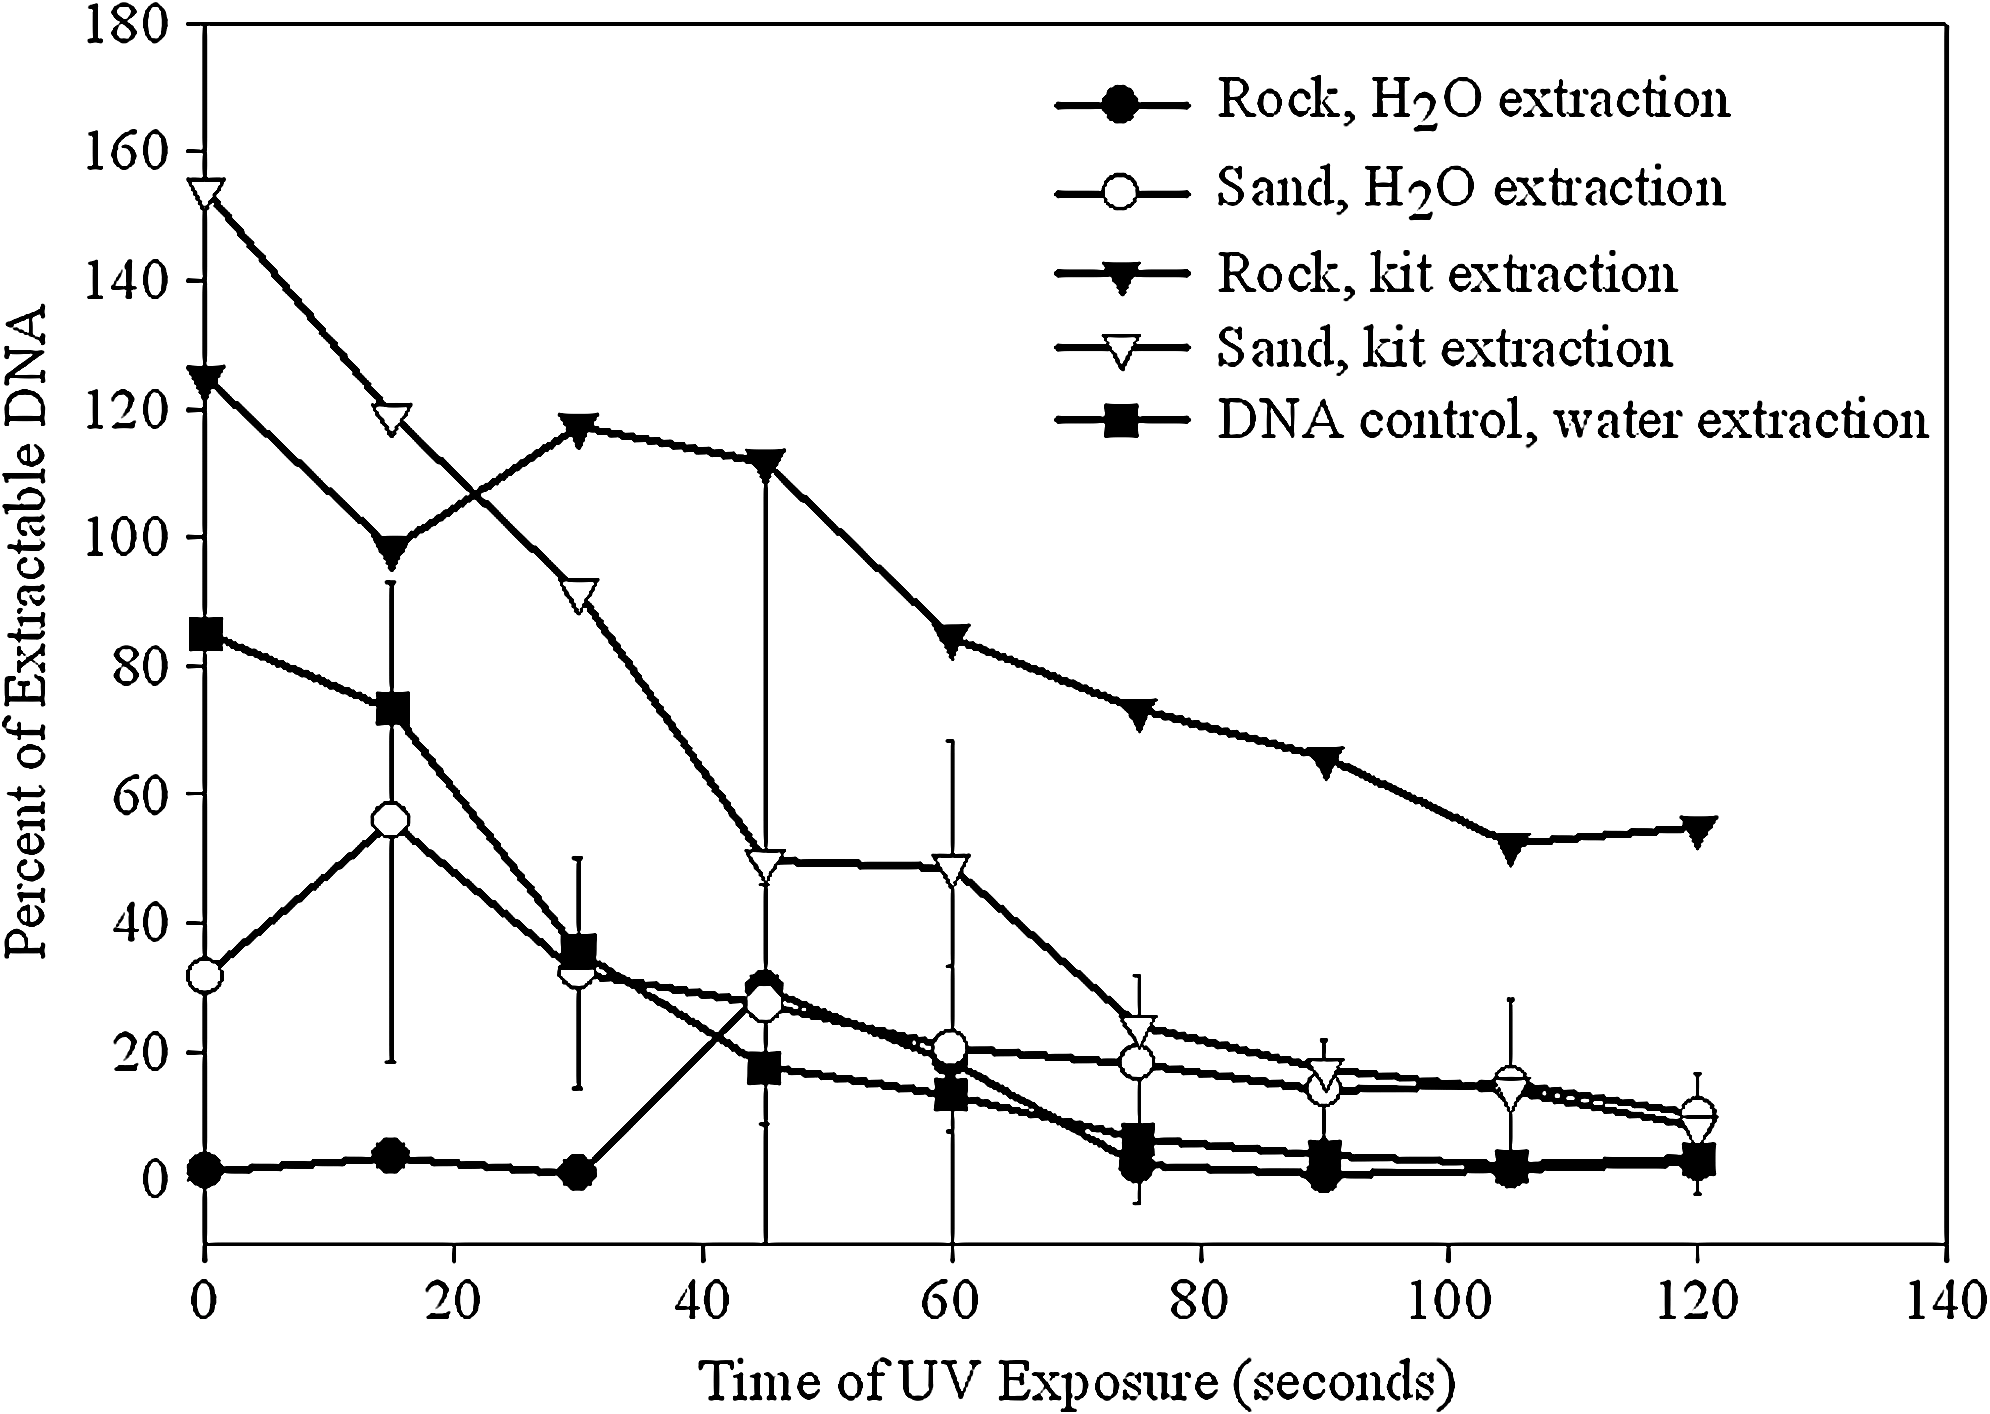
Percent of extractable DNA (of the original 800 ng deposited), as measured by qPCR, after different times of UV exposure on various surfaces using different extraction techniques. The qPCR reaches saturation at 40 ng/μl of plasmid, making higher measurements unreliable and leading to higher than 100% results. Experiments were performed in triplicate, with error bars included on all points.
In a second set of experiments, the amount of extractable plasmid DNA on crushed rock or quartz sand was tracked over a 20-minute UV exposure. After 20 minutes of UV exposure (Fig. 4), the DNA degradation kinetics exhibited two phases: a rapid phase and a slower phase. During the rapid phase, the plasmid deposited on rock had a half-life of about 120 seconds, while the DNA on sand had only a 35-second half-life. There appears to be a significant UV protective effect of DNA by the rock, as proposed previously (Cockell et al., 2000, 2008). Even without UV exposure, after 10 days at room temperature, 41.9% of the DNA deposited on rock was recovered (representing 66.6% of the recoverable DNA), while only 0.5% (representing 0.6% recoverable DNA) was recovered from the sand. The qPCR results are corroborated by spectrophotometric measurements of the amount of DNA extracted.
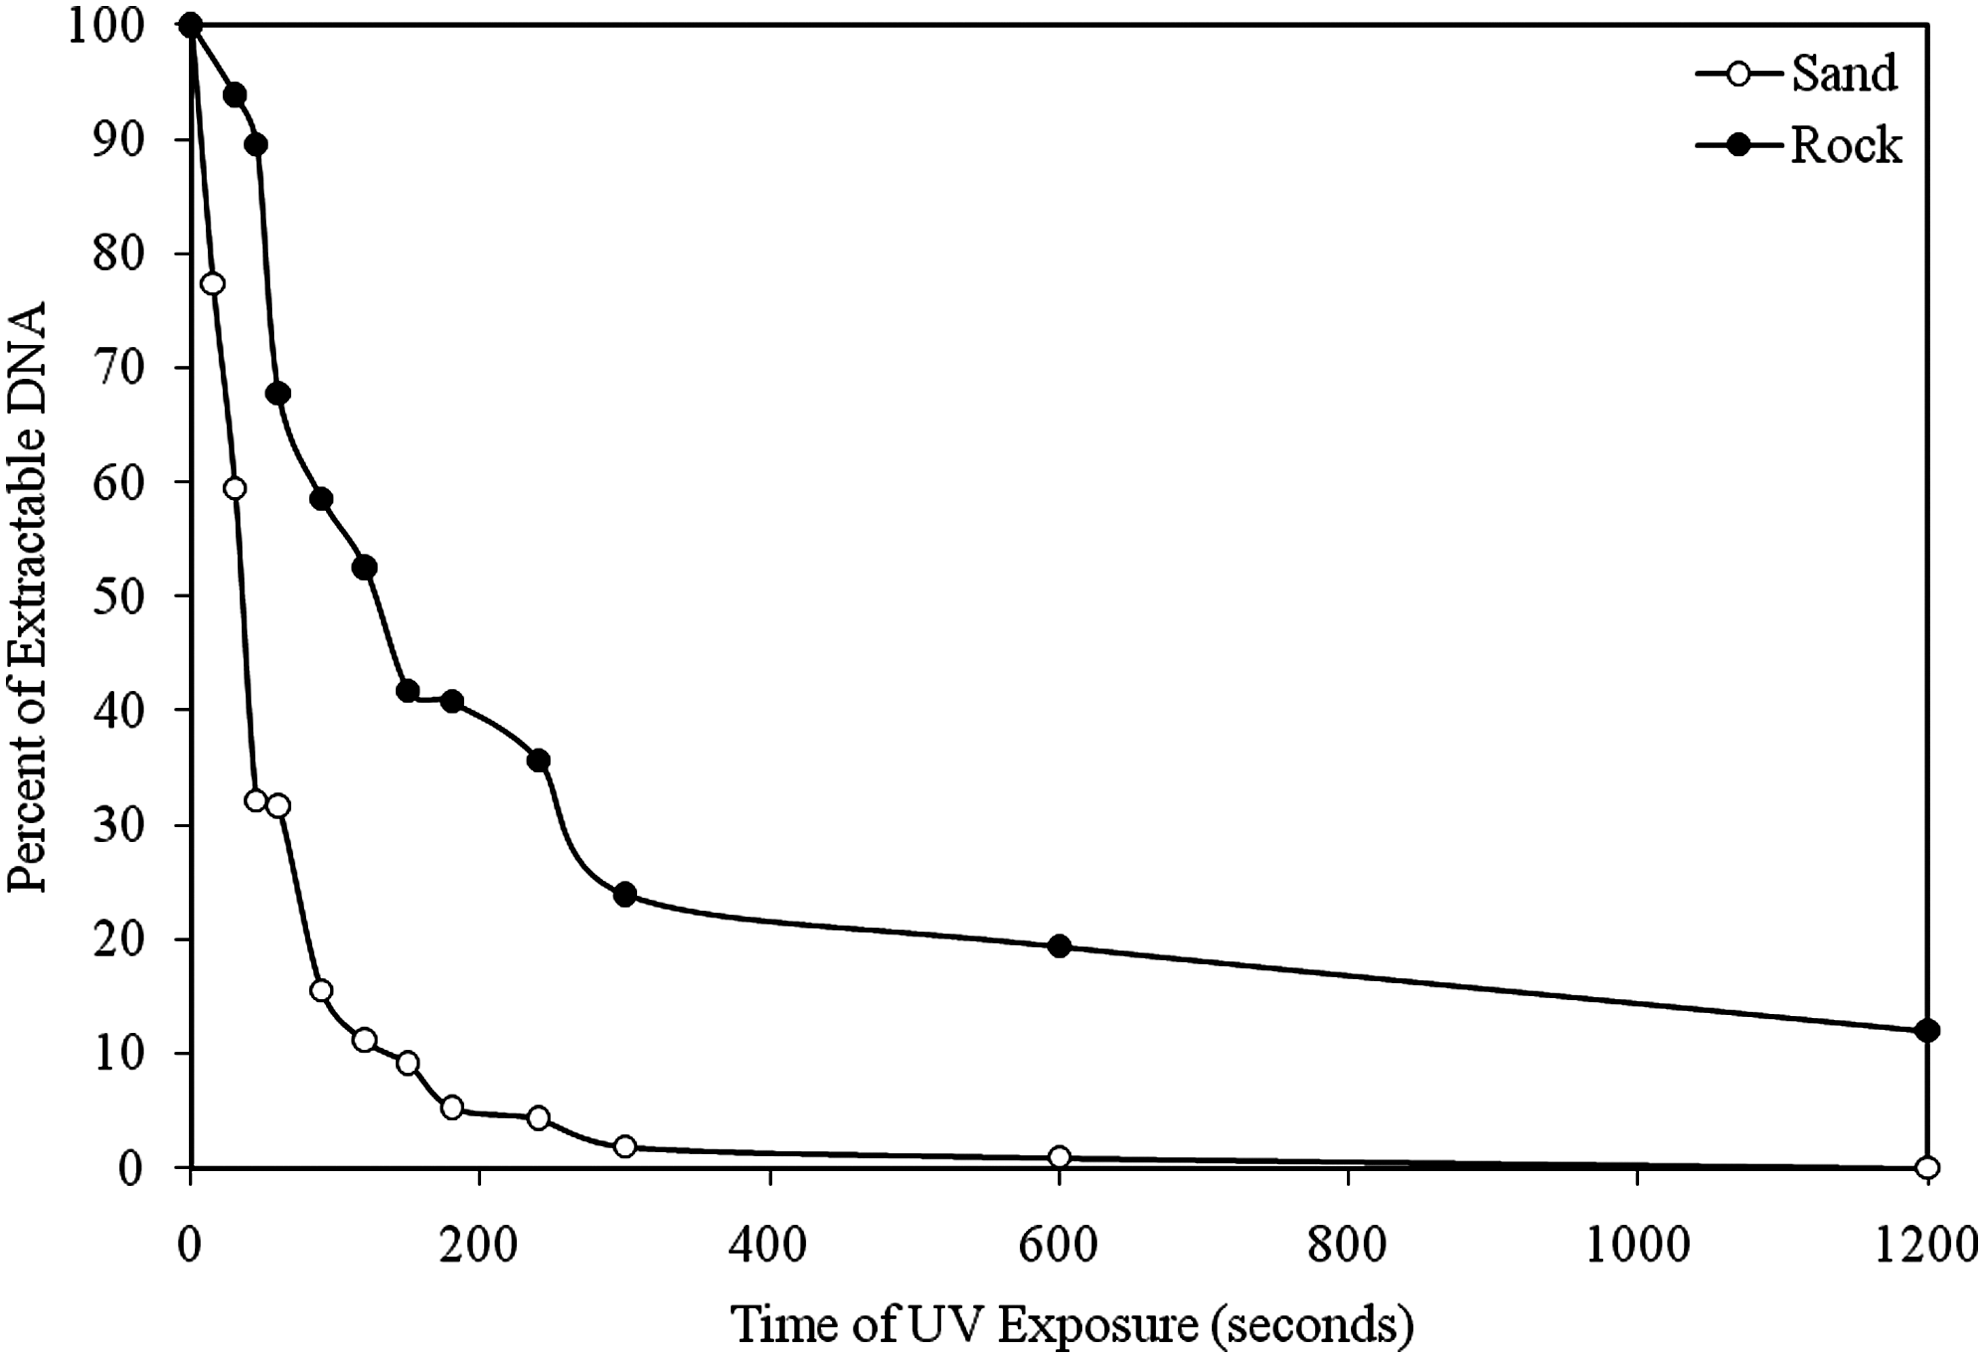
UV degradation of DNA deposited on sand or rock over time, as assessed by percent of extractable DNA (800 ng originally deposited). The DNA deposited on sand was more susceptible to degradation than the DNA on rock. DNA concentrations were normalized to the extraction efficiency to alleviate bias (extraction on sand recovers 80% of DNA while extraction on rock recovers 60%). Results shown are from a single experiment with no replicates; DNA without UV shows negligible degradation after 20 minutes.
4. Transformation Test
A second measure of the UV-exposed DNA's integrity was its ability to transform Acinetobacter sp. BD413. Presumably, the more intact the plasmid is, the higher the transformation efficiency. The results, shown in Fig. 5, demonstrate that plasmid DNA with clay particles retained a higher rate of transformability versus non-adsorbed DNA exposed to UV.

Transformation efficiency of UV-exposed DNA on clay in Acinetobacter sp. BD413.
5. Discussion
5.1. Factors affecting DNA survival during UV exposure
This research demonstrates the durability of both the DNA molecule and its encoded information after exposure to UV and thus supports our suggestion that DNA should be considered a biosignature. The qPCR protocol is based on the idea that DNA damaged by UV would be unable to be amplified. However, not all DNA damage results in a loss of amplification. During the degradation process, different DNA lesions could occur, but only some of them would hinder the amplification process, namely, DNA cross linking and dimerization (Ronto et al., 2002). The predominant photoproducts of UV exposure tend to be lesions that hinder amplification (Jiang et al., 1997). Thus, the ability to amplify the UV-exposed DNA in this research demonstrates that the DNA was somehow protected by the surfaces, as seen in Figs. 1 and 5. Such protection was also noted in the UV exposure of a ribozyme on montmorillonite clay (Biondi et al., 2007).
Two factors could contribute to the protective effect of the surfaces: the shield effect (Cockell et al., 2000, 2008; Rettberg et al., 2002) and the adsorption process (Romanowski et al., 1991; Paget et al., 1992; Franchi et al., 1999; Demanèche et al., 2001). The shield effect is broadly observed and depends on the nature of the material: the more UV absorbed by the substrate (more metals, aromatic compounds), the better the DNA preservation and the less substrate is needed. In this study, adsorption reduced the amount of extractable DNA as well as altered DNA conformation to a less-active transforming agent. However, the plasmid was still able to retain its biological activity. In previous publications, conformational and electronic differences in the plasmid affected the adsorption process that, in turn, could lead to resistance to UV degradation (Romanowski et al., 1991; Melzak et al., 1996). For example, assuming (1) the pCEA plasmid is 7,006 bp, (2) the distance between two bases is 3.4 Å, and (3) the plasmid length is approximately 2.38 μm, the DNA sample of 1011 plasmids in the CCC conformation covers a surface area of 6 cm2. However, in the OC conformation, the same plasmid has a surface area of 450 cm2. With the plasmid degradation induced by UV exposure, more plasmid would convert from the CCC to the OC conformation, which would lead to increased shielding of the remaining plasmids.
If the kinetics for the adsorbed and non-adsorbed DNA are compared, the adsorbed DNA appears to be more susceptible to UV in the first 5 minutes of exposure (Fig. 1). These degraded plasmids, in OC and L conformation, would have a higher degree of adsorption, since a more linear molecule has a higher surface area than a CCC (Paget and Simonet, 1994). Thus, altered DNA would adsorb more firmly, which would lead to skewed results regarding the UV-protective advantage of non-adsorbed versus adsorbed DNA. Plasmid DNA has been shown to either adsorb along the length of the molecule or at one or both extremities (Paget and Simonet, 1994; Poly et al., 2000), not to mention the possibility of DNA/DNA interactions. Consequently, the kinetics observed here should be considered the result of complex interactions not entirely understood.
In the transformation protocol, the antibiotic resistance of transformed bacteria would indicate the survival of the DNA message. These tests, shown in Fig. 5, have the same hyperbolic kinetics seen in the qPCR quantification, but there is a large difference in the loss of integrity measured. In the transformation assay, there is a 4 log loss of integrity, while in the qPCR assays there is only a 2 log loss. This difference could be due to the inactivation of the aadA gene by the UV exposure. This loss of integrity could also be linked to chemical modifications or changes in conformational and structural stability that lead to loss of transformation efficiency. DNA conformation greatly affects transformation but not PCR (Demanèche et al., 2002). Another factor that must be considered is the process of desiccation. In cases of severe desiccation, the adsorbed DNA adopts a more compact conformation, called conformation A, that is more resistant to rehydration (it takes a minimum of 6 hours in aqueous solution to recover transforming capacities) than the non-adsorbed DNA (instantaneous recovery). The desiccated DNA has to compete with the substrate for the hydrating molecule, but the DNA in conformation A also forms strong bonds that increase the negative charge surrounding the molecule. The combination of desiccation and adsorption contribute greatly to the overall decrease in transformation efficiency (Pietramellara et al., 1997).
5.2. Can DNA survive an extraterrestrial excursion?
The survival of DNA after UV radiation contradicts past studies that have asserted total martian ground sterilization due to its exposure to permanent UV flux (Cockell et al., 2000). This assertion was tempered by the admission that such UV sterilization could only be effective in the first hundred micrometers of the surface, since telluric material on the ground would easily hinder photon progression via the shield effect (Horneck et al., 1995; Mileikowsky et al., 2000b). The literature has not been clear on the subject of shielding; some have demonstrated both no protective properties (Horneck et al., 1995) and protection of spores and phage below 1 mm (Vettori et al., 2000; Horneck et al., 2001). Our study shows an active shield effect for depths of about 10 μm and total protection at depths greater than 50 μm.
This research reinforces the feasibility of panspermia; and, if life had first emerged on Mars, it could have transferred to Earth via meteorites (Nisbet and Sleep, 2001). The recent discovery of nucleotide bases in the Murchison meteorite lends credence to the possibility of life emerging on another planet and traveling via meteorite to Earth (Martins et al., 2008). The lower temperatures in space, of about 80 K, reduce DNA breaks by half as compared to ambient Earth temperatures (Lindahl, 1993), and the dry space environment preserves DNA. The synergistic effects of vacuum and low temperatures induce an unexpected increase in the survival rate of microorganisms and reduce photo-induced lesions (Dose et al., 1996; Horneck, 1999).
6. Conclusions
DNA makes an excellent biological marker due to its endurance upon adsorption to rocks, the resiliency of the information contained therein, and its specificity as a marker of life. This study demonstrates the survival of DNA under extreme conditions, such as those in space, as well as the ability of this DNA to confer biological activity. The proficiency of two techniques, qPCR and bacterial transformation, to analyze photochemical DNA degradation is also established. In this study, Acinetobacter sp. was chosen for its transforming capacity (de Vries and Wackernagel, 2002); but other interesting bacterial characteristics, such as the capacity to mend photo-induced DNA lesions (Orlando, 2000), can be examined with the use of other bacteria in future studies.
Footnotes
Acknowledgments
The authors wish to thank Christophe Lécuyer for the sample of metamorphic gabbro rock from the ocean floor.
Author Disclosure Statement
No competing financial interests exist.
Abbreviations
bp, base pair; CCC, covalently closed circular; L, linear; LB, Luria broth; OC, open circular; PCR, polymerase chain reaction; qPCR, quantitative polymerase chain reaction.