
Abstract
Terrestrial life is known to require liquid water, but not all terrestrial water is inhabited. Thus, liquid water is a necessary, but not sufficient, condition for life. To quantify the terrestrial limits on the habitability of water and help identify the factors that make some terrestrial water uninhabited, we present empirical pressure-temperature (P-T) phase diagrams of water, Earth, and terrestrial life. Eighty-eight percent of the volume of Earth where liquid water exists is not known to host life. This potentially uninhabited terrestrial liquid water includes (i) hot and deep regions of Earth where some combination of high temperature (T > 122°C) and restrictions on pore space, nutrients, and energy is the limiting factor and (ii) cold and near-surface regions of Earth, such as brine inclusions and thin films in ice and permafrost (depths less than ∼1 km), where low temperatures (T < −40°C), low water activity (a w < 0.6), or both are the limiting factors. If the known limits of terrestrial life do not change significantly, these limits represent important constraints on our biosphere and, potentially, on others, since ∼4 billion years of evolution have not allowed life to adapt to a large fraction of the volume of Earth where liquid water exists. Key Words: Biosphere—Limits of life—Extremophiles—Water. Astrobiology 10, 349–361.
1. Introduction
NASA'
Figure 1 is a sketch of our main goal: to identify the boundaries between “Life” and “No Life” in the regions of Earth where water is liquid. To this end, Fig. 2 presents water in several ways. The bulk of terrestrial ocean water is in the narrow vertical wedge. The dotted curves mark the phase space boundaries of “ocean salinity water.” Similarly, the solid curves mark our estimate of the “maximum liquid range,” that is, the largest range of phase space that would be occupied by liquid water (fresh water, salt water, concentrated brines, thin films, and super-heated water) on Earth, if Earth had environments at the full range of temperatures and pressures shown. It does not; see Fig. 3. The melting curve of this “maximum” water has a freezing point depression of −89°C at the triple point, probably due to a combination of thin film effects and high solute (e.g., dissolved salt) concentrations (Clark and Van Hart, 1981). Thin films of unfrozen water can exist at the contact between ice-ice or ice-soil grains at very low temperatures (Price 2000; Davis, 2001; Möhlmann, 2008).

Water, Earth and Life. In the context of P-T phase diagrams, we plot liquid water (blue circle, cf. Fig. 2), all terrestrial environments (orange circle, cf. Fig. 3), and all inhabited terrestrial environments (green wedge, cf. Fig. 4). From these plots we are able to identify where there is both Earth and liquid water (i.e., the intersection of the blue and orange circles) but where “No Life” has been discovered (Fig. 5). Color images available online at

Pressure-temperature phase diagram for two types of water. The familiar vapor, sublimation, and melting curves for ocean salinity water (3.5% salt by mass, dotted curves) are indistinguishable on this scale from pure water (Lide and Frederikse, 1996). The dark vertical wedge represents the vast majority of Earth's oceans. We are concerned with the broadest range of pressures and temperatures under which water can remain liquid. This is labeled “Maximum liquid range” (solid curves). Due to increasing concentrations of solute and thin film effects at low temperatures, the coldest liquid water on Earth is −89°C and has a triple point pressure of 3.2 × 10⁻⁷ bar (see Table 2, label E). For reference, the average global surface temperatures and pressures for Earth, Mars, Titan, Venus, and the top of Europa's potential ocean are shown (see Table 1). Color images available online at

Superposition of terrestrial environments on the P-T diagram of water from Fig. 2. Earth's core, mantle, crust, and atmosphere are colored separately and centered on the average geotherm (subsurface) and lapse rate (atmosphere). The ocean and crust geotherms meet at point “I.” A “Transient” region shows mantle that has intruded upwards (e.g., volcanism, geothermal vents). The horizontal thin line at 1 bar is the average sea-level atmospheric pressure of Earth. The parameters of our Earth model (e.g., core, mantle, continental crust, oceanic crust, geotherms, and atmospheric lapse rates) are given in Appendix A. Extreme environments are listed and assigned a letter in Table 2, and they are plotted here. For example, “C” and “D” represent the hottest and coldest days on the summit of Mt. Everest. As in Fig. 2, the dark vertical wedge identifies the majority of ocean water. The green asterisk represents our estimate of the hottest and deepest water on Earth at T = 431°C and P = 3 × 10⁴ bar, corresponding to a depth of ∼75 km. Color images available online at
The most soluble common inorganic compounds in water have saturated aqueous molarities less than ∼11 M (Lide and Haynes, 2009). The magnitude of boiling point elevation due to the molality m of the solute is given by Raoult's equation: ΔT b = K b m, where K b is the ebullioscopic constant for water, 0.512°C/m (Silberberg and Duran, 2002), and m = 11, giving a boiling point elevation of 5.6°C, which we use to make the thick vapor curve in Fig. 2.
2. The Pressure-Temperature Phase Diagram of Earth
Figure 3 is a P-T phase diagram of all terrestrial environments superimposed on the phase diagram of water from Fig. 2. Conceptually, it is the same as the intersection of the blue and orange circles of Fig. 1; it shows the regions of phase space where there is both Earth and water. It also shows the regions where there is Earth but no liquid water and where there could be liquid water but there is no Earth. The details of our Earth model, including estimates of uncertainties, are described in Table 2 and Appendix A Table A1. The subsurface pressure and temperature gradients of Earth are proportional to each other and are related through density, conductivity, and heat production. This limits the P-T space occupied by Earth. Although the phase diagram labeled “Maximum liquid range” is appropriate for the concentrated briny inclusions and thin liquid films in ice and permafrost on Earth's surface, the maximum freezing point depression for water on, and in, aerosols and organic particles in Earth's atmosphere will be intermediate between the “Ocean salinity water” and “Maximum liquid range.”
Conversions between depth and pressure for atmosphere; land and water used the density values in Table A1 (Appendix A) and the formula P(z) = P o + ρgz, where P(z) = pressure at depth z, P o = normalizing pressure, ρ = density, g = gravitation acceleration. Gravitational acceleration values were taken from Dziewonski and Anderson (1981).
The phase models in Figs. 3 and 5 include short-term environments that are temporarily at typical mantle temperatures but are at crustal pressures. We have labeled these environments as “Transient” in Fig. 3. They include magma chambers in the crust, surface lava, and subsurface lava lakes (Jonsson and Matthiasson, 1974; Helz and Thornber, 1987). Over timescales of decades, the majority of these environments (Oppenheimer and Francis, 1998) will cool along a constant pressure line to lie within the crustal region. The size of the area occupied by Earth in the P-T space of Fig. 5 is determined by a combination of uncertainty in geothermal gradients and variations (both spatial and temporal) in geotherms. Thus, we have attempted to include the dynamic nature of Earth in the model by making the shaded Earth region wide enough to include cycling of pressures and temperatures. For example, in Fig. 3 the temperature at the summit of Mount Everest varies between the maximum (point C) and minimum (point D), and atmospheric pressures and temperatures vary within the pink shaded region around the average atmospheric geotherm. Also in Fig. 3 the transient permeation of liquid water to depths of at least 6 km in the crust through permeable rock-cracking (Sleep and Zoback, 2007) is included, as the average crustal geotherm (the solid black line) allows liquid water in the crust to a depth of ∼30 km. The shallowest crustal geotherm allows liquid water in the crust to a depth of ∼75 km (green asterisk in Fig. 3). In Fig. 4, the maximum depth of the biosphere is currently determined by the depth of the 122°C isotherm. By “currently” we are referring to the temperature of 122°C as a tentative high limit for life, based on the highest temperature environment in which present-day active life has been found to date (Takai et al., 2008). We acknowledge that this present-day limit may be transient, as environments such as deep sea thermal vents are searched for examples of life at higher temperatures. The depth of 122°C in the crust varies with crustal characteristics such as heat flow and thermal conductivity. From Fig. 3, the 122°C isotherm varies between the surface and a maximum depth of ∼20 km (along a cool geotherm) in crust.
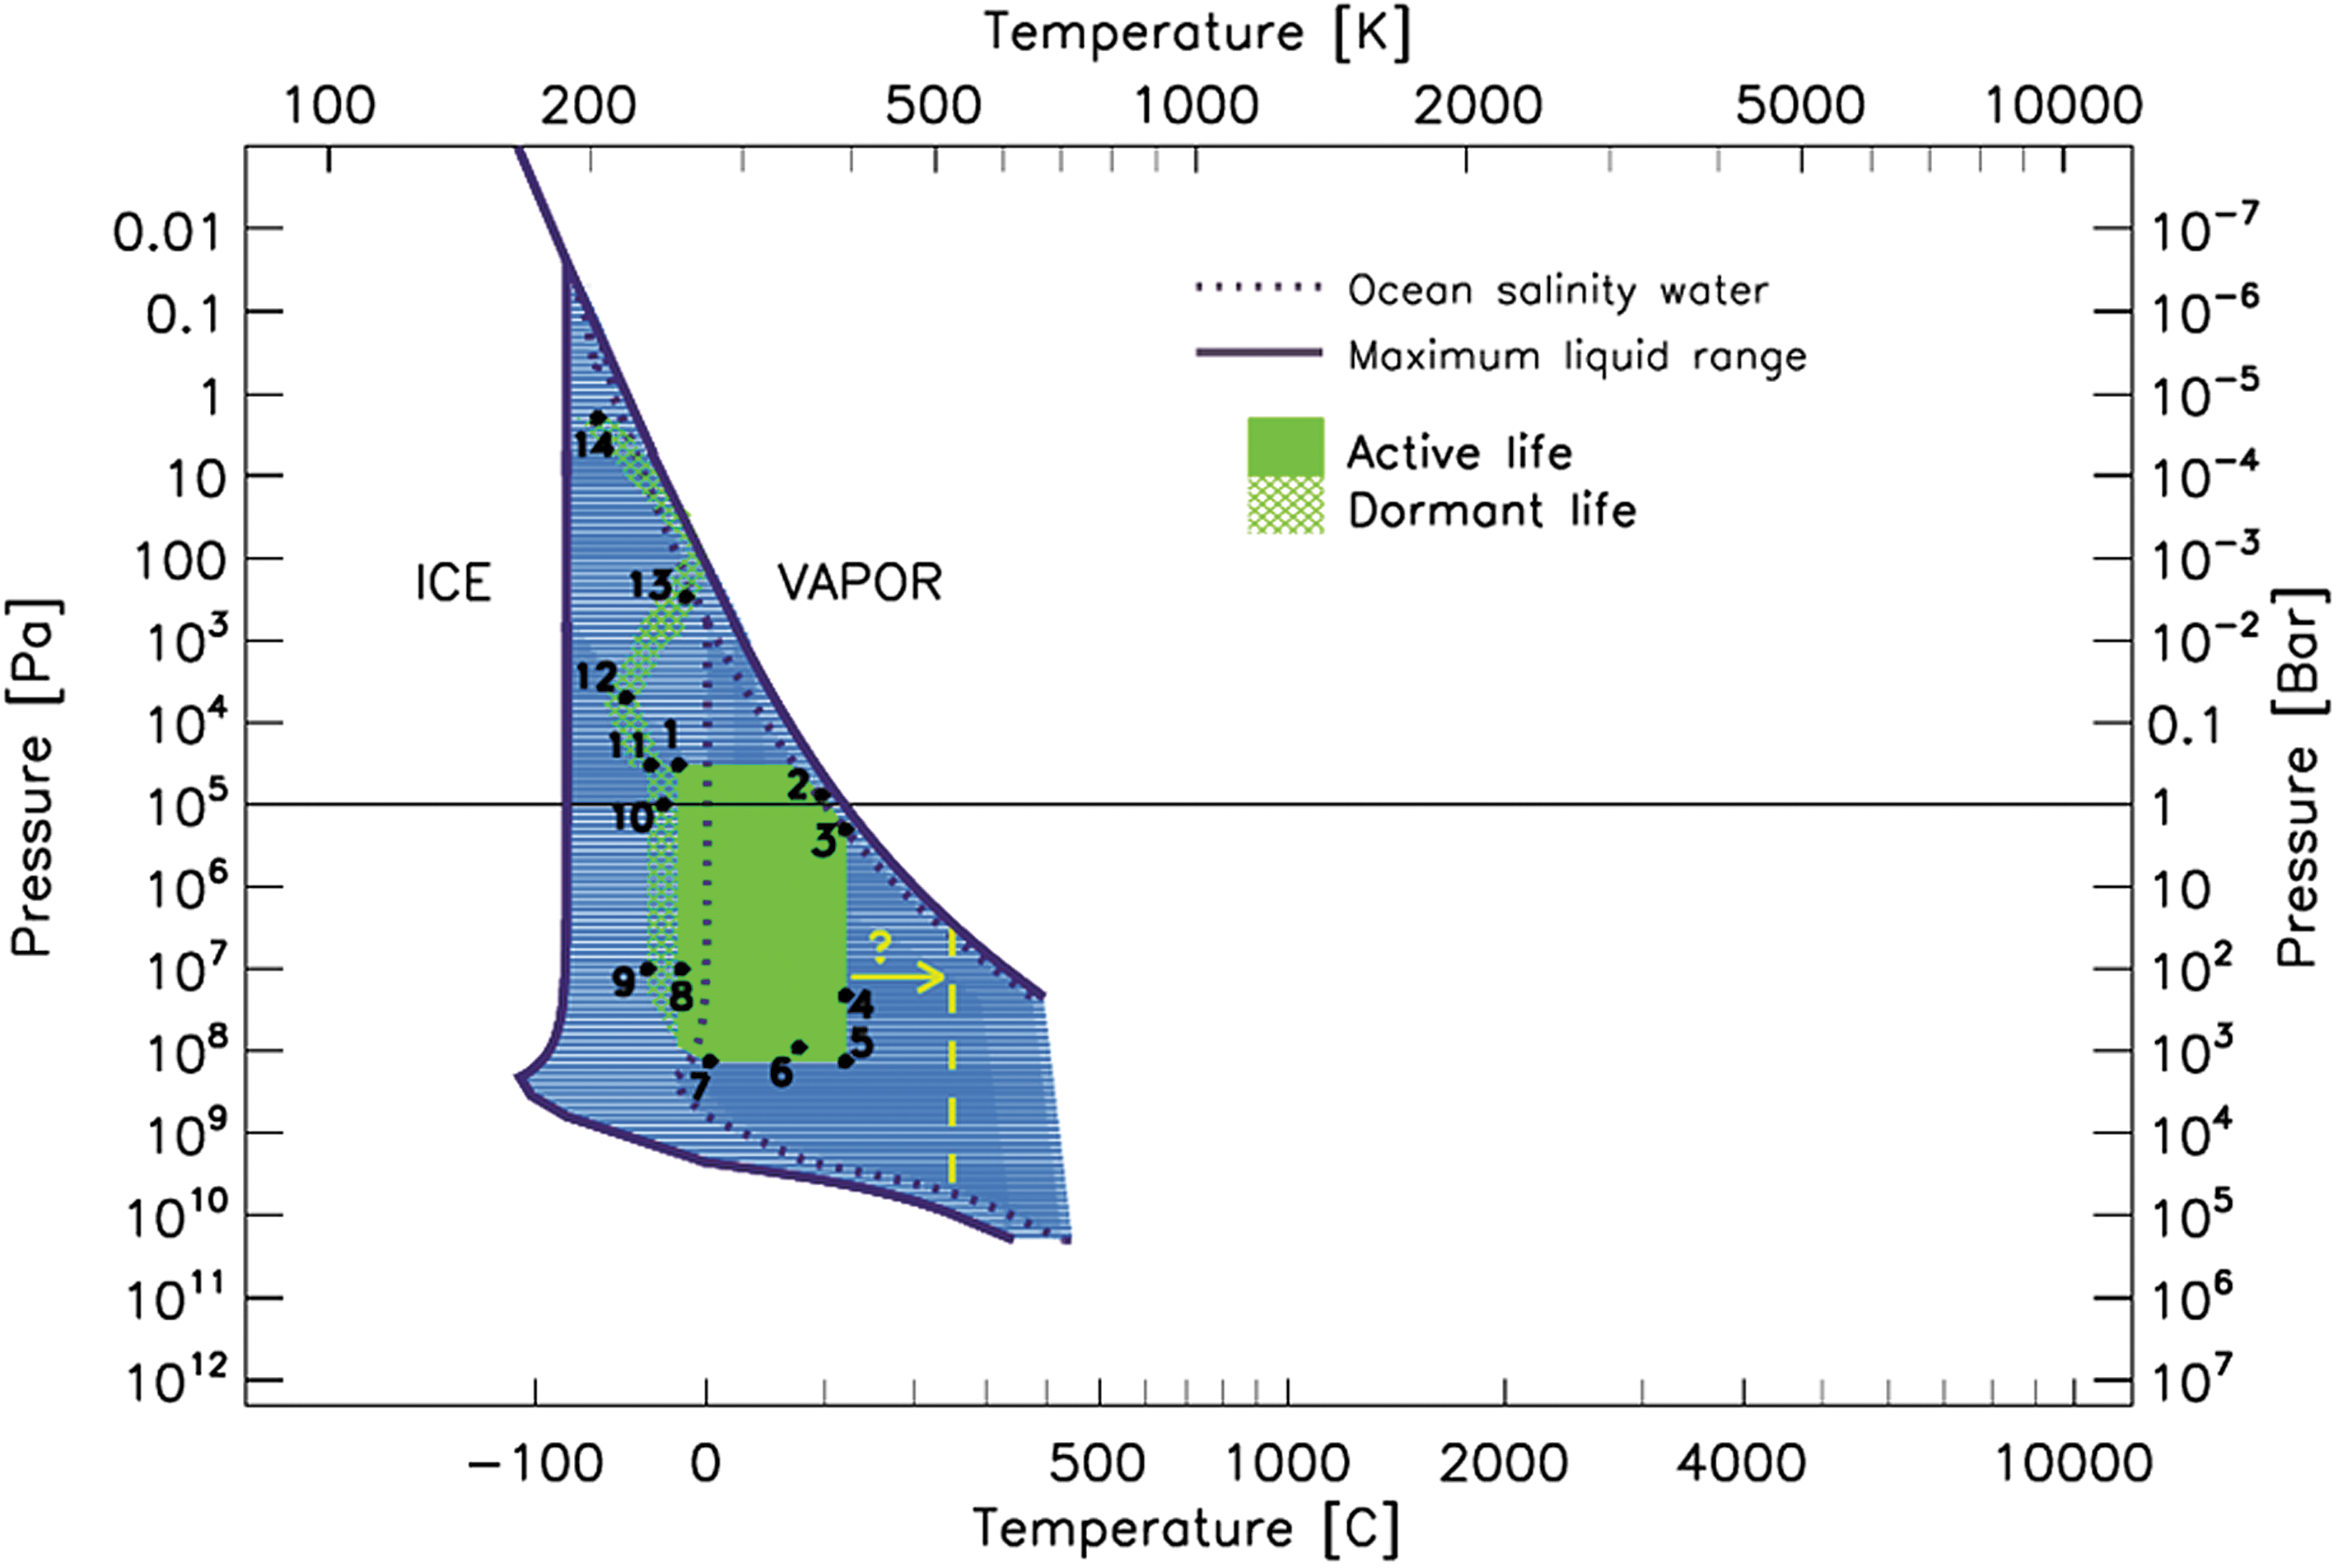
Inhabited terrestrial environments superimposed on the P-T diagram of water from Fig. 2. Numbers 1–8 circumscribe our estimate of the region occupied by active terrestrial life (green) and are described in Table 3. Numbers 9–14 and the light green area represent our estimate of the region occupied by dormant terrestrial life and are described in Table 4. Atmospheric life is classified as dormant, as most examples are spores and atmospheric non-spore-forming organisms that have extremely low metabolic rates (Appendix B). The question mark and the yellow arrow pointing from the current upper temperature limit of life (T life < 122°C) to the vertical dashed yellow line at T = 250°C represents the change that would occur in this diagram if life were found at T = 250°C.
3. The Pressure-Temperature Phase Diagram of Terrestrial Life
Figure 4 presents the phase space of life on Earth. We make a provisional distinction between active (green) and dormant (pale green) life. Although spores and other dormant life-forms have evolved to withstand extreme environmental conditions, they could not complete their life cycles in those conditions. Examples of the extreme pressures (P) and temperatures (T) for active and dormant life are given in Tables 3 and 4, respectively (see also Appendix B). These environments include: (i) high P, high T, (e.g., hydrothermal vents on the ocean floor); (ii) high P, low T, (e.g., interstitial environments beneath thick ice sheets); (iii) low P, low T, (e.g., Mt. Everest); and (iv) low P, high T, (e.g., warmest layers of the upper atmosphere).
Temperature and pressure from Hewitt and Jackson (2003).
Temperature lapse rate ΓT is the rate of decrease of temperature with height: ΓT (z) = −dT/dz.
Pressure lapse rate ΓP is the rate of decrease of pressure with height: Γ P (z) = dP/dz using the equation z = [1 − (P/10.13)0.19] × 44307.69 where z = altitude (km) and P = static pressure (Pa) (Pearson and Rugge, 1976).
In constructing these inhabited regions of phase space, we assumed that the T < 122°C upper limit to life (Takai et al., 2008) and the T > −20°C lower limit to active life (Junge et al., 2004) are both valid over a broader range of pressures than has been fully explored by microbiologists. The pressure/pore-space relation and the link between barophilic and thermophilic adaptation is still unclear (Horikoshi, 1998; Garzón, 2004). Thus, our interpolations of the current high- and low-temperature limits for life in environments at pressures between ∼1 and ∼102–3 bar should be viewed with caution. As a further indicator of caution, the current upper temperature limits of life (Kashefi and Lovley, 2003; Takai et al., 2008) are the results of a limited exploration of high T environments in hydrothermal vents. In the future, these limits will undoubtedly be higher and closer to the real limits of terrestrial life (Horsfeld et al., 2006; Kelley et al., 2007; Holden, 2008). In Fig. 4, the question mark and vertical dashed line at T = 250°C emphasize this uncertainty. Furthermore, in the atmosphere in Figs. 3 and 5, the existence of liquid-water environments are transient. Due to the movement of air currents and the relationship between atmosphere and surface, there are no continual liquid-water environments at low pressures. For example, at the triple point of “ocean salinity water” in Fig. 3 at ∼25 km altitude, the conditions may be dry even though liquid water is stable.
4. Results
Figure 5 can be used to quantify the potential limits of the terrestrial biosphere. For example, we can compute what fraction of the volume of Earth is inhabited. The radius of Earth r E = 6378 km. The biosphere extends ∼10 km above this (e.g., throughout the troposphere, on top of mountains) and extends ∼10 km down in the oceans and about 5 km down into continental crust (see Table 3, “6” and “7”). Assuming oceans occupy 70% of the surface and continents occupy 30%, the biosphere occupies ∼1% of the volume of Earth (the 10 km thick troposphere is included in the volume of Earth). Thus, after 4 billion years of evolution, the terrestrial biosphere seems to have been unable to extend into ∼99% of the volume of Earth.
Also of interest is what fraction of the volume of Earth where liquid water exists is known to host life. The computation is analogous to that above except, instead of the denominator in the ratio being the volume of the entire Earth, it is the volume of the shell of Earth that contains liquid water. The thickness of such a shell extends to a depth of ∼75 km and is marked by the green asterisk in Fig. 5. Here, we ignore the atmosphere and obtain the result that ∼12% of the volume of Earth where liquid water exists is known to host life. Thus, according to our current state of exploration, 88% of the volume of Earth where liquid water exists is not known to harbor life.
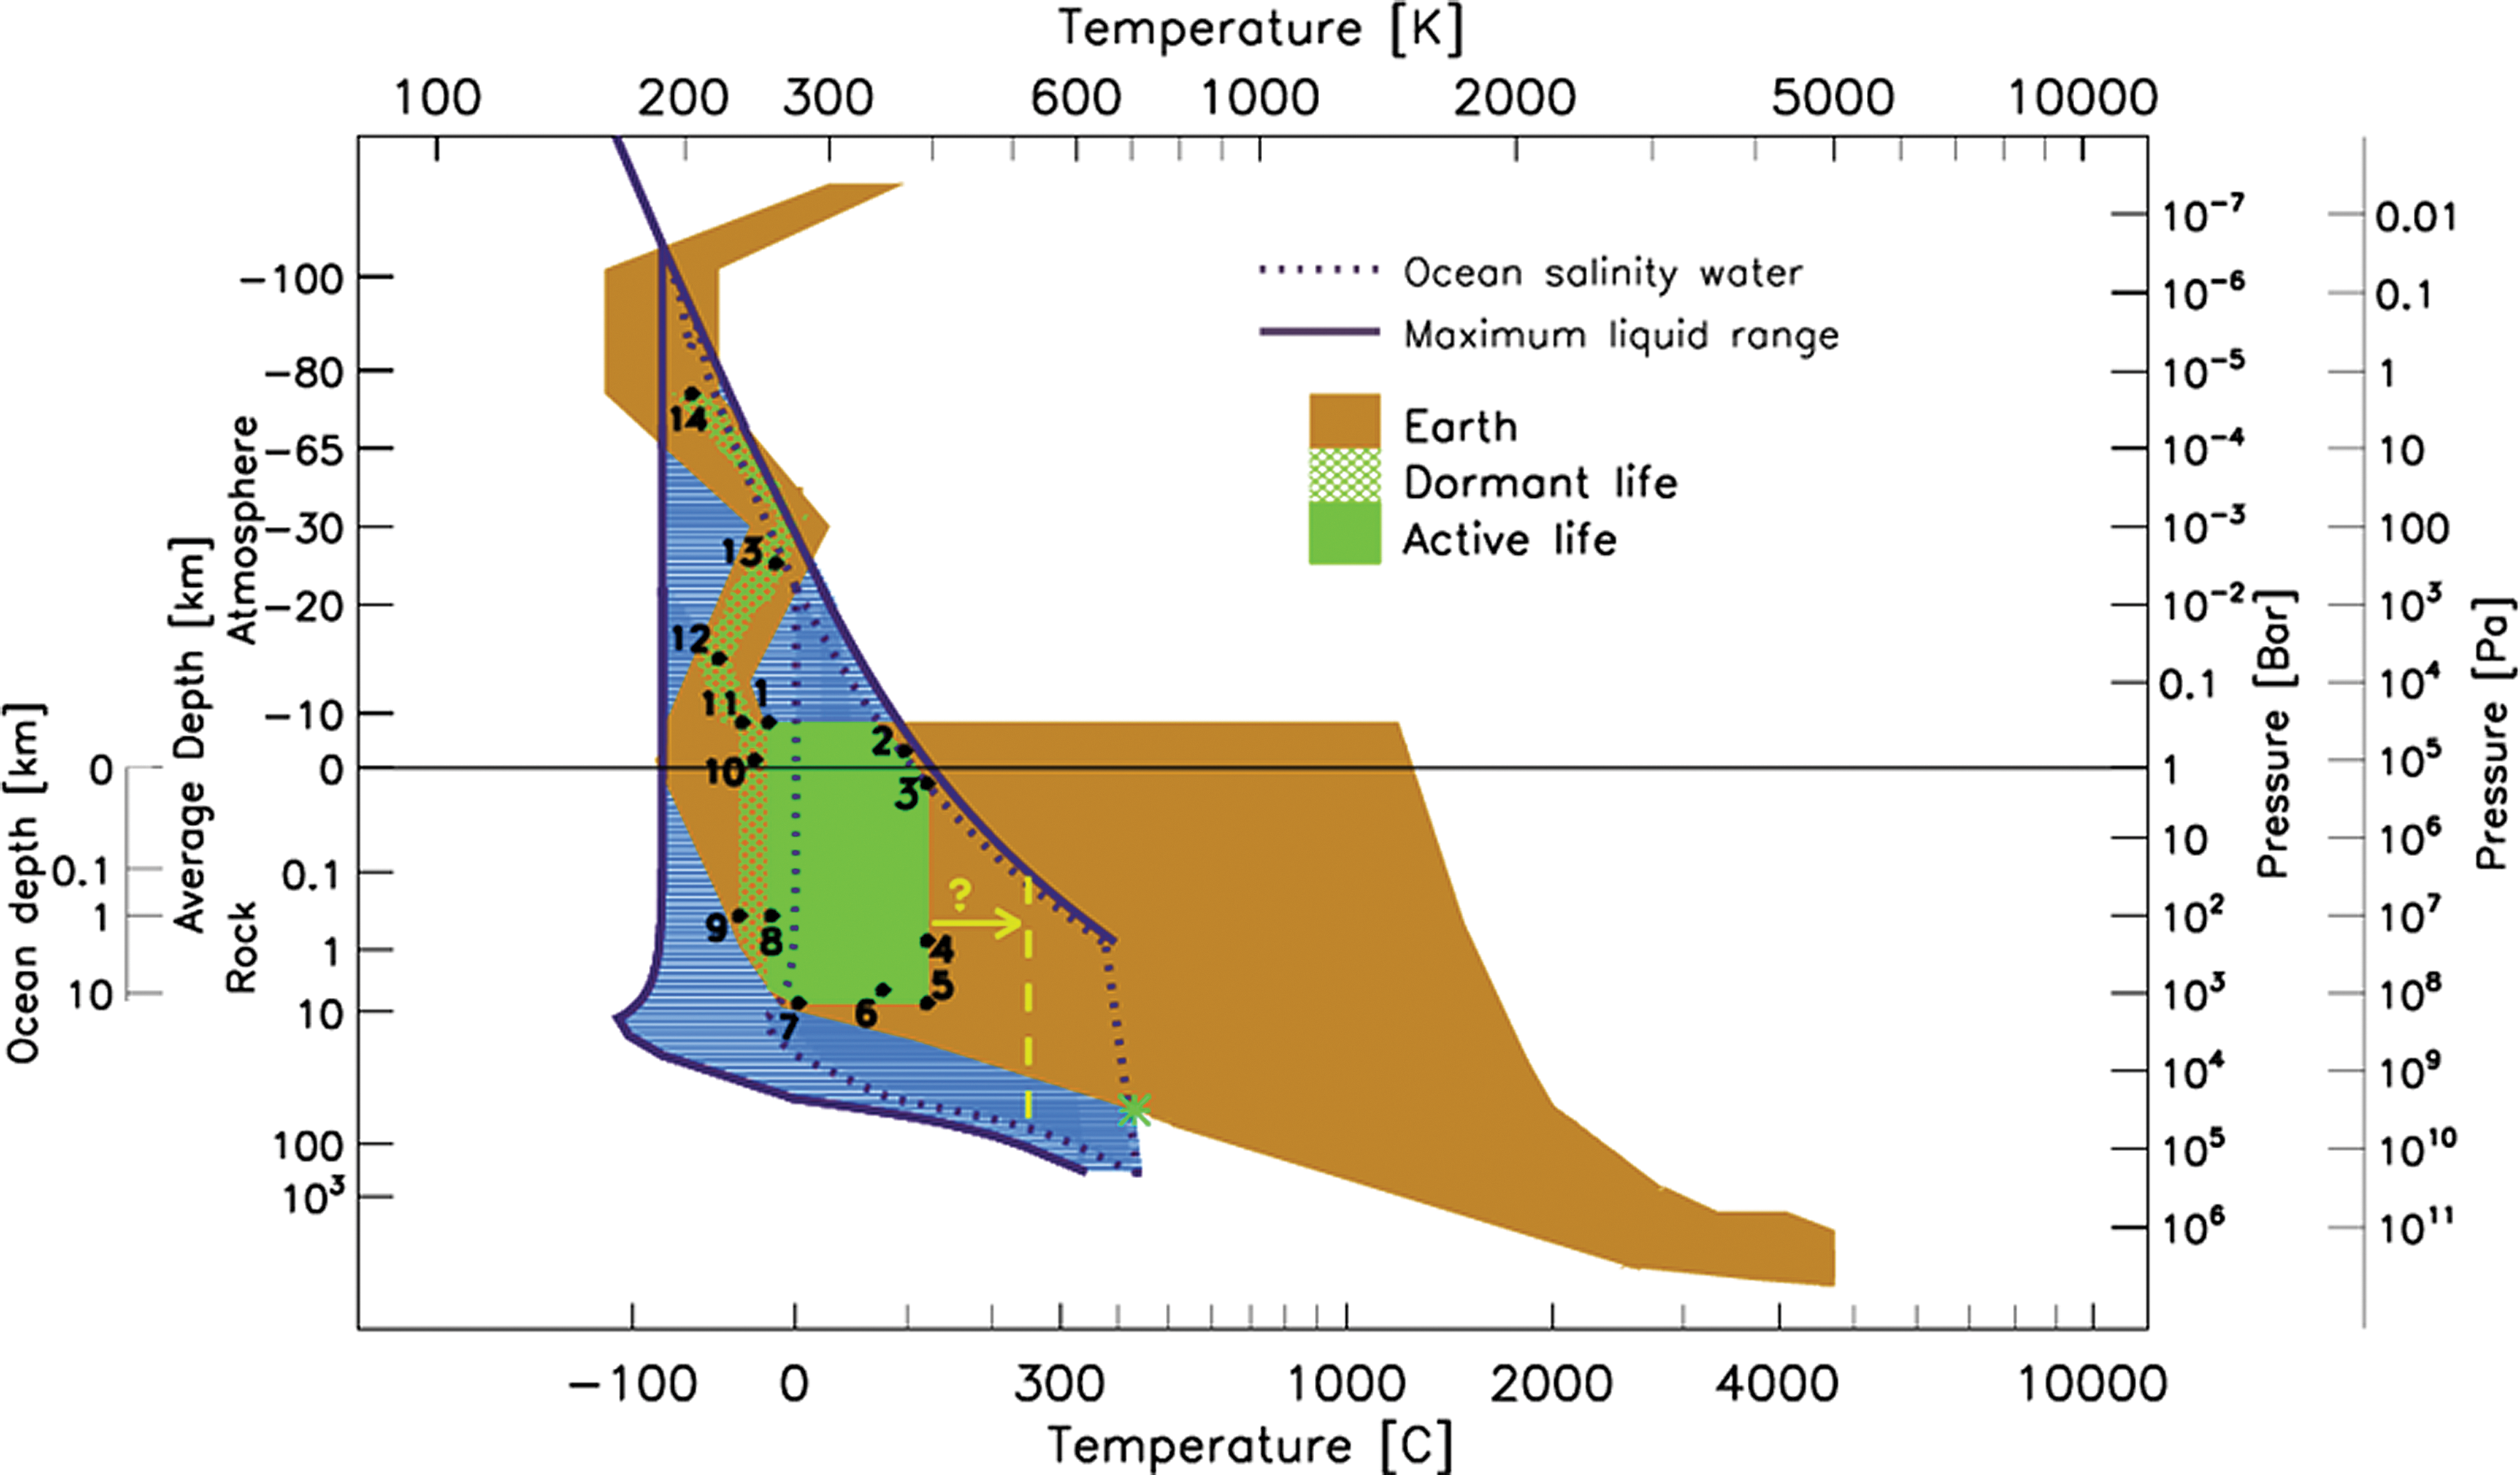
Superposition of inhabited environments from Fig. 4 and the terrestrial environments from Fig. 3 on the P-T diagram of water from Fig. 2. Life does not seem to inhabit the full range of terrestrial environments where liquid water is available. The upper temperature limit for life, currently 122°C, excludes life from the hottest and deepest water. Color images available online at
We can obtain analogous results for the area in phase space [log P log T] in Fig. 5 by asking: what fraction of the phase space area of Earth where liquid water exists is known to host life? In terms of Fig. 5, this question becomes, what fraction of the yellow area that overlies the blue area is occupied by green (active or dormant life)? Here, for simplicity, we exclude the atmosphere since it is not clear that liquid-water droplets and films on aerosols extend over the full “maximum liquid range.” The computation of the relevant areas yields the result that ∼36% of the phase area occupied by terrestrial water has been found to host life. Approximately 30% is occupied by active life, and the remaining ∼6% by dormant life. Thus, 64% of the phase space of terrestrial water and 88% of the volume of Earth containing water are not known to harbor life. There are many liquid-water environments on Earth that, as far as we know, do not host life. If the known limits of life do not require large modifications, these limits represent a significant constraint on the biosphere, since ∼4 billion years of evolution have not allowed life to adapt to the 64% of P-T phase space and 88% of the volume of Earth where liquid water exists.
5. Summary and Discussion
We have made an empirical description of the phase space and volumetric limits of terrestrial life. Plausible reasons for these limits are combinations of temperature, water activity, energy, and nutrient availability and pore space. However, determining how these factors combine to prevent life will be a challenging part of future extremophilic research.
Our analysis can be summarized as follows: (i) High-pressure limit to life. Figure 5 suggests that the apparent high-pressure limit of life is a selection effect since life has been found at the maximum depths for which it has been searched. This conclusion is supported by experimental studies in which barophiles were taken to those pressures encountered deep within the crust, and it was found that the organisms remained alive and viable (Sharma et al., 2002 for pressures at ∼35 km depth; Margosch et al., 2006 for pressures consistent with ∼50 km crustal depth). (ii) High-temperature limit to life. The current high-temperature limit for life is 122°C. This limit cannot be verified, as there is a substantial amount of liquid water (∼1% of the total terrestrial liquid volume) at higher temperatures that has not been fully searched for life. If 122°C is a real limit, this indicates a severe restriction of the terrestrial biosphere, where only ∼12% of the volume of Earth that has liquid water supports life. If the high-temperature limit for life is increased to 250°C, the thickness of the biosphere would approximately triple to include ∼38% of the volume of Earth that has liquid water. However, see Wiersberg and Erzinger (2008) and Ellsworth et al. (2005) for indications that hyperthermophiles—specifically methanogens—are limited to T < 135°C. (iii) Low-temperature limit to life. The current low-temperature limit for life is −20°C. There are thin films of liquid water and potentially briny liquid water that can remain liquid at lower temperatures with a water activity above the proposed limit of 0.6 for life (Grant, 2004). If low water activity is a fundamental limit, rather than low temperature, then active life may occur in water temperatures down to at least −30°C due to the presence of brines. A substantial volume of terrestrial liquid water (>1.5 × 10⁷ km3) exists in permafrost, and a large fraction of this would persist through temperatures below −20°C. It would be significant if life were found to be excluded from these liquid-water sources. (iv) Low-pressure limit to life. All examples of life found at pressures less than 0.3 bar have been classified as dormant. A low-pressure limit for life may be due to temperature, water activity, or nutrient limits at these altitudes. Liquid water would most likely exist as a thin film on aerosols or organic particles in the atmosphere; however, its existence in low-pressure environments is transient.
Our phase diagrams can be used to refine and focus searches for life on Earth and elsewhere. Our analysis highlights the need to look for environments that have conditions at the extreme limits known for life so as to quantify the extent to which terrestrial life follows the water. Current limits indicate that the terrestrial biosphere inhabits only a small subset of the full range of liquid-water environments on Earth. More work needs to be done to determine how much of the apparently uninhabited water appears that way due to the difficulty and incompleteness of the observations.
A. Appendix A: Details of the Earth Model Shown in Figure 3
A.1. Crust and surface
The thickness of the crust varies widely—between 5 to around 80 km (Pavlenkova and Zverev, 1981; Holbig and Grove, 2008) beneath continental crust (averaging 35 km), and only from 2 to 10 km under oceanic crust (averaging 5–7 km). The global average depth is 19 km (Dziewonski and Anderson, 1981). As the Moho marks a density transition, it does not have a fixed pressure or temperature. Shallow Moho (beneath thin crust) is typically quite cool due to its lower heat flow. A large fraction of the crust is <40 km thick (Mooney et al., 1998) and lies above mantle cooler than 800 K (Blackwell, 1971). With increasing depth the temperature of the crust and Moho typically increases due to increasing heat flow. Deep Moho beneath thick crust can be cool, however, with the current range of deep Moho temperatures being ∼800 K (Hyndman et al., 2005) to 1400 K (Jiménez-Munt et al., 2008). Taking a typical average continental crustal density, the 80 km deep Moho (Sokolova et al., 1978) lies at a pressure of around 20 kPa—roughly an order of magnitude greater than the pressure at shallow Moho. Due to these large variations in pressure and temperature at the base of the crust, there is difficulty in representing this boundary simply on a P-T diagram. We have chosen to mark the average conditions at the base of average thickness continental and oceanic crust and to use error bars to encompass the range of crustal thickness (pressures) and the variation in temperature at different Moho depths. A sloped error bar is due to the general trend of deeper Moho being at higher temperature.
A more fundamental consideration is Earth's heat flow, which is not explicitly represented in our model. Earth's surface heat flow varies predominantly between 40 and 85 mW m−2 (Pollack and Chapman, 1977) with an average of ∼ 55 mW m−2. The heat flow from the Moho beneath the continents is fairly fixed at around 25 mW m−2 (Čermák et al., 1989) with the discrepancy made up from radiogenic heat production from elements within the crust. There is less radiogenic heat production in the oceanic crust itself (Smith, 1973); thus its heat flow shows much less variation and has an average of 100 mW m−2 (Sclater and Francheteau, 1970; Davies, 1999). The crustal heat flow and the thermal conductivity of crustal materials together determine the subsurface geotherm, through the relation
where
The extreme environments of Earth are given in Table 2. All known environments in the crust, oceans, and surface lie within the P-T polygon and within the range of the error bars on the average geotherm. The mean continental crustal geotherm shown, averaged over 35 km of crust, is 15 K km−1. The brown shaded region accommodates much steeper geotherms (up to ∼80 K km−1) and so is consistent with the range of true geothermal gradients on Earth.
A.2. Core
Earth's core extends from a depth of 2890 to 6378 km. At the center, the pressure is modeled as 3.6 × 10⁶ bar (Dziewonski and Anderson, 1981; Davies, 1999). As the core density is not well constrained from seismic models, there is a range of estimates for the central core pressure between 2.8 × 10⁶ and 3.8 × 10⁶ bar (Fowler, 1990; Lodders and Fegley, 1998). Similarly, we have chosen a representative pressure value for the core-mantle boundary (CMB) of 1.4 × 10⁶ bar (Davies, 1999) within the range of 0.6–3.2 × 10⁶ bar (Fowler, 1990; Lodders and Fegley, 1998; Davies, 1999). The pressure value for the CMB is not essential for our model, as the transition from core to mantle occurs within a layer ∼40 km thick (Doornbos, 1983; Williams and Garnero, 1996). At its central depth, the core temperature is taken in our model to be 5700 K (Fowler, 1990). Temperature models for the core are dependent on core composition, and estimates for the central temperature range widely from 3800 to 6800 K (Jeanloz, 1990; Davies, 1999). Similarly, with the CMB we have chosen a representative temperature of 2700 K (Davies, 1999) within the range of estimates 1700–4500 K (Jeanloz, 1990; Decker and Decker, 1992; Stein and Wysession, 2003). As stated above, the CMB is thought to be a ∼40 km thermal boundary layer, with an estimated radial temperature increase of 800 K (Stacey and Loper, 1984) across it. Melting temperatures for the assumed core composition are pressure dependent (Andersen et al., 2002); however, our chosen boundary values and geotherm of 0.85 K km−1 leads to a liquid outer region of the core and a solid inner region (from the solidus of Jeanloz, 1990). This is consistent with recent models (Stein and Wysession, 2003). The central core may be liquid if its temperature exceeds 5120 K (Nakagawa and Tackley, 2004).
The range of estimates of pressure and temperature conditions in the inner core are represented through vertical and horizontal error bars that encompass the range of estimates in the literature. The same holds for estimates of conditions across the core-to-mantle transition.
A.3. Mantle
Earth's mantle extends from a depth of 2890 km at the core-mantle boundary to a range of 4–80 km beneath oceanic and continental crust. Our chosen average of the Mohorovičić discontinuity (Mohorovičić, 1909) is 3.3 × 10³ bar and 800 K, which is consistent with the average continental crustal depth of 35 km (Lodders and Fegley, 1998). The variation in the Moho will be discussed in more detail below. Our CMB values lead to a modeled mantle geotherm of 0.66 K km−1. This temperature profile lies below the assumed mantle solidus (Zerr, 1998; Nakagawa and Tackley, 2004), resulting in the expected solid mantle (Stein and Wysession, 2003). For example, the solidus temperature at the CMB pressure is estimated as 4300 K (Nakagawa and Tackley, 2004).
B. Appendix B: Explanatory Details for Tables 3 and 4
Life has been found throughout Earth's atmosphere, to an altitude of 77 km above the surface (Imshenetsky et al., 1978). These organisms can be classified into two types—spore or spore-forming bacteria (e.g., Bacillus simplex; Wainwright et al., 2002) and bacteria that do not form spores (e.g., Micrococcus; Griffin, 2008). This classification is made here, as it allows for a distinction to be made between active and potentially dormant life in the atmosphere. Spore structures allow bacteria to survive for extended periods of time in unfavorable conditions. This means that spores collected from the atmosphere can be dormant and yet viable, so they may be able to be cultivated in the laboratory. It is unclear, however, whether such spores were actively metabolizing, be it at a very slow rate, in atmospheric conditions (personal correspondence, Dr. Yogesh Shouche, April 3, 2009). Non-spore-forming bacteria that are retrieved from the atmosphere, however, are thought to have been active in that environment if they are able to be grown in the laboratory. Using this distinction, some have concluded that active life has been isolated from an altitude of 20 km in Earth's atmosphere (Griffin, 2008) at an ambient pressure and temperature of 0.055 bar and −56°C, respectively. This appears to extend the lower temperature limit of life; however, the result should be viewed with caution, as no measurements of metabolism were made. Other species of non-spore-forming bacteria have been isolated from the atmosphere at higher altitudes and warmer temperatures (between 20 and 70 km altitude) but have been found to be viable yet nonculturable (Wainwright et al., 2004), and are examples of dormant life. The current upper boundary of the biosphere (most likely at the tropopause at ∼10 km altitude, which is a boundary to the vertical movement of particles; Wainwright et al., 2006) lies at 77 m (ambient pressure and temperature of ∼10−5 bar, −70°C respectively) where spores (e.g., Circinella muscae) were isolated (Imshenetsky et al., 1978) and were most likely dormant at in situ conditions. Examples of the potentially lowest temperature, active life, and the highest altitude (dormant) life are included in our life regime in Fig. 4.
A serious limitation on atmospheric life's capacity to remain active may be the transient nature of low-pressure liquid-water environments. The presence of life in clouds is strongly linked to the availability of liquid water. Studies of low-altitude atmospheric life (samples from <4 km above sea level, Sattler et al., 2001; Bauer et al., 2002; Amato et al., 2005, 2007) have found that the majority of microbes in the clouds are dormant, but viable and remain alive by utilizing cloud water. This suggests that surface life can persist at altitudes up to the triple point of ocean salinity water at ∼25 km altitude (Fig. 3); however, this life will be largely, or entirely, dormant. Samples isolated at higher altitudes (e.g., ∼41 km, Wainwright et al., 2002) have a much lower percentage of viable microorganisms, which may be due to the additional stress of almost no cloud water. Cloud water could persist to higher altitudes (lower atmospheric pressures) if it is briny; however, models of liquid-water clouds indicate that water content reaches a minimum at <20 km altitude (Fig. 7 of
Footnotes
Acknowledgments
We thank Jonathan Clarke, Chris McKay, Geoff Davies, and Andreea Papuc for useful discussions. Eriita Jones acknowledges funding from an Australian Postgraduate Award and the Research School of Astronomy and Astrophysics (ANU).
Author Disclosure Statement
No competing financial interests exist for either Eriita G. Jones or Charles H. Lineweaver.
Abbreviations
CMB, core-mantle boundary; P-T, pressure-temperature.