
Abstract
While average temperatures on Mars may be too low to support terrestrial life-forms or aqueous liquids, diurnal peak temperatures over most of the planet can be high enough to provide for both, down to a few centimeters beneath the surface for some fraction of the time. A thermal model was applied to the Viking 1, Viking 2, Pathfinder, Spirit, and Opportunity landing sites to demonstrate the dynamic temperature fields under the surface at these well-characterized locations. A benchmark temperature of 253 K was used as a lower limit for possible metabolic activity, which corresponds to the minimum found for specific terrestrial microorganisms. Aqueous solutions of salts known to exist on Mars can provide liquid solutions well below this temperature. Thermal modeling has shown that 253 K is reached beneath the surface at diurnal peak heating for at least some parts of the year at each of these landing sites. Within 40° of the equator, 253 K beneath the surface should occur for at least some fraction of the year; and, within 20°, it will be seen for most of the year. However, any life-form that requires this temperature to thrive must also endure daily excursions to far colder temperatures as well as periods of the year where 253 K is never reached at all. Key Words: Mars—Temperature—Lander—Liquid—Brine. Astrobiology 10, 643–650.
1. Introduction
M
Pure water will be solid below 273.16 K; but, as shown in Table 1, concentrated ionic solutions can form thermodynamically stable liquids at much lower temperatures (Brass, 1980; Kargel, 1991), as low as 205–206 K for certain salts (Chevrier and Altheide, 2008; Chevrier et al., 2009). A second condition for liquid stability is related to its evaporation rate into the dry martian atmosphere (Ingersoll, 1970; Sears and Moore, 2005; Moore and Sears, 2006). Concentrated salt solutions exhibit much lower evaporation rates than pure liquid water, especially at low temperatures (Sears and Chittenden, 2005; Chevrier and Altheide, 2008; Altheide et al., 2009), which results in longer possible residence times due to mass transfer limitations at or near the martian surface. The two Mars rovers and Mars Express OMEGA detected considerable amounts of evaporitic deposits stemming from iron and sulfur, so highly concentrated solutions appear to have existed in the past (Squyres et al., 2004; Gendrin et al., 2005; Nelson et al., 2005; Rao et al., 2005). Therefore, if stable aqueous liquids are present on Mars today, they are probably concentrated brine solutions and could exist at temperatures supportive of life.
The planet-wide average temperature of Mars is about 220 K, which is too low to support the life-forms or liquid solutions described above. However, the dynamic nature of the near-surface temperatures enables the existence of aqueous solutions at certain times and depths over a large fraction of the planet. The purpose of this paper is to evaluate the surface and subsurface temperature fields at the Viking 1, Viking 2, Mars Pathfinder, Spirit, and Opportunity landing sites with regard to the conditions conducive for terrestrial life. Certain temperatures were used as benchmarks, such as 253 K, described above as a demonstrated low-temperature condition for metabolic activity in terrestrial methanogens; 273 K for pure water; and the eutectic temperatures of salt solutions from Table 1. We are not making the claim that 253 K is a lower limit for metabolic activity on Mars; we are using this benchmark because metabolic activity has been demonstrated at least down to this temperature by terrestrial organisms. These locations on Mars were chosen because their thermal and physical properties were carefully measured during landing site selection and the vicinity of any lander is of interest with regard to the possibility of biological contamination. The Mars Pathfinder (MPF) site was considered in more detail than the others as a means to validate our thermal model.
2. Modeling Surface and Subsurface Martian Temperatures
A finite-difference procedure was used to predict regolith temperature profiles from the surface down into the martian subsurface as a function of time, latitude, thermal inertia, surface albedo, surface emissivity, distance of Mars from the Sun, and atmospheric opacity. Effects considered include direct solar radiation to the surface (Rapp, 2004), radiation up from the ground with use of an emissivity of 0.97 (Bandfield 2002), conduction through the near-surface region, and 30 mW/m2 of geothermal energy from below (Schorghofer and Aharonson, 2005; Urquhart, 2005). The atmospheric opacity was set at τ = 0.5, a commonly used year-round average (Appelbaum et al., 1997; Smith et al., 1997; Smith et al., 2006). Radiation from the atmosphere to the surface was calculated with the method of Kieffer et al. (1977) and Schorghofer and Edgett (2006) that involved setting this radiative flux to a set percentage of the noontime solar heating and keeping it constant throughout the sol. They recommend 2–4%, and we used 2%. Table 2 shows the input data for the landing sites used in this study, which were taken from some of the latest available sources. In addition, the model requires the product of regolith heat capacity and density. Heat capacities of basalts range from about 600–1000 J/kg K, so a value of 800 was taken. Bulk density was taken to be 2000 kg/m3, which takes into account the blocky nature of the landing sites.
Temperatures at and below the surface of Mars are driven almost totally by radiation from the Sun, radiation of the ground to the sky, a small amount of radiation from the sky during both day and night, and conduction into and out of the subsurface. Conduction and convection from the atmosphere, either free or forced, contributes relatively little to surface and subsurface temperatures (Haberle and Jakosky, 1990). Omitting these effects can be justified on the bases of available heat and the rate of heat transfer. There is a large difference in thermal mass between the dense regolith and the tenuous atmosphere. The column mass of the martian atmosphere is 173 kg/m2 (compared to 10,300 kg/m2 for Earth) and is equal to the mass of only about 9 cm of martian regolith. Since the heat capacity of carbon dioxide at 200 K is 735 J/kg K, which is roughly the same as ∼ 800 J/kg K for basaltic materials, the thermal mass of less than 10 cm of martian regolith is equal to the thermal mass of the 11 km scale height for the atmosphere. Considering that the scale height would be the total depth of the atmosphere if it had the surface pressure and temperature throughout, only a small portion of the total atmospheric column is in thermal communication with the ground over the course of a sol.
Besides checks for internal consistency, the model was compared to published results, such as the established models used by Putzig and Mellon (2007), Kieffer (1976), and Martin et al. (2003), and found to agree within about 5–10 K over a wide range of conditions.
3. Validation of the Model to Temperature Data at the MPF Site
We compared the model's predictions of surface temperatures to surface and near-surface atmospheric temperatures measured at the MPF site. Mars Pathfinder landed on July 4, 1997, at 19.3°N, 326.5°E and Ls = 142.7°. It did not measure surface temperatures but transmitted back atmospheric temperatures taken by three sensors on its meteorological mast located 0.25, 0.50, and 1.0 m above the ground at various sampling rates for 76 sols (11% of the year) until the end of its mission on September 27, 1997. Few sols had complete coverage, but when all 76 sols are stacked together they provide a set of temperature profiles just above the surface at high temporal resolution, as shown by the points in Fig. 1. The sunrise and sunset times indicated correspond to the midpoint of this 76 sol period: Ls = 162°. As expected, the sensors closer to the ground reported slightly higher temperatures during the daytime and lower temperatures at night with the near-surface atmospheric temperature inverting immediately after sunrise and sunset.
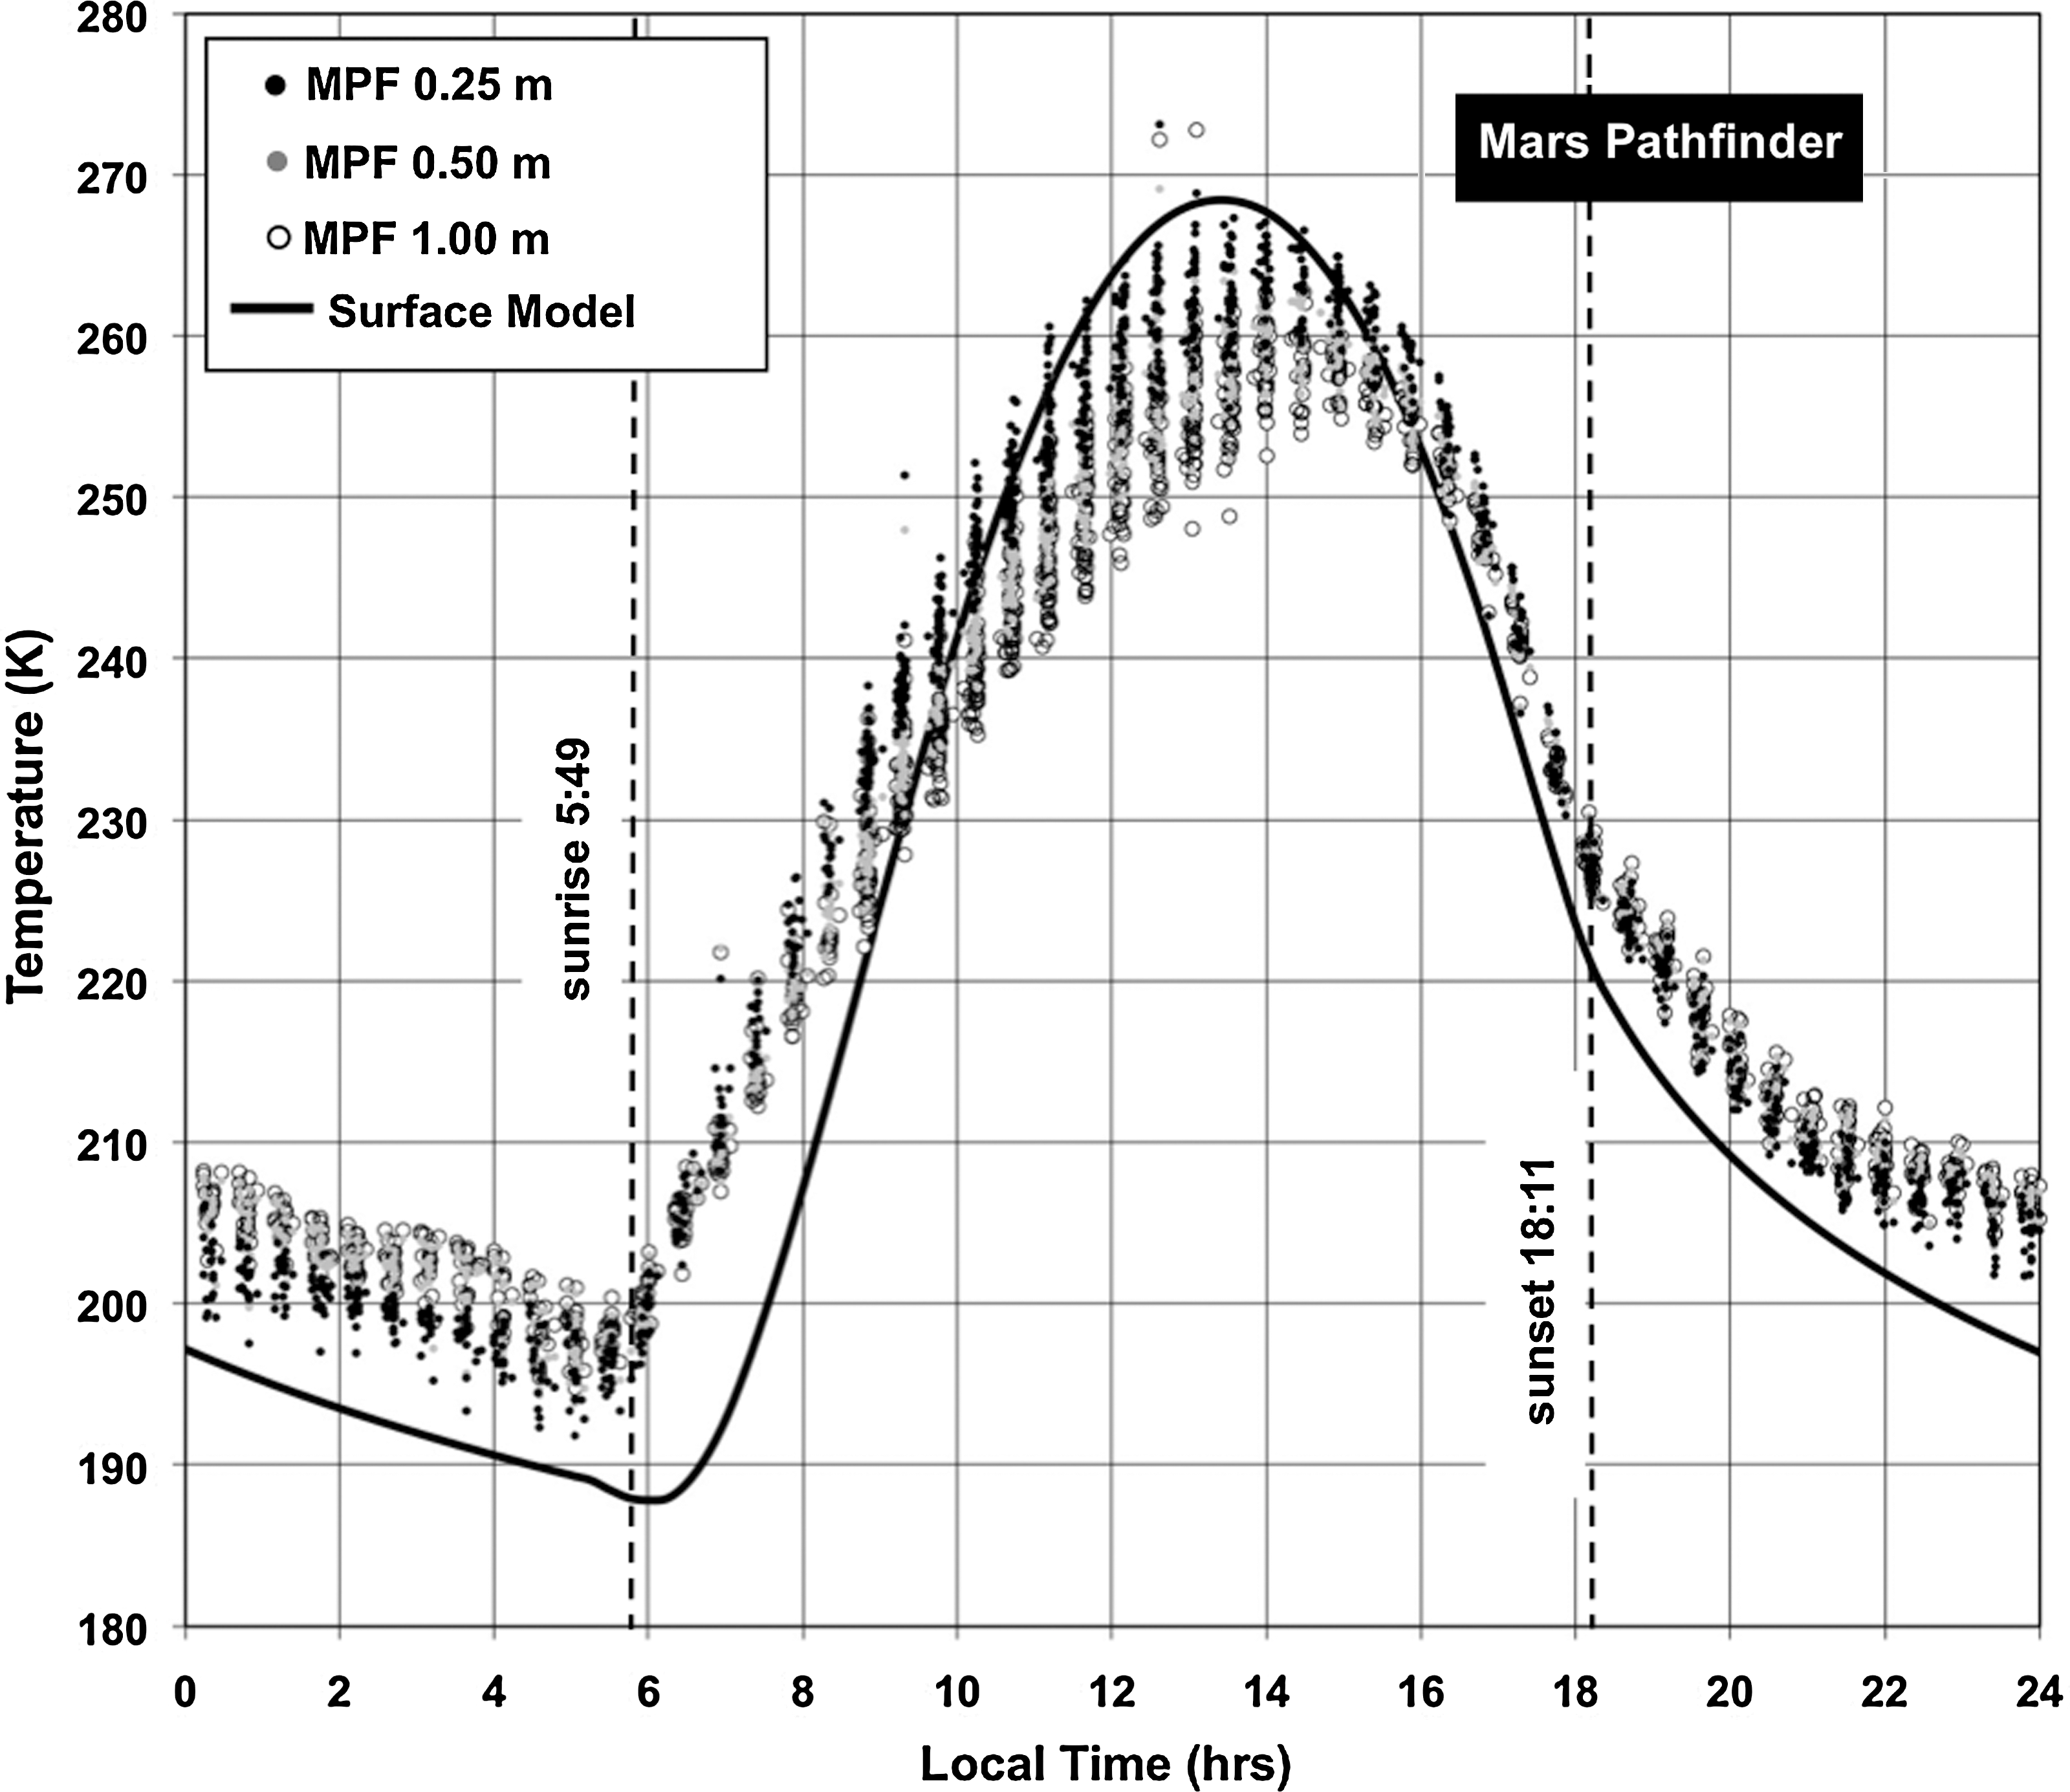
Comparison of MPF near-surface atmospheric temperature data (black from 0.25 m elevation on the meteorological mast, gray from 0.5 m, open circles from 1.0 m) and our finite-difference surface temperature model (solid line) for a sol in the middle of MPF's mission, at Ls = 162°.
The model agrees well with these measured temperatures. The slightly larger temperature amplitude is because the model predicts surface temperatures and the thermocouples measured atmospheric temperatures close to the surface. The only simultaneous measurements of surface and near-surface atmospheric temperatures made on Mars came from the two Mars Exploration Rovers (Urquhart, 2005), which used their Mini-Thermal Emission Spectrometers to make readings of the surface and of the atmosphere about 1.1 m above the surface. Opportunity data taken at Ls = 339° indicates that the maximum difference occurred at 13:00 with the surface being about 30 K warmer. For Spirit, the maximum was about 20 K. In both cases, surface temperatures also dropped below atmospheric temperatures at night. These temperature differences are close to those we predict for the MPF site.
4. Surface Temperatures at the Landing Sites
Figure 2 shows the maximum and minimum daily temperatures at the surface for the landing sites. The dotted line between them is the temperature at 1 m, which does not change significantly during one sol but changes with the seasonal cycle. The subfigures are sorted by latitude from most northerly to most southerly landing sites. The Spirit and Opportunity sites are the warmest of the five. Temperatures in excess of 273 K are reached at the surface for about half the year at both locations. Opportunity is at 1.94°S, which is considerably closer to the equator than Spirit at 14.6°S and results in less annual variation in the temperature field. Viking 1 and MPF are similar since they are separated by only 835 km and 3.4° of latitude. At the surface at Viking 2 (48.3°N), 253 K is barely reached and then for only a few sols.

Predicted maximum and minimum surface temperatures (black lines) and the temperature at 1 m deep (dotted line) at the MPF landing site from our model. Black dots are calculated surface temperatures from the NASA Planetary Data System (PDS), and open circles are the measured MPF 0.25 m elevation atmospheric temperatures.
Since the orbit's eccentricity is significant and almost exactly out of phase with the northern seasons, this acts to decrease the annual temperature variations north of the equator measurably and reinforce the seasons in the southern hemisphere. In the northern hemisphere, temperature variations will remain closer to their average, while at a similar latitude in the south the average is about the same, though the temperature swings more widely about this value. This is made clear by comparing the panels in Fig. 2 for MPF (19.3°N) and Spirit (14.6°S), which are at similar latitudes in different hemispheres. Yearly amplitudes are larger for Spirit because of the in-phase relationship of solar flux and axial tilt.
5. Subsurface Temperature Fields at the Landing Sites
The thermal model was used to estimate the surface and subsurface temperatures at the MPF site for Ls = 162°. The model results, shown in Fig. 3, indicate that the surface temperature reaches its minimum just before sunrise followed by a rise of about 80 K to a maximum of 268 K shortly after noon. Subsurface diurnal temperature swings dampen out rapidly with depth and become almost negligible at a few tenths of a meter.
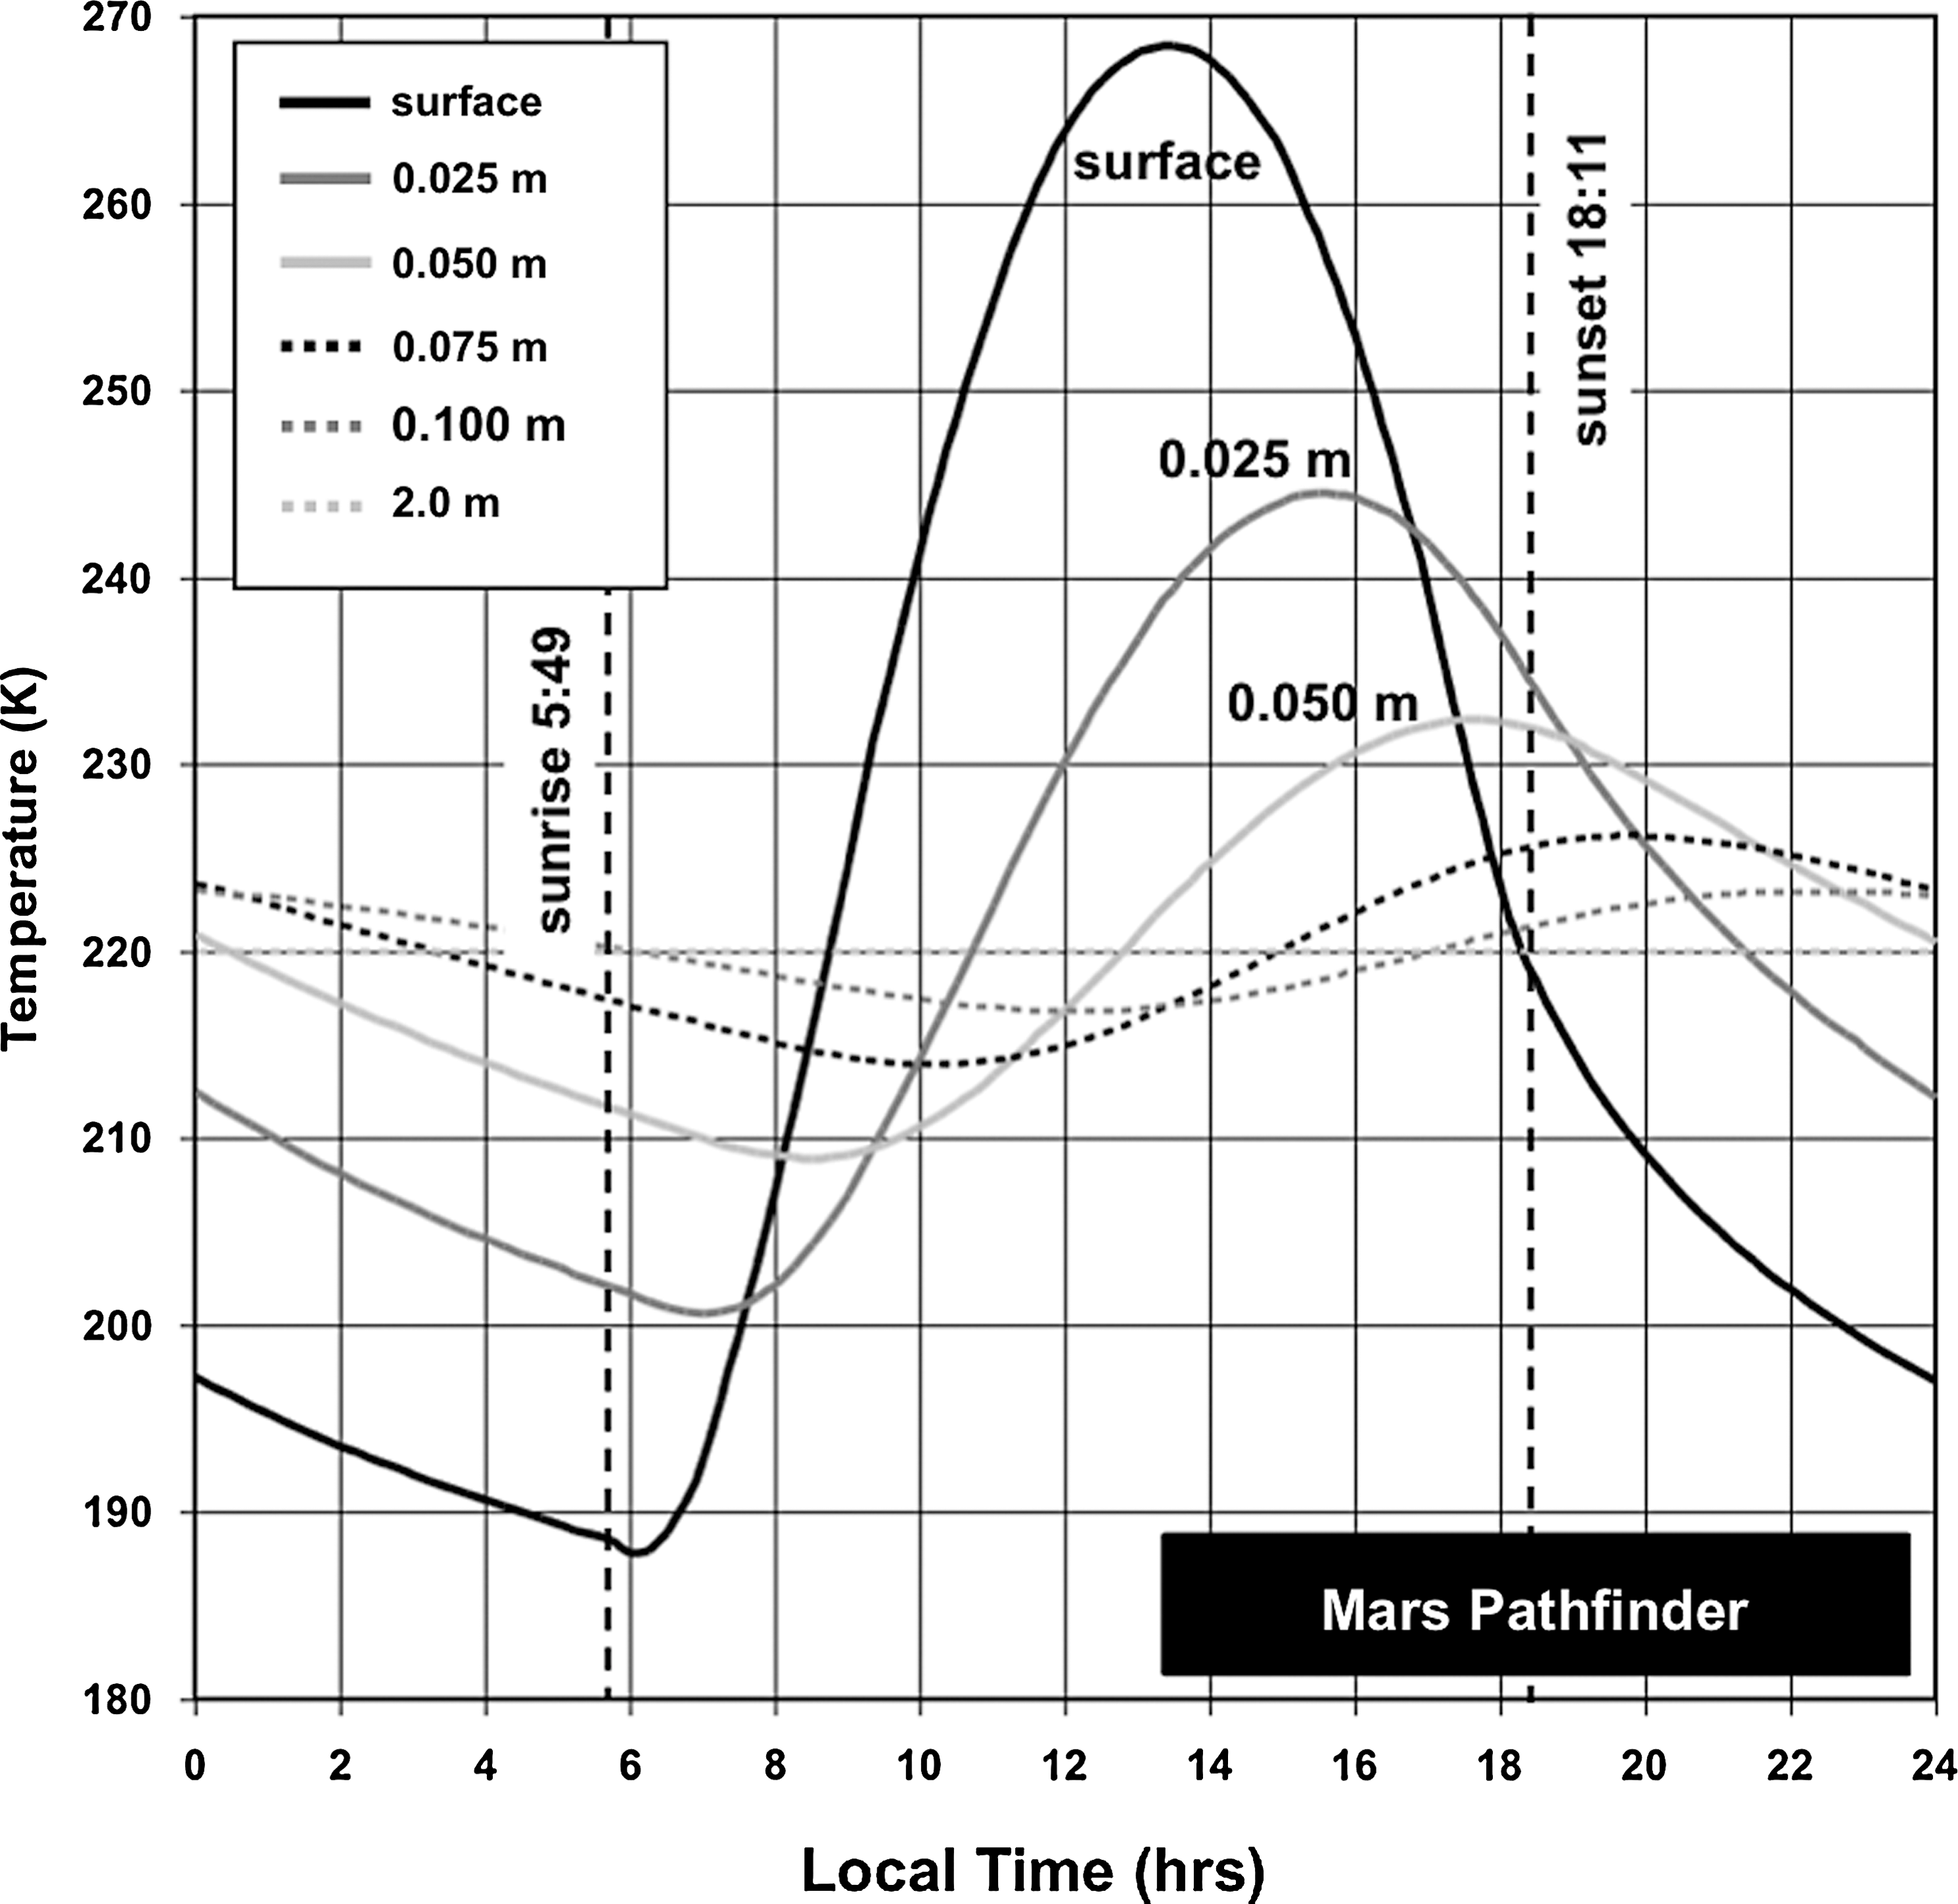
Surface and subsurface temperatures at the MPF landing site for a typical sol at Ls = 162°, calculated from the model. The decreasing temperature signal amplitude and the increasing time delay with depth are illustrated.
We calculated the maximum daily temperatures at various depths as a function of time of year, as shown in Fig. 4 for all five sites. With regard to the panel for MPF, the daily temperature, at the time of landing at Ls = 143° and at a depth of 0.5 cm, would have reached as high as 260 K at some time during the sol. A temperature of 253 K would have penetrated as deep as 1.2 cm at that time and is present at some depth and at some time of sol for about three-quarters of the year. Since the depths shown in Fig. 4 are those of the highest daily temperatures, the warmest times of year are at the troughs of these lines, where high temperatures penetrate the deepest, and the coldest are at the peaks. Temperatures below the lowest line of each panel were not calculated; thus there are blank areas for Viking 2. Temperatures in these depths and times are below 200 K, which is too cold for almost any liquid solutions or life as we know it.

Depth to maximum diurnal temperatures for the five Mars landing sites. For example, at the Viking 1 site and Ls = 180, 270 K reaches a maximum of about 0.2 cm beneath the surface at some part of the sol, 260 K reaches 0.7 cm deep, and 253 K reaches 1.2 cm deep.
Four of the five landing sites see daily subsurface temperatures in excess of 253 K for most, or nearly all, of the year. This temperature may occur briefly as deep as a couple of centimeters. However, 253 K is not maintained on, or under, the surface for a complete 24-martian-hour sol at any location on the planet. Daily surface temperatures near the equator can oscillate over 100 K around an average value. These temperature cycles also occur with some time delay under the surface but with decreasing amplitude with depth that approaches the steady average for that time of year by a few tens of centimeters down. Any subsurface location exhibiting above-average daytime temperatures will plunge to correspondingly cold temperatures on the other side of average at night.
Figure 5 shows a situation contrary to that shown in the previous figure: the depth to minimum diurnal temperatures at the Opportunity site. The diurnal cycle at the warmest time of year (Ls = 200°) on the surface is 290–180 K for a 110 K range around an average of 235 K. At this same season, 253 K will reach 1.7 cm depth at peak heating during the day; but, 12 hours later, that same depth will be at 195 K for a diurnal cycle of 58 K around roughly the same average.

Minimum diurnal temperatures at various depths throughout the year for the Opportunity landing site.
Geothermal heating from within the planet creates a temperature gradient that will result in warmer temperatures appearing again, but much deeper underground (Mellon and Phillips, 2001). This gradient is
where dT/dz is the temperature gradient in K/m, q is the geothermal heat flux in W/m2, and k is the thermal conductivity of the subsurface in W/m K.
The geothermal heat flux on Mars is highly uncertain but has been estimated to be between 0.017 and 0.024 W/m2 by extrapolating the somewhat better understood terrestrial geothermal mechanisms to Mars with the use of various weighted averages of planetary mass, density, and surface areas (Solomon and Head, 1990; Hoffman, 2001). Some investigators have used values as high as 0.030 W/m2 (Schorghofer and Aharonson, 2005; Urquhart, 2005). Combining this range with matching extremes for thermal conductivity of 0.3 W/m K for loose sand and 2 W/m K for solid basaltic rock gives a thermal gradient of 0.030/0.3 = 0.100 and 0.017/2 = 0.009 K/m, respectively. These small gradients are not enough to influence the temperature field within a few meters of the surface; and, although the geothermal flux is included in our model, omitting it has no distinguishable effect on the results shown in the figures above. Deep underground, however, the temperatures will be dominated by this heating from below with no diurnal or annual heating effects present. Starting from an average surface temperature of 220 K, these two gradients would cause 253 K to be reached between 330 and 3700 m. The deeper end of this range is probably more realistic, considering the bedrock structure expected on Mars. If life exists in this environment, it will be a very long time before such deep locales could be sampled.
6. Implications for Life in the Martian Subsurface
Requirements for subsurface life on Mars include temperatures sufficient to support metabolism and the presence of aqueous liquids for nutrient transport. Metabolic activity in permafrost bacteria has been demonstrated down to 253 K (Rivkina et al., 2000), and studies in our laboratory show that aqueous solutions containing salts known to exist on Mars can remain liquid at this, and much lower, temperatures, down to 205 K (Chevrier and Altheide, 2008). Thermal modeling of the subsurface environment on Mars has indicated that 253 K is reached at diurnal peak heating for at least some parts of the year at five of the six landing sites. Within 40° of the equator, a temperature of 253 K beneath the surface will occur for at least some fraction of the year; and, within 20°, it will persist for most of the year. These peak temperatures will penetrate down to 2–3 cm at most, which is within the range of simple robotic scoops and deep enough to shield the organisms from UV radiation. However, any life-form that requires this temperature to thrive must also endure nightly excursions to far colder temperatures and, away from the equator, periods of the year where 253 K is never reached at all.
Footnotes
Abbreviation
MPF, Mars Pathfinder.